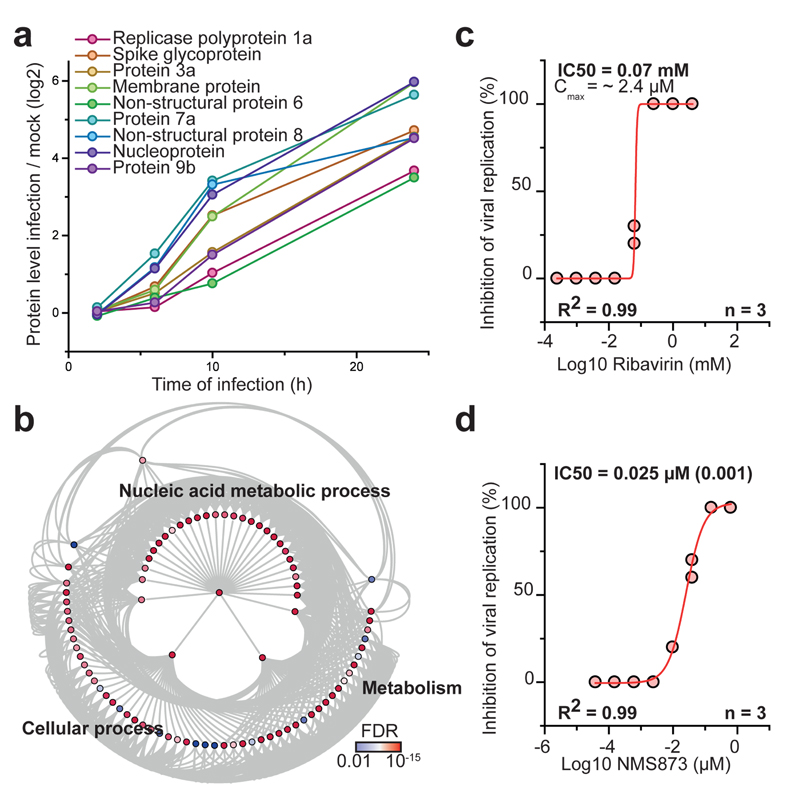
Fig. 4. Inhibition of host cell pathways induced upon infection prevent SARS-CoV-2 replication.
a, Protein levels of all detected viral proteins are plotted with their log2 changes to corresponding control for different infection times. Mean fold changes are plotted (n = 3). b, Gene ontology network analysis of host proteins correlating with viral protein expression (FDR < 0.01). Proteins were clustered for biological process GO term and plotted as network with FDR colour coding. Annotated pathways represent parent pathways in the network. c, d, Antiviral assay showing inhibition of viral replication in dependency of Ribavirin (c, n = 3) and NMS873 (d, n = 3) concentration. Each data point indicates a biological replicate and red line indicates dose response curve fit. R2 and IC50 values were computed from the curve fit and s.d. of IC50 is indicated in brackets. All n numbers represent independent biological samples.

