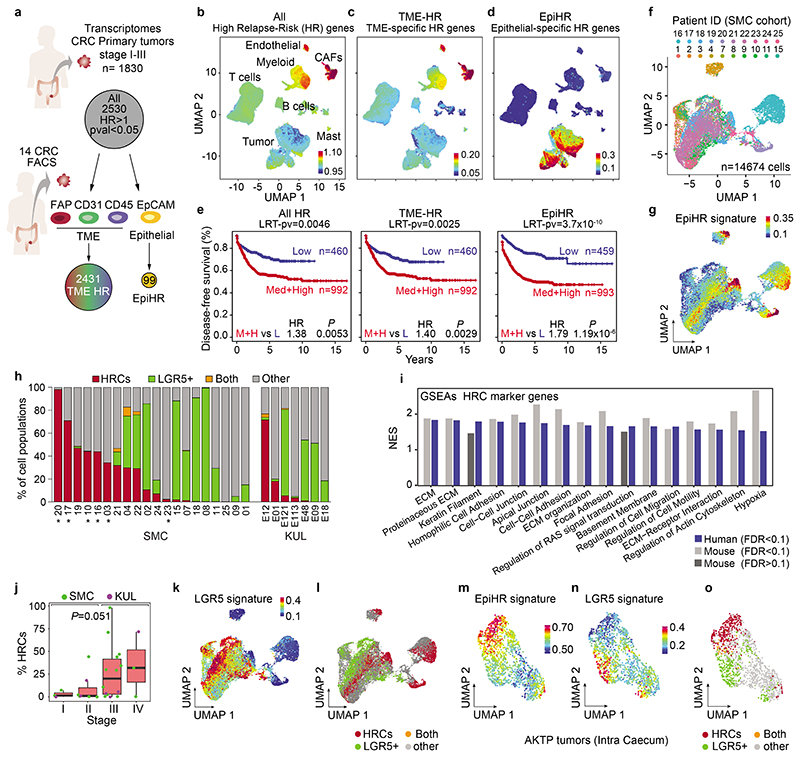
Fig. 1 |. Identification of poor prognosis epithelial CRC cells.
a, Identification of TME-HR and EpiHR signatures in a metacohort of 7 pooled human stage I-III CRC datasets (n= 1830 patients, Supplementary Table 1). b-d, UMAP layout of whole tumors (stroma + epithelium cells) belonging to the SMC dataset, colored by AllHR (b), TME-HR (c) and epithelial-specific HR genes (d). e, Kaplan-Meier survival curves indicating relapse-free survival. Two-sided Wald test. Likelihood Ratio Test p-values (LRT-pv) are specified. f,g, UMAP layout of 14674 CRC tumor cells (SMC cohort) colored by patient ID (f) and expression of the EpiHR signature (g). h, Barplot quantifying the sub-population composition of each patient in the SMC (left) and KUL (right) datasets. Patient ID is detailed. Patients with low WNT signature scores are marked with an “*”. i, Selected Hallmarks, GOSLIM and KEGG gene signatures enriched in HRCs compared to the rest of tumor cells in human and mouse CRC samples. j, Boxplot representing the proportion of HRCs in each clinical stage. Box plots have whiskers of maximum 1.5 times the interquartile range. Boxes represent first, second (median) and third quartiles. n= 3, 7, 14, 3, patients from left to right. Two-sided Kruskal-Wallis test. k, UMAP of tumor cells colored by expression of the LGR5 signature. l, UMAP of tumor cells labelled according to their classification as HRCs, LGR5+, double positive or other cells. m-o, Primary tumors were generated in the caecum of c57BL/6J mice by injecting syngeneic AKTP MTOs. UMAPs depicting GFP+ tumor cells dissociated from primary tumors colored by expression levels of (m) EpiHR signature, (n) Lgr5 signature and (o) their classification as HRCs, Lgr5+, double positive or other cells.

