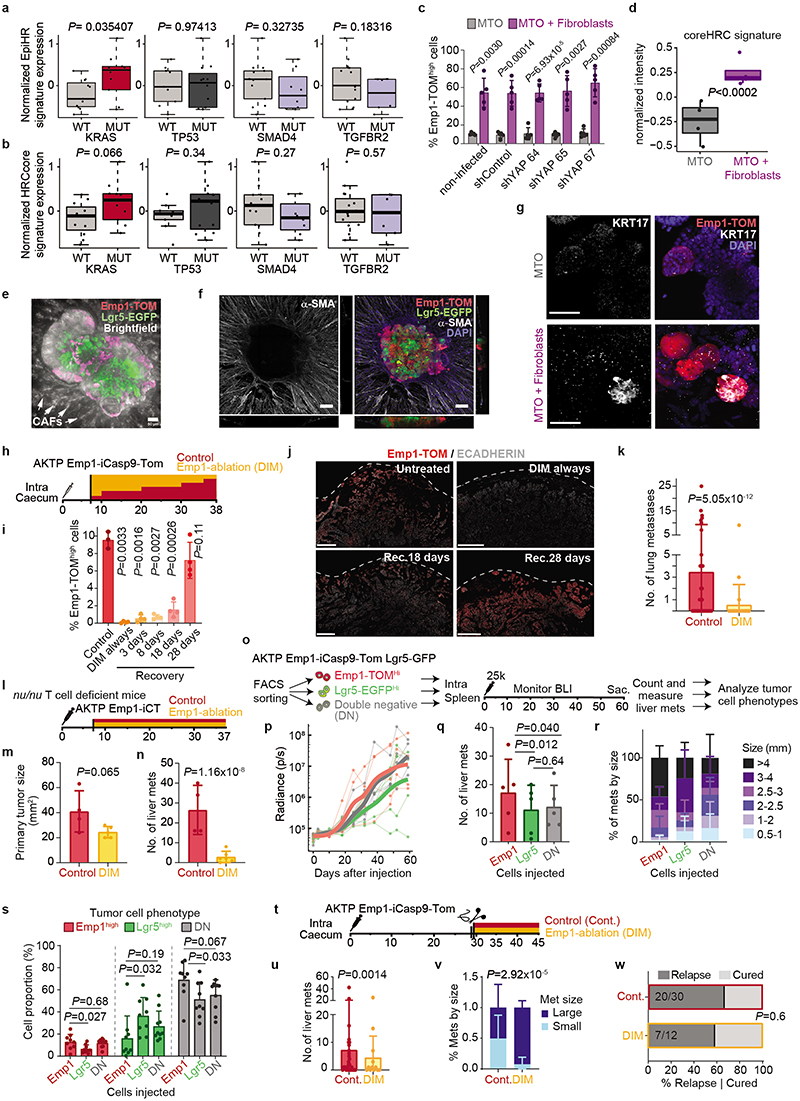
Extended Data Fig. 10 |. KRAS mutations and CAFs specify the HRC population.
a-b, Normalized intensity of EpiHR and coreHRC signature expression in CTOs grouped by gain of function mutation in Kras g12d and loss of function mutations in p53, Smad4 and Tgfbr2. Box plots have whiskers of maximum and minimum values; boxes represent first, second (median) and third quartiles. n= 6 (WT) 5 (MUT) CTOs; 2 technical replicates. P-values for two-sided T-tests. c, Percentage of Emp1high tumor cells (defined as the top 10% of the TOM population in control MTOs, mean ± SD) in parental (non-infected), control shRNA or shRNAs targeting YAP1. n=5 biological replicates. P-value for two-sided t-test. d, Normalized intensity of the coreHRC signature expression in control MTOs versus MTOs co-cultured with colon fibroblasts. Box plots have whiskers of maximum 1.5 times the interquartile range; boxes represent first, second (median) and third quartiles. n= 4 biological replicates. ROAST-GSA adjusted p-value is shown. e, Representative images of MTOs Emp1-iCT Lgr5-EGFP co-cultured with colon fibroblasts. Maximum intensity projection of confocal stacks, step 4 μm, z stack 120 μm. Scale bar, 50 μm. f, Immunostaining of α-SMA Emp1-iCT Lgr5-EGFP MTOs co-cultured with colon fibroblasts for 2 days. Scale bars, 100 μm. g, Immunostaining of KRT17 in 4-days grown MTO Emp1-iCT organoids: fibroblast co-cultures and organoids alone control cultures. Scale bars, 50 μm. h, Ablation by dimerizer (DIM) treatment and surgery schedule of mice with AKTP Emp1-iCT primary tumors to assess the recovery of HRCs upon treatment cessation. i, Percentage (mean ± SD) of Emp1-TOMhigh cells (defined as top 10% in control animals) in untreated mice versus mice treated with DIM, with treatment discontinued at various timepoints post-injection. Two-sided T-test. n= 3 (control) 4 (rest) mice. j, Representative immunostainings showing effective Emp1-TOMhigh cell ablation in DIM-treated primary tumors and recovery upon treatment cessation. Dashed lines delimitate the caecum edge. Scale bars, 250 μm. k, Lung metastases (mean ± SD) generated by MTO Emp1-iCT up to one month after primary tumor resection, treated with vehicle or DIM as in Fig. 4a. Each dot is a mouse; n= 34 (control) 29 (DIM). P-value for generalized linear model with negative binomial family. l, Inducible ablation schedule of nude mice (nu/nu) implanted with AKTP Emp1-iCT primary tumors. Resection was not possible due to local spreading of tumors to neighboring tissue. m, Primary tumor area (mean ± SD) measured at sacrifice. Each dot is a mouse; n= 4 (control), 5 (DIM) mice. P-value for linear model. n, Liver metastases (mean ± SD) generated by MTO Emp1-iCT. Each dot is a mouse; n= 4 (control), 6 (DIM) mice. P-value for generalized linear model. o, Schematics of an experiment to analyze the potential of Emp1+, Lgr5+ or double negative (DN) cells to colonize the liver and generate metastases. 25,000 FACS-sorted Emp1-TOM-high, Lgr5-EGFP-high or double negative cells were injected intrasplenically. p, Metastatic growth measured by BLI. q, Liver metastases (mean ± SD) generated by Emp1-high, Lgr5-high or double negative cells. Each dot is a mouse; n= 5 mice. P-value for generalized linear model. r, Distribution of liver metastasis diameters (mean ± SD). n=5 mice per condition. s, Percentage (mean ± SD) of Emp1-TOMhigh, Lgr5-EGFPhigh and double negative tumor cells in metastases generated by the injection of Emp1-TOMhigh, Lgr5-EGFPhigh and double negative cells, n= 9 (Emp1 and Lgr5) and 10 (DN) mice. Two-sided t-test. t, Experimental setup showing inducible HRC ablation after surgery of primary AKPT CRCs. u, Liver metastases (mean ± SD) generated by MTO Emp1-iCT in mice treated with vehicle or DIM 1 day after primary tumor resection and until experimental endpoints. Each dot is a mouse; n=30 (control) 12 (DIM) mice P-value for generalized linear model. v, Percentage (mean ± SD) of small (diameter equal or smaller than 1 mm2) and big metastases (bigger than 1 mm2) in mice treated with vehicle or DIM 1 day after primary tumor resection and until experimental endpoints. Mixed effects linear model after boxcox transformation with mouse as random effect, n= 20 (control) and 7 (DIM) mice. w, Percentage of mice that developed liver metastases in control and Emp1-ablated mice. Analyzed with a generalized linear model.

