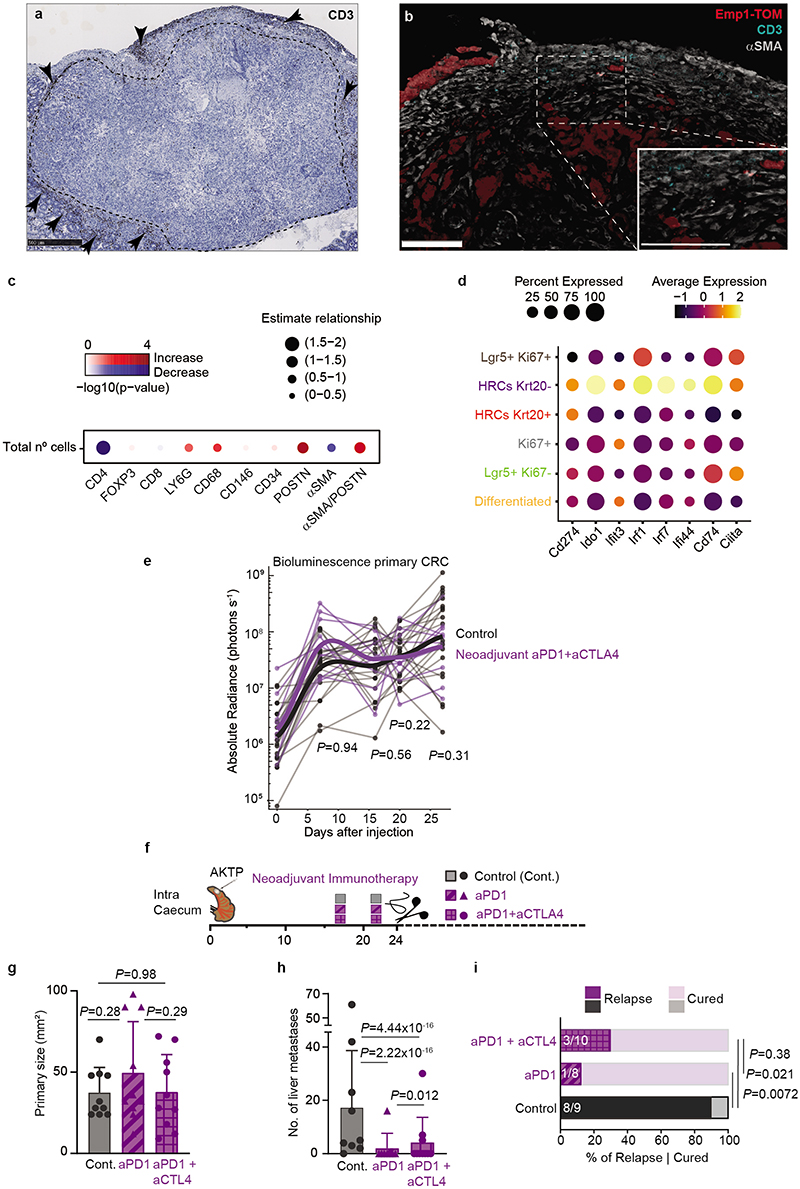
Extended Data Fig. 12 |. Immune checkpoint immunotherapies prevent metastatic relapse.
a, Representative image of CD3+ cell distribution in primary AKTP CRC showing T cell exclusion. Arrows point to T cells located at the tumor periphery. b, Representative immunostaining of Emp1-TOM, CD3 and α-SMA in primary tumors. Scale bars, 100 μm. c, Dotplot summarizing regression models applied to multiplex immunofluorescence data. Effects of the total number of cells on the composition of every cell population are represented by different point sizes (defining the magnitude of the effect) and colors (showing both the sign of the effect in blue(-)/red(+) and the statistical significance by color intensity). d, Dotplot showing examples of interferon response genes across 6 tumor scRNAseq cell clusters as defined in Fig. 2g. e, Bioluminescence monitoring of the effect of the neoadjuvant immunotherapy regime used in Fig. 5k on primary tumor growth. Points and lines represent individual mice, trend lines (bold) show a LOESS model. n= 19 (control) 10 (PD1+CTLA4) mice. Mixed effects linear model with data normalized to time 0 and mouse as random effect. f, Schematics of an experiment comparing metastatic relapse in untreated mice and mice treated with neoadjuvant treatment with anti-PD1 monotherapy or anti-PD1+/anti-CTLA4 combined therapy. g, Primary tumor area (mean ± SD) measured after resection in the experiment described in f. Each dot is an individual mice. n= 10 mice each group. Linear model. h, Liver metastases (mean ± SD) generated by AKTP primary tumors up to one month after primary tumor resection in the experiment described in f. Each dot is an individual mice. n= 9 (control), 8 (PD1), 10 (PD1/CTLA4). Generalized linear model of Poisson family. i, Percentage of mice that developed liver metastases or remained metastases-free at experimental endpoints (4 weeks after resection) in control and immunotherapy-treated tumors. n= 9 (control), 8 (PD1), 10 (PD1/CTLA4). Generalized linear model with beta-binomial distribution.

