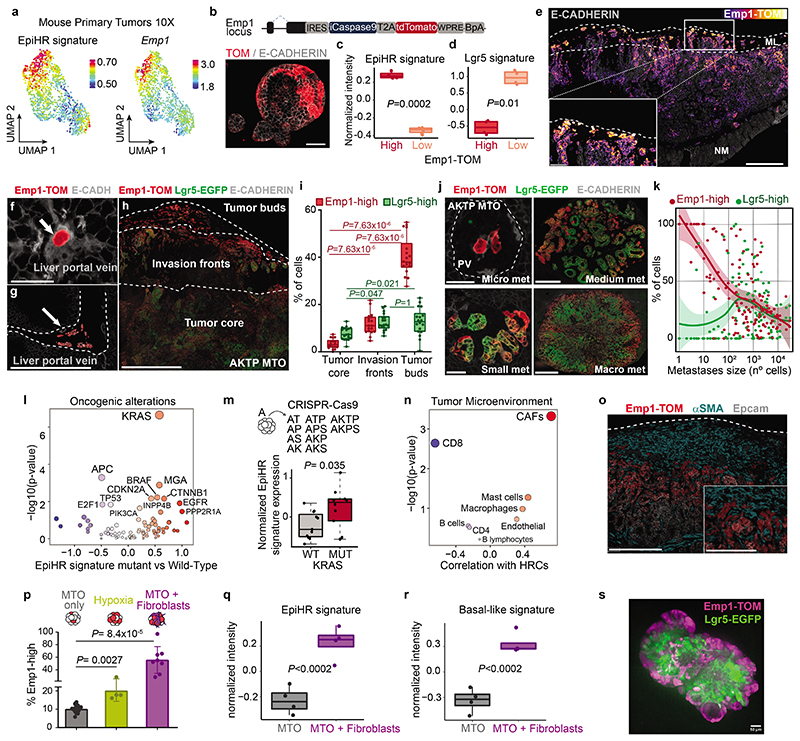
Fig. 3 |. Emp1 marks cells enriched in invasion fronts and micrometastases.
a, UMAP depicting EpiHR and Emp1 levels. b, TOM and E-CADH immunostaining in Emp1-iCasp9-tdTomato AKTP MTOs. Scale bar, 50 μm. c-d, Expression (normalized intensity) of EpiHR (c) and Lgr5 (d) signatures in Emp1-high and Emp1-low cells 4 weeks post-implantation. n=4 mice per condition. ROAST-GSA adjusted p-values. e-h, Representative images of Emp1-TOM+ and/or Lgr5-GFP+ cells in primary CRCs (e,h) and liver metastases (f,g). Dashed lines in panels e,h encompass tumor buds and invasion fronts or label the portal vein in g. NM: Normal Mucosa; ML: Muscle Layer. Scale bars, 500 μm (e,g, h); 100 μm (e, inset); 50 μm (f). i, Percentage of Lgr5-GFPhigh and Emp1-TOMhigh cells in different CRC regions. Whiskers are maximum and minimum values; n= 855,330 cells from 18 mice. Two-sided Paired Wilcoxon test. j, Examples of liver metastases of increasing size. Scale bars, 50 μm (micro and small), 250 μm (medium), 500 μm (macro). k, Percentage of Emp1-TOMhigh and Lgr5-GFPhigh cells per metastasis size. n= 318276 cells from 137 liver metastases from 17 different mice. LOESS model with a 95% confidence interval. l, EpiHR levels versus driver mutations. Difference of medians (x axis) versus p-value of Wilcoxon test (y axis) are shown. m, Normalized intensity of EpiHR signature expression in CTOs of different genotypes. n= 6 (WT) and 5 (Kras G12D) CTOs; 2 technical replicates per genotype. P-value for two-sided T-test. n, Association between HRC frequency and TME cell populations in SMC patients. Pearson correlation coefficients and p-values are shown. o, Representative patterns of TOM, α-SMA and EPCAM in primary CRCs. Dashed lines delimit the caecum. Scale bar: 250 μm; 125 μm (inset). p, Percentage of Emp1-TOMhigh cells (mean ± SD) in the indicated conditions; n=17 (control), 4 (hypoxia) and 8 (fibroblast co-culture). Two-sided Wilcoxon test. q-r, Expression (normalized intensity) of EpiHR or basal-like signatures. n=4 biological replicates. ROAST-GSA adjusted p-values. s, Representative confocal images of AKTP MTOs co-cultured with colon fibroblasts. Scale bar, 50 μm. Boxes in panels c, d, i, m, q and r indicate first, second (median) and third quartiles. Whiskers in panels m,q and r indicate maximum of 1.5 times the interquartile range.

