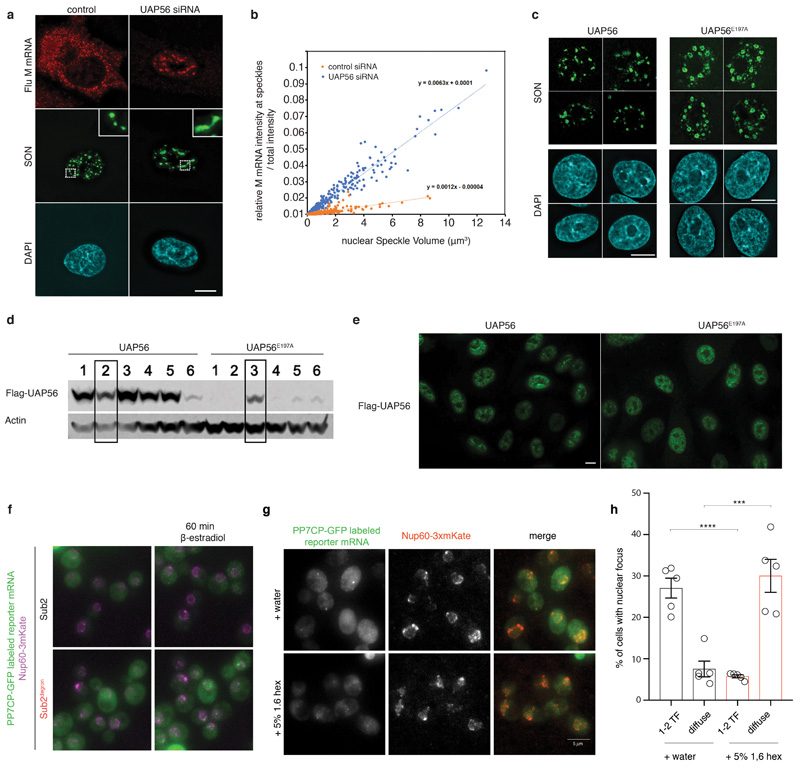
Extended Data Fig. 9. DDX ATPase activity controls turnover of nuclear compartments in human and yeast.
(A, B) Depletion of the DDX ATPase UAP56 leads to an increase in nuclear speckle size. This is consistent with the model that UAP56, which does not contain LCDs and is not an essential ‘building block’ for nuclear speckles, is required for RNA turnover in speckles and its absence would thus lead to an increased residence time of RNA in the compartment and a subsequent increase in the size of preexisting compartments. (A) A549 cells were transfected with control siRNA or UAP56 siRNA. After 48 h, cells were infected with influenza virus (WSN) at a MOI of 10 for 6 h. Cells were subjected to smRNA-FISH to label viral M mRNA and immunofluorescence to stain nuclear speckles with SON antibody. ‘Viral M RNA’ is an influenza virus transcript that has been described to traffic through nuclear speckles22 and is used as a model to represent poly-adenylated, spliced cellular transcripts. Insets: enlargements of the marked white squares showing nuclear speckles. Scale bar 10 μm. Data are representative of three independent experiments. (B) The percentage of M mRNA at nuclear speckles was plotted against the nuclear speckle volume (423 nuclear speckles for each condition - control and UAP56 siRNA). (C) Stably transfected A549 cells expressing wild-type (WT) or UAP56 mutant (E197A) were treated with siRNA targeting 3’-UTR to knockdown endogenous UAP56. Cells were subjected to immunofluorescence microscopy with SON antibody. Scale bar 10 μm. Data are representative of three independent experiments. (D, E) Selection and characterization of stably transfected A549 cells expressing WT or E197A UAP56. For gel source data, see Supplementary Figure 1. Data are representative of three independent experiments. (D) Several cell clones stably expressing WT or E197A UAP56 were tested by western blot using anti-Flag antibody. Clone 2 of WT and clone 3 of E197A were selected for further studies. (E) Immunofluorescence with anti-Flag antibody shows similar expression levels of exogenous UAP56 or UAP56 (E197A) in the selected stable cell lines. Scale bar, 10 μm. (F) Merged images with nuclear rim staining for experiments in Fig 3F. Representative images of 5 (Sub2 degron) or 6 (Sub2) biological replicates. (G) Cells were treated as in Figure 4G. At time point t=60 min after reporter RNA induction cells were treated with either water or 5% 1.6 hexanediol for 20 min. Representative images of 3 biological replicates. (H) Quantification of percentage of cells displaying either distinct nuclear RNA foci (transcription foci, TF; up to 2 to account for mitotic cells) or diffuse nuclear RNA signal in Sub2-depleted cells. Representative images of 5 biological replicates with n>380 cells per replicate. Unpaired t-test (two-tailed) with *** p=0.0009 and **** p<0.0001. Mean and SEM, dots represent mean of individual replicates.

