Abstract
Tumors are supported by cancer-associated fibroblasts (CAFs). CAFs are heterogeneous and carry out distinct cancer-associated functions. Understanding the full repertoire of CAFs and their dynamic changes as tumors evolve could improve the precision of cancer treatment. Here, we comprehensively analyze CAFs using index and transcriptional single-cell sorting,at several time-points along breast tumor progression in mice, uncovering distinct subpopulations. Strikingly, the transcriptional programs of these subpopulations change over time and in metastases, transitioning from an immune-regulatory program to wound healing and antigen-presentation programs, indicating that CAFs and their functions are dynamic. Two main CAF subpopulations are also found in human breast tumors, where their ratio is associated with disease outcome across subtypes, and is particularly correlated with BRCA mutations in triple-negative breast cancer. These findings indicate that the repertoire of CAFs changes over time in breast cancer progression, with direct clinical implications.
Introduction
Tumors initiate as a clonal disease, and grow as ecosystems, in which distinct subpopulations of cells engage in complex interactions. Genetic and epigenetic heterogeneity among cancer cells flows from the intrinsic biology of multi-step carcinogenesis1–3. Tumors, however, are comprised of more than just cancer cells, and the complexity of tumor heterogeneity is amplified by contributions from the tumor microenvironment (TME)4.
Key players in the TME are cancer-associated fibroblasts (CAFs). CAFs promote cancer phenotypes including proliferation, invasion, extracellular matrix (ECM) remodeling and inflammation4–7, as well as chemoresistance8 and immunosuppression9. Different cell surface markers identify unique subpopulations of CAFs, and different origins have been suggested for CAFs, including tissue resident fibroblasts, myofibroblasts, bone-marrow (BM) derived mesenchymal stem cells (MSC), and adipocytes10–14.
Currently, it is unclear to what extent CAF subpopulations and their functions change over time with tumor progression and metastasis. Here, we address this question using an unbiased approach that does not require a-priori defined markers15 to characterize thousands of CAFs at several time-points over breast tumor growth and metastasis in mice. We identify eight CAF subtypes in two main CAF populations, which we term pCAF and sCAF, based on selective expression of the markers Pdpn or S100a4 (also called fibroblast-specific protein 1; FSP1). These CAF subtypes appear progressively over time, transitioning from an early immune-regulatory transcriptional program, to a late combination of antigen-presentation and wound-healing programs. Using the PDPN and S100A4 protein markers, as well as markers for subpopulations of sCAFs and pCAFs, we show that human breast tumors have similar CAF compositions, and that the ratio between PDPN+ and S100A4+ CAFs is associated 44 11 with BRCA mutations in triple-negative breast cancer. Moreover, in two independent cohorts of breast cancer patients, the ratio between the PDPN+ and S100A4+ CAFs strongly correlates with clinical outcome. This study shows that CAF functions change with tumor progression, providing clinically relevant markers. Our findings raise the concept of a dynamic TME, in which genomically stable cells change their transcriptional program to keep track of the evolving tumor ecosystem.
Results
Comprehensive mapping of breast CAFs reveals subpopulations with distinct transcriptional programs
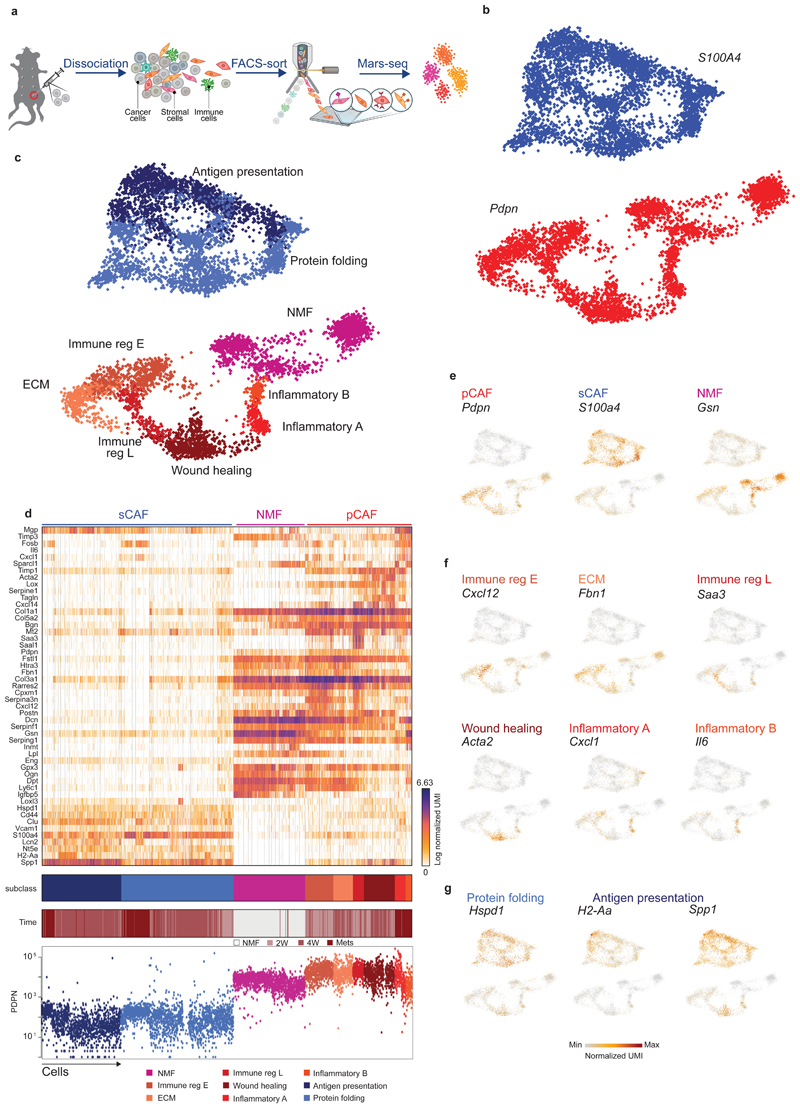
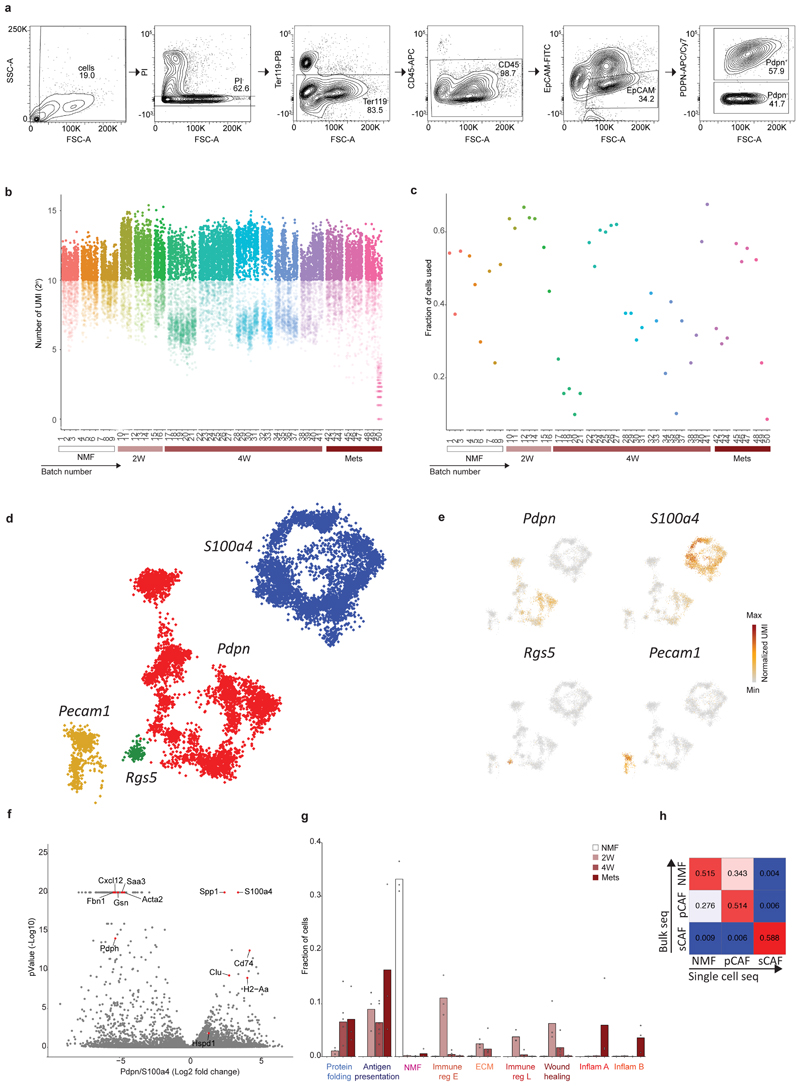
To discover CAF subtypes associated with breast cancer progression we first set out to characterize the stromal cell types/states that comprise breast tumors in a mouse model – triple negative 4T1 cancer cells orthotopically injected into the mammary fat pad of immunocompetent BALB/c mice. This cell-line has been extensively used as a robust model for metastatic breast cancer known to recruit abundant stroma13. To avoid biases driven by a-priori defined markers we used an index sorting and negative-selection based approach for isolation and massively parallel single-cell RNA-sequencing (MARS-seq)of CAFs15. We densely sampled cells along critical time points of tumor development –2 weeks (2W) and 4 weeks (4W) post injection, and from lung metastases (Met)spontaneously forming 4-5 weeks post primary tumor injection. Normal mammary fat pad fibroblasts (NMF) from naïve mice served as controls. Tumors or normal mammary fat pads were harvested, dissociated into single cell suspensions, and the live cells were stained with cell-surface markers: Ter119 (Red blood cells), CD45 (immune), and EpCAM (epithelial) for negative selection; and Podoplanin (PDPN; Fibroblasts) for index sorting. All live cells negative for Ter119, CD45 and EpCAM were index sorted and single-cell processed by MARS-seq (Fig. 1a; Extended Data Fig. 1a). We analyzed 8987 QC positive single cells from 12 tumor-bearing mice and 3 naïve mice (Extended Data Fig. 1b-c; Supplementary Table 1) and used the MetaCell algorithm16 to identify homogeneous and robust groups of cells (“metacells”), resulting in a detailed map of the 88 most transcriptionally distinct subpopulations (Supplementary Table 2). These metacells are organized into 4 broad classes:Endothelial cells (characterized by expression of Pecam1), pericytes (Rgs5), and two classes of fibroblasts that we termed pCAFs (Pdpn) and sCAFs (S100a4; Extended Data Fig. 1d-e).
Fig. 1. Breast CAFs are comprised of distinct subsets with diverse transcriptional profiles.
a, Illustration of the experimental procedure. b and c, Single cell RNA-seq data from CAF and NMF was analyzed and clustered using the MetaCell algorithm, resulting in a two-dimensional projection of 8033 cells from 15 mice. 83 meta-cells were associated with 2 broad fibroblast populations (b) and 9 functional subclasses (c) annotated and marked by color code. (d) Gene expression of key markers genes across single cells from all subclasses of NMF, pCAF, and sCAF. Lower panels indicate the association to subclass, the time-point, and the PDPN index sorting data, showing protein level intensity in each cell. e-g, Expression of key markers genes for NMF, pCAF, and sCAF (e); functional annotation for pCAF subclasses (f) and sCAF subclasses (g) on top of the two-dimensional projection of breast CAFs. Colors indicate log transformed UMI counts normalized to total counts per cell.
We in silico removed the Pecam1 and Rgs5 cells, and a rare population (33 cells) negative for Pecam1, Rgs5, Pdpn, and S100a4, that highly expressed Myc and may have originated from cancer cells (see Methods). We continued our analysis with 3875 Pdpn cells, and 4158 S100a4 cells (Fig. 1b; Extended Data Fig. 1d-f; Supplementary Tables 3-4). Each of these fibroblast populations could be further divided into subsets with distinct transcriptional profiles (Fig. 1c) and differentially expressed genes (Fig. 1d), reproducible across mice and batches (Extended Data Fig. 1g). Pdpn-fibroblasts expressed cell-surface PDPN protein (Fig. 1d lower panel) and included the NMF (Gsn) subset (Fig. 1e), and 6 subsets of pCAFs (Fig. 1f). Two of these expressed different gene modules involved in immune regulation and cell migration (Cxcl12 and Saa3); one had a wound-healing signature (Acta2; encoding for alpha smooth muscle actin; αSMA); one had an extracellular fiber organization signature (Fbn1) and two had inflammatory signatures (Cxcl1 and Il6). S100a4-fibroblasts were devoid of NMFs and included 2 subsets of CAFs, albeit these subsets were not as clearly separated from each other as the pCAF subsets (Fig. 1d). One subset (Spp1highS100A4low) was enriched for signatures of antigen presentation (H2-Aa) and ECM remodeling (Fig. 1g). The other subset (Spp1lowS100A4high) was enriched in protein folding and metabolic genes (Hspd1; Fig. 1g).
To validate our single-cell sequencing results we performed bulk RNA sequencing of sCAFs, pCAFs, and NMFs, and compared the profiles obtained by bulk and single-cell RNA-sequencing. All groups showed high correlation (R>0.5) between bulk and cognate single-cell profiles (Extended Data Fig. 1h). pCAF and NMF profiles also showed high correlation. sCAFs, however, showed no correlation with pCAFs or NMFs (Extended Data Fig. 1h), suggesting that they have further diverged from NMF, or perhaps have a different origin altogether. To exclude the potential contribution of cancer cells that have undergone EMT14 to the sCAF population, we analyzed the bulk RNA sequencing data for lineage traces of 4T1 cancer cells (transfected plasmid reads; see Methods). This analysis confirmed that while some cancer cells may have escaped the negative selection approach, the majority of sCAFs are derived from host mesenchymal cells (Supplementary Table 5; see Methods).
CAF composition is dynamically reshaped as tumors progress and metastasize
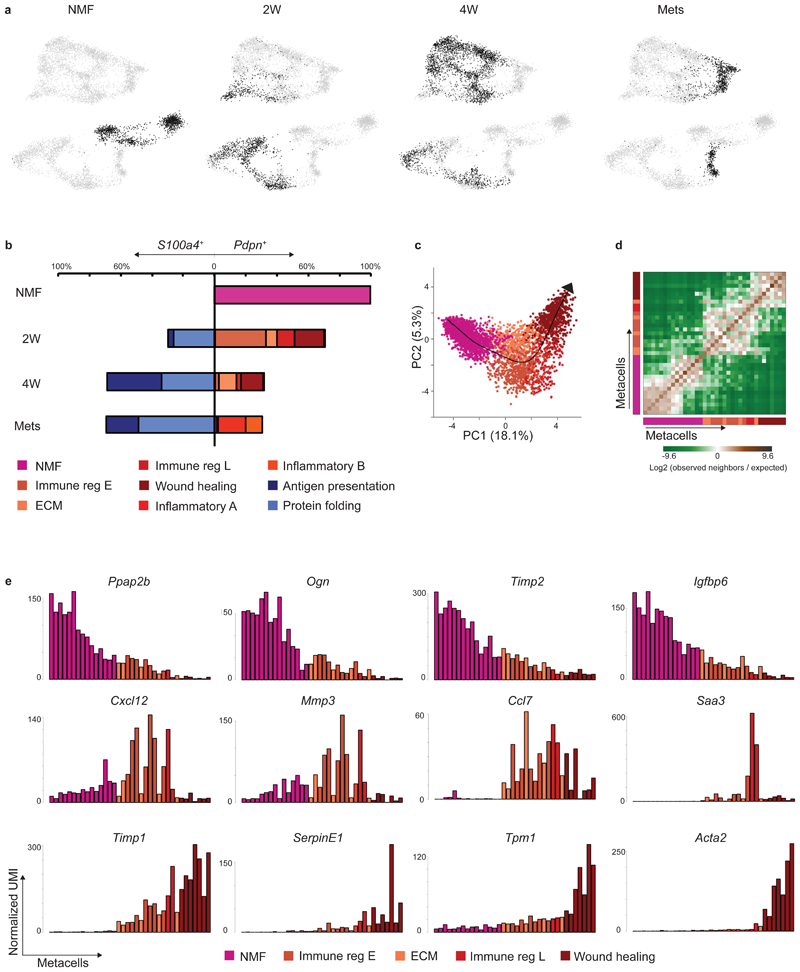
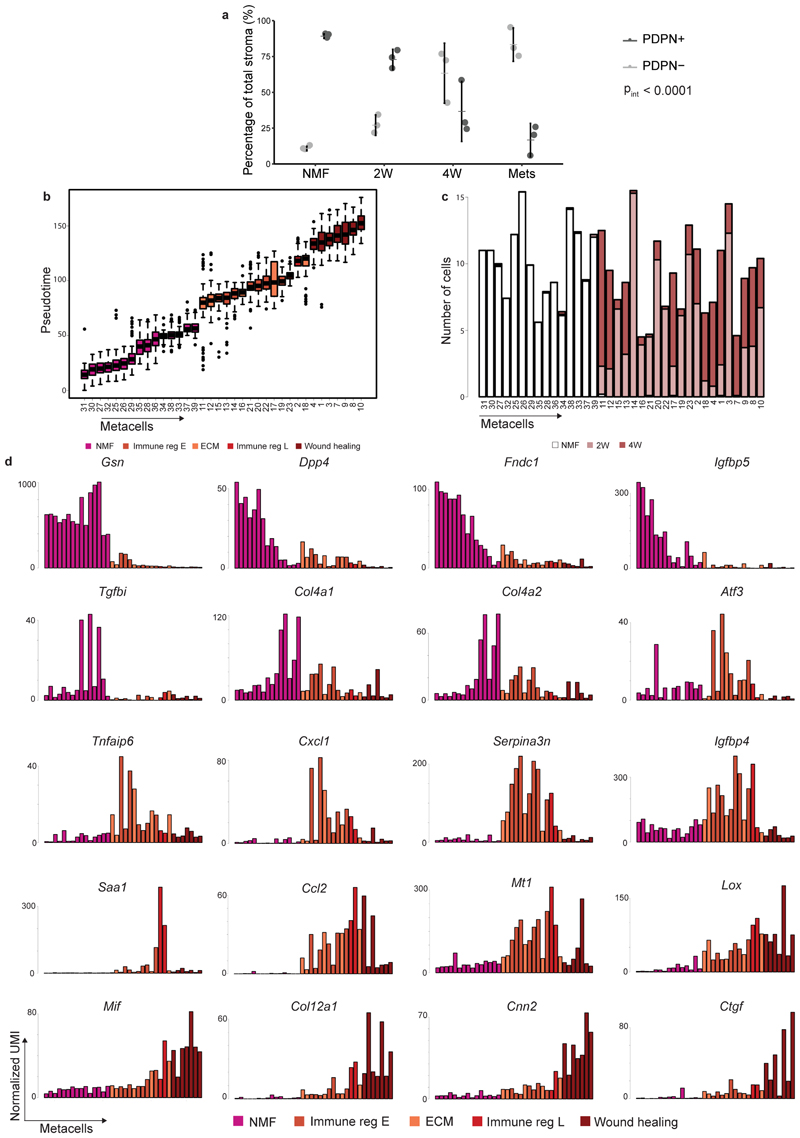
Tumor heterogeneity increases with tumor progression1,17,18. Similarly, we and others have hypothesized that stromal heterogeneity increases as tumors progress. Accordingly, our analysis shows that metacell composition varies extensively between the different time points (Fig. 1d; Fig. 2a-b). Normal mammary fat pads harbored Pdpn+ fibroblasts and were devoid of S100a4+ fibroblasts. Two weeks after tumor initiation (2W) significant heterogeneity is observed: sCAFs constitute ~30% of the CAF population (Fig. 2b), and the majority express metabolic and protein folding genes (Hspd1). The remaining ~70% of CAFs at 2W are Pdpn+, yet in contrast to Pdpn+ NMF, pCAFs are highly heterogeneous – more than half of them belong to the two immune regulatory subpopulations (Cxcl12 or Saa3), ~10% express ECM modules (Fbn1), and the remaining quarter exhibits a wound healing profile (Acta2). 4 weeks after tumor initiation (4W) the majority of CAFs are sCAFs (~77%) while only ~23% are pCAFs. Once again, the composition of metacells within each class has changed dramatically - The dominant pCAF populations at 4W are the wound healing class (Acta2)and ECM organizing pCAFs (Fbn1), while the immune-regulatory pCAF subpopulations (Cxcl12;Saa3) are diminished (Fig. 2b). sCAF at 4W are composed largely of cells expressing ECM remodeling and antigen presentation profiles (Spp1, H2-Aa). Lung metastases (Mets) contain mostly sCAFs (~70%) and share similar sCAF subpopulations with primary tumors (i. e. Spp1 and H2-Aa; Hspd1), at 1:1 ratio. The pCAF population in Mets (~30%) is comprised mostly of two inflammatory subpopulations (Il6 and Cxcl1) that were not observed in primary tumors or in the normal mammary fat pad (Fig. 2b). The dynamic shift in CAF composition was confirmed by FACS analysis of cell-surface PDPN protein expression. As tumors grew, the abundance of PDPN+ cells within the stromal (CD45- EpCAM-) population decreased, and the abundance of PDPN- cells increased (Extended Data Fig. 2a).
Fig. 2. CAF composition and gene expression changes with tumor growth and metastasis.
a, Projection of 8033 cells from different time points (black) on top of the 2D map of breast fibroblasts (presented in Fig. 1b-c). b, Compositions of Pdpn+ fibroblasts (right) and S100a4+ fibroblasts (left) at different time points (normalized to 100% total fibroblasts). Subclasses are annotated and color-coded. c-e, Slingshot analysis of pseudo-time trajectory from NMF to pCAF from 2W and 4W. A total of 3465 cells was analyzed. Cells are color-coded as in b. c, Suggested trajectory from NMF to pCAF projected over the top two principal components. d, Heat map showing enrichment (log2 fold change) for kNN connections between metacells over their expected distribution. Metacells are ordered by their position on the Slingshot pseudotime. e, Expression of hallmark NMF and pCAF genes across metacells (average UMI/cell), ordered by pseudo-time.
Pdpn+ fibroblasts diverge into pro-tumorigenic CAFs during tumor progression
Different origins have been proposed for CAFs, including NMFs, MSCs, and adipocytes10–13. Our metacell analysis showed that pCAFs (but not sCAFs) share similar patterns of transcription with NMFs (Fig. 1d; Extended Data Fig. 1h), suggesting that pCAFs may have originated from NMFs. To infer the most probable transcriptional trajectory for pCAFs we applied Slingshot, a computational method for cell lineage pseudo-time inference19. Slingshot analysis displayed a gradual transition from NMFs through early immune-regulatory and ECM-organizing pCAFs, to late immune-regulatory pCAFs, and eventually to wound-healing pCAFs (Fig. 2c-d). This trajectory is consistent with the transition from normal fibroblasts through 2W to 4W tumors (Extended Data Fig. 2b-c). NMFs expressed high levels of hallmark genes encoding membrane bound and extracellular proteins (Ppap2b, Ogn, Timp2, Igfbp6). Expression of these genes gradually decreased along the trajectory leading to wound-healing pCAF (Fig. 2e, upper row; Extended Data Fig. 2d). In parallel, gradual increase in expression was observed for signature genes involved in cell migration and wound healing, such as Timp1, Serpine1, Tpm1 and Acta2 (Fig. 2e, lower row; Extended Data Fig. 2d). A third temporal pattern was genes whose expression was low in NMFs, high in the ECM/immune-regulatory pCAFs and low again in wound-healing pCAFs. These included Cxcl12, Mmp3, Ccl7, and Saa3 (Fig. 2e, middle row; Extended Data Fig. 2d).
sCAFs are transcriptionally distinct from pCAFs and NMFs
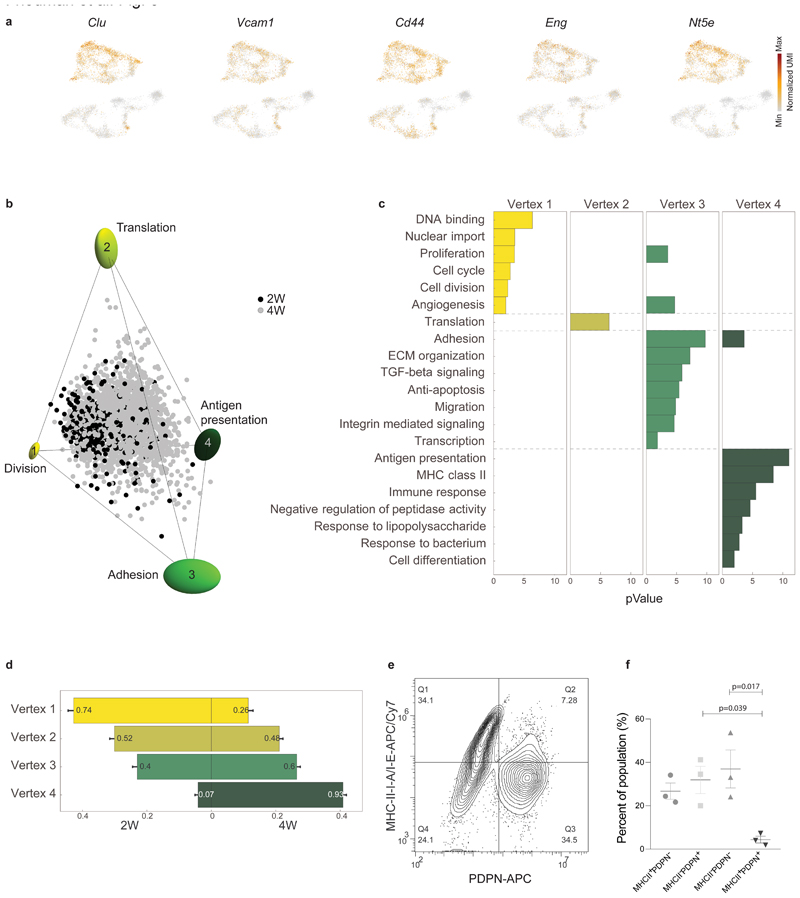
sCAFs exhibit global gene expression profiles that differ from those of pCAFs and NMFs (Extended Data Fig. 1f). Moreover, we could not find transitional cells linking these fibroblast types (Fig. 1d) that would suggest a gradual shift from NMFs to sCAFs, as observed for pCAFs. Bone marrow (BM) derived MSCs are commonly viewed as a source of CAFs10,20. The molecular chaperone Clusterin was recently shown to play tumor-promoting roles in BM-MSC derived CAFs recruited to breast tumors in mice10. Indeed, Clusterin (Clu), as well as several other MSC markers (Vcam1, Cd44, Eng, and Nt5e), were differentially upregulated in sCAFs compared to pCAFs (Fig. 1d; Fig. 3a). Together with the observation that S100a4+ fibroblasts are not found in the normal mammary fat pad, this suggests that sCAFs arise from a different origin than pCAFs, and are recruited to the tumor, perhaps from BM-MSCs.
Fig. 3. sCAFs show a continuum of cell states which fills a tetrahedron in gene-expression space, suggesting trade-off between 4 functions.
a, Expression of hallmark mesenchymal stem cell marker genes on top of the two-dimensional projection of breast cancer stroma (presented in Fig. 1b-c), in a total of n=8033 cells from 15 mice. Colors indicate log transformed UMI counts normalized to total counts per cell. b, ParTI analysis of 2W and 4W sCAF single-cell gene-expression in the space of the first 3 principal components shows a continuum that can be well enclosed by a tetrahedron. At the vertices are ellipses that indicate standard deviation of vertex position from bootstrapping. Cells are color-coded according to time point. Vertices are annotated and color-coded. n=2292 cells. c, Gene ontology enrichment in the different vertices. (see full list in Supplementary Table 6). n=2292 cells, gene enrichment was calculated by Spearman rank correlation between the gene’s expression and the euclidean distance of cells from the vertex, as detailed in Methods. d, Relative representation of each time point in the 4 vertices. The x-axis shows the fraction of cells from 2W and 4W closest to each vertex. Numbers in the bars are the fraction of each time point in the 100 cells closest to each archetype. e-f, Flow cytometry analysis of cell surface expression of MHC-II molecules I-A/I-E vs PDPN in CD45- EpCAM- cells from 4W tumors. A representative flow cytometry plot is shown in (e), quantification of results is presented in (f). n=3 mice, mean± SEM, P-values were calculated using one-way ANOVA followed by Tuckey's multiple comparisons test.
sCAFs show a continuum of cell states bounded by four major transcriptional programs
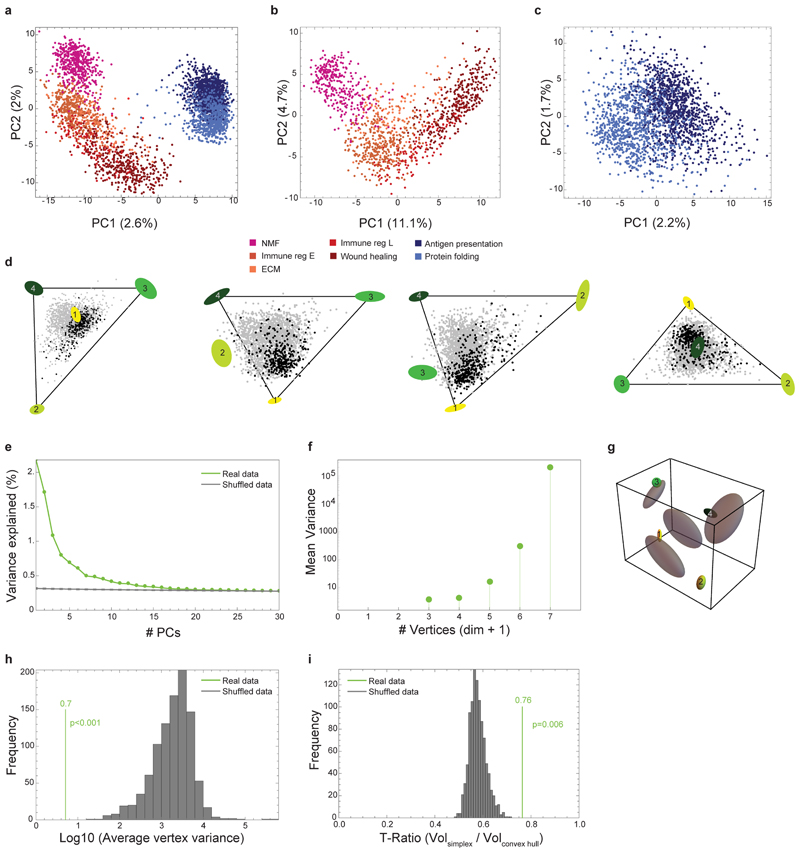
Unlike pCAFs, sCAFs do not seem to form discrete subpopulations, but rather a continuum in gene expression space, implying a continuum of cell states. To infer biological functions associated with these cell states, we applied the Pareto task inference (ParTI) method21,22. ParTI is based on an evolutionary theory suggesting that when cells need to perform multiple functions, no single gene-expression profile can be optimal for all functions at once. This trade-off leads to specific patterns in the data: individual cells fall into a polyhedron in gene expression space22. Cells near a vertex are specialists at a particular function, whereas cells near the middle of the polyhedron are generalists22,23. We first applied ParTI on NMFs, 2W, and 4W CAFs. Mets clustered separately in this analysis and were therefore excluded (see Methods). pCAFs clustered with NMFs, and sCAFs formed a distinct cluster, confirming our metacell analysis (Extended Data Fig. 3a). Next we analyzed each cluster separately. pCAFs and NMFs formed a 1D continuum (curve) in agreement with the slingshot analysis (Extended Data Fig. 3b). sCAF gene expression could not be explained well by 1D continuum (curve) or 2D planar polygon (Extended Data Fig. 3c). Rather, sCAF transcriptional states were best described as a continuum in a tetrahedron (Fig. 3b, Extended Data Fig. 3d-i). At the vertices of this tetrahedron are 4 transcriptional programs representing distinct biological functions (Fig. 3b; Extended Data Fig. 3d): Vertex 1 is enriched with cells expressing programs for cell division and proliferation (Fig. 3c; Supplementary Table 6). Vertex 2 corresponds to protein translation, vertex 3 to adhesion, ECM-organization, pro-survival and migration programs, and vertex 4 to immune response programs, in particular antigen presentation via MHC class II genes (Fig. 3c and Supplementary Table 6). The distribution of cells within the tetrahedron changed with tumor growth (Fig. 3d). sCAFs in 2W tumors were located mostly in the space between vertices 1-3, indicating that they express transcriptional programs of division, adhesion, and protein translation (Fig. 3d). Antigen presentation programs were expressed mostly by 4W sCAFs, and scarcely by 2W sCAFs, suggesting a temporally dynamic division of functions between sCAFs in breast tumors.
We further tested expression of MHC class II using flow cytometry analysis of sCAFs and pCAFs from 4W tumors. The MHC class II cell-surface molecules I-A/I-E+ were expressed by ~50% of 4W sCAFs, but not by pCAFs (Fig. 3e-f).
PDPN and S100A4 mark mutually exclusive, morphologically distinct CAFs in mouse breast tumors
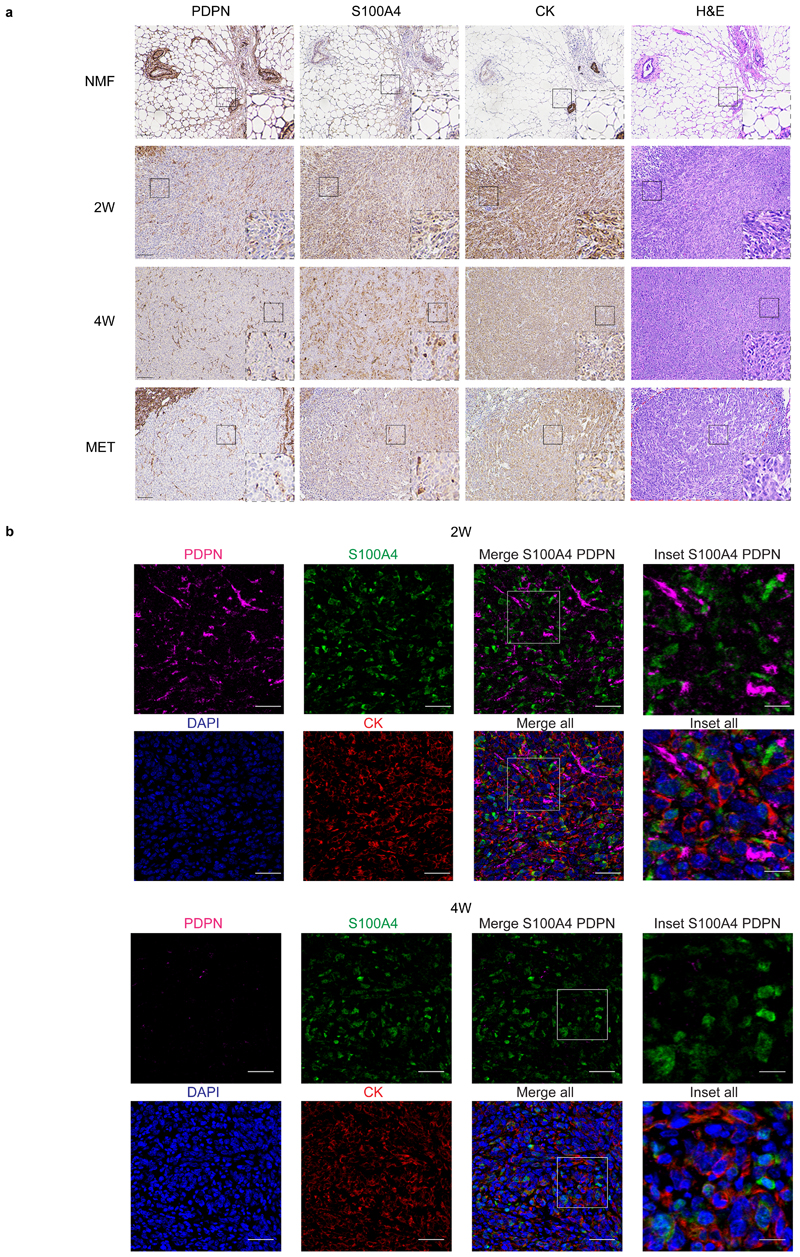
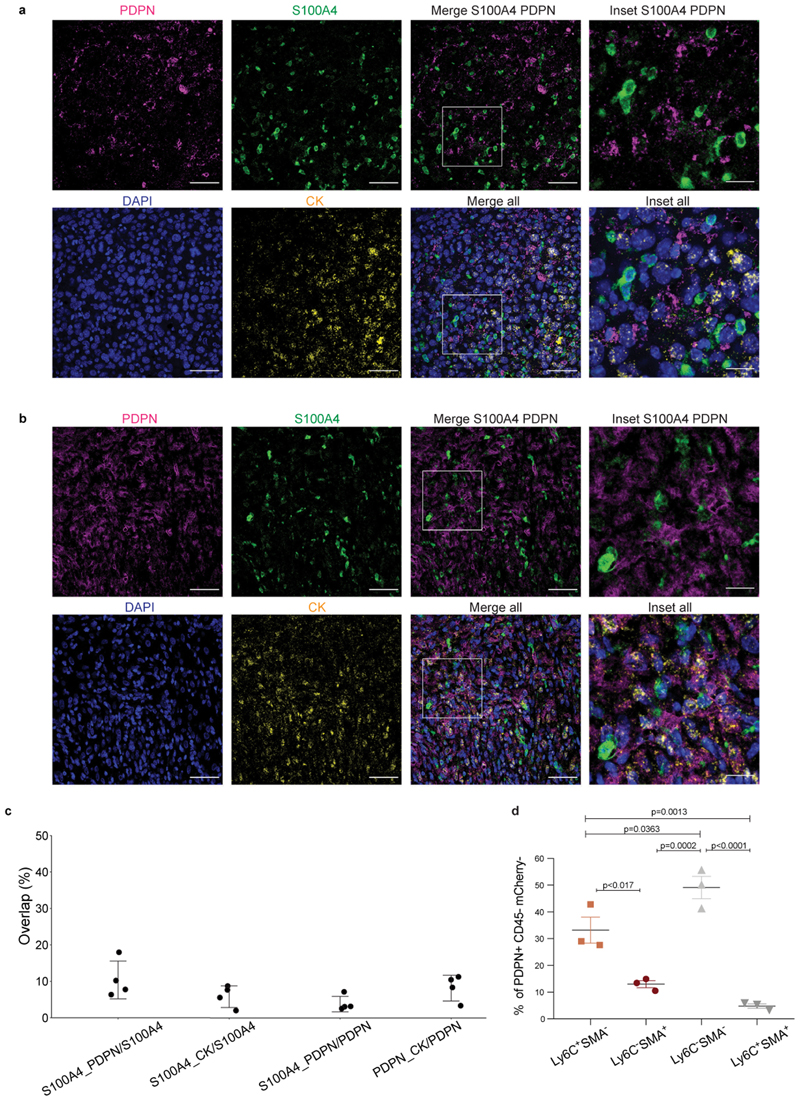
To validate our classification and examine the spatial distribution of the CAF subpopulations, we performed immunohistochemical staining of 4T1 tumors from different stages with anti-S100A4 and anti-PDPN antibodies. Cytokeratin (CK) was used to identify cancer cells. NMFs showed very weak expression of S100A4, whereas PDPN+ fibroblasts were abundant (Fig. 4a, upper panel). 2W and 4W tumors harbored both PDPN and S100A4-positive cells. The expression pattern of both proteins was different than that of CK, suggesting that these are stromal cells (Fig. 4a, middle panels). Metastases were rich in S100A4-positive cells (Fig. 4a, lower panel). PDPN was scarcely expressed in metastases, and strongly expressed in the normal adjacent lung tissue (Fig. 4a, lower panel). At all tumor stages, pCAFs were long and spindly, resembling the morphology of NMFs, and sCAFs were smaller. Both classes of CAFs were distributed in all regions of the tumor (Fig. 4a).
Fig. 4. PDPN and S100A4 proteins are expressed on distinct types of breast CAFs in mouse tumors.
a, Consecutive formalin fixed paraffin embedded (FFPE) tissue sections of tumors, metastases, or normal mammary fat pads were immunostained with antibodies against the indicated proteins, or stained with hematoxylin & eosin (H&E). n=3 mice per time point; Representative images are shown. All images were collected at the same magnification and are presented at the same size. Scale bar = 100μm. For each panel, regions marked by rectangles are shown as 2.5X insets in black dashed rectangles. A dashed red line on the H&E marks the metastatic region in the lung. b, Multiplexed immunofluorescent (MxIF) staining was performed with antibodies against the indicated proteins. n=3 mice per time point; Representative images of 2W and 4W tumor FFPE sections are shown. Scale bar = 50 μm, inset scale bar = 17μm.
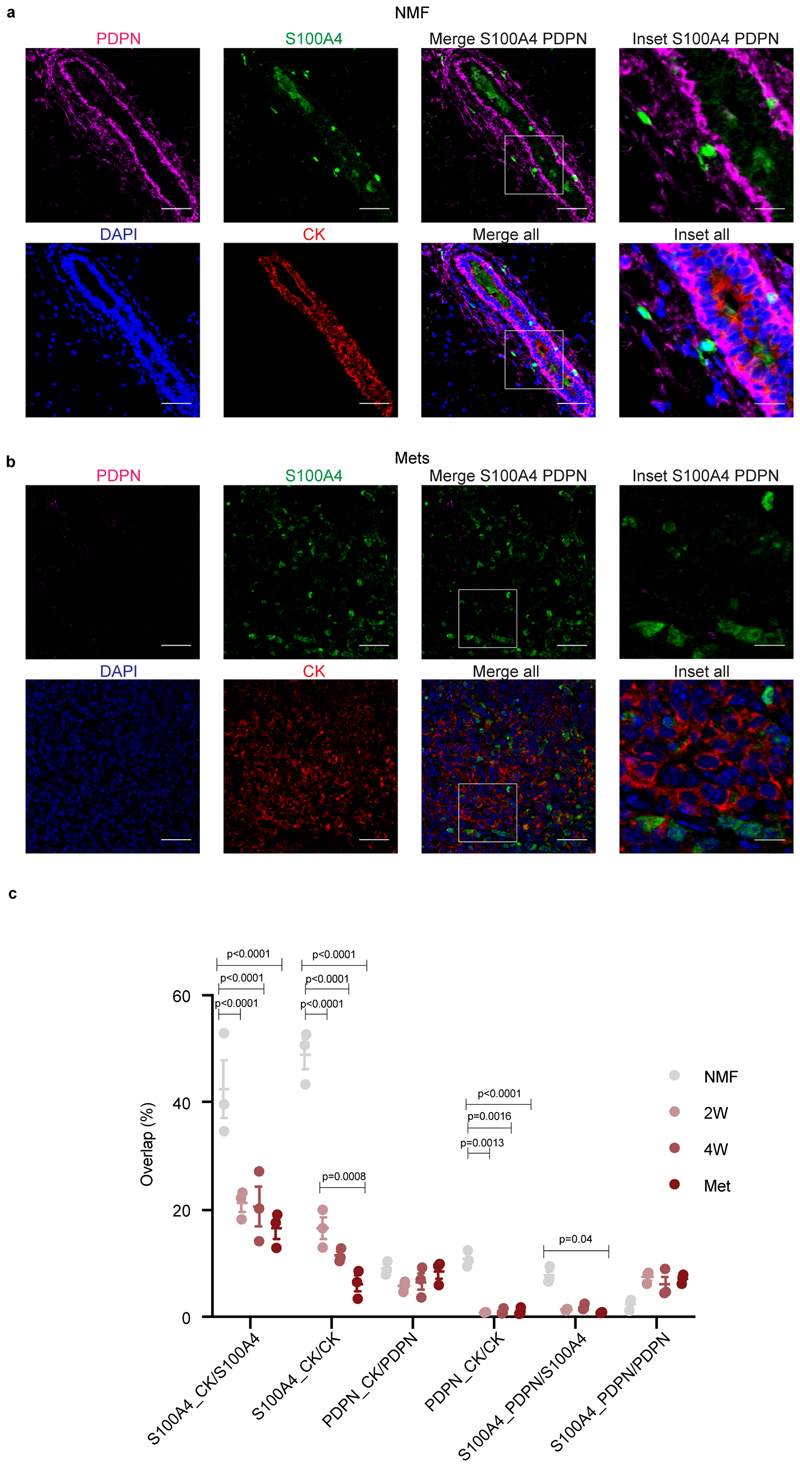
Multiplexed immunofluorescent (MxIF)staining confirmed that S100A4 and PDPN mark different populations of cells (Fig. 4b and Extended Data Fig. 4). We saw partial overlap between S100A4 and CK staining, mostly in normal mammary fat pads (Extended Data Fig. 4a and c). Nevertheless, the majority of S100A4 cells in primary tumors and in metastases were CK-negative, confirming our sequencing results and suggesting that PDPN+ cells and S100A4+ cells are distinct subtypes of CAFs (Fig. 4b and Extended Data Fig. 4).
To test the robustness of our CAF classification we used a different mouse model of triple negative breast cancer - E0771 cancer cells orthotopically injected into the mammary fat pad of immunocompetent C57BL/6 mice. MxIF staining of 4W tumors showed that, similar to the 4T1 model, S100A4 and PDPN mark distinct populations of CAFs in E0771 tumors. Neither PDPN nor S100A4 overlapped with CK-positive cancer cells (Extended Data Fig. 5a-c).
Ly6C+ pCAFs are immunosuppressive
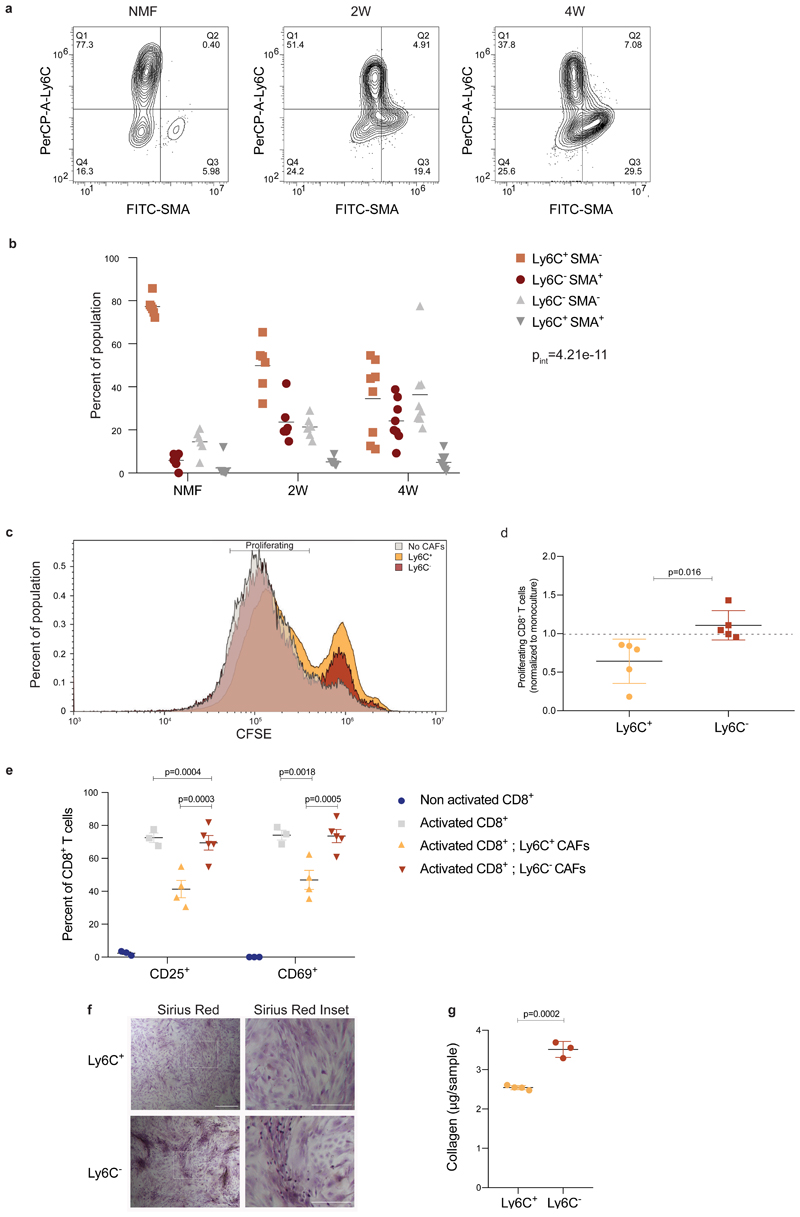
Our sequencing results suggested that pCAFs are comprised of diverse subpopulations performing distinct tasks such as immune regulation and wound-healing. To test the functional relevance of these findings we first performed flow cytometry to define markers for the pCAF subpopulations. We stained pCAFs from primary 4T1 and E0771 tumors with antibodies against Ly6C as a marker for the immune-regulatory subpopulation and SMA (encoded by Acta2) as a marker for the wound-healing subpopulation (Fig. 1d). These proteins marked distinct subpopulations of cells (Fig. 5a; Extended Data Fig. 5d). The Ly6C+ SMA- subpopulation was most abundant in NMFs and decreased as tumors progressed, whereas the Ly6C- SMA+ subpopulation was lowest in NMFs and increased as tumors progressed (Fig. 5b), similar to a Ly6C- SMA- subpopulation.
Fig. 5. Ly6C+ pCAFs suppress CD8 T-cell proliferation, in vitro.
a-b, FACS analysis of Ly6C and SMA expression in CD45- EpCAM- PDPN+ cells freshly harvested from normal mammary fat pads, 2W tumors, and 4W tumors, and immediately fixed. Representative flow cytometry plots from one mouse are shown in (a) and the results are quantified in (b). n=6 mice for NMF and 2W; n=8 mice for 4W, data are combined from 3 independent experiments and are presented as mean, analyzed using two-way ANOVA followed by Tuckey's multiple comparisons test. Pint – P interation between time and population. c-d, CD45- EpCAM- PDPN+ cells from 4W tumors were sorted to Ly6C+ vs Ly6C- populations, which were then incubated in vitro at 1:1 ratio with CD8+ T cells activated by CD3/CD28 beads and marked by CFSE for 48h. Representative FACS plots of CFSE signals from one experiment are shown in (c) and the results from n=5 independent experiments, each with different mice, normalized to the average proliferation with no CAFs per experiment are presented in (d) as mean ± SD, analyzed utilizing two-sided Students’ T-test. e, Flow cytometry analysis of CD25 and CD69 activation markers in CD8+ T cells activated and co-cultured with pCAFs as described in (c), or incubated in monoculture with and without activation. The experiment was repeated 3 times, each with different mice. Results from one representative experiment are shown in (e). For non-activated CD8+ and activated CD8+ n=3; for activated CD8+ with Ly6C+ CAFs n=4; for activated CD8+ with Ly6C- CAFs n=5 independent culture wells;mean±SEM; two-way ANOVA followed by Tuckey’s multiple comparisons test. f-g, CD45- EpCAM- PDPN+ cells from 4W 4T1 tumors were sorted to Ly6C+ vs Ly6C- populations, which were then grown to confluence in vitro, passaged once, allowed to secrete collagen for 4 days and stained with Sirius Red (see Methods section). The experiment was repeated 4 times, each with different mice. Results from one representative experiment are shown in (f). Quantification of Sirius Red staining in a representative experiment is shown in (g). n=4 Ly6C+; n=3 Ly6C- independent culture wells. Mean±SEM, two tailed Student’s T-test. Scale bar = 500 μm, inset scale bar = 250 μm.
Since Ly6C+ pCAFs in the primary tumor expressed an immune-regulatory module we next examined their potential to suppress T-cell proliferation, in vitro. We activated CD8+ T cells by CD3/CD28 beads, in the presence of Ly6C+ or Ly6C- pCAFs isolated from 4T1 primary tumors, and measured their proliferation after 48h of co-culture by CFSE-staining (Fig. 5c-d). We found a significant difference in the effect of these two pCAF subpopulations on activated CD8+ T-cell proliferation: While Ly6C- pCAFs had no effect on T cell proliferation (when normalized to monoculture of activated T cells without CAFs; Fig. 5d), Ly6C+ pCAFs caused a 1.5-fold reduction in CD3/CD28-mediated CD8+ T-cell proliferation (Fig. 5d). The suppression of T cell proliferation was accompanied by a significant reduction in CD8+ T-cell activation as measured by the increase in CD25 and CD69 activation markers in CD8+ T cells grown in co-culture with Ly6C+ but not with Ly6C- pCAFs (Fig. 5e). These results support our molecular profiling results and suggest that Ly6C+ SMA- pCAFs suppress CD8+ T-cell activation and proliferation, whereas Ly6C- pCAFs do not.
To test whether Ly6C- pCAFs exhibit wound-healing functions, we examined their ability to secrete collagen in-vitro using Sirius red staining (See Methods). We found that Ly6C- pCAFs secreted significantly more collagen than Ly6C+ pCAFs, further supporting the transcriptional profiling results, and suggesting that Ly6C- pCAFs may have wound-healing functions (Fig. 5f-g).
S100A4 and PDPN mark distinct stromal populations in human breast tumors
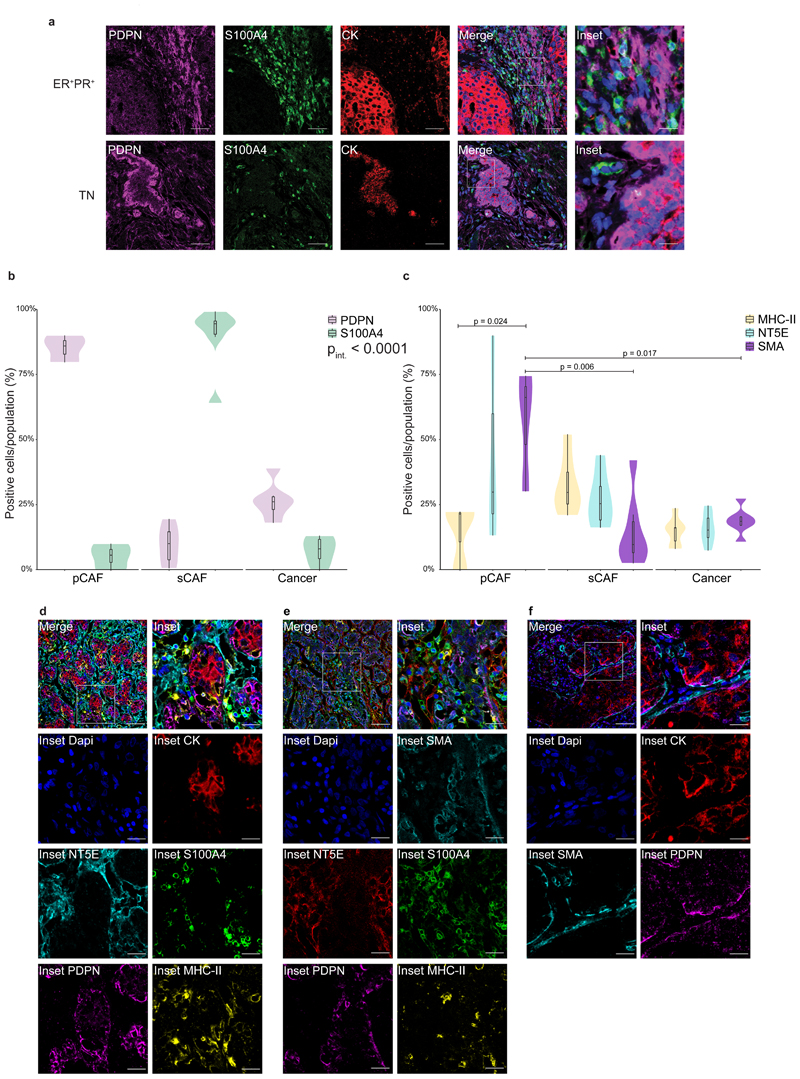
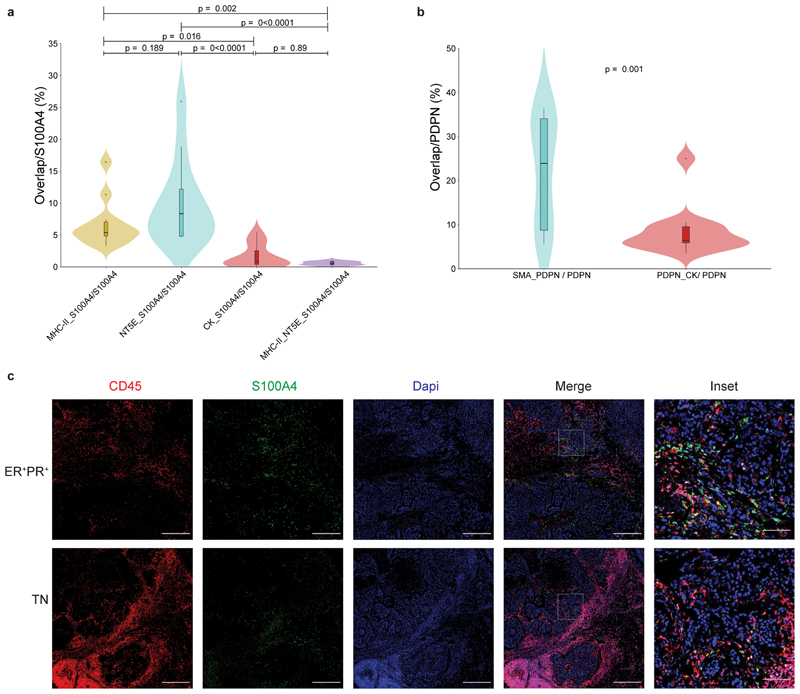
To test the clinical relevance of our findings we performed MxIF staining for PDPN and S100A4 in human estrogen receptor positive (ER+)and triple negative (TN) breast cancer patient tissue samples. CK staining was performed to mark epithelial cancer cells (Fig. 6a). We found that PDPN+ cells and S100A4+ cells are major constituents of human breast cancer stroma, and exhibited very low overlap with CK staining (Fig. 6a-b; Extended Data Fig. 6a-b). A minor overlap was observed between S100A4 and CD45 staining, in cells with mesenchymal morphology (Extended Data Fig. 6c). Similar to our mouse models, PDPN+ cells and S100A4+ cells were mutually exclusive (Fig. 6b). These observations suggest that PDPN and S100A4 mark distinct subtypes of CAFs in human breast tumors.
Fig. 6. PDPN and S100A4 mark distinct populations of CAFs in human breast cancer.
a, MxIF staining of FFPE tissue sections from ER+ or TN breast cancer (BC) patients with antibodies against the indicated proteins. Staining was performed on 5 ER+ and 6 TN patients, representative images from an ER+ PR+ HER2- and a TN patient are shown. n=11 patients, combined from two independent experiments. Scale bar = 50 μm; inset scale bar = 12.5 μm. b-f, FFPE tumor sections from 12 TNBC patients were MxIF stained with antibodies against the indicated proteins. Cells were classified using QuPath (see Methods section) to pCAFs, sCAFs or cancer cells based on PDPN, S100A4 and CK staining (b) and the expression of MHC-II, NT5E and SMA in each class was determined (c). n=3 patients for pCAF; n=6 patients for sCAF and Cancer. Median is presented with 1st and 3rd quartiles, with trimmed violin plot overlay. Probability comparisons were done using two-way ANOVA (b-c) with Tukey correction for multiple comparisons in (c). P-value of the interaction of cell and marker (Pint) is shown in (b). Representative merged images and insets of the independent channels are shown in (d-f). n=8 patients for d; n=6 patients for e; n=5 patients for f. Scale bar = 50 μm; inset scale bar = 17 μm.
We observed partial segregation in the spatial organization of CAFs in human tumors (Fig. 6a). Both in ER+ and TN samples, a subset of pCAF was found immediately adjacent to CK+ cancer cells, or infiltrating the cancerous region. The rest of the pCAFs were dispersed in stromal regions, mixed with sCAFs. In contrast, sCAFs were less frequently found immediately adjacent to cancer cells (Fig. 6a, insets).
A subset of human sCAFs expresses MHC class II, whereas a subset of pCAFs expresses SMA
To further characterize human sCAFs and pCAFs, we tested several of the markers for sCAF and pCAF subpopulations found in our scRNA-seq data by MxIF in a small cohort of TNBC patients. SMA was widely expressed by pCAFs, and not by sCAFs (Fig. 6c; Fig 6e-f; Extended Data Fig. 6b). The MHC class II cell-surface receptor HLA-DR marked a subset of sCAFs (Fig. 6c-e; Extended Data Fig. 6a), but not pCAFs. NT5E (aka CD73) localized to subsets of sCAFs as well as pCAFs (Fig. 6c-e; Extended Data Fig. 6a). These results support our findings from the 4T1 murine model and provide combinations of markers to detect distinct CAF subpopulations in human patients.
S100A4/PDPN ratio is correlated with disease outcome in two independent cohorts of breast cancer patients
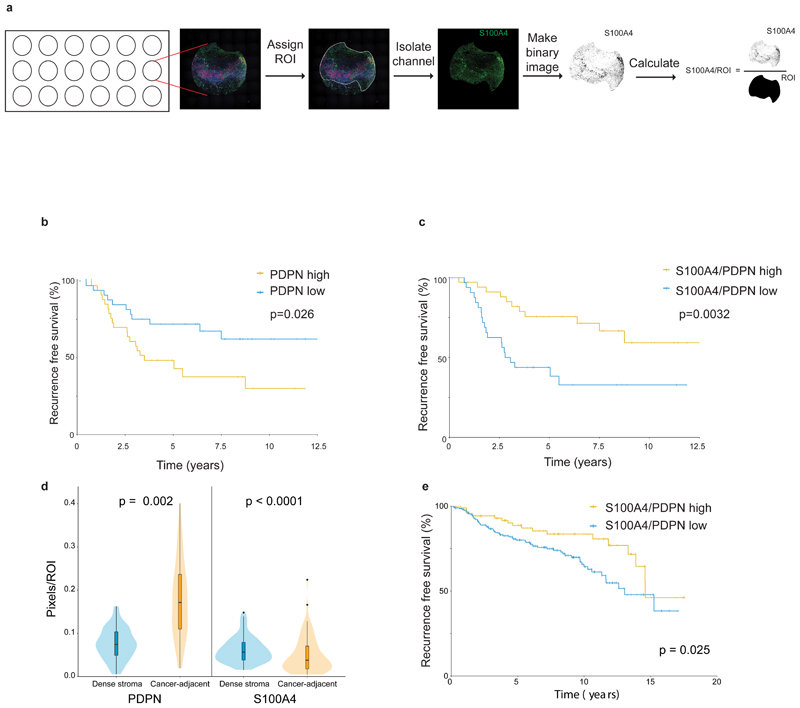
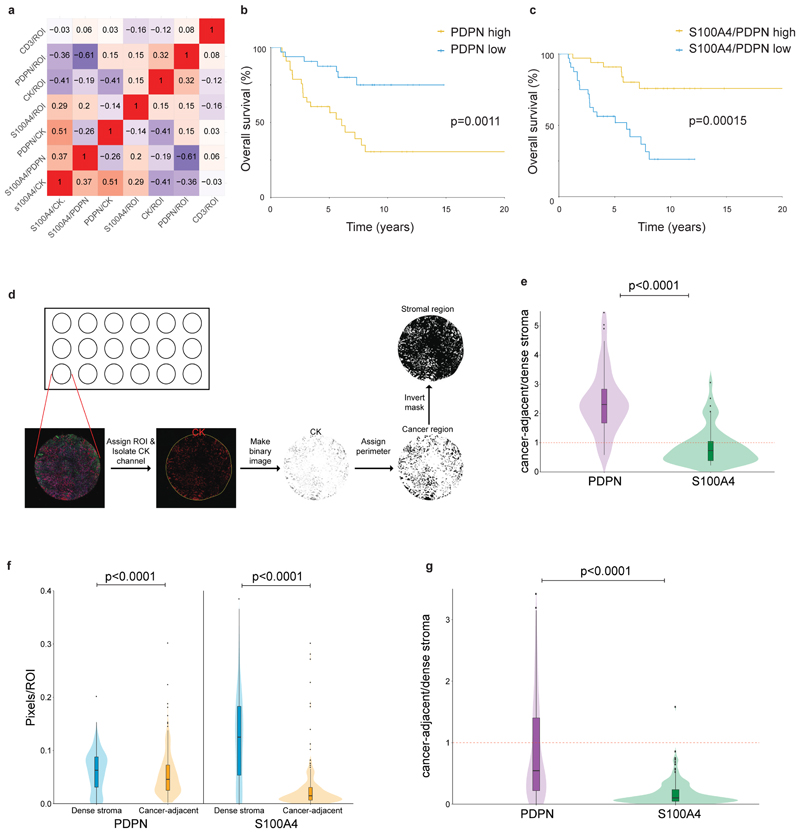
To study the clinical significance of these findings, we co-stained and scored PDPN, S100A4, and CK immunostaining in a cohort of 72 TNBC patients with long-term clinical follow-up (Supplementary Table 7). For each patient, we stained 3 cores of the tumor, calculated the average area of positive staining for each marker (Fig. 7a), as well as ratios between the 3 markers, and evaluated whether these staining scores correlate with each other (Extended Data Fig. 7a), and with disease outcome. High CK expression led to increased hazard of recurrence, as expected, and significantly correlated with poor survival (p=0.028; Supplementary Table 8). Next we evaluated our stromal markers. PDPN levels significantly correlated with disease outcome (p=0.013, Supplementary Table 8): patients whose tumors had high PDPN levels had shorter recurrence-free survival (p=0.026, Fig. 7b), as well as overall survival (p=0.0011, Extended Data Fig. 7b). S100A4 on its own was not significantly correlated with disease outcome in this cohort, yet it showed an opposite hazard ratio to that of PDPN (Supplementary Table 8). We therefore asked whether evaluation of the S100A4/PDPN ratio could improve our ability to predict patient outcome. Indeed, we observed a striking correlation between high S100A4/PDPN ratios and increased recurrence-free survival (p=0.0032) and overall survival (p=0.00015; Fig. 7c; Extended Data Fig. 7c).
Fig. 7. PDPN and S100A4 stromal staining is correlated with disease outcome in human breast cancer patients.
a, Illustration of pixel-based image analysis workflow. b-c, FFPE tumor microarray (TMA) sections from a cohort of TNBC patients (n=70) were immunostained for PDPN, S100A4 and CK and scored (see Methods section). PDPN scores (b) or S100A4/PDPN scores (c) were classified as higher or lower than the median, and the association with recurrence-free survival of n=70 patients was assessed by Kaplan Meier (KM) analysis. P-value was calculated using log rank test (two sided).d, Cancer-adjacent regions and regions of dense stroma were determined for each core in the TNBC TMA based on CK staining (see Methods section), and PDPN and S100A4 staining in each region was scored.n=70 patients, median is presented with 1st and 3rd quartiles with trimmed violin plot overlay, P-value was calculated using Wilcoxon matched pairs signed rank test, two sided.e, FFPE TMA sections of breast cancer patients from the METABRIC cohort (n=288 patients) were stained and scored for PDPN, S100A4 and CK as described in (b-c). S100A4/PDPN scores were classified as higher (n=88) or lower (n=200) than 1 (5 outlier samples were omitted from the analysis; see Methods section), and the association with recurrence-free survival was assessed by Kaplan Meier (KM) analysis. P-value was calculated using log rank test (two sided).
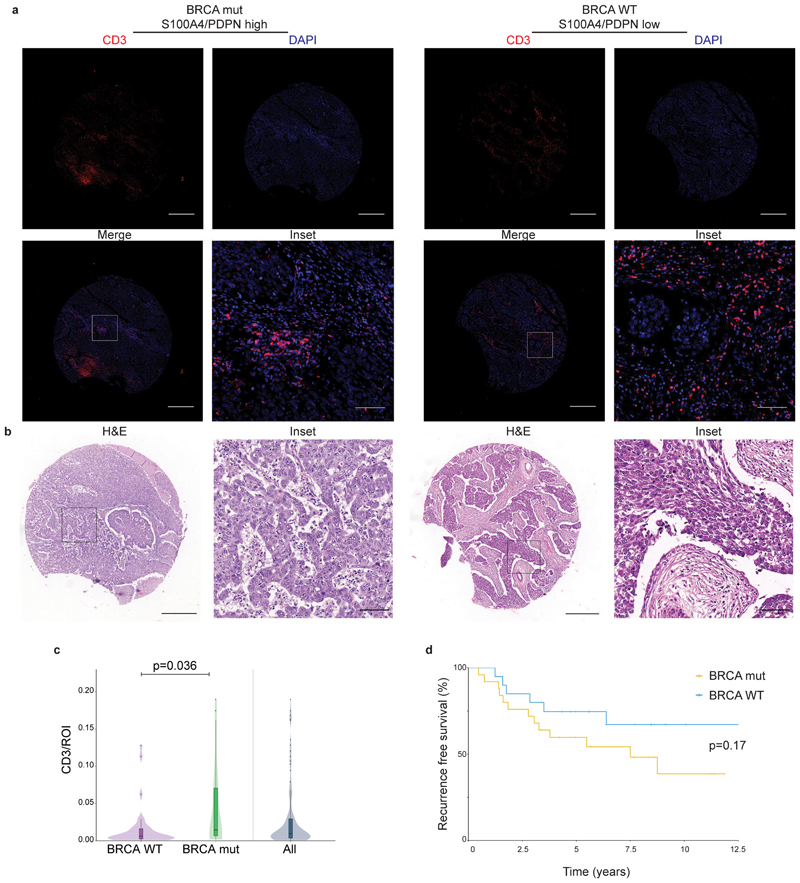
To test for possible correlation between S100A4/PDPN ratio and T-cell infiltration we stained and scored CD3 (Extended Data Fig. 8a-b). We found no significant correlation between CD3 and disease outcome (Supplementary Table 8), nor did CD3 staining correlate with any of the other cell markers tested (Extended Data Fig. 7a).
To quantitatively test the observation that pCAFs infiltrate the cancerous region more than sCAFs we defined regions of dense stroma versus cancer-adjacent regions based on CK staining, and calculated the average area of positive staining for S100A4 and PDPN in each region (Extended Data Fig. 7d). pCAFs were ~3-times more abundant in cancer-adjacent (ca) regions than in dense stroma (ds) regions (Fig. 7d; Extended Data Fig. 7e). sCAFs infiltrated the cancerous region significantly less than pCAFs, and the average ratio of caS100A4/dsS100A4 was 0.8 (Fig. 7d; Extended Data Fig. 7e).
Our initial observation that S100A4 and PDPN stain not only TNBC but also ER+ breast cancer patient samples suggested that S100A4/PDPN ratio may be a general marker of disease outcome in breast cancer. To test this we stained and scored PDPN, S100A4, and CK in an independent cohort of 293 breast cancer patients from the METABRIC study24 (Supplementary Table 9). In this cohort of mixed breast cancer subtypes, S100A4/PDPN ratios significantly correlated with disease progression (p=0.025, Fig. 7e). Similar to the TNBC cohort, high S100A4/PDPN ratios were associated with increased recurrence free survival in the METABRIC cohort (Fig. 7e). The spatial distribution of sCAFs and pCAFs was also similar in the two cohorts, with higher average caPDPN/dsPDPN than caS100A4/dsS100A4 (Extended Data Fig. 7f-g).
High S100A4/PDPN ratios are associated with BRCA mutations in TNBC
A substantial fraction of TNBC patients carry mutations in BRCA genes (in particular BRCA125), and BRCA mutations frequently lead to TNBC26. While the METABRIC cohort had very few BRCA mutated patients, in the TNBC cohort 20/45 patients (with documented BRCA status)carried such mutations (Supplementary Tables 7, 9). These patients exhibited increased T-cell infiltration (measured by CD3 staining) compared to patients with WT BRCA (Extended Data Fig. 8c), yet neither T-cell infiltration nor BRCA status correlated with survival (Extended Data Fig. 8d; Supplementary Table 8 and 10).
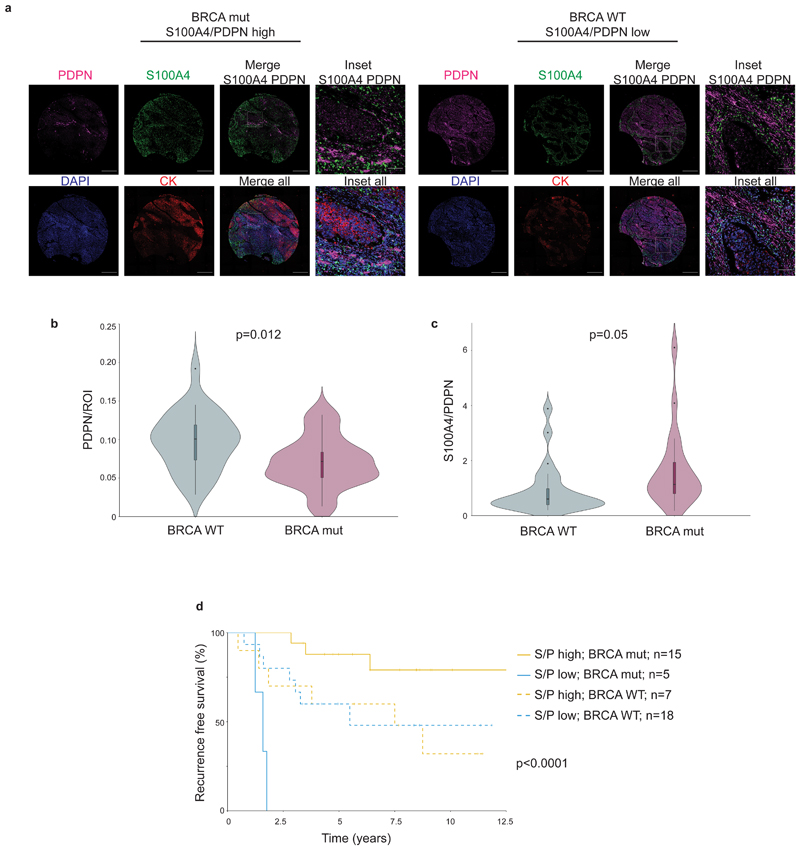
We therefore tested for possible associations between BRCA status, CAF marker expression, and survival (Fig. 8a-c; Extended Data Fig. 8b). PDPN levels and S100A4/PDPN ratio significantly correlated with BRCA1/2 mutational status (Fig. 8b-c). Patients with mutant BRCA1/2 exhibited significantly lower PDPN staining, and higher S100A4/PDPN ratios compared to BRCA WT patients (Fig. 8b-c). Moreover, multivariate Cox regression analysis of recurrence-free survival, considering S100A4/PDPN ratio and BRCA mutational status showed a strong interaction between the two parameters (Supplementary Table 10). Indeed, when stratified according to BRCA status as well as S100A4/PDPN ratio a clear separation appeared – S100A4/PDPN ratio was a significant classifier of recurrence-free survival in BRCA mutation carriers, but not in BRCA WT patients (Fig. 8d).
Fig. 8. S100A4/PDPN ratio is a classifier of recurrence-free survival in BRCA mutated TNBC.
a, Representative images of PDPN, S100A4, cytokeratin (CK) and DAPI staining in a BRCA mutated (mut) patient and a BRCA WT patient from our cohort of 72 TNBC patients. Scale bar = 500 μm; inset scale bar = 80 μm b-c, Untrimmed vase-box plots depicting PDPN (b) or S100A4/PDPN (c) staining scores (see Methods section) in BRCA WT (n=25) vs BRCA mut (n=20) patients from the TNBC cohort. Median is presented with 1st and 3rd quartiles, with untrimmed violin plot overlay. P-value was calculated using a two-sided Student’s t-test.d, Multivariate analysis through Cox PH model for the TNBC data was performed, then TNBC patients were stratified by BRCA mutational status, and the association of S100A4/PDPN scores (higher vs lower than median) with recurrence free survival was assessed by KM analysis. P-value for the model was calculated using two-sided log rank test.
Discussion
Intratumor heterogeneity is a critical driver of tumor evolution and the main source of therapeutic resistance18,27,28. Our understanding of how the TME, and in particular CAFs contribute to this heterogeneity is still lacking. Here we find that breast CAFs are comprised of diverse subpopulations that change over the course of tumor growth and metastasis. These subpopulations cluster into two prototype CAF subtypes, which we term pCAF and sCAF, based on mutually exclusive expression of PDPN in pCAFs and S100A4 in sCAFs. Establishing the relevance of our experimental findings to human disease, pCAFs and sCAFs are major constituents of human breast cancer stroma, and the ratio of S100A4/PDPN expression is a classifier of disease outcome in two independent cohorts of patients.
Recent studies used RNA-sequencing approaches to characterize the TME in different types of cancer10,14,29–33. In pancreatic cancer, two spatially separated and reversible subtypes of CAFs have been identified - myofibroblasts (myCAF), located immediately adjacent to cancer cells, and inflammatory fibroblasts (iCAF), located within the dense pancreatic tumor stroma32. In breast cancer, a population of matrix remodeling CAFs similar to myCAF was identified and termed mCAFs14. Recently, a third population of pancreatic CAFs, antigen-presenting CAFs (apCAFs) was identified30. Both myCAF and iCAF share similarities with subpopulations of the pCAFs that we have identified. In particular, iCAF share common genes with the inflammatory subpopulations of pCAF (Cxcl1, Il6), and myCAF are similar to wound healing pCAF (Acta2). In agreement with our analysis suggesting that pCAF originate from tissue resident fibroblasts, both myCAF and iCAF can be derived from tissue resident pancreatic stellate cells. apCAFs, on the other hand, share common genes with sCAFs, in particular with the antigen-presenting sCAFs (H2-Ab1, CD74, Slpi), suggesting that these CAFs may serve similar roles in the different tumor types30.
In breast cancer, CAFs were recently classified into 4 subclasses with different spatial localization based on a predefined set of cell-surface markers9. CAF-S3 in that report were S100A4HighαSMAlow, and localized away from cancer cells, as opposed to CAF-S4 which were S100A4LowαSMAHigh and localized closer to cancer cells9. CAF-S3 in that study were not molecularly analyzed, however, the localization further away from cancer cells (compared to S100A4LowαSMAHigh CAF) may suggest similarities between CAF-S3 and sCAFs. Another report identified S100A4HighαSMAlow CAFs originating from tissue resident adipocytes12. While those CAFs do not share a common morphology or common molecular characteristics with the sCAFs identified here, both reports highlight the possibility that CAFs originate from cells other than tissue resident fibroblasts.
Indeed, CAFs have heterogeneous origins10–14. Three distinct computational approaches (metacell, slingshot and ParTI) point to NMF as the most probable origin of pCAFs. The origin of sCAFs is less clear. While we cannot rule out the possibility that sCAFs originate from NMFs, this is unlikely because their transcriptional makeup is disconnected. It is also unlikely that sCAFs originated from cancer cells that have undergone EMT, though a minority of cancer cells may have escaped through the negative selection sequencing approach. Rather, we postulate that sCAFs originate from a different mesenchymal source, perhaps BM-MSCs10,34,35. sCAFs are enriched for several classic MSC markers. Moreover, clusterin (Clu), recently reported to play a tumor-promoting role in BM-MSC derived CAFs10 is among the most differentially upregulated genes in sCAFs (compared to pCAFs). These findings support the hypothesis that sCAFs are derived from MSCs that are recruited to the tumor and differentiate into CAFs. In the tumor sCAFs dynamically shift between several transcriptional programs: cell division, protein translation, and adhesion are expressed in early tumors. As tumors progress, sCAF are dynamically rewired, and at 4W a subpopulation expressing MHC class II antigen-presentation genes takes dominance. MHC class II molecules are constitutively expressed on professional antigen presenting cells (APC). In other cell types, including fibroblasts, the expression of MHC class II can be induced by stimuli such as IFN-γ 36,37, as shown for synovial fibroblasts in inflamed joints of rheumatoid arthritis38. apCAFs recently described in pancreatic cancer30 did not express co-stimulatory molecules. Similarly, we could not detect expression of co-stimulatory molecules in sCAFs. If and how activation of MHC class II in non-professional APC such as the sCAF affects immune responses will be the subject of future investigation.
Metastatic CAFs are poorly defined. In our mouse model, primary tumor CAFs and metastatic CAFs clustered together into the main CAF subtypes, suggesting that both subtypes are present in the primary site and in the metastatic site. Nevertheless, primary and metastatic CAFs exhibited distinct subpopulations within each subtype, in particular within pCAFs. These changes are probably driven, to some extent, by the different environment in the lung compared to the mammary tissue. Given the observed shift between 2W and 4W primary tumor CAFs, however, our results suggest that these changes reflect the dynamic rewiring of CAFs along tumor progression, beginning at the primary site and continuing as tumors metastasize.
The co-existence of different CAF populations, and their dynamic rewiring has prognostic and potentially therapeutic implications. In two independent patient cohorts, encompassing together all subtypes of breast cancer, those with higher sCAF/pCAF ratios had markedly improved survival. In the TNBC cohort, high ratios of sCAF/pCAF correlated not only with survival but also with BRCA mutations. BRCA mutations frequently lead to TNBC, and the DNA damage associated with these mutations leads to increased somatic mutational load, and higher T-cell infiltration26,39. It is plausible that the immune-regulatory activity of pCAFs inhibits T-cell activation whereas antigen-presenting sCAFs activate the immune system, leading to improved clinical outcome. Our findings highlight the need to define and target deleterious CAF subpopulations, while enriching potentially beneficial populations, within patient cohorts with defined genetic and transcriptional landscapes.
Methods
Ethics statement
All clinical data were collected following approval by the Sheba Medical Center Institutional Review Board (IRB; protocol # 8736-11-SMC) or Ministry of Health (MOH) IRB approval for the Israel National Biobank for Research (MIDGAM; protocol # 130-2013) or as detailed previously40. All animal studies were conducted in accordance with the regulations formulated by the Institutional Animal Care and Use Committee (IACUC; protocol # 40471217-2; 09720119-1; 00470120-2).
Human patient samples
Tumor sections from 5 ER+ and 6 TN breast cancer patients were obtained from MIDGAM under MOH IRB# 130-2013 and IRB # 8736-11-SMC and a tissue microarray (TMA) containing cores from 72 TNBC patients (3 cores per patient), with matching H&Es, and whole tissue sections from a subset of 12 patients from this cohort, were retrieved from the archives of Sheba Medical Center under IRB # 8736-11-SMC. All clinical data were collected following appropriate ethical approvals. For the TNBC cohort: approval by the Sheba Medical Center Institutional Review Board (IRB; protocol # 8736-11-SMC) with full exemption for consent form for anonymized samples. For samples collected from the Israel National Biobank for Research: Ministry of Health (MOH) IRB approval (MIDGAM; protocol # 130-2013): These samples were collected from patients who provided informed consent for collection, storage, and distribution of samples and data for use in future research studies.
A TMA containing a subset of the molecular dataset (MD) of the METABRIC study24 was obtained under appropriate ethical approval from the institutional review board for the use of biospecimens with linked pseudo-anonymized clinical data40.
Mice
BALB/c and C57BL/6 mice were purchased from Harlan Laboratories and maintained under specific-pathogen-free conditions at WIS animal facility.
Cancer Cell lines
4T1 cells expressing firefly luciferase (pLVX-Luc) were kindly provided by Dr. Zvi Granot (HUJI). E0771 cells were kindly provided by Dr. Ronen Alon (WIS). GFP-expressing 4T1 cells were generated using the FUW-GFP vector, mCherry-luc-expressing E0771 cells were generated using a luc2a-mcherry vector. 4T1 and E0771 cells were cultured in Dulbecco’s modified Eagle’s medium (DMEM; Biological industries, 01-052-1A) with 10% fetal bovine serum (FBS; Invitrogen).
Orthotopic injection to the mammary fat pad
8W old BALB/c or C57BL/6 females were injected under anaesthesia with 100,000 4T1-luc cells or 600,000 E0771 cells in ice cold PBS, into the lower left mammary fat pad.
Normal mammary fat pad isolation and dissociation
Mammary fat pads were harvested from non-tumor-bearing BALB/c females (8W old for single-cell analysis, 12W old for bulk sequencing), tissue was minced and dissociated using a gentleMACS dissociator, in the presence of enzymatic digestion solution containing 1 mg ml-1 collagenase II (Merck Millipore, 234155), 1 mg ml-1collagenase IV (Merck Millipore, C4-22) and 70 unit ml-1 DNase (Invitrogen, 18047019) in DMEM. The samples were filtered through a 70 μm cell strainer into ice cold MACS buffer (PBS with 0.5% BSA) and cells were pelleted by centrifugation at 350g, 5min, 4°C.
Primary tumor isolation and dissociation
14 or 28 days after 4T1-luc injection, animals were sacrificed and tumors were excised, dissociated, minced, and incubated with enzymatic digestion solution containing 3 mg ml-1 collagenase A (Sigma Aldrich, 11088793001) and 70 unit ml-1 DNase in RPMI 1640 (Biological industries, 01-100-1A) for 20 min at 37°C. To enrich for stromal cells, single cell suspensions were incubated with anti-EpCAM (Miltenyi, 130-105-958) and anti-CD45 (Miltenyi, 130-052-301) magnetic beads, transferred to LS columns (Miltenyi, 130-042-401) and the stromal enriched (CD45, EpCAM depleted) flow-through was collected and pelleted.
Lung metastases isolation and dissociation
To allow the growth of >1mm lung metastases, primary tumors were surgically removed under anaesthesia 2W after injection of 4T1-luc cells to the mammary fat pad. The mice were imaged every 4-6 days by in vivo imaging system (IVIS) to detect luciferase-positive lung metastases. 2-3 weeks post primary tumor removal the animals were sacrificed, metastases-bearing lungs were excised and metastases were isolated from the lungs and dissociated in gentleMACS C tubes with an enzymatic digestion solution containing collagenase A 1.5 mg ml-1, dispase II 2.5 unit ml-1 (Sigma Aldrich, D4693) and DNase I 70 unit ml-1 in RPMI 1640.
Flow cytometry and sorting
Staining was performed on single cells with antibodies detailed in Supplementary Table 11 for 30 min on ice. Single-stain controls were used for compensation of spectral overlap between fluorescent dyes. Propidium idodie (PI) was added shortly before samples were sorted. Cells were sorted with a BD FACSAria Fusion machine and data was analysed using FlowJo software (Tree Star Inc.)
Single-cell index sorting
Stained cells were single-cell-sorted as previously described15. Briefly, cells were sorted into 384-well barcoded capture plates containing 2 µl of lysis solution and barcoded poly(T) reverse-transcription (RT) primers for scRNA-seq15. The FACS Diva v8 ‘index sorting’ function was activated to record marker levels of each cell, and the intensities of all FACS markers were recorded and linked to each cell’s position within the 384-well plate41. Four empty wells per 384-well plate were kept as a no-cell control for data analysis. Plates were spun down immediately after sorting, snap frozen on dry ice and stored at −80°C until processing.
Library preparation for single-cell RNA-sequencing
Single-cell MARS-seq libraries were prepared as previously described15. In brief, mRNA from sorted cells was barcoded, converted into cDNA, and pooled. Pooled samples were linearly amplified by T7 in vitro transcription and the resulting aRNA fragmented and converted into a sequencing-ready library by tagging with pool barcodes and Illumina adapter sequences during ligation, reverse transcription and PCR. Library quality and concentration were assessed as described15.
Low-level processing and filtering
All RNA-Seq libraries were sequenced using Illumina NextSeq 500 at median sequencing depth of 28114 reads per single cell. Sequences were mapped to the mouse genome (mm10), demultiplexed, and filtered as previously described15, extracting a set of unique molecular identifiers (UMI) that define distinct transcripts in single cells for further processing. We estimated the level of spurious UMIs in the data using statistics on empty MARS-seq wells median noise (2.6%). Mapping of reads was done using HISAT (version 0.1.6; 42); reads with multiple mapping positions were excluded. Reads were associated with genes if they were mapped to an exon, using the UCSC genome browser as reference. Exons of different genes that shared genomic position on the same strand were considered a single gene with a concatenated gene symbol. Cells with less than 1000 UMIs were discarded from the analysis. After filtering, cells contained a median of 2733 unique molecules per cell. All downstream analysis was performed in R (version 3.6.0).
Data processing and clustering
The Meta-cell pipeline43 was used to derive informative genes and compute cell-to-cell similarity, to compute K-nn graph covers and derive distribution of RNA in cohesive groups of cells (or meta-cells), and to derive strongly separated clusters using bootstrap analysis and computation of graph covers on resampled data. Default parameters were used unless otherwise stated. Clustering was performed on the CD45- EpCAM- (Extended Data Fig. 1a) compartment of fifteen samples. Cells with high expression of Hbb-b1 or Ptprc were regarded as contaminants of red blood or immune cells respectively, and were discarded from subsequent analysis. Following clustering of the remaining cells (Extended Data Fig. 1d), cells with high expression of Pecam1 and Rgs5 were identified as endothelial cells and pericytes respectively, and discarded from further analysis. In addition, a group of 33 cells with markedly high expression of Mki67 and Myc was assumed a contamination of cancer cells and removed from further analysis.
Meta-cell clustering was performed over the top 10% most variable genes (high var/mean), with total expression over 50 UMI and more than 2 UMI in at least three cells, resulting in 1017 feature genes. Resulting clusters were filtered for outliers, and cells with more than 4 fold deviation in expression of at least one gene were marked as outliers and discarded from further analysis. This resulted in 43 outlier cells and retained 8033 cells for further analysis. In order to annotate the resulting meta-cells into cell types, we used the metric FPgene, mc, which signifies for each gene and meta-cell the fold change between the geometric mean of this gene within the meta-cell and the median geometric mean across all meta-cells. We used this metric to “color” meta-cells for the expression of subset specific genes such as Gsn and S100a4. Each gene was given a FP threshold and a priority index. The selected genes, priority, and fold change threshold parameters are as detailed in Supplementary Table 12.
GO enrichment analysis
Gene set enrichment analysis was done using Metascape (http://metascape.org).
Trajectory finding
To infer trajectories and align cells along developmental pseudotime, we used Slingshot19 and applied it on pCAFs of the primary tumor (2W, 4W). We chose a set of differential genes between the clusters (FDR corrected chi-square test, q < 10-3, fold change > 2). We performed PCA on the log transformed UMI, normalized to cell size. We ran Slingshot on the top five principal components, with Pdpn+ NMFs as the starting cluster.
Pareto analysis
sCAF Single-Cell Data
The gene expression dataset of NMF, 2W and 4W CAFs included 21948 genes and 6587 cells (3067 sCAFs and 3521 NMF & pCAFs). In PCA analysis of the sCAFs, cells from 2W and 4W timepoints formed a continuum whereas the Mets formed a separate cluster. We therefore excluded the Mets from ParTI analysis, which focuses on continuous expression patterns. We considered cells with a total of at least 3x10³ UMIs and genes with at least 103 UMIs, totaling 2292 cells and 790 genes. Each cell was down-sampled to 103 UMIs, each gene was log transformed and centered by subtracting its mean.
Data Dimensionality
To determine the dimensionality of the data for ParTI, we used PCHA to find the best-fit polytopes with k=3-7 vertices. We calculated the variance of the vertex positions by PCHA on bootstrapped data (resampling the cells with returns). The variance for k=3 and 4 is low, and rises sharply for k>4 (Extended Data Fig. 3f), indicating that it is not possible to determine the positions of more than 4 vertices with high reliability. In agreement with the three-dimensionality of the tetrahedron, PCA analysis indicated that the first 3 PCs explain much more variance than higher order PCs (Extended Data Fig. 3e). We concluded that 4 vertices and the first three principal components are the appropriate choice for this analysis.
Tetrahedron Significance
The variation in the vertex positions of the real data (bootstrapping) was much smaller than the variation of the vertex positions in the best-fit tetrahedron (PCHA) for 1000 shuffled datasets (p<0.001; Extended Data Fig. 3g-h). We further tested the statistical significance of the tetrahedron by the t-ratio test as described in21,44. The observed t-ratio was significantly larger than the t-ratios of shuffled datasets (p=6x10⁻³, Extended Data Fig. 3i).
Enrichment Calculation and GO analysis
We defined enriched genes for each vertex by calculating the Spearman rank correlation between the gene’s expression and the Euclidean distance of cells from the vertex. We call a gene enriched if its expression shows a correlation coefficient below -0.2 with a statistically-significant p-value controlled for multi-hypothesis testing by a false discovery rate (FDR) correction using the Bonferroni procedure with a threshold of 10-5. GO analysis was performed using MathIOmica45 with a cutoff of at least 3 genes for each GO term. To address circularity concerns stemming from using gene expression both to infer the position of the vertex and their functions, we use a leave-one-out procedure: for each enriched gene, we recompute the position of the vertices after removing the gene. We then determine which samples are closest to the new vertices, and test whether the gene is still significantly enriched close to the vertex by the same method as above.
Vertex temporal ordering
We computed the relative representation of cells from each time point (2W, 4W) between the 4 vertices (Fig. 3d). Cells from each time point were down-sampled to reach the same number (300), and the fraction of each time point in the 100 cells closest to each archetype was calculated. Error bars were calculated by bootstrapping (103).
Bulk RNA sequencing
4W tumors or normal mammary fat pads from 4 mice each were excised, 104 cells were sorted from each population as described for single cell RNA-seq, with the addition of PDPN as a positive selection marker for pCAFs (Extended Data Fig. 1a). NMF were taken from the CD45-/EpCAM- population without further selection. sCAFs were collected based on negative selection for all markers (CD45- EpCAM- PDPN-). The cells were collected directly into lysis/binding buffer (Life Technologies) and mRNA was isolated using dynabeads oligo (dT) (Life Technologies). RNA-seq was performed as previously described15. Libraries were sequenced on an Illumina NextSeq 500 machine and reads were aligned to the mouse reference genome (mm10) using STAR v2.4.2a46. Duplicate reads were filtered if they aligned to the same base and had identical UMIs. Read count was performed with HTSeq-count47 in union mode and counts were normalized using DEseq248. Representative samples from each subpopulation were used for Pearson correlation matrix (Extended Data Fig. 1h).
Tracing of host vs cancer markers in sCAFs
To test for presence of 4T1 cells in the negatively selected sCAF population we traced the LTR of a luciferase plasmid expressed in these cells. While this sequence could not be detected by scRNA-seq (due to polyA selection) we could detect it by bulk RNA-seq. We therefore counted the number of reads mapped to the LTR in different populations from bulk FACS sort and normalized these to the number of reads mapped to the house keeping gene Actin. The normalized LTR reads were 44-fold more abundant in bulk EPCAM+ cells from the tumor (that may also contain normal epithelial mammary cells) than in sCAFs (0.011 in EPCAM+ vs 0.00027 in sCAFs). We could not detect LTR reads in pCAFs and NMFs. These results suggest that the majority of sCAF do not originate from 4T1 cancer cells, however there is a low level of contamination by 4T1 cells, at least in the bulk population.
To validate these results we expressed GFP in 4T1 cells, injected these into the mammary fat pad of mice, FACS sorted tumors to remove PDPN+ and CD45+ cells, and further sorted for bulk RNA-seq of the following populations: (1) GFP+ EpCAM+ (expected to include 4T1 cells); (2) GFP+ EpCAM- (expected to include 4T1 cells that may have undergone EMT); (3) GFP- EpCAM+ (expected to include host epithelial cells); and (4) GFP- EpCAM- (expected to include sCAF, as well as a minor population of endothelial cells and pericytes). Bulk sequencing and differential gene expression analysis confirmed that GFP+ EpCAM+, GFP+ EpCAM-, and GFP- EpCAM+ populations exhibited similar patterns of gene expression, whereas GFP- EpCAM- cells were distinct, suggesting that GFP- EpCAM- PDPN- CD45- cells do not originate from cancer cells, nor do they resemble normal epithelial cells (Supplementary Table 5). The top 20 differentially upregulated genes in GFP- EpCAM- cells (i.e. sCAFs) compared to GFP+ EpCAM+ cells (i.e. 4T1 cells) contain classic stromal genes such as Cxcl12, Col3a1 and Ccl4 (Supplementary Table 5). The classic epithelial marker Krt14 is among the most differentially downregulated genes in GFP- EpCAM- cells compared to GFP+ EpCAM+ cells (Supplementary Table 5).
FACS sorting for functional assays with pCAFs
4W 4T1-luc primary tumors were dissociated into single cell suspensions, incubated with RBC lysis buffer (BioLegend 420301), and depleted of CD45+ and EpCAM+ cells as described above. For pCAF enrichment, the CD45, EpCAM depleted fraction was incubated with PDPN-biotin antibody and the PDPN-enriched cell suspension was isolated with antibiotin magnetic beads (Miltenyi, 130-090-485). The cells were stained for Ter119-PB, CD45-BV711, EpCAM-AF488, PDPN-APC, and Ly6C-PerCP/Cy5.5. PDPN+ cells were gated as described in Extended Data Fig. 1a, and sorted into Ly6C+ and Ly6C- populations.
CD8 T cell proliferation and activation assay
5*104 Ly6C+ or Ly6C- pCAFs were plated in 96-wells in RPMI 1640 supplemented with 10% FBS. Three days later CD8+ T cells were isolated from normal spleens by a positive selection kit (CD8a (Ly-2) Microbeads, mouse, Mitenyi 130-117-044), stained with 2μM CFSE, and incubated with CD3C/D28 Dynabeads™ with or without Ly6C+ or Ly6C- pCAFs in lymphocyte medium (RPMI 1640, 10% FBS, 1% MEM NEAA, 1% 0.5M HEPES buffer, 1% L-Glutamine, 1% Sodium pyruvate, 0.0004% βM-EtOH (Biological industries)). 48h later, magnetic beads were removed and the cells were analyzed by flow cytometry. CD25-BV711 and CD69-APC antibodies were used to determine CD8+ T cell activation levels, Ghost-Dye-Violet 450 (TONBO) was used to exclude dead cells and CFSE was used to determine CD8+ T cell proliferation. FACS analysis was performed using Kaluza software version 2.1 (Beckman Coulter).
Flow cytometry of pCAFs, sCAF and NMF markers
Tissues were harvested and dissociated into single cell suspensions as described above. For pCAF intracellular staining, cells were fixed with 4% PFA in PBS for 10 min, washed and resuspended in permabilization/washing buffer (PBS [-]Ca [-]Mg, 0.1% TWEEN 20 (BIO BASIC), 1% BSA) and incubated for 20 min at RT. For 4T1 tumors, cells were stained with CD45-BV711, EpCAM-PE/Cy7, PDPN-APC, Ly6C-PerCP/Cy5.5, fixed, permeabilized and intracellularly stained with αSMA-FITC. E0771-mCherry tumors were stained with Ghost-Dye-Violet 450 viability dye (TONBO), CD45-BV711, PDPN-APC, Ly6C-PerCP/Cy5.5 and then fixed, permeabilized and intracellularly stained with αSMA-FITC. For sCAF marker staining, live cells were stained with CD45-BV711, EpCAM-AF488, PDPN-APC and I-A/I-E-APC/Cy7.
Collagen deposition measurement in-vitro
PDPN+ Ly6C+ or Ly6C- CAFs were seeded after sorting until reaching confluency and seeded in at least 3 technical replicates in a concentration of 2*10^5/ml in RPMI complete medium. The cells were left for 4 days in culture to assure confluence before preforming collagen content measurement using a commercial Sirius Red collagen staining kit (Chondrex, WA, USA). Images were taken with a Leica DMI8 Wide-Field (Inverted) microscope, objective 10X/0.25, using DFC310FX color camera.
Immunohistochemistry of mouse tissues
Formalin-fixed, paraffin-embedded (FFPE) μm sections of normal mammary fat pads, tumors or metastases were deparaffinized, treated with 1% H2O2 and antigen retrieval was performed with Tris-EDTA buffer (pH 9.0). Slides were blocked with 10% normal horse serum (Vector Labs, S-2000), and the antibodies listed in Supplementary Table 11 were used. Visualization was achieved with 3,30-diaminobenzidine (DAB) as a chromogen (Vector Labs kit #SK4100). Counterstaining was performed with Mayer-hematoxylin (Sigma-Aldrich MHS-16). Images were taken with a Nikon Eclipse Ci microscope.
Immunofluorescent staining of mouse and human tissues
Whole FFPE sections from mouse and human tumors, and cores from the human TNBC and METABRIC TMAs, were deparaffinized and incubated in 10% Neutral buffered formalin (NBF prepared by 1:25 dilution of 37% formaldehyde solution in PBS). Antigen retrieval was performed with citrate buffer (pH 6.0) or with Tris-EDTA buffer (pH 9.0). Slides were blocked with 10% BSA + 0.05% Tween20 and the antibodies listed in Supplementary Table 11 were diluted in 2% BSA in 0.05% PBST and used in a multiplexed manner using the OPAL™ kit (Akoya Biosciences), each one O.N. at 4°C. We used the following staining sequences: CK → S100A4 → PDPN → DAPI (for 4T1); S100A4 → CK → PDPN → DAPI (for E0771 and for human); S100A4 → CD45 → DAPI; or CD3 → DAPI. Whole tumor sections from the human TNBC cohort were stained by either of the following sequences: Set 1: SMA → S100A4 → NT5E → HLA → PDPN; Set 2: SMA → CK → PDPN → DAPI; Set 3: S100A4 → NT5E → HLA → CK → DAPI. Each antibody was validated and optimized separately, and then MxIF was optimized. Slides of mouse and whole human tumor sections were imaged with a DMi8 Leica confocal laser-scanning microscope, using HC PL APO 20x/0.75; 40x/1.3 oil-immersion; or 60x/1.4 oil-immersion objectives and HyD SP GaAsP detectors. TMA slides were imaged with an Eclipse TI-E Nikon inverted microscope, using a CFI supper Plan Fuor 20X/0.45 and DAPI/FITC/Cy3 and Cy5 cubes. Images were acquired with cooled electron-multiplying charge-coupled device camera (IXON ULTRA 888; Andor).
Image analysis
Quantification of TMA staining was done using Fiji image processing platform49. Regions of interest (ROIs) were manually depicted to include all intact tissue areas and exclude regions of adipose tissue (due to nonspecific staining). H&Es from the TNBC TMA were used to assist in training and optimizing this step. Following background subtraction using a rolling ball with a radius of 200 pixels, the CK, S100A4, PDPN channels were thresholded using Otsu method. The threshold of CD3 (stained and analyzed separately) was set to 2500-65535. All pixels above the threshold were counted as 1, and their sum was divided by ROI (Fig. 7a). Channel/ROI scores of all replicate cores from the same patient (typically 3) were averaged and the average score was used for statistical analysis. Ratios between different stains were calculated for each core, and averaged for each patient. In the TNBC cohort, two patients were excluded from the analysis due to S100A4/PDPN values 3 SD above average. 4 patients were excluded from CD3 analysis due to unusually high background staining that could not be interpreted. All other scores collected were included in the analyses. In the METABRIC cohort 5 patients were excluded from the analysis due to S100A4/PDPN values 3 SD above average.
Regional analysis of cancer-adjacent and dense-stromal regions was performed as follows: We applied a threshold to the CK channel using Moments method and expanded the CK+ regions using the "Dilate" function six times. A mask generated from this image was used to define “cancer-adjacent” (ca) regions, and the inverse mask was used to define “dense-stromal” (ds) regions. Ratios between different stains were calculated for each region as described above. In the METABRIC cohort, due to the small size of tumor cores, the regional analysis was performed only on samples in which 0.05 < ca/total ROI < 0.95 (n=219 patients).
Analysis of overlap between CAF markers in human breast tumors was performed on MxIF staining of whole tissue FFPE sections from the TNBC cohort. Briefly, the sections were scanned by confocal microscope as described above. In cases of staining with more than 4 fluorophores we performed linear spectral unmixing. The images from each channel were then z-stacked (“Average”) and a threshold was applied using Moments method to generate masks. The number of overlapping pixels between channels was quantified using the "AND" function in the image calculator, and divided by the total number of pixels of the originating channels.
Analysis of the overlap between CAF markers in murine tumors was performed on MxIF staining of whole tissue FFPE sections. Masks for each channel were generated using Moments method. For 4T1 tumors, since CK is located only in the cytoplasm while in the mouse S100A4 is observed, in some cases, also in the nucleus, we removed the nuclear region from each channel prior to the analysis. Briefly, we applied "Fill holes" and "Watershed" on the DAPI mask, removed particles smaller than 8μm2 and created a mask from the resulting particles. The "Subtract" command was used to remove the nuclear region from each channel. The number of overlapping pixels between channels was quantified using the "AND" function and divided by the total number of pixels of the originating channels.
Object-based analysis was performed on MxIF staining (3 sets as described in the previous section) of whole tissue FFPE sections from the TNBC cohort using QuPath50 (version 0.2.0-m8). First, cells were segmented (“cell detection”) based on nuclear staining (DAPI). Next, we trained the “Random Trees” classifier to categorize cells as “pCAF”, “sCAF”; or “cancer cells” (or to ignore) based on all channels in 6-7 representative images (with SMA, MHC and NT5E channels turned off, for blindness purposes). The classifier was applied on all images from the same set (for each set we trained a different classifier), and for each marker the mean marker intensity per cell per image was calculated by the software. Cells with mean intensities greater than the 0.75 quantile (in each image) were defined as expressing a specific marker. After averaging for each patient the conditional probability of being positive for a marker (based on multiple images), given the cells for each cell and each marker, a test for the effect of cell and marker on that probability was done using ANOVA with Tukey correction for multiple comparisons. The analysis was performed separately for each of the 3 sets, similar trends were obtained across sets and the results of set 1 (in which all subset markers are present) are presented in Figure 6.
Statistics and Reproducibility
Clinical characteristics were compared by means of the Pearson χ2 test for categorical variables, and a student’s t-test for age (continuous variable). Recurrence-free and overall survival rates were obtained based on Kaplan-Meier estimates and a log rank test was performed to study the difference of recurrence-free / overall survival rates. Density estimate of the divided values was obtained using integrated vase-box plots, the means of the two genetic groups were compared using a student’s t-test. For visualization purposes, values above the two box plot whiskers were omitted from the plot, but included in the statistical analysis (7 values from Extended Data Fig. 7e, and 6 values from Extended Data Fig. 8c). Relative Risk estimates and 95%confidence intervals (CIs) were calculated utilizing Cox proportional hazard regression model for the recurrence free survival data, univariate analysis to study the effects of the variables on recurrence free survival, and multivariate analysis considering first order interaction. Dividing continuous variables: To visualize the results of the Cox proportional hazard regression model, S100A4/PDPN and PDPN/Total ROI were divided into High/Low groups by their median (in the TNBC cohort) each by their median, or by a value of 1 (in the METABRIC cohort). No statistical method was used to predetermine sample size. The investigators were blinded to clinical characteristics and outcome data upon image acquisition and image analysis. All experiments were reproducible. Preliminary IHC and MxIF staining experiments were performed on n=3-5 samples, and then all slides of the same cohort were stained and imaged together unless indicated otherwise.
Extended Data
Extended Data Fig. 1. A single cell map of breast cancer stroma.
a, Sorting strategy: All live single cells (PI negative cells after debris and doublet exclusion) staining negative for Ter119 (Red blood cells); CD45 (immune); and EpCAM (epithelial) were collected and single cell sorted. PDPN was used for index sorting of pCAFs. Data are combined from 8 independent experiments, with a total n=15 mice. FACS plots from a representative 4W tumor are shown. b-c, Quality control metrics of single cells analyzed in this study. b, Total unique molecular identifier (UMI) per cell. Cells are grouped by batch (plate) and color-coded by biological replicate (mouse). The time point for each batch is indicated. Cells with less than 1,000 UMI were discarded from the analysis. c, Fraction of analyzed cells/batch after filtering. Batches are grouped and color-coded as described in b. d, Single cell RNA-seq data from n=8987 QC positive cells staining negative for Ter119, CD45 and EpCAM was analyzed and clustered using the MetaCell algorithm, resulting in a two-dimensional projection of cells from 15 mice. 88 meta-cells were associated with 4 broad clusters, annotated and marked by color code. e, Expression of the hallmark genes for the 4 clusters presented in d on top of the two-dimensional projection of breast cancer stroma. Colors indicate log transformed UMI counts normalized to total counts per cell. f, Volcano plot displaying differentially expressed genes between Pdpn+ fibroblasts and S100a4+ fibroblasts (see also Supplementary Table 4). Marker genes for NMF, pCAF, and sCAF are highlighted. A total of n=8033 cells was analyzed using FDR adjusted two-sided chi square test. g, Fraction of cells originated from each mouse and subset, from all cells originated in their time point. Bar values represent the mean fraction values. Time points and subclasses are annotated and colored as in Fig. 1d. h, Squared Pearson correlation matrix for n=1045 genes between bulk and single-cell RNA-sequencing results for NMF, pCAF, and sCAF.
Extended Data Fig. 2. Pdpn+ fibroblasts undergo dynamic changes in gene expression and subset composition during tumor progression.
a, Cell-surface PDPN protein expression levels obtained from the sorting data were used to quantify the percent of PDPN+ and PDPN- cells in the CD45- EpCAM- stroma in the different time points.Data are combined from 7 independent experiments; n=3 mice per group. Error bars represent 95% CI of the mean. P-value of the two-way ANOVA interaction between fibroblast subtype and time point is presented.b, Pseudo-time of expression for individual metacells (color coded by functional subclasses as in Fig. 2) included in the slingshot analysis. A total of n=3465 cells was analyzed. Box plots display median bar, first–third quartile box and 5th–95th percentile whiskers. c, Distribution of cells across time points (color coded) within metacells included in the slingshot analysis. Metacell numbers and order are consistent across all figure panels and match the order in Fig. 2. d, Expression of hallmark NMF and pCAF genes (additional to those presented in Fig. 2e) across metacells (average UMI/cell), ordered by pseudo-time.
Extended Data Fig. 3. pCAFs and NMFs form a curve in gene-expression space, whereas a tetrahedron describes sCAF gene expression.
a, PCA analysis of NMF, and pCAF and sCAF from 2W and 4W, color coded according to the subclasses defined in Fig. 1c. n=3703 cells. b-c, PCA analyses for NMF and pCAF (b) and for sCAF (c) color coded as in a. n=3703 cells. d, Data projected on the four faces of the tetrahedron. e, Explained variance as a function of the number of PCs (real data) vs. random. Note that the total variance explained by the first 3 PCs, about 5%, is typical of single-cell gene expression data22. f, Variance of vertex positions as a function of the number of vertices considered, using PCHA with k=3-7 vertices. g, Variation of vertex position (bootstrapping) for the real data (ellipses color-coded as in Fig. 3) vs shuffled data (grey ellipses). h, Histogram depicting the average variation of vertex positions calculated for the real data (green) vs multiple runs of shuffled data (grey). i, Histogram depicting the ratio between the volumes of the convex hull of the data and the minimal enclosing tetrahedron (t-ratio). The t-ratio of the real data (green) is compared to t-ratios of shuffled data (1000 shuffles; grey).
Extended Data Fig. 4. PDPN and S100A4 proteins mark distinct types of cells in 4T1 mouse tumors, the majority of which are CK-negative.
a-b, Representative images of normal mammary fat pads (NMF; a) and lung metastases (Mets; b) (see Fig. 4a) stained with antibodies against the indicated proteins. n=3 mice per time point; Scale bar = 50 m, inset scale bar = 17μm. c, Quantification of the average overlap between CK, PDPN, and S100A4 staining in NMFs, primary tumors (2W and 4W) and Mets. Points represent the number of overlapping pixels between two channels, divided by the total number of pixels of the originating channels, in n=3 biological replicates (each dot is an average of 9 images per mouse). Mean ± SEM, p-values were calculated by two-way ANOVA followed by Tukey’s multiple comparisons test.
Extended Data Fig. 5. PDPN and S100A4 proteins mark distinct types of cells in E0771 mouse tumors, the majority of which are CK-negative.
a-b, E0771 cancer cells were injected into the mammary fad pad of C57BL/6 mice. 4W post injection the tumors were excised and fixed. Formalin fixed paraffin embedded (FFPE) tissue sections were immunostained with antibodies against the indicated proteins (n=4 mice in two independent experiments). Representative images from 2 different mice are shown in (a) and (b). Scale bar = 50 m, inset scale bar = 17μm. c, Quantification of the average overlap between CK, PDPN, and S100A4 staining in E0771 tumors. n=4 mice in two independent experiments, 3-7 images per mouse. Mean ±SD, P-values were calculated by two-way ANOVA correcting for multiple comparisons and were not found to be significant (p>0.05), no multiple comparison test was performed. d, FACS analysis of Ly6C and SMA expression in CD45- mCherry- PDPN+ cells freshly harvested from 4W E0771 tumors and immediately fixed. The results from n=3 biological replicates are quantified and analyzed utilizing one-way ANOVA followed by Tuckey’s multiple comparisons test, Mean ±SEM,.
Extended Data Fig. 6. Subsets of human sCAFs express MHC class II and NT5E, whereas a subset of pCAFs expresses SMA.
a-b, The overlap between S100A4, CK, MHC-II and NT5E stains (a; n=12 patients, average scores of 3 images per patient) and between PDPN, CK, and SMA stains (b; n=14 patients, average scores of 2-4 images per patient) in TNBC patients. Median is presented with 1st and 3rd quartiles, with untrimmed violin plot overlay. P-values were calculated by two-way ANOVA followed by Tuckey's multiple comparisons test. c, Representative images of MxIF staining of serial sections from the same patients presented in Fig. 6a with antibodies against the indicated proteins. Scale bar = 500 μm.; inset scale bar = 90 μm.
Extended Data Fig. 7. pCAFs tend to localize to cancer-adjacent regions more often than sCAFs in human breast cancer patients.
a, Heat map showing Pearson’s correlation coefficients of the staining scores for different cell type markers (n=70 patients). b-c, The association with overall survival of PDPN (b) or S100A4/PDPN (c) scored and classified as in Fig. 7b was assessed by KM analysis (n=70 patients, P-values were calculated using log rank test, two-sided).d, Illustration of the regional analysis workflow. e, The ratio of cancer-adjacent/dense stroma PDPN and S100A4 staining was determined for each core in the TNBC TMA (See also Fig. 7d). n=70, median is presented with 1st and 3rd quartiles with trimmed violin plot overlay, P-value was calculated using two-sided Wilcoxon matched pairs signed rank test. f-g, Cancer-adjacent regions and regions of dense stroma were determined for each core in the METABRIC TMA based on CK staining (see Methods section), PDPN and S100A4 staining in each region was scored (f) and the ratio of cancer-adjacent/dense stroma PDPN and S100A4 staining was determined (g). n=219, median is presented with 1st and 3rd quartiles with trimmed violin plot overlay, P-value was calculated using two-sided Wilcoxon matched pairs signed rank test.
Extended Data Fig. 8. BRCA status is not significantly correlated with recurrence free survival in a cohort of TNBC patients.
a, CD3 and DAPI staining was performed on n=68 patients from the TNBC cohort. Representative staining in a BRCA mutated (mut) patient and a BRCA WT patient is shown. b, Representative H&E stains of a BRCA mutated (mut) patient and a BRCA WT patient are shown (n=25 BRCA WT; n=20 BRCA mut;Serial sections of the same cores used in Fig. 8a are shown in a and b). Scale bar = 500 m; inset scale bar = 80 m. c, Box plot depicting CD3 staining scores (see Methods section) in patients with known BRCA status from our TNBC cohort (n=23 BRCA WT; n=20 BRCA mut) as well as the total TNBC cohort (All, n=68). Median is presented with 1st and 3rd quartiles with trimmed violin plot overlay. P-value was calculated using a two-sided Student’s t-test. d, TNBC patients were stratified by BRCA mutational status and the association with recurrence free survival was assessed by KM analysis. n=45, P-value was calculated using two-sided log rank test.
Supplementary Material
Reporting Summary.
Further information on research design is available in the Nature Research Reporting Summary linked to this article.
Acknowledgements
We thank O. Golani and Y. Addadi (MICC Cell Observatory, WIS) for their assistance with imaging and image analysis. We thank V. Kiss (Dept. of Biomolecular Sciences, WIS) for his assistance with imaging. We thank Z. Granot (HUJI) and R. Alon for providing us cell lines. We thank members of the Scherz-Shouval lab for valuable input on the manuscript. U.A. is supported by Cancer Research UK (grant C19767/A27145). I.A. is an Eden and Steven Romick Professorial Chair, supported by Merck KGaA, Darmstadt, Germany, the Chan Zuckerberg Initiative (CZI), the HHMI International Scholar award, the European Research Council Consolidator Grant (ERC-COG) 724471- HemTree2.0, an SCA award of the Wolfson Foundation and Family Charitable Trust, the Thompson Family Foundation, an MRA Established Investigator Award (509044), the Israel Science Foundation (703/15), the Ernest and Bonnie Beutler Research Program for Excellence in Genomic Medicine, the Helen and Martin Kimmel award for innovative investigation, the NeuroMac DFG/Transregional Collaborative Research Center Grant, an International Progressive MS Alliance/NMSS PA-1604 08459 and an Adelis Foundation grant. R.S.S is supported by the Israel Science Foundation (grants No. 401/17 and 1384/1), the European Research Council (ERC grant agreement 754320), the Israel cancer research fund, the Laura Gurwin Flug Family Fund, the Peter and Patricia Gruber Awards, the Comisaroff Family Trust, the Estate of Annice Anzelewitz, and the Estate of Mordecai M. Roshwal. R.S.S is the incumbent of the Ernst and Kaethe Ascher Career Development Chair in Life Sciences.
Footnotes
Author Contributions
G.F. designed, performed and analyzed experiments, and wrote the manuscript. O.L.-G., C.B., C.H., M.P.-F., H.L. and S.M.designed and performed the experiments. E.D, A.G., and A.M.designed and performed bioinformatic analysis. Y.S. designed and performed statistical and image analysis. R.N. assisted with image acquisition and designed image analysis. M.D., N.B.-L., I.B, H.R.A., C.C.and E.N.-G.-Y. provided clinical samples and intellectual input. C.C., M.D. and E.N.-G.-Y. edited the manuscript. U.A. directed and designed computational analysis and wrote the manuscript.I.A. directed, designed and analyzed experiments and wrote the manuscript. R.S.S. directed, designed and analyzed experiments, and wrote the manuscript.
Competing interests
The authors declare no competing financial interests.
Data Availability
Single-cell and bulk RNA sequencing data that support the findings of this study have been deposited in the Gene Expression Omnibus (GEO) under accession codes GSE149636. All other data supporting the findings of this study are available from the corresponding author on reasonable request.
Code Availability
FACS analysis was done using FACSDiva v8, FlowJo 10.1 and Kaluza 2.1 softwares.
Image analysis was done using Fiji ImageJ 1.52g and QuPath program (Version 0.2.0-m8). Read mapping of Single cell RNA-seq data was performed using HISAT version 0.1.6, followed by analysis with the custom made MetaCell package in R, see Methods for details. Gene set enrichment analysis was done using Metascape software. Statistical analysis utilized R program (version 3.6.0; R Foundation for Statistical Computing, Vienna, Austria). Packages used for analysis and visualization: tidyr v1.0.0, reshape2 v1.4.3, survival v3.1-8, survminer v0.4.6, ggplot2 v3.2.1, ggthemes v4.2.0, cowplot v1.0.0 and corrplot v0.84. Pareto data analysis was done in Wolfram Mathematica 11.3.0, with custom made Mathematica scripts. GO analysis was done with the Mathematica package MathIOmica. Scripts and auxiliary data needed to reconstruct analysis files from count matrices to full figures are available in a git repository (https://github.com/AlonLabWIS).
References
- 1.McGranahan N, et al. Clonal status of actionable driver events and the timing of mutational processes in cancer evolution. Sci Transl Med. 2015;7 doi: 10.1126/scitranslmed.aaa1408. 283ra254. [DOI] [PMC free article] [PubMed] [Google Scholar]
- 2.Pereira B, et al. The somatic mutation profiles of 2,433 breast cancers refines their genomic and transcriptomic landscapes. Nat Commun. 2016;7 doi: 10.1038/ncomms11479. 11479. [DOI] [PMC free article] [PubMed] [Google Scholar]
- 3.Tabassum DP, Polyak K. Tumorigenesis: it takes a village. Nat Rev Cancer. 2015;15:473–483. doi: 10.1038/nrc3971. [DOI] [PubMed] [Google Scholar]
- 4.Hanahan D, Coussens LM. Accessories to the crime: functions of cells recruited to the tumor microenvironment. Cancer Cell. 2012;21:309–322. doi: 10.1016/j.ccr.2012.02.022. S1535-6108(12)00082-7 [pii] [DOI] [PubMed] [Google Scholar]
- 5.Kalluri R, Zeisberg M. Fibroblasts in cancer. Nat Rev Cancer. 2006;6:392–401. doi: 10.1038/nrc1877. nrc1877 [pii] [DOI] [PubMed] [Google Scholar]
- 6.Gascard P, Tlsty TD. Carcinoma-associated fibroblasts: orchestrating the composition of malignancy. Genes Dev. 2016;30:1002–1019. doi: 10.1101/gad.279737.116. [DOI] [PMC free article] [PubMed] [Google Scholar]
- 7.Pallangyo CK, Ziegler PK, Greten FR. IKKbeta acts as a tumor suppressor in cancer-associated fibroblasts during intestinal tumorigenesis. J Exp Med. 2015;212:2253–2266. doi: 10.1084/jem.20150576. [DOI] [PMC free article] [PubMed] [Google Scholar]
- 8.Su S, et al. CD10(+)GPR77(+) Cancer-Associated Fibroblasts Promote Cancer Formation and Chemoresistance by Sustaining Cancer Stemness. Cell. 2018;172:841–856 e816. doi: 10.1016/j.cell.2018.01.009. [DOI] [PubMed] [Google Scholar]
- 9.Costa A, et al. Fibroblast Heterogeneity and Immunosuppressive Environment in Human Breast Cancer. Cancer Cell. 2018;33:463–479 e410. doi: 10.1016/j.ccell.2018.01.011. [DOI] [PubMed] [Google Scholar]
- 10.Raz Y, et al. Bone marrow-derived fibroblasts are a functionally distinct stromal cell population in breast cancer. J Exp Med. 2018;215:3075–3093. doi: 10.1084/jem.20180818. [DOI] [PMC free article] [PubMed] [Google Scholar]
- 11.Cirri P, Chiarugi P. Cancer associated fibroblasts: the dark side of the coin. Am J Cancer Res. 2011;1:482–497. [PMC free article] [PubMed] [Google Scholar]
- 12.Bochet L, et al. Adipocyte-derived fibroblasts promote tumor progression and contribute to the desmoplastic reaction in breast cancer. Cancer Res. 2013;73:5657–5668. doi: 10.1158/0008-5472.CAN-13-0530. [DOI] [PubMed] [Google Scholar]
- 13.Sugimoto H, Mundel TM, Kieran MW, Kalluri R. Identification of fibroblast heterogeneity in the tumor microenvironment. Cancer Biol Ther. 2006;5:1640–1646. doi: 10.4161/cbt.5.12.3354. [DOI] [PubMed] [Google Scholar]
- 14.Bartoschek M, et al. Spatially and functionally distinct subclasses of breast cancer-associated fibroblasts revealed by single cell RNA sequencing. Nat Commun. 2018;9 doi: 10.1038/s41467-018-07582-3. 5150. [DOI] [PMC free article] [PubMed] [Google Scholar]
- 15.Jaitin DA, et al. Massively parallel single-cell RNA-seq for marker-free decomposition of tissues into cell types. Science. 2014;343:776–779. doi: 10.1126/science.1247651. [DOI] [PMC free article] [PubMed] [Google Scholar]
- 16.Baran Y, et al. MetaCell: analysis of single-cell RNA-seq data using K-nn graph partitions. Genome Biol. 2019;20:206. doi: 10.1186/s13059-019-1812-2. [DOI] [PMC free article] [PubMed] [Google Scholar]
- 17.Yates LR, et al. Subclonal diversification of primary breast cancer revealed by multiregion sequencing. Nat Med. 2015;21:751–759. doi: 10.1038/nm.3886. [DOI] [PMC free article] [PubMed] [Google Scholar]
- 18.Murtaza M, et al. Multifocal clonal evolution characterized using circulating tumour DNA in a case of metastatic breast cancer. Nat Commun. 2015;6 doi: 10.1038/ncomms9760. 8760. [DOI] [PMC free article] [PubMed] [Google Scholar]
- 19.Street K, et al. Slingshot: cell lineage and pseudotime inference for single-cell transcriptomics. BMC Genomics. 2018;19:477. doi: 10.1186/s12864-018-4772-0. [DOI] [PMC free article] [PubMed] [Google Scholar]
- 20.Karnoub AE, et al. Mesenchymal stem cells within tumour stroma promote breast cancer metastasis. Nature. 2007;449:557–563. doi: 10.1038/nature06188. nature06188 [pii] [DOI] [PubMed] [Google Scholar]
- 21.Hart Y, et al. Inferring biological tasks using Pareto analysis of high-dimensional data. Nat Methods. 2015;12:233–235. doi: 10.1038/nmeth.3254. 233 p following 235. [DOI] [PubMed] [Google Scholar]
- 22.Korem Y, et al. Geometry of the Gene Expression Space of Individual Cells. PLoS Comput Biol. 2015;11:e1004224. doi: 10.1371/journal.pcbi.1004224. [DOI] [PMC free article] [PubMed] [Google Scholar]
- 23.Adler M, Korem Kohanim Y, Tendler A, Mayo A, Alon U. Continuum of Gene-Expression Profiles Provides Spatial Division of Labor within a Differentiated Cell Type. Cell Syst. 2019 doi: 10.1016/j.cels.2018.12.008. [DOI] [PubMed] [Google Scholar]
- 24.Rueda OM, et al. Dynamics of breast-cancer relapse reveal late-recurring ER-positive genomic subgroups. Nature. 2019;567:399–404. doi: 10.1038/s41586-019-1007-8. [DOI] [PMC free article] [PubMed] [Google Scholar]
- 25.Peshkin BN, Alabek ML, Isaacs C. BRCA1/2 mutations and triple negative breast cancers. Breast Dis. 2010;32:25–33. doi: 10.3233/BD-2010-0306. [DOI] [PMC free article] [PubMed] [Google Scholar]
- 26.Nolan E, et al. Combined immune checkpoint blockade as a therapeutic strategy for BRCA1 mutated breast cancer. Sci Transl Med. 2017;9 doi: 10.1126/scitranslmed.aal4922. [DOI] [PMC free article] [PubMed] [Google Scholar]
- 27.Almendro V, et al. Inference of tumor evolution during chemotherapy by computational modeling and in situ analysis of genetic and phenotypic cellular diversity. Cell Rep. 2014;6:514–527. doi: 10.1016/j.celrep.2013.12.041. [DOI] [PMC free article] [PubMed] [Google Scholar]
- 28.Lambert G, et al. An analogy between the evolution of drug resistance in bacterial communities and malignant tissues. Nat Rev Cancer. 2011;11:375–382. doi: 10.1038/nrc3039. [DOI] [PMC free article] [PubMed] [Google Scholar]
- 29.Costa-Silva B, et al. Pancreatic cancer exosomes initiate pre-metastatic niche formation in the liver. Nat Cell Biol. 2015;17:816–826. doi: 10.1038/ncb3169. [DOI] [PMC free article] [PubMed] [Google Scholar]
- 30.Elyada E, et al. Cross-Species Single-Cell Analysis of Pancreatic Ductal Adenocarcinoma Reveals Antigen-Presenting Cancer-Associated Fibroblasts. Cancer Discov. 2019;9:1102–1123. doi: 10.1158/2159-8290.CD-19-0094. [DOI] [PMC free article] [PubMed] [Google Scholar]
- 31.Li H, et al. Dysfunctional CD8 T Cells Form a Proliferative, Dynamically Regulated Compartment within Human Melanoma. Cell. 2019;176:775–789 e718. doi: 10.1016/j.cell.2018.11.043. [DOI] [PMC free article] [PubMed] [Google Scholar]
- 32.Ohlund D, et al. Distinct populations of inflammatory fibroblasts and myofibroblasts in pancreatic cancer. J Exp Med. 2017;214:579–596. doi: 10.1084/jem.20162024. [DOI] [PMC free article] [PubMed] [Google Scholar]
- 33.Tirosh I, et al. Dissecting the multicellular ecosystem of metastatic melanoma by single-cell RNA-seq. Science. 2016;352:189–196. doi: 10.1126/science.aad0501. [DOI] [PMC free article] [PubMed] [Google Scholar]
- 34.Ohlund D, Elyada E, Tuveson D. Fibroblast heterogeneity in the cancer wound. J Exp Med. 2014;211:1503–1523. doi: 10.1084/jem.20140692. [DOI] [PMC free article] [PubMed] [Google Scholar]
- 35.Quante M, et al. Bone marrow-derived myofibroblasts contribute to the mesenchymal stem cell niche and promote tumor growth. Cancer Cell. 2011;19:257–272. doi: 10.1016/j.ccr.2011.01.020. S1535-6108(11)00042-0 [pii] [DOI] [PMC free article] [PubMed] [Google Scholar]
- 36.Ilangumaran S, et al. A positive regulatory role for suppressor of cytokine signaling 1 in IFN-gamma-induced MHC class II expression in fibroblasts. J Immunol. 2002;169:5010–5020. doi: 10.4049/jimmunol.169.9.5010. [DOI] [PubMed] [Google Scholar]
- 37.Waldburger JM, Suter T, Fontana A, Acha-Orbea H, Reith W. Selective abrogation of major histocompatibility complex class II expression on extrahematopoietic cells in mice lacking promoter IV of the class II transactivator gene. J Exp Med. 2001;194:393–406. doi: 10.1084/jem.194.4.393. [DOI] [PMC free article] [PubMed] [Google Scholar]
- 38.Boots AM, Wimmers-Bertens AJ, Rijnders AW. Antigen-presenting capacity of rheumatoid synovial fibroblasts. Immunology. 1994;82:268–274. [PMC free article] [PubMed] [Google Scholar]
- 39.Lord CJ, Ashworth A. BRCAness revisited. Nat Rev Cancer. 2016;16:110–120. doi: 10.1038/nrc.2015.21. [DOI] [PubMed] [Google Scholar]
- 40.Curtis C, et al. The genomic and transcriptomic architecture of 2,000 breast tumours reveals novel subgroups. Nature. 2012;486:346–352. doi: 10.1038/nature10983. [DOI] [PMC free article] [PubMed] [Google Scholar]
- 41.Paul F, et al. Transcriptional Heterogeneity and Lineage Commitment in Myeloid Progenitors. Cell. 2015;163:1663–1677. doi: 10.1016/j.cell.2015.11.013. [DOI] [PubMed] [Google Scholar]
- 42.Kim D, Langmead B, Salzberg SL. HISAT: a fast spliced aligner with low memory requirements. Nat Methods. 2015;12:357–360. doi: 10.1038/nmeth.3317. [DOI] [PMC free article] [PubMed] [Google Scholar]
- 43.Giladi A, et al. Single-cell characterization of haematopoietic progenitors and their trajectories in homeostasis and perturbed haematopoiesis. Nat Cell Biol. 2018;20:836–846. doi: 10.1038/s41556-018-0121-4. [DOI] [PubMed] [Google Scholar]
- 44.Shoval O, et al. Response to comment on "Evolutionary trade-offs, Pareto optimality, and the geometry of phenotype space". Science. 2013;339:757. doi: 10.1126/science.1228921. [DOI] [PubMed] [Google Scholar]
- 45.Mias GI, et al. MathIOmica: An Integrative Platform for Dynamic Omics. Sci Rep. 2016;6 doi: 10.1038/srep37237. 37237. [DOI] [PMC free article] [PubMed] [Google Scholar]
- 46.Dobin A, et al. STAR: ultrafast universal RNA-seq aligner. Bioinformatics. 2013;29:15–21. doi: 10.1093/bioinformatics/bts635. [DOI] [PMC free article] [PubMed] [Google Scholar]
- 47.Anders S, Pyl PT, Huber W. HTSeq--a Python framework to work with high-throughput sequencing data. Bioinformatics. 2015;31:166–169. doi: 10.1093/bioinformatics/btu638. [DOI] [PMC free article] [PubMed] [Google Scholar]
- 48.Love MI, Huber W, Anders S. Moderated estimation of fold change and dispersion for RNA-seq data with DESeq2. Genome Biol. 2014;15:550. doi: 10.1186/s13059-014-0550-8. [DOI] [PMC free article] [PubMed] [Google Scholar]
- 49.Schindelin J, et al. Fiji: an open-source platform for biological-image analysis. Nat Methods. 2012;9:676–682. doi: 10.1038/nmeth.2019. [DOI] [PMC free article] [PubMed] [Google Scholar]
- 50.Bankhead P, et al. QuPath: Open source software for digital pathology image analysis. Sci Rep. 2017;7 doi: 10.1038/s41598-017-17204-5. 16878. [DOI] [PMC free article] [PubMed] [Google Scholar]
Associated Data
This section collects any data citations, data availability statements, or supplementary materials included in this article.
Supplementary Materials
Data Availability Statement
Single-cell and bulk RNA sequencing data that support the findings of this study have been deposited in the Gene Expression Omnibus (GEO) under accession codes GSE149636. All other data supporting the findings of this study are available from the corresponding author on reasonable request.
FACS analysis was done using FACSDiva v8, FlowJo 10.1 and Kaluza 2.1 softwares.
Image analysis was done using Fiji ImageJ 1.52g and QuPath program (Version 0.2.0-m8). Read mapping of Single cell RNA-seq data was performed using HISAT version 0.1.6, followed by analysis with the custom made MetaCell package in R, see Methods for details. Gene set enrichment analysis was done using Metascape software. Statistical analysis utilized R program (version 3.6.0; R Foundation for Statistical Computing, Vienna, Austria). Packages used for analysis and visualization: tidyr v1.0.0, reshape2 v1.4.3, survival v3.1-8, survminer v0.4.6, ggplot2 v3.2.1, ggthemes v4.2.0, cowplot v1.0.0 and corrplot v0.84. Pareto data analysis was done in Wolfram Mathematica 11.3.0, with custom made Mathematica scripts. GO analysis was done with the Mathematica package MathIOmica. Scripts and auxiliary data needed to reconstruct analysis files from count matrices to full figures are available in a git repository (https://github.com/AlonLabWIS).


