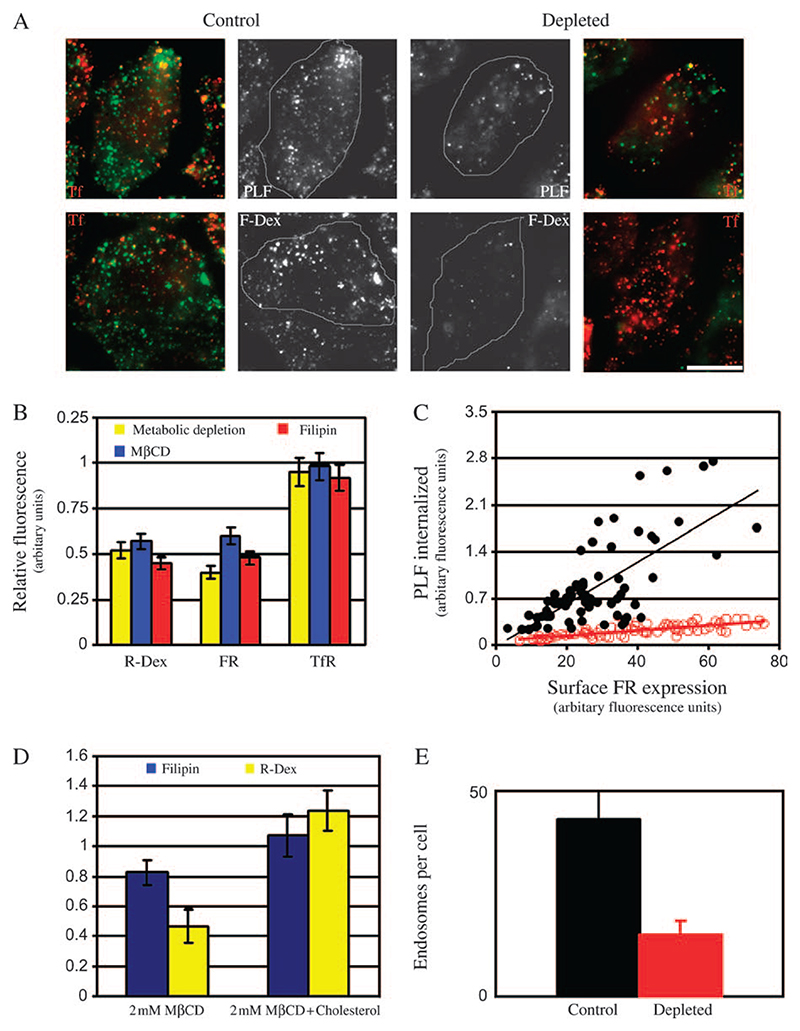
Figure 1. Depletion of cholesterol from cells blocks endocytosis via the GEEC pathway of endocytosis.
A) Control (left panels) or cholesterol-depleted (metabolic treatment; right panels) FR-GPI-expressing (FRαTb) CHO cells were incubated for 2 min at 37°C with either A568-Tf and PLF (top panel) or A568-Tf and F-Dex (green) (lower panel), washed, fixed and imaged on high-resolution wide-field microscope. Grayscale images of PLF/F-Dex (green) and A568-Tf-labelled TfR (red)-containing structures were pseudocoloured and colour merged. Scale bar, 10 μm. B) Histogram shows the extent of uptake (5 min) in cells depleted of cholesterol relative to control cells (set to 1), for indicated endocytic tracers [R-Dex, PLF (FR-GPI) and A568-Tf (TfR)]. Cholesterol was depleted via metabolic depletion (yellow bar), of treatment with MβCD (blue) or filipin (red). Values are wt. mean ± SEM obtained across three to five experiments each. C) Scatter plot shows uptake of FR-GPI determined by PLF fluorescence, after a 5-min pulse in control (filled circles) and metabolically depleted cells (open circles) plotted against the respective surface expression of FR-GPI (as marked by PLR). Similar data were obtained from three independent experiments. D) Histogram shows the extent of filipin staining and fluid uptake in cholesterol-depleted and cholesterol-replenished cells, expressed relative to control cells (value of controls set to 1). Cells were treated with 2 mM MβCD for 30 min. Cholesterol was replenished in depleted cells by incubating them with 2 mM MβCD–cholesterol complexes. Control, depleted and replenished cells were stained with filipin to ascertain changes in cholesterol level. Error bars represent wt. mean ± SEM. E) Histogram shows the number of GEECs as marked by PLF and TMR-dextran uptake after a 2-min pulse in control (black bar) and cholesterol-depleted cells (red bar). Bars represented are wt. mean ± SEM obtained across two experiments.

