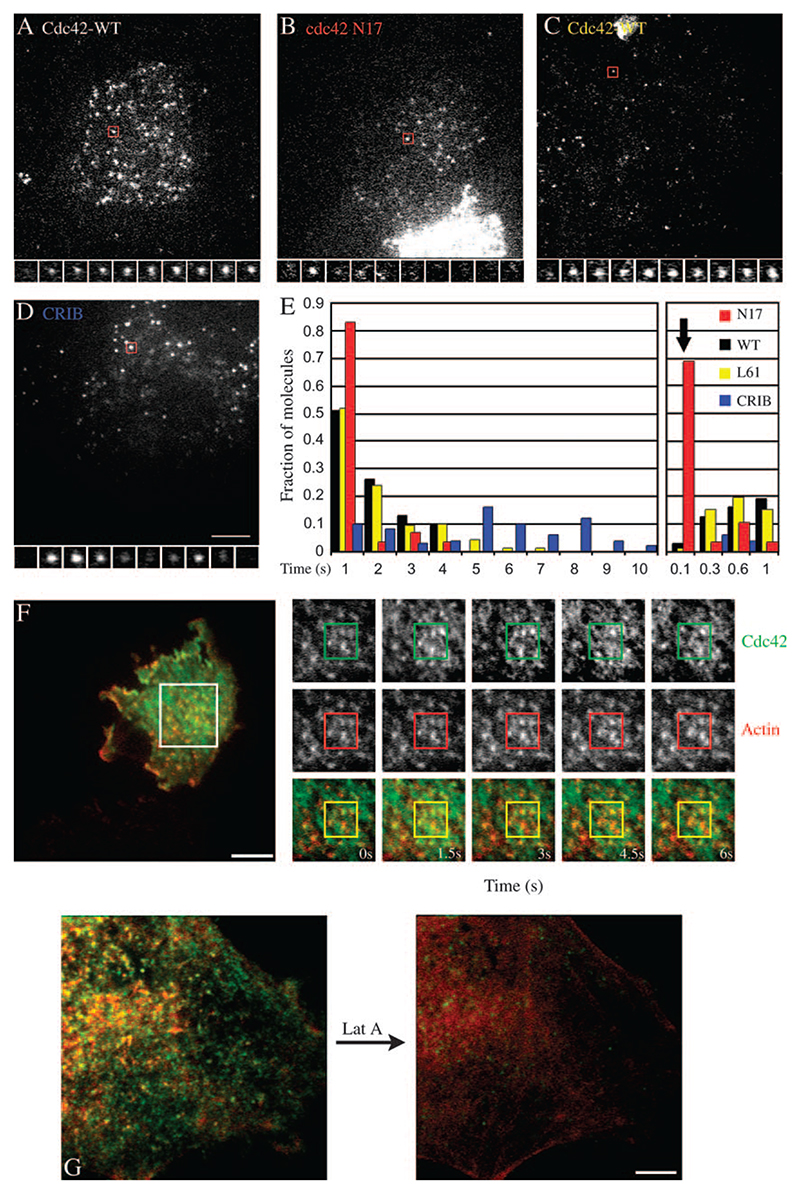
Figure 6. Single-molecule events of Cdc42 and CRIB domain of N-WASP.
A–D) FRαTb cells were transfected with GFP-Cdc42-WT, GFP-Cdc42-N17, GFP-Cdc42-L61 or GFP-CRIB DNA constructs, and only cells expressing very low levels of fusion protein were imaged under TIRF illumination with charge coupled device (CCD) cameras. Images and montage taken from videos (Video S4) show single molecules that dwell at a particular subresolution spot indicate long-lived spots in the case of Cdc42-WT and Cdc42-L61 GFP variants, while the GFP-Cdc42-N17 isoform appears only transiently on the membrane. Similarly, stabilized molecules are also demonstrated by GFP-CRIB albeit with long residence times (D). E) Histogram shows the distribution of residence times of Cdc42-WT, Cdc42-L61, Cdc42-N17 and GFP-CRIB DNA molecules on the plasma membrane. Note that a majority of N17 molecules reside for just 100 ms (one frame) in a video and residence time is similar to GFP molecules expressed in cytosol in the same cells (bold arrow); only a small fraction of trajectories exhibit any persistence, and even these show large diffusive trajectories (8–20 cells used for calculation. Each set repeated at least twice). F) FRαTb cells co-expressing Cherry-actin and GFP-Cdc42 were imaged live at 37°C under TIRF illumination, using sequential excitation of both probes. Images and the montage from a video (images were acquired at 1.5-s time; Video 2) show regions where Cdc42 and actin are co-enriched in small dynamic punctate structures. (Scale 10 μm). G) FRαTb cells were transfected with GFP-Cdc42 (green) and Cherry-actin (red) and imaged live, with two-colour TIR illumination (depth ∼100 nm). Cells were treated with Lat A, 4 μM for 2 min, and images of GFP-Cdc42 and PLR was collected before and after treatment. (Scale 5 μm).

