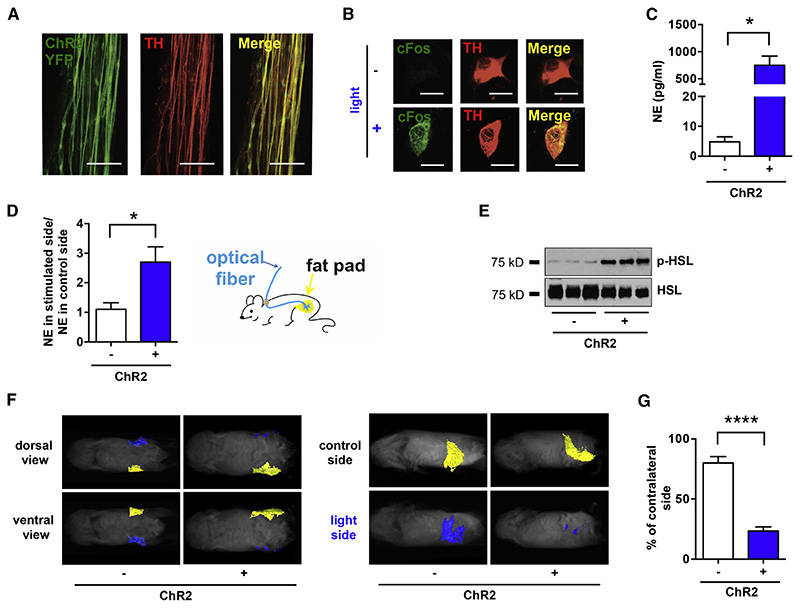
Figure 4. Optogenetic Stimulation of SNS Neurons in Fat is Sufficient to Drive Lipolysis.
(A) Complete co-localization of YFP (green) and TH (red), shown by immunohistochemistry of nerve bundles dissected from the inguinal fat pads of TH-Cre; LSLS-ChR2-YFP. (B) C-Fos (green) induction in cultured SNS neurons after optogenetic activation. (C) Ex vivo NE release upon optogenetic stimulation of sympathetic SCG explants isolated from TH-Cre; LSL-ChR2-YFP mice and LSL-ChR2-YFP control mice (*p< 0.05, n=3-6). Results are shown as mean ± SEM. (D) In vivo NE release in subcutaneous fat upon optogenetic stimulation of sympathetic neurons in white adipose tissues of TH-Cre; LSL-ChR2-YFP and LSL-ChR2-YFP control mice that were subcutaneously implanted with optical fibers targeting the inguinal fat pad (*p<0.05, n=8). Results are shown as mean ± SEM. (E) Immunoblot analysis of phosphorylated HSL in total protein extracts of subcutaneous fats of TH-Cre; LSL-ChR2-YFP and LSL-ChR2-YFP control mice that were subcutaneously implanted with optical fibers targeting the inguinal fat pad and optogenetically stimulated for 2 weeks (details in Experimental Procedures section). (F) MRI-guided visualization of fat in TH-Cre; LSL-ChR2-YFP and LSL-ChR2-YFP control mice that were optogenetically stimulated for 4 weeks (yellow is control inguinal fat pat, blue is light-stimulated fat pad; details in Experimental Procedures section). (G) Quantification of fat reduction in stimulated side versus the contralateral control side (****p<0.0001, n=6). Results are shown as mean ± SEM. See also Movie S1 and S2.

