

SUMMARY
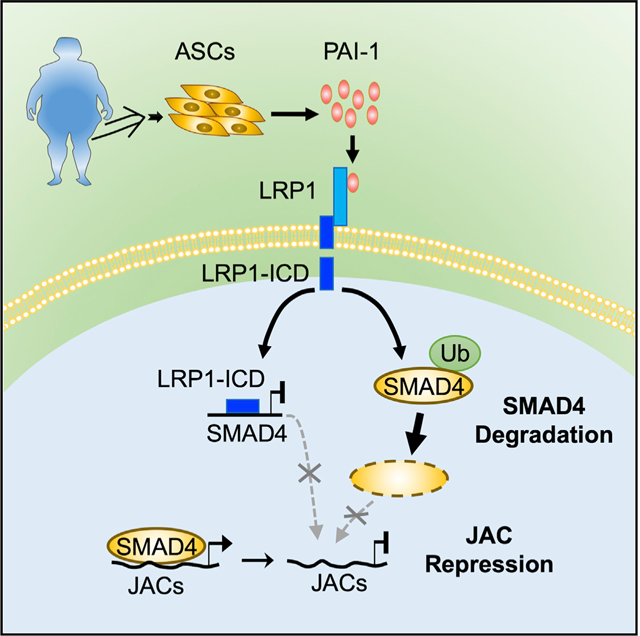
While plasminogen activator inhibitor-1 (PAI-1) is known to potentiate cellular migration via proteolytic regulation, this adipokine is implicated as an oncogenic ligand in the tumor microenvironment. To understand the underlying paracrine mechanism, here, we conduct transcriptomic analysis of 1,898 endometrial epithelial cells (EECs) exposed and unexposed to PAI-1-secreting adipose stromal cells. The PAI-1-dependent action deregulates crosstalk among tumor-promoting and tumor-repressing pathways, including transforming growth factor β (TGF-β). When PAI-1 is tethered to lipoprotein receptor-related protein 1 (LRP1), the internalized signaling causes downregulation of SMAD4 at the transcriptional and post-translational levels that attenuates TGF-β-related transcription programs. Repression of genes encoding the junction and adhesion complex preferentially occurs in SMAD4-underexpressed EECs of persons with obesity. The findings highlight a role of PAI-1 signaling that renders ineffective intercellular communication for the development of adiposity-associated endometrial cancer.
Graphical Abstract
In Brief
Lin et al. demonstrate that PAI-1 secreted by adipose stromal cells interacts with LRP1 to repress TGF-β/SMAD4-regulated genes linked to cellular junction and adhesion complexes. This action disrupts cell-cell communication and facilitates the development of obesity-driven endometrial cancer.
INTRODUCTION
Type 1 endometrioid endometrial cancers are often low grade and early stage, arising from the epithelial lining of the uterus (Kost et al., 2016; Onstad et al., 2016). There has been an increase in the incidence of this cancer type for the past two decades, due in part to the increasing rate of obesity (Onstad et al., 2016; Rota et al., 2016; Soliman et al., 2005). Of all cancers showing a positive correlation between body mass index (BMI) and incidence, endometrial cancer exhibits the strongest association with obesity (Sahoo et al., 2018). While it has long been theorized that the endometrial microenvironment aberrantly influences gene expression profiles and consequential neoplastic output of epithelial cells, the contribution of adiposity to this tumorigenic process has not been well elucidated (Onstad et al., 2016; Soliman et al., 2005). During weight gain in humans and mouse models, accumulation of visceral white adipose tissues, including the parametrial fat pad in proximity to the uterus, releases adipokines and hormones to disrupt local and systemic lipid homeostasis (Chusyd et al., 2016; Zhang et al., 2010).
In addition to these circulating factors, adipose tissues disseminate adipocytes, immune cells, and other cell types into the lymphatic and vascular systems (Escobedo and Oliver, 2017; Ghosh et al., 2014). One of these cellular components that cannot be overlooked is adipose stromal cells (ASCs), which are adipocyte progenitors (Zhang et al., 2010). When released from adipose tissues, ASCs target distal organ sites through chemokine gradients (Zhang et al., 2016). Upon infiltrating into the tumor microenvironment, these progenitors can differentiate into myofibroblasts to remodel extracellular matrix architecture (Seo et al., 2015). Embedded ASCs are also known to stimulate angiogenesis and release cytokines to promote inflammatory responses (Carmeliet, 2003; O’Sullivan et al., 2018). Removal of ASCs with pro-apoptotic peptides reduces tumor vascularization and growth in mouse models (Daquinag et al., 2017). These actions of ASCs in the microenvironment play a role in cancer development.
Aside from having an indirect influence on tumorigenesis through fibroblastic and vascular differentiation, emerging evidence indicates that ASCs have a direct effect on tumor cells through paracrine signaling (Freese et al., 2015; Ishii et al., 2018). For example, ASCs activate C-C motif chemokine ligand 5 (CCL5) signaling of cancer cells through interactions with chemokine receptors to enhance their proliferative and metastatic potential (Kauts et al., 2013). Another ASC-secreted adipokine is leptin bound to its surface receptor to promote epithelial-to-mesenchymal transition in cancer cells (Strong et al., 2015). In addition, ASCs may enhance anti-inflammatory differentiation of immune cells in the tumor microenvironment (O’Sullivan et al., 2018). While these findings confirm a role of ASCs in cancer development and progression, the mechanistic aspects of ASC contribution to endometrial tumorigenesis are still poorly understood.
We have recently shown that the plasminogen activator inhibitor-1 (PAI-1) is a major adipokine secreted by ASCs, exerting paracrine influences on endometrial epithelial cells (EECs) in vitro (Polusani et al., 2019). While PAI-1 is a serine protease inhibitor well known for modulating extracellular matrix proteins (Czekay et al., 2011), our initial findings suggest that PAI-1 acts as an oncogenic ligand transducing intracellular signals that deregulate transcriptional programs of EECs (Polusani et al., 2019). This paracrine action may bring about heterogeneous alterations among different epithelial cell populations with pro-tumorigenic effects (Polusani et al., 2019). Prompted by these findings, we conducted single-cell RNA sequencing (scRNA-seq) and analyzed signaling pathways and cell-fate trajectories of heterogeneous cellular subpopulations after EEC exposure to PAI-1-secreting ASCs in vitro. We then mechanistically determined how PAI-1 signaling is internalized through protein-protein interactions, leading to disruption of transforming growth factor β (TGF-β)/SMAD-modulated transcription. To validate these transcriptomic findings in vivo, a single-cell mass cytometry (i.e., cytometry by time-of-flight [CyTOF]) marker panel was built to analyze proteomic profiles of primary endometrial tumor subpopulations and to assess intra- and inter-tumor heterogeneity associated with obesity. Here, we set out to demonstrate that PAI-1 initiates signaling cascades altering a transcriptional program in EECs, in addition to its known role in cell-surface proteolytic regulation.
RESULTS
ASC Infiltration in Tumor Microenvironments of Persons with Obesity
Consistent with previous publications (Lachance et al., 2006; Soliman et al., 2005), in silico analysis of The Cancer Genome Atlas (TCGA) endometrial cancer cohort demonstrated that obesity occurs more frequently in endometrioid (or type 1) endometrial cancers (Figure 1A). In these cancers, patients diagnosed at ages <50 and 50–59 years tended to have higher BMIs than older patients (>60 years old) (Figure 1B). In our South Texas patient population, the obese group comprised a large proportion of patients in the <50-years age group (Table S1). To control for this age group, embedded tumor samples from persons without obesity (BMI < 30 kg/m2) and persons with obesity (BMI ≥ 30 kg/m2) were examined for ASC infiltration within the endometrial tumor microenvironment. We conducted an immunofluorescent analysis of tissue microarrays in 35 primary endometrial tumors and 6 non-cancerous age matched controls using the white adipose tissue 7 (WAT7) peptide that binds specifically to the surface of ASCs (Table S1) (Daquinag et al., 2017, 2016). The tissue sections from tumors of persons without obesity or non-cancerous controls showed negative or low WAT7 staining, while an increase in the number of WAT7 stained granules was seen in the endometrial stroma of persons with obesity and cancer (Figure 1C). Importantly, this increase was positively correlated with BMI, consistent with a process of infiltration of WAT7-positive ASCs into the tumor microenvironment of persons with obesity (p < 0.0001; Figure 1D). We then assessed which factors are commonly secreted by ASCs in vitro using a multiplex assay of adipokines and cytokines (Polusani et al., 2019). The result showed that PAI-1 appeared to be the most abundant adipokine (i.e., 2 orders of magnitude greater than the other 10 factors) detected in 10 different ASC-conditioned media (ASC-CM; Figure S1). While increased levels of secreted PAI-1 were not correlated with the BMI status of women from whom these ASC samples were derived (data not shown), we suggest that more ASCs are accumulated in the endometrial microenvironment of women with increasing levels of obesity.
Figure 1. ASC Infiltration in Endometrial Tumor Microenvironments of Persons with Obesity.
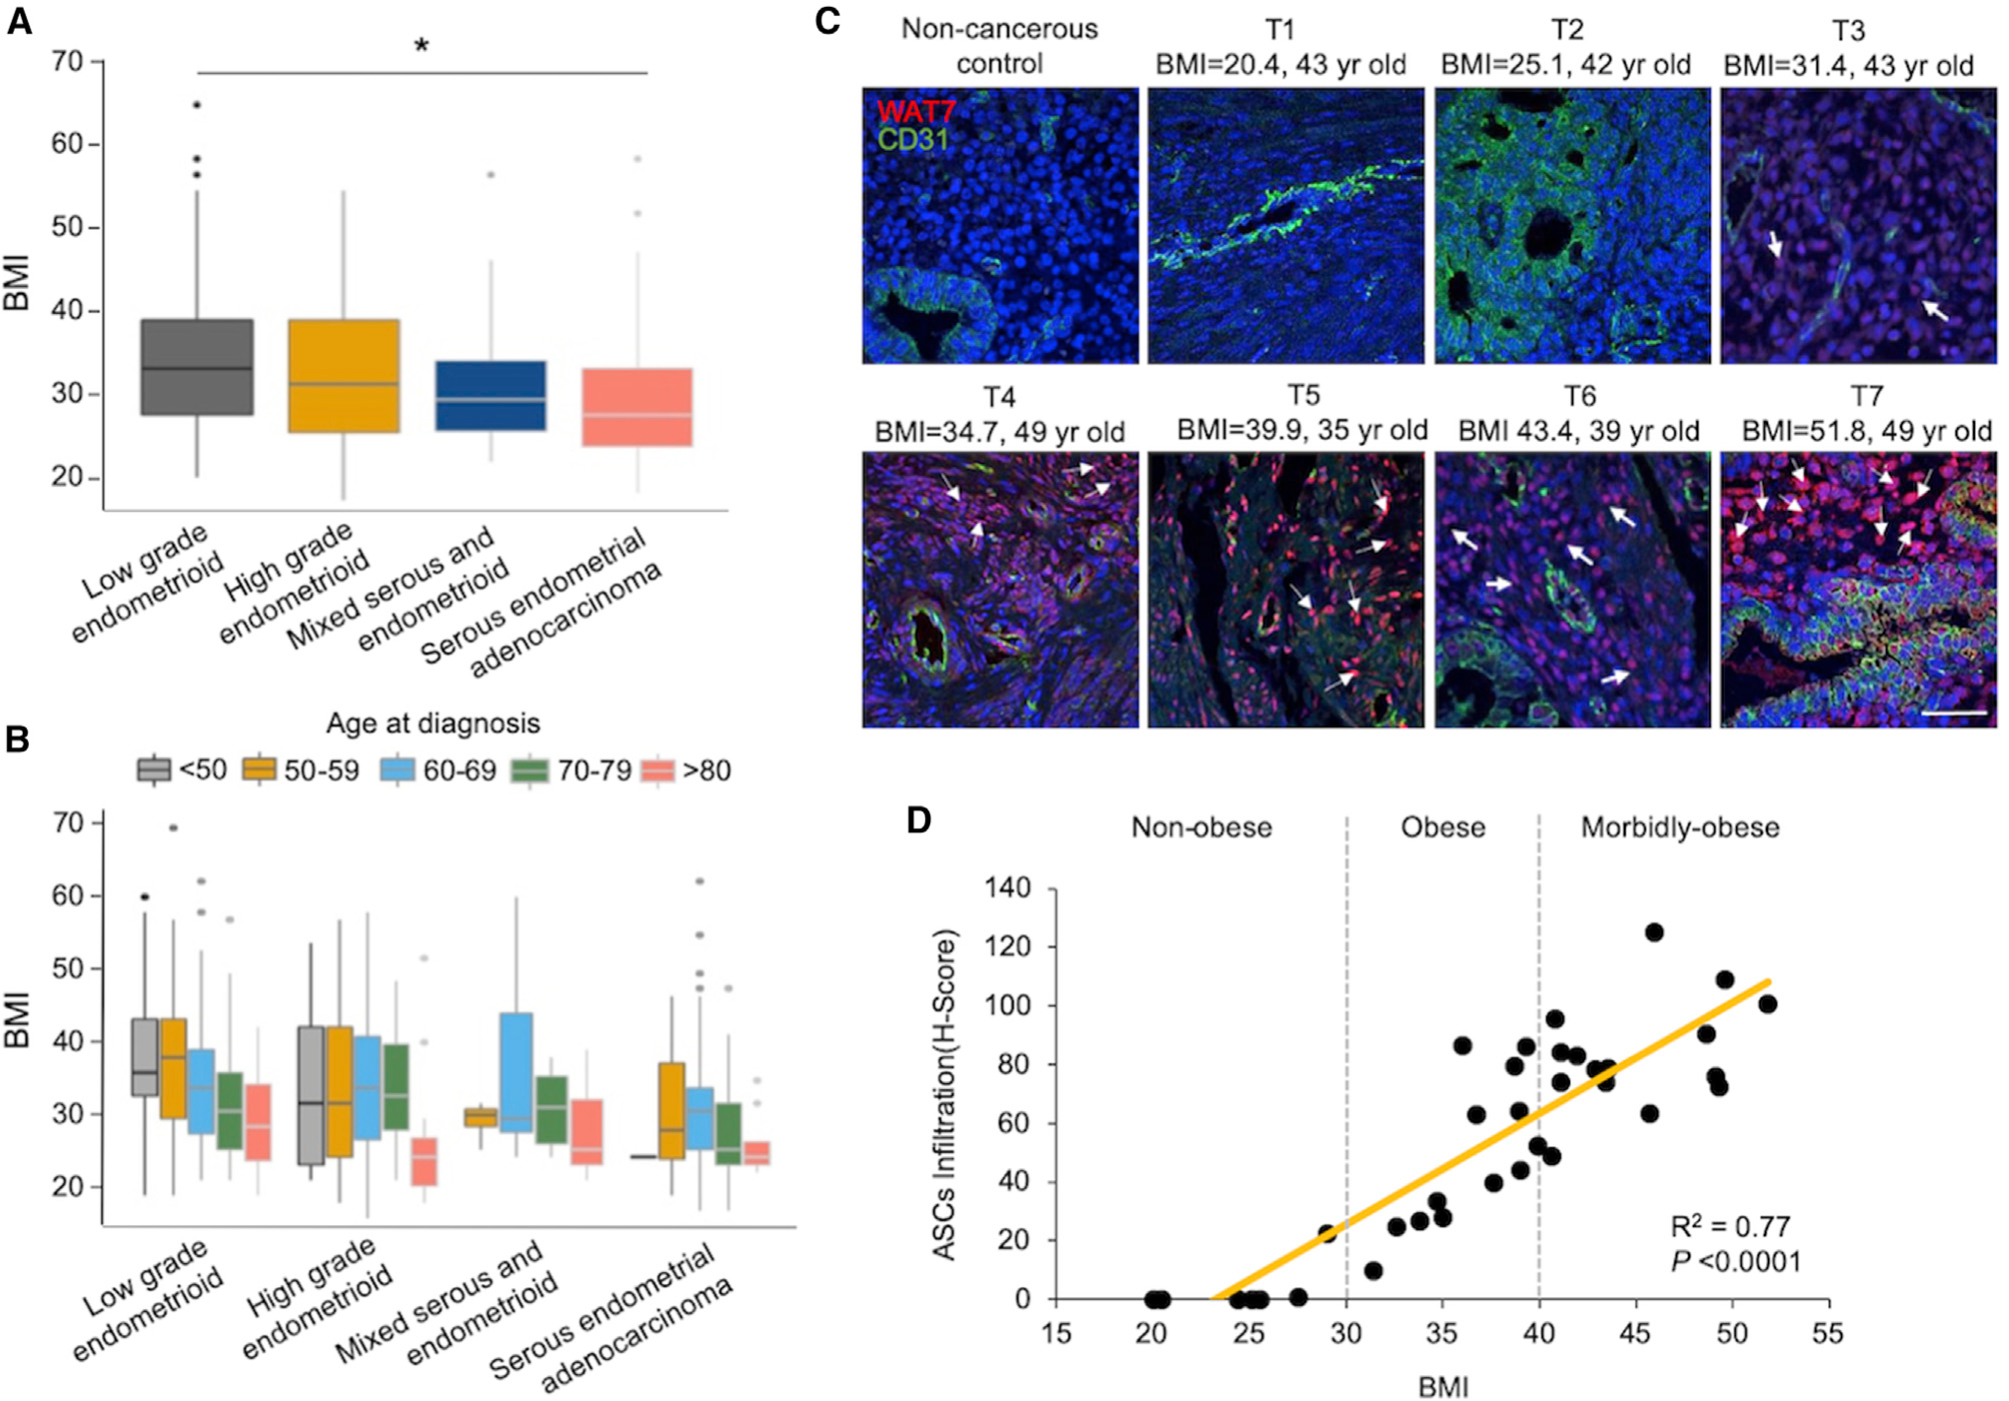
(A) In the TCGA endometrial cancer cohort, patients with low-grade endometrioid tumors had higher BMIs relative to patients with serous endometrial adenocarcinoma. *p < 0.05.
(B) In low-grade endometrioid tumors, patients in the <50 and 50–59 age groups tended to have higher BMIs than older patients. This age difference was not evident in the serous subtype.
(C) Representative sections of tissue microarrays immunofluorescently stained with the white adipose tissue 7 (WAT7) homing peptide, a known marker specific for ASCs (pink/red; see white arrows), CD31 for endothelial cells (green), and DAPI for nuclei (blue). Scale: 70 μm.
(D) Scoring of ASC infiltration shows a direct association with BMI (p < 0.0001).
ASCs Engender PAI-1-Dependent and PAI-1-Independent Expression of Target Genes
To determine how ASC-secreted PAI-1 influences epithelial transcriptomes, we first exposed the immortalized EEC line EME6/7t to ASC-CM in cell culture for 24 h (Figure 2A), simulating ASC paracrine actions in vitro. Consistent with our previous findings (Polusani et al., 2019), a pro-tumorigenic phenotype was induced in this exposure model, including enhanced cellular invasion, proliferation, and mobility (Figures S2A and S2B, left, and S2C and S2D). The finding was independently confirmed in primary, un-immortalized EECs (Figures S2A and S2B, right). Then, we conducted scRNA-seq of EME6/7t EECs exposed to ASC-CM and stratified scRNA-seq profiles of 1,269 single cells (i.e., 669 control and 600 ASC-CM-exposed EME6/7t cells) (Figures 2A and 2B). Principal component analysis displayed cellular clustering of control and ASC-CM groups based on the most variable set of expressed genes (Figures S2E–S2G). The dimensionality reduction algorithm, t-distributed stochastic neighbor embedding (t-SNE), was employed to visualize distribution aggregates of these EECs, yielding a total of six subpopulations (Figure 2B). Subpopulations #1 and #2 were predominantly present in the control group, while two major de novo subpopulations, #5 and #6, appeared after the ASC-CM exposure (Figure 2C). This dynamic change in population size was moderately affected in two minor subgroups, #3 and #4, following the exposure (Figure 2C).
Figure 2. Single-Cell Transcriptome Profiling of Endometrial Epithelial Subpopulations Exposed to ASC-CM.
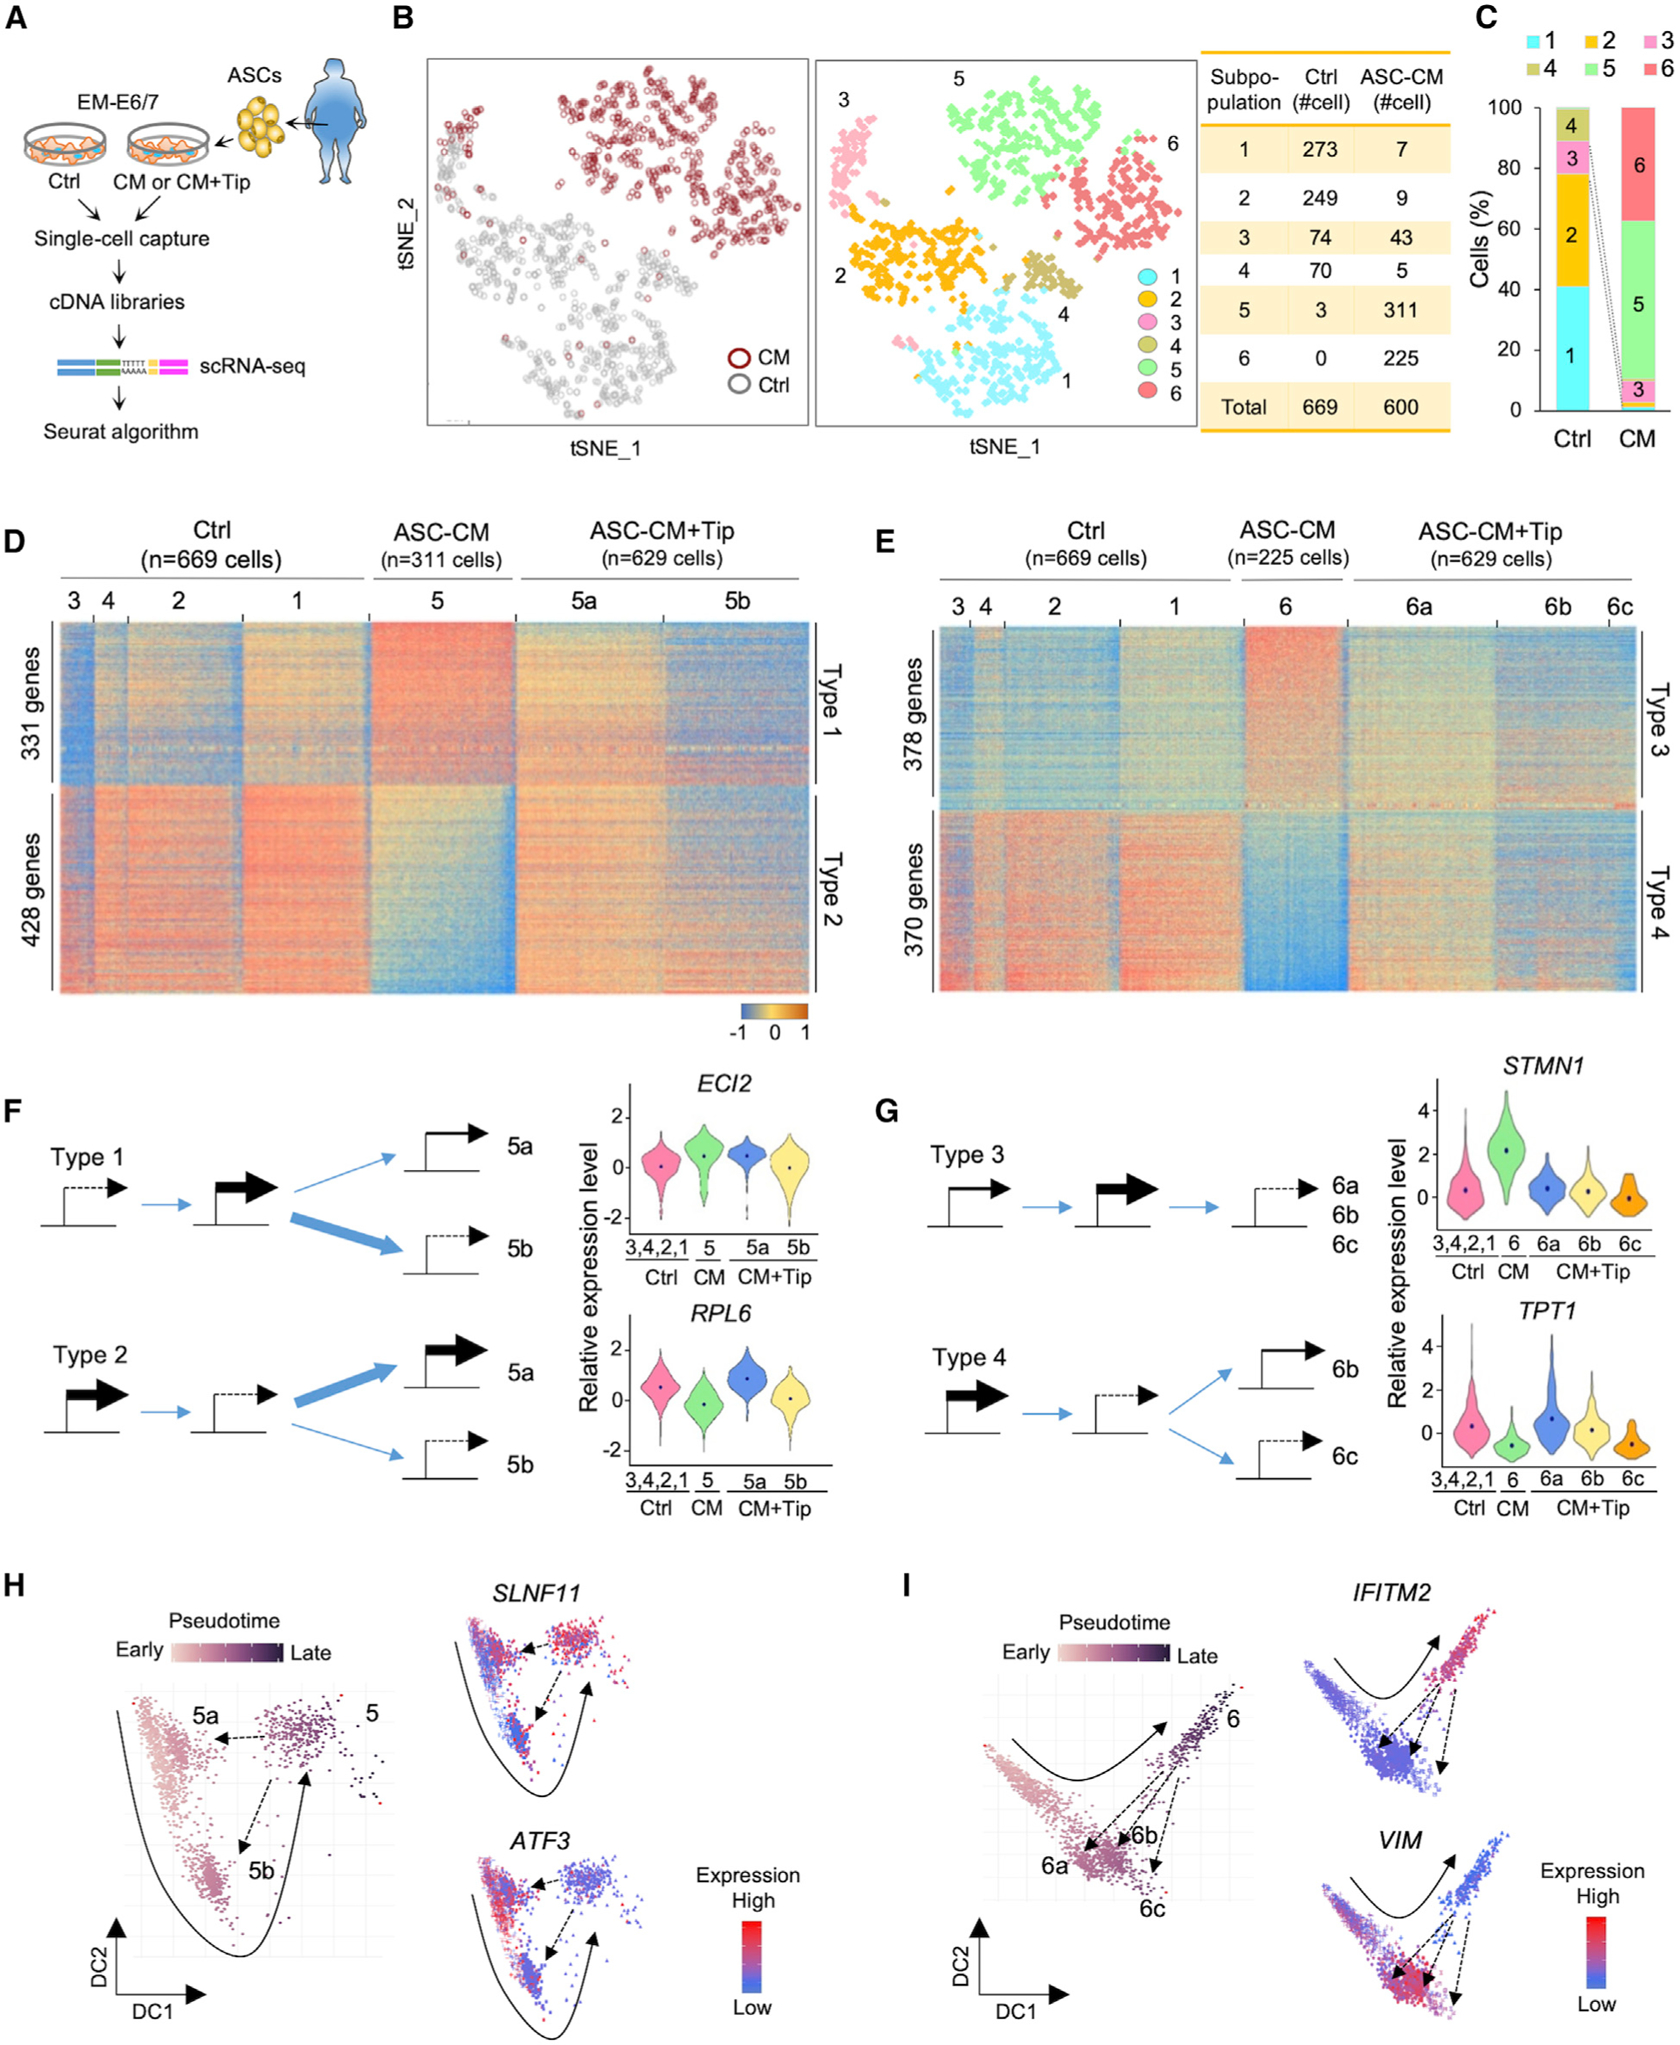
(A) Schematic of study design of the immortalized EEC line EME6/7t exposed to control media and conditioned media of adipose stromal cells (ASC-CM) in the presence or absence of the PAI-1 inhibitor Tip, and subsequent unsupervised clustering analysis of EEC subpopulations based on scRNA-seq analysis.
(B) tSNE scRNA-seq plot of EME6/7t cells with or without ASC-CM exposure (left) and six cell clusters from 1,269 individual cell transcriptomes (right).
(C) Bar plots showing the proportions of clustered cell subpopulations in each treatment.
(D and E) Heatmaps showing single-cell gene expression patterns from each treatment in subpopulations #5 (D) and #6 (E).
(F and G) Schematic showing four types of PAI-1-related modes of transcriptional regulation in subpopulation #5 (F) or #6 (G). In types 1 and 2, genes were altered by ASC-CM and partially reversed by adding Tip (F). In type 3, ASC-CM induced expression, which was reversed by Tip; on the other hand, ASC-CM repressed gene expression, but PAI-1 inhibition had little effect on restoring expression in type 4 (G). The thickness of blue arrows represents differential levels of gene regulatory expression. Violin plots showing expression distributions of representative genes (dots refer to the average) for the four regulatory types.
(H and I) Pseudotime trajectory of EME6/7t cells derived from subpopulation #5 and related satellites (i.e., #5a and #5b) (H) or subpopulation #6 and related satellites (i.e., #6a, #6b, and #6c) (I). Representative genes show upregulation (SLNF11) or downregulation (ATF3) due to ASC-CM exposure (#5) and their responses to Tip (see #5a and #5b). Genes show upregulation (IFTM2) or downregulation (VIM) due to ASC-CM exposure and their responses to Tip (see #6a, #6b, and #6c). A solid arrow represents the time trajectory of cellular subpopulations. A dotted arrow represents the trajectory of EME6/7t cells in response to ASC-CM exposure.
See also Figure S2.
To further determine whether PAI-1 secreted by ASCs had an effect on these subpopulation changes, we additionally treated ASC-CM-exposed EME6/7t cells with the small-molecule inhibitor tiplaxtinin (Tip), known to bind and cleave this adipokine (Elokdah et al., 2004). The concentration of Tip used in the present study was 50 μmol/L, which had no known adverse cytotoxic effect in EME6/7t cells, based on our previous work or in other cell lines (Crandall et al., 2006; Polusani et al., 2019). When the additional scRNA-seq data of 629 cells in the ASC-CM+Tip group were integrated into those of the control and ASC-CM groups, we identified a total of 970 target genes whose expression patterns were directly influenced by PAI-1. There were four different PAI-1-mediated regulatory types within the two de novo subpopulations, #5 and #6 (Figures 2D and 2E). In type 1, PAI-1 initiated the upregulation of 331 genes that were partially reversed by Tip in subpopulation satellite #5a but were reversible by the PAI-1 inhibition in the other satellite, #5b (see ECL2 as an example in Figure 2F, top). In contrast, the downregulation of 428 genes by PAI-1 in type 2 was reversible by Tip in subpopulation satellite #5a, but partially reversed by Tip in subpopulation satellite #5b (see RPL6 in Figure 2F, bottom). However, these mixed regulatory modes in subpopulation #5 were less frequently seen in subpopulation #6. While the expression of 378 upregulated genes could be reversed by Tip in subpopulation satellites #6a, #6b, and #6c (i.e., type 3; see STMN1 in Figure 2G, top), this reversal was less evident in 370 PAI-1-downregulated genes in subpopulations #6b and #6c (i.e., type 4; see TPT1 in Figure 2G, bottom). From this single-cell expression analysis, it became apparent that PAI-1 initiates context-dependent gene regulation in diverse EME6/7t subpopulations.
To trace cellular origins of the two major de novo subpopulations, #5 and #6, pseudotime analysis was used to order cell trajectories based on their transcriptomic similarities (Haghverdi et al., 2016). After time tracking of subpopulation #5, we observed a putative movement from #1/#2 to #3 and then to #5 after exposing EME6/7t cells to ASC-CM. The inhibition by Tip partially reversed the movement back to control subpopulations #1/#2 or #3, suggesting that PAI-1 had a transient influence on target gene expression in subpopulation #5 (see examples of two genes, SLNF11 and ATF3, in Figure 2H). In contrast, gene regulation in subpopulation #6 was less dependent on PAI-1. Although the cellular origin of subpopulation #6 could similarly be traced back to #1/#2 after the ASC-CM exposure, these cells were less responsive to the PAI-1 inhibition (see also expression patterns of IFITM2 and VIM in Figure 2I). Corroborating the aforementioned gene heatmaps, the pseudotime analysis suggests that PAI-1-dependent regulatory modes appear prominent in subpopulation #5, while other factors secreted by ASC-CM are more involved in gene regulation for subpopulation #6. Alternatively, PAI-1 triggers an irreversible transcriptional process in type 3, especially for those undergoing epigenetic repression, suggested by our recent finding (Polusani et al., 2019).
PAI-1 Deregulates TGF-β/SMAD-Mediated Junction and Adhesion Complex
To determine how PAI-1 alters intracellular signaling activities, we performed network analysis of 13 prominent oncogenic signaling pathways (Liberzon et al., 2015) using scRNA-seq data. When aligning these pathways based on their PAI-1 dependence, we found the top six signaling pathways—TGF-β/SMAD, Notch, MYC, E2F targets, p53, and tumor necrosis factor alpha (TNF-α) via NF-κB—underwent reversible repression by PAI-1 in subpopulation #5 (Figure 3A). This transient repression was similarly observed in five of these six pathways in subpopulation #6. The exception is the upregulation of E2F targets, which is a key pathway to highlight the differential impact of PAI-1 on subpopulations #5 and #6. The remaining seven signaling pathways appeared to be upregulated after ASC-CM exposure, but this activation was less dependent on PAI-1.
Figure 3. PAI-1-Dependent Repression of TGF-β/SMAD Signaling Deregulates JAC Expression.
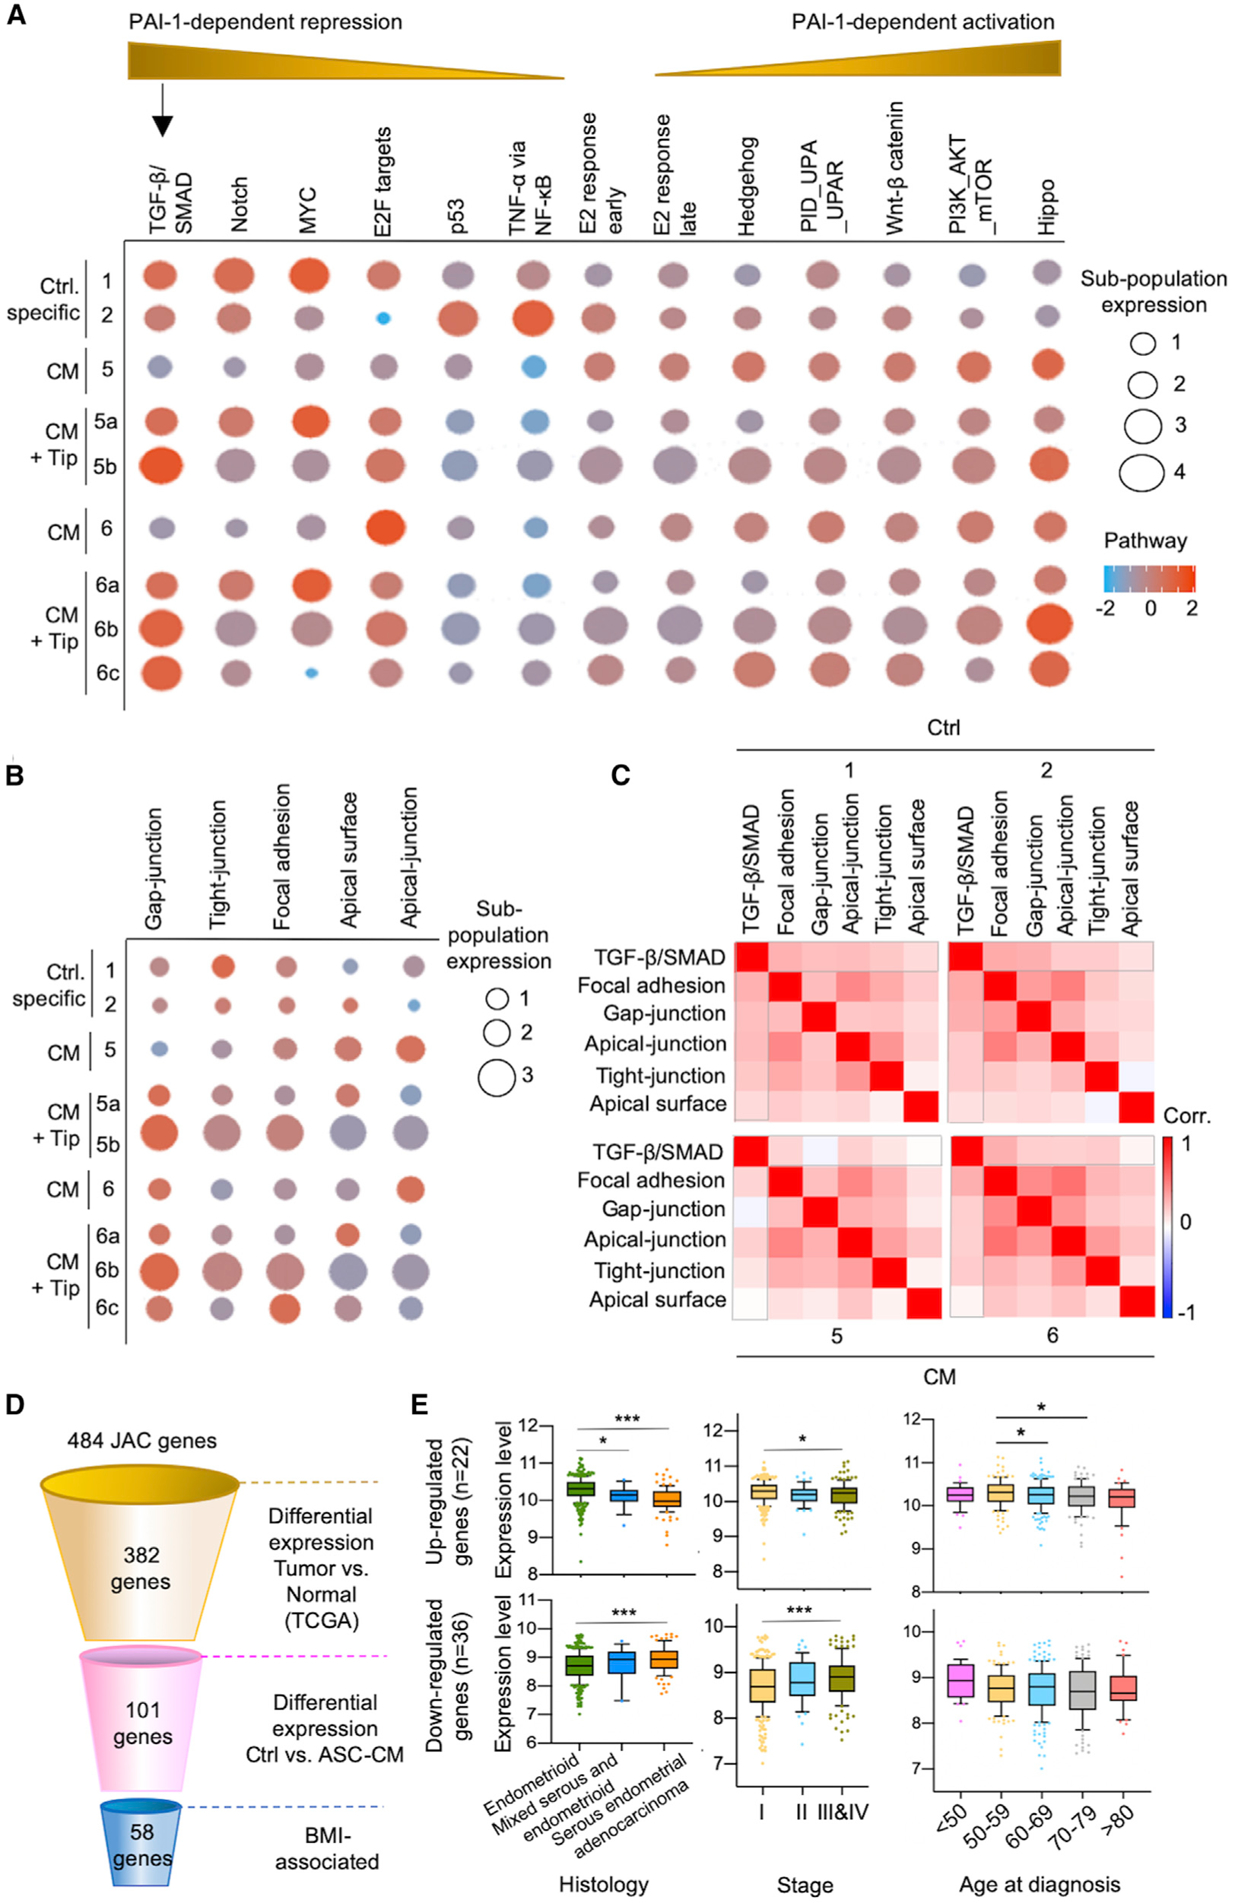
(A and B) Network analysis delineated PAI-1-dependent signaling pathways (A) as well as JAC (B), based on exposure to ASC-CM ± Tip.
(C) Correlation matrix heatmaps showing the association between cell signaling and JAC pathways. Bracketed areas indicate a decrease in correlation between TGF-β/SMAD and JAC due to ASC-CM exposure (subpopulations #5 and #6) compared to control (subpopulations #1 and #2).
(D) Schematic of the stepwise filtering used for JAC gene selection. PAI-1-dependent JAC genes were filtered using the TCGA endometrial cancer cohort, based on differential expression patterns between adjacent normal control and tumors (p < 0.05) and BMI as described in Method Details. This stepwise analysis identified putative BMI-associated JAC genes (n = 58).
(E) The 58 BMI-associated PAI-1 dependent genes were divided into up- (n = 22) and downregulated (n = 36) groups. Expression profiles of patients in TCGA endometrial cancer cohort were classified according to histology, clinical stage, and age. Downregulated JAC genes showed lower expression in the endometrioid subtype compared to the serous subtype, whereas upregulated genes showed higher expression levels in the endometrioid subtype (left). This correlation was also seen in early-stage disease compared to stage III/IV disease (middle). The relationship between gene expression and age at diagnosis was less evident (right). *p < 0.05, ***p < 0.001.
See also Figure S3.
We additionally found enrichment of five pathways associated with cellular complex consisting of gap junction, tight junction, focal adhesion, apical surface, and apical junction (collectively termed junction and adhesion complex [JAC]; Figure 3B) (Aoki-Kinoshita and Kanehisa, 2007; Liberzon et al., 2015). The results also showed PAI-1-dependent influences on JAC in the satellites of subpopulations #5 and #6 (Figure 3B). The JAC response to ASC-CM exposure was plastic and could be reversed by Tip in #5a, #6a, and #6c (Figure 3B). On the other hand, the Tip treatment led to activation of JAC in #5b and #6b, likely attributed to a compensatory mechanism. Correlation matrix analysis further revealed that the JAC expression was positively associated with TGF-β/SMAD signaling in control subpopulations #1 and #2, but this relationship was uncoupled by PAI-1 in subpopulations #5 and #6 exposed to ASC-CM (see gap-junction and apical surface pathways that are most negatively affected in Figure 3C).
To narrow down which target loci contribute to adiposity-related endometrial cancer, we first screened 484 JAC genes listed in the Molecular Signatures Database (Figure 3D) (Aoki-Kinoshita and Kanehisa, 2007; Liberzon et al., 2015). A total of 382 of these genes had significantly different expression levels between endometrial tumors and adjacent normal controls in the TCGA cohort (n = 522; p < 0.05). Among these, 101 genes were also differentially expressed in ASC-CM-exposed cells based on our scRNA-seq data. Fifty-eight genes were determined to be BMI associated when their increased or decreased expression levels in tumors were stratified by obesity status (Figure 3D). These genes were either downregulated (n = 36) or upregulated (n = 22) in ASC-CM-exposed subpopulation #5 and/or #6, and their differential expression status could be partially reversed by PAI-1 inhibition (Figure S3). Moreover, the deregulated gene profiles occurred more frequently in the endometrioid endometrial subtype (or type 1) and in patients with clinical stage I cancers when we unbiasedly correlated these expression levels with clinicopathological parameters of TCGA endometrial tumors (Figure 3E). Although we did not reach statistical significance of p < 0.05 among the five age groups categorized in the 36 downregulated candidate genes, we observed that upregulated expression of the 22 candidate genes in the 50–59 age group is higher than in other older patient groups (p < 0.05; Figure 3E). The result suggests that PAI-1-mediated expression changes of candidate JAC genes are capable of inducing endometrial neoplasms.
PAI-1 Modulates JAC Expression by Interacting with LRP1 to Downregulate SMAD4
Based on the correlation between PAI-1 regulatory action and reduced TGF-β/SMAD signaling (Figure 3A), we examined the potential regulation of the co-SMAD, SMAD family member 4 (SMAD4), by PAI-1. While PAI-1 activities include interactions with the urokinase plasminogen activator pathway (uPA-uPAR), PAI-1 also has a strong affinity to the low-density lipoprotein receptor-related protein 1 (LRP1) to transduce signals for downstream transcriptional modulation (Degryse et al., 2004; Polusani et al., 2019; Wei et al., 2019). As these published observations strongly implicate LRP1 as a modulator of PAI-1 transcriptional activity, we mechanistically determined how the interaction of PAI-1 with LRP1 influences SMAD4 levels, using proximity ligation assay (PLA). The data demonstrate an increase in the interaction between PAI-1 and LRP1 on the cell surface of ASC-CM-exposed EME6/7t cells relative to control cells (Figures 4A and 4B). Further, this interaction was attenuated by pretreating cells with LRP1 antagonist receptor-associated protein (RAP). When PLA was conducted on cells treated with Triton-X detergent to increase membrane permeability, we similarly observed increased intracellular interactions between PAI-1 and LRP1 in ASC-CM-exposed EME6/7t cells (Figure 4C). This internalization is known to produce the cleaved intracellular domain (ICD) of LRP1 that can be translocated into the nucleus upon signaling activation (Xian et al., 2017; Yamada et al., 2019). Therefore, chromatin immunoprecipitation (ChIP)-qPCR was performed to determine if ICD-LRP1 binds to the SMAD4 promoter in EME6/7t cells exposed to ASC-CM. The result showed a 5- to 6-fold increase in the LRP1-ICD binding to the promoter, which was abrogated by RAP treatment (Figure 4D). Acting as a transcription repressor, LRP1-ICD subsequently downregulated SMAD4 gene expression in ASC-CM-exposed cells (Figure 4E). The expression of SMAD4 was restored in exposed cells additionally treated with Tip or RAP.
Figure 4. PAI-1-LRP1 Interactions Downregulate SMAD4 Levels via Transcription Repression and Ubiquitin-Mediated Degradation.
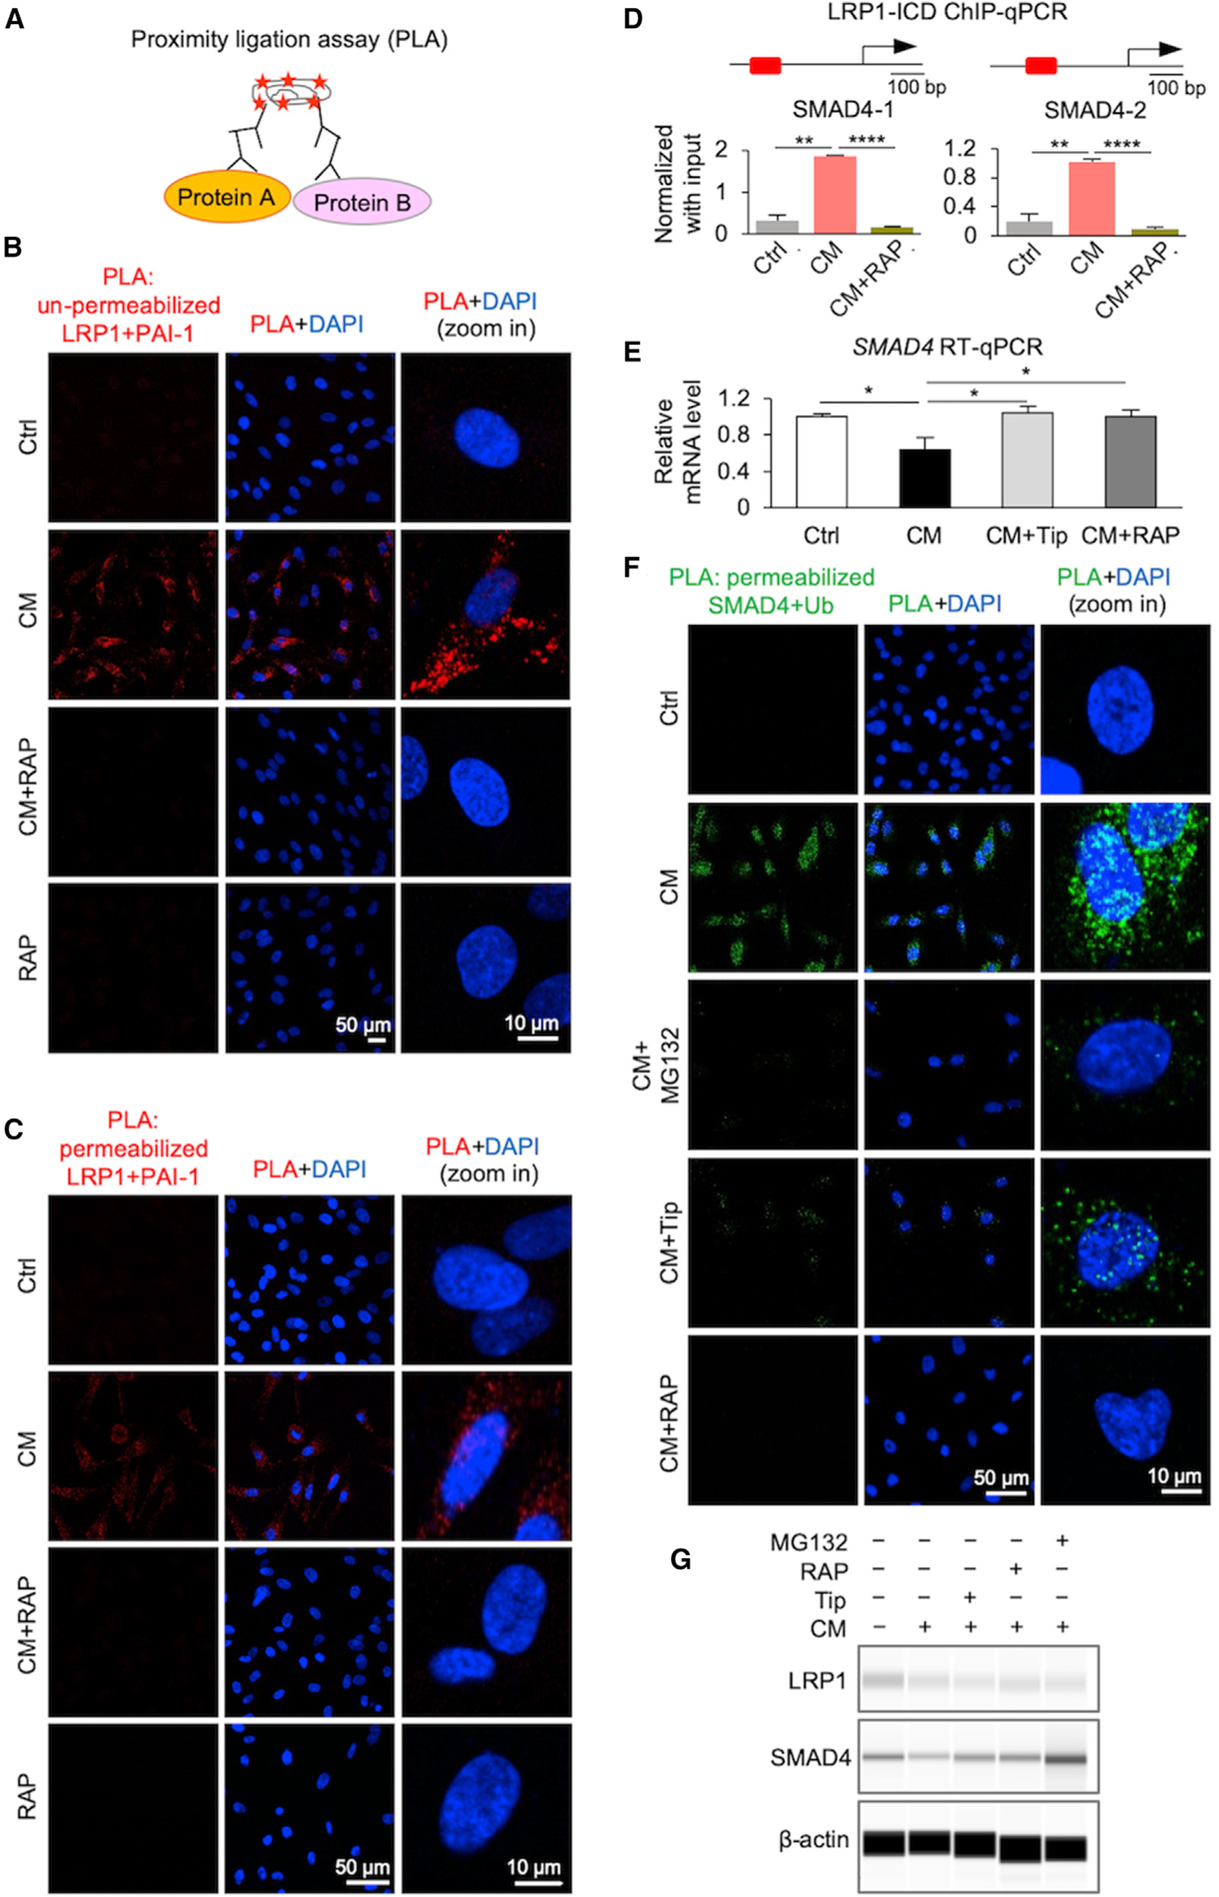
(A) PLA utilizes a pair of oligonucleotide-conjugated secondary antibodies that bind corresponding antibodies targeting each interacting protein partner. The proximity of these two protein partners allows circular DNA amplification of the oligonucleotides template upon in situ ligation. Fluorescent probes complementary to this amplicon engender a detectable signal via fluorescence microscopy. Plasma membrane permeabilization was used for intracellular protein interactions.
(B and C) PLA indicating protein-protein interactions of PAI-1 and low-density LRP1 on the cell surface (B) or intracellular (C) due to ASC-CM exposure in the presence or absence of the LRP1 inhibitor RAP. Representative micrograph images showing positive signal (red) for PAI-1/LRP1 interactions. DAPI was used to stain nuclei (blue).
(D) ChIP-qPCR analysis of LRP1-ICD binding to two promoter regions of the SMAD4 gene in control (Ctrl) cells and CM-exposed cells treated and untreated with RAP (5 μg/mL). Data represent mean ± SD, n = 3 technical replicates; **p < 0.01, ***p < 0.001.
(E) qRT-PCR analysis of mRNA expression levels of SMAD4 gene in control cells and CM-exposed cells treated and untreated with Tip (50 μM) or RAP (5 μg/mL). Data represent mean ± SD, n = 3 technical replicates; *p < 0.05.
(F) PLA demonstrating protein-protein interactions of SMAD4 and ubiquitin due to ASC-CM exposure in the presence or absence of the following inhibitors: Tip for PAI-1, RAP for LRP1, and protease inhibitor MG132. Micrograph images showing positive PLA signal (green) for SMAD4-ubiquitin interactions. DAPI was used to stain nuclei (blue).
(G) Protein expression of LRP1 and SMAD4 by capillary western immunoassays. Endometrial epithelial EME6/7t cells were treated with control media, ASC-CM, and ASC-CM plus Tip, or with pre-treatment with LRP1 antagonist RAP or protease inhibitor MG132. The result shown is a representative of three independent experiments.
See also Figure S4.
In search of other regulatory mechanisms, we observed upregulation of NEDD4-lLike E3 ubiquitin (NEDD4L) and ubiquitin-conjugating enzyme E2 I (UBE2I, formerly UBC9) genes based on our scRNA-seq data, suggesting a role of PAI-1-LRP1 in the proteasome pathway (Figure S4A). The protein products of both genes are known to bind to SMAD2/3/4 complexes, which may cause ubiquitin-mediated degradation of TGF-β-associated transcription factors (Lin et al., 2003; Wang et al., 2011; Yilmaz et al., 2018). The PLA result of membrane-permeated EME6/7t cells confirmed this PAI-1-mediated degradation by ubiquitination of SMAD4, which could be abrogated by the proteasome inhibitor MG132, as well as inhibited by Tip or RAP treatments (Figure 4F). The data from capillary western immunoassays independently supported the role of PAI-1 in mediating SMAD4 degradation in ASC-CM-exposed EME6/7t cells (Figures 4G and S4B).
To verify the direct impact of SMAD4 on JAC gene expression, we generated stable knockdown clones of EME6/7t cells transduced with SMAD4 shRNA (shSMAD4) or control (shCtrl) that showed efficient suppression of SMAD4 after the knockdown (Figure S5). The expression of 11 JAC genes was then determined in control and shSMAD4 cells in the presence or absence of ASC-CM by qRT-PCR (Figure 5A). Supporting the scRNA-seq findings, exposure of EME6/7t cells to ASC-CM or attenuation of TGF-β/SMAD signaling by SMAD4 knockdown resulted in expression downregulation of these genes (Figure 5A). Moreover, ChIP-qPCR assays indicated that SMAD4 binds to their corresponding promoters (Figure 5B). With the exception of ADAM15, SMAD4 promoter binding was decreased in the 10 remaining loci in EME6/7t cells exposed to ASC-CM. Taken together, these results demonstrate that PAI-1-LRP1-modulated SMAD4 downregulation occurs at both the transcriptional and the post-translational levels. As a result, tumor-suppressive activities of TGF-β/SMAD signaling are attenuated, leading to deregulation of JAC genes in EECs.
Figure 5. TGF-β/SMAD4-Mediated Downregulation of Candidate JAC Genes.
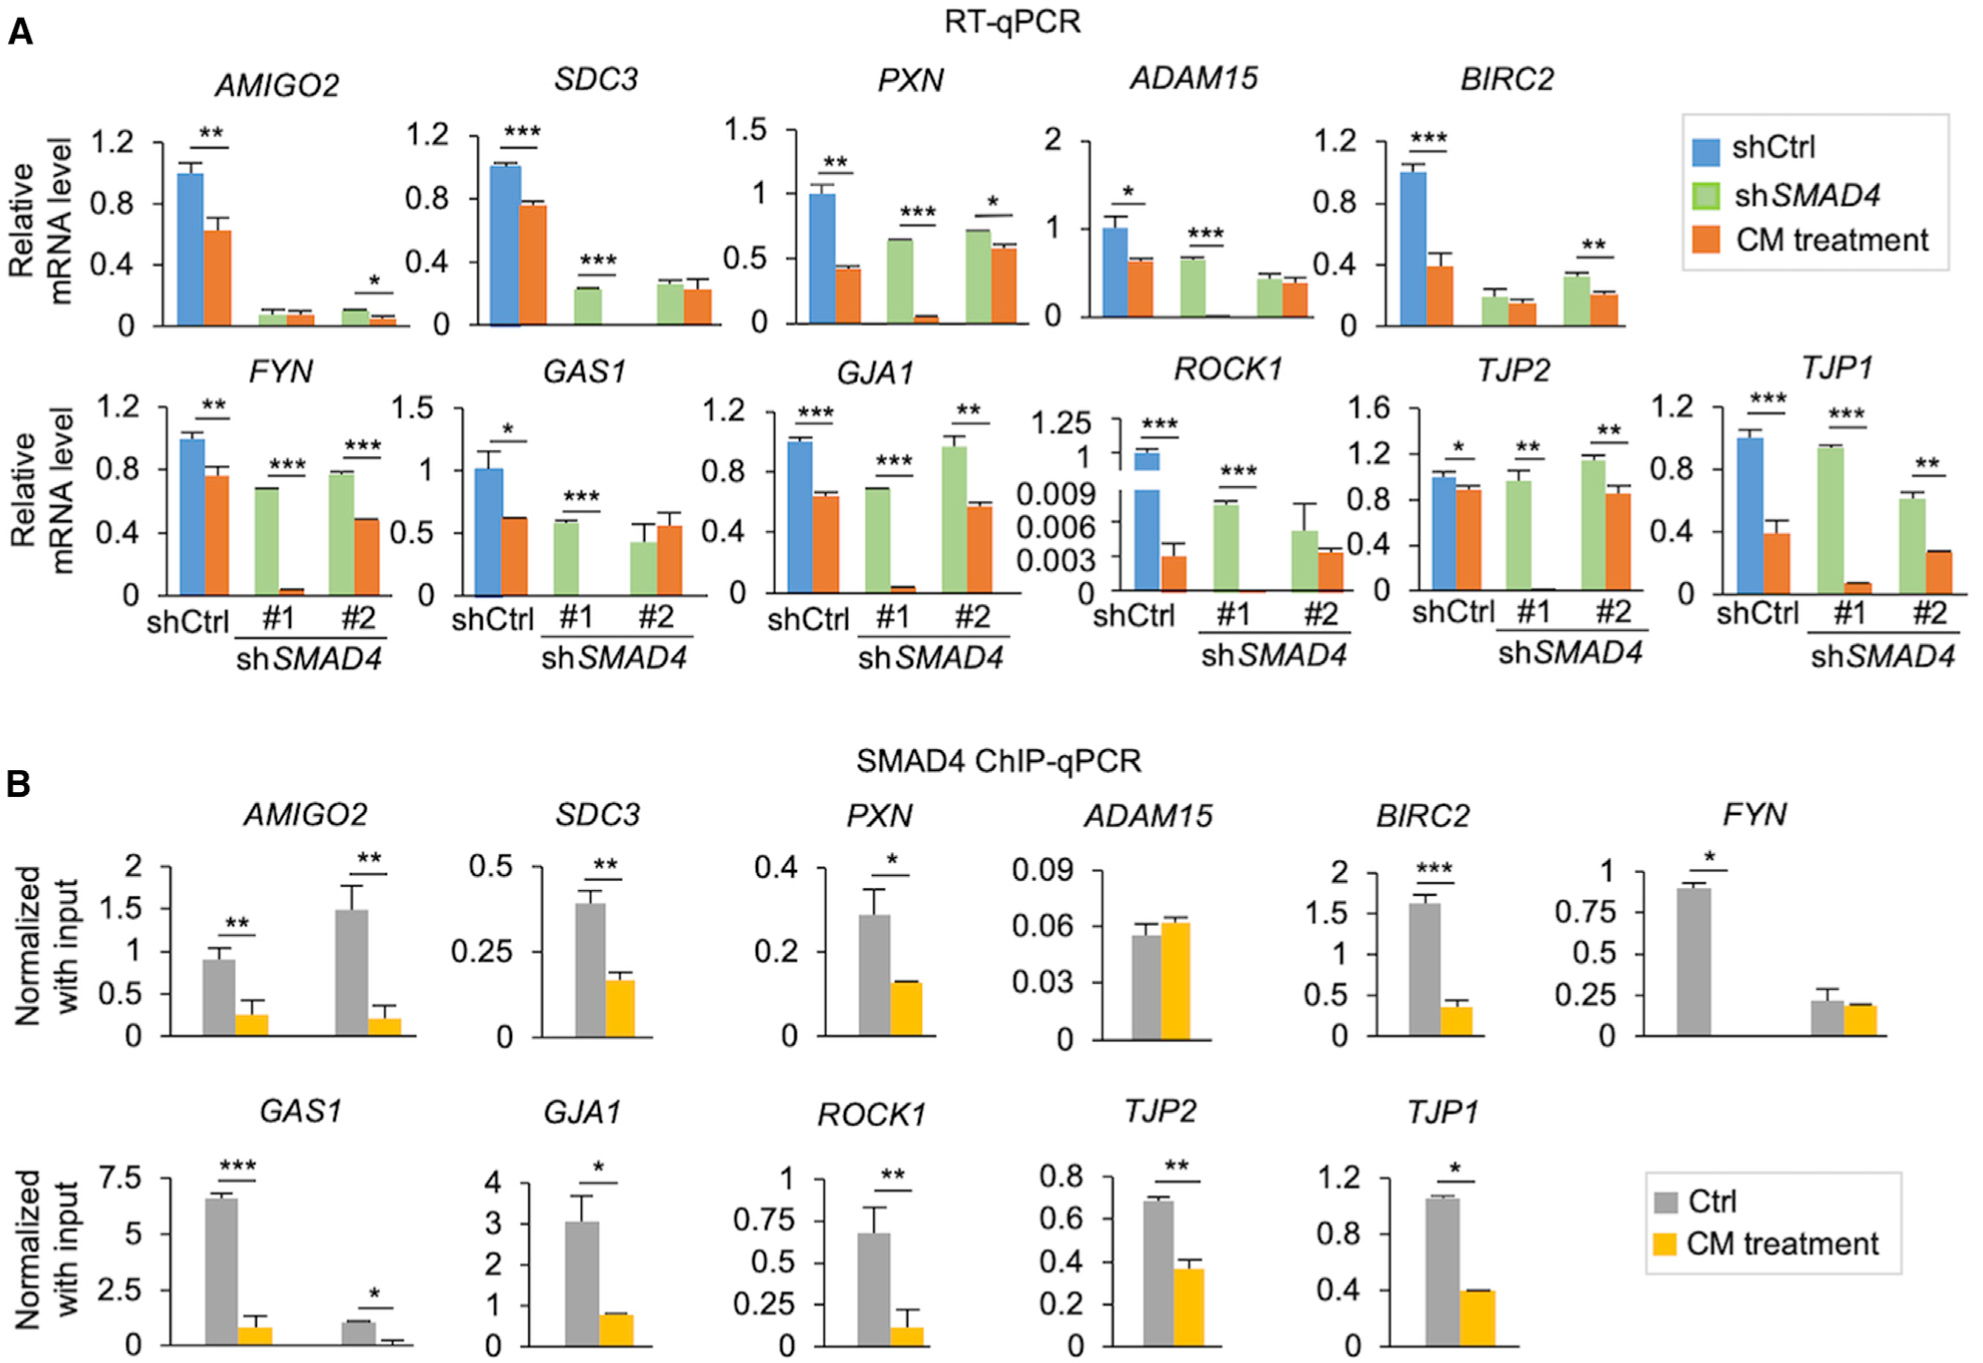
(A) Bar plots showing mRNA expression levels of selected PAI1-regulated JAC genes by qRT-PCR in the two shSMAD4 knockdown clones, compared to shCtrl in the presence or absence of ASC-CM.
(B) ChIP-qPCR analysis of SMAD4 binding to promoter regions of the JAC genes in control (Ctrl) cells and ASC-CM-exposed cells.
Data represent mean ± SD, n = 3 technical replicates; *p < 0.05, **p < 0.01, ***p < 0.001, Student’s t test. See also Figure S5.
Low Expression of SMAD4 and JAC Is Linked in Cell Subpopulations of Persons with Obesity
To confirm the expression profiling data and examine the effects of obesity and PAI-1 on JAC expression, we conducted CyTOF profiling of 16 protein factors in nine primary endometrial tumors (Table S2) and three sets of EME6/7t cells (i.e., control, ASC-CM, and ASC-CM plus Tip) (Figures S6A and S6B). The 11 BMI-associated JAC factors were chosen (Figure 3D; Polusani et al., 2019) because of their critical involvements in cell-cell adhesion and extracellular matrix communication, including growth arrest-specific 1 (Gas1), adhesion molecule with Ig like domain 2 (AMIGO2), syndecan-3 (SDC3), disintegrin and metalloproteinase domain-containing protein 15 (ADAM15), connexin 43 (Cx43), zonula occludens-1 (ZO1), zonula occludens-2 (ZO2), rho-associated protein kinase 1 (ROCK1), signal transduction adaptor protein paxillin (Paxillin), tyrosine protein kinase Fyn (Fyn), and cellular inhibitor of apoptosis protein 1 (cIAP1) (see functional descriptions of these factors in Figure S6C). Three TGF-β/SMAD signal components—GFR-2, SMAD2, and SMAD4—were also included to determine whether PAI-1-mediated repression of this signaling activity occurred in the samples analyzed. Additional markers for immune, stromal, and endothelial cells were used to gate EECs from non-epithelial components in primary tumors (Figure S6B). EECs were positively identified by two epithelial markers, EpCAM and CK8/18 (Figure S6B).
The tSNE plots of the 16 protein factors displayed 27 cellular subpopulations derived from a total of 74,048 single EECs (Figures 6A and 6B). Consistent with the scRNA-seq findings of EME6/7t cells, various degrees of JAC protein repression were seen in the ASC-CM-exposed subpopulations #4, #6, and #7 relative to those of control subpopulations #8, #9, and #10 (Figure 6C). Except for ADAM15, Fyn, and cIAP1, JAC repression could be reversed by Tip treatment in subpopulations #1, #2, and #3. This PAI-1-dependent repression was similarly observed in TGF-β/SMAD signal components SMAD2 and SMAD4 in EME6/7t subpopulations (Figure 6D). However, the remaining subpopulations derived from primary tumors showed highly heterogeneous expression patterns of these protein markers.
Figure 6. Single-Cell Proteomic Analysis of Cellular Subpopulations in EME6/7t EECs and Primary Tumors.
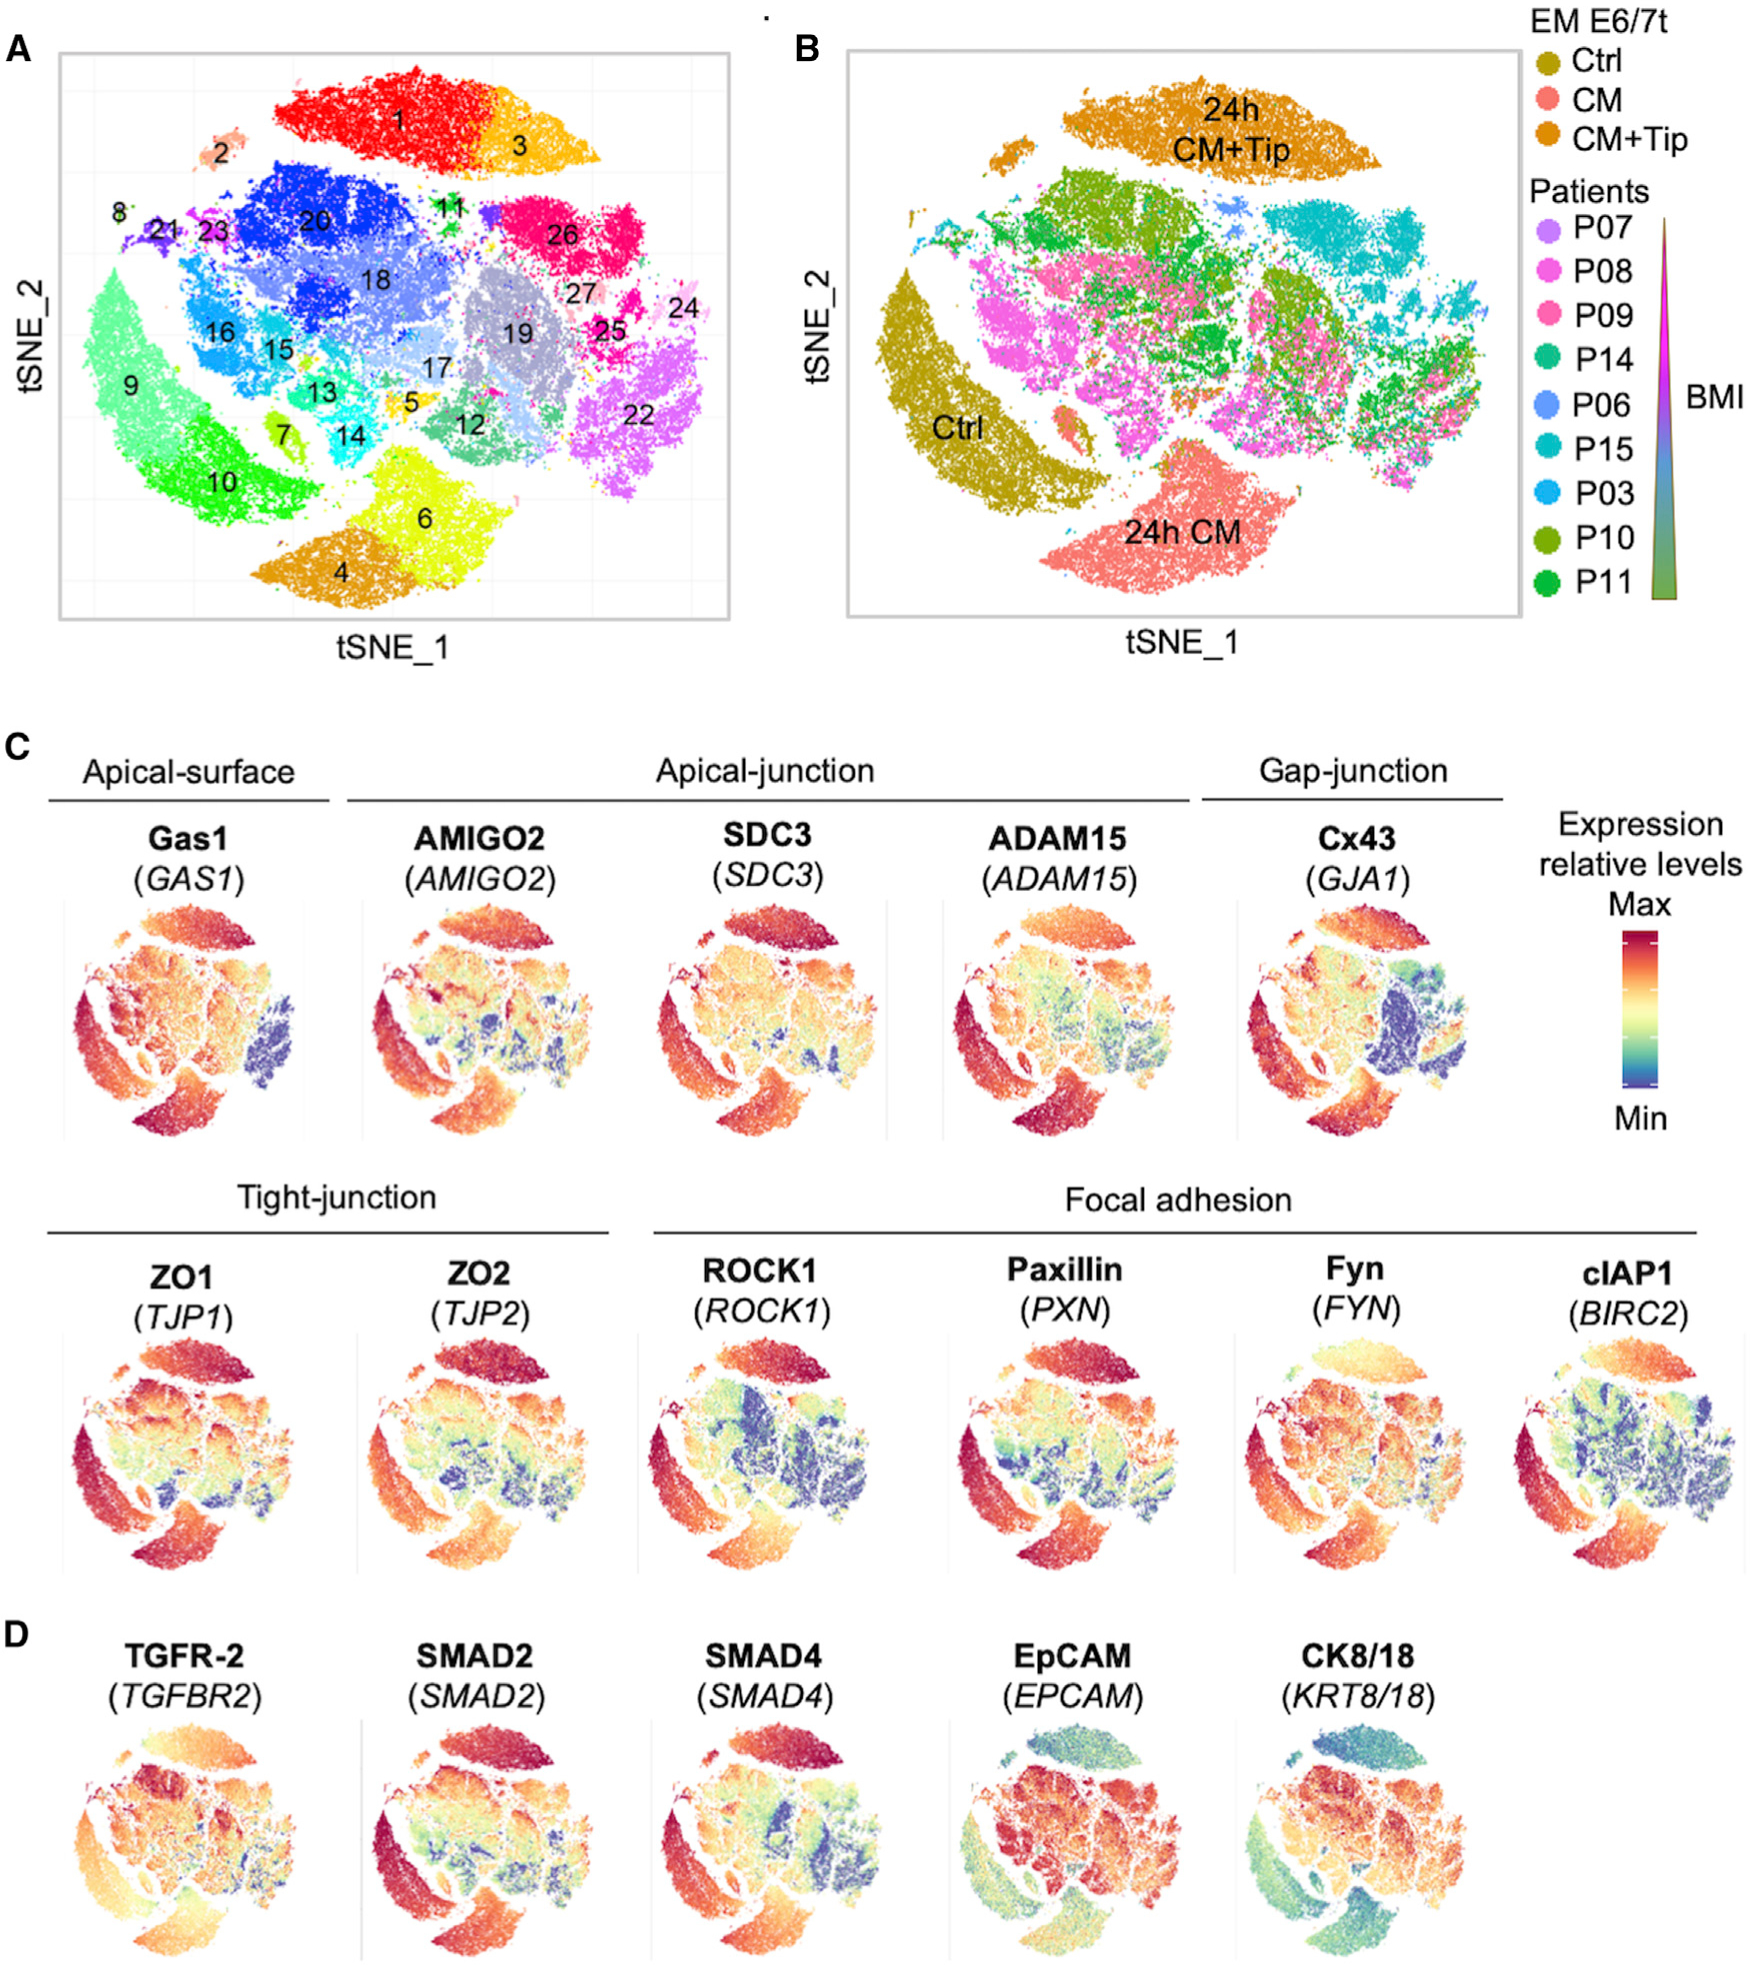
(A and B) tSNE plots of mass cytometry (CyTOF) analysis visualizing 74,048 epithelial cells, which were divided into clusters (n = 27) based on their proteomic profiles (A). These cells included immortalized EEC line EME6/7t (exposed to ASC-CM ± Tip) and primary endometrial tumors of patients with known BMIs (B).
(C) tSNE-based phenographs showing abundance and cellular distributions of JAC proteins.
(D) tSNE-based phenographs showing EpCAM and CK8/18 as epithelial cell markers and TGFR-2, SMAD2, and SMAD4 as TGF-β factors.
To further explore how PAI-1-mediated repression of TGF-β/SMAD4 signaling influences intra-tumor and inter-patient heterogeneity in endometrial cancer, we classified the aforementioned 27 cell subpopulations into five categories (i.e., I, II, III, IV, and V) on the basis of (1) expression levels of SMAD4 (p < 0.0001; Figure 7A), (3) expression levels of 11 candidate JAC markers (p < 0.0001; Figure 7B), and (3) subpopulation size (Figure 7C). Violin plot profiling of SMAD4 levels further showed that decreasing expression of this TGF-β mediator is usually correlated with reduced JAC expression in EEC subpopulations (Figure 7). In general, EEC subpopulations derived from EME6/7t cells exhibited higher expression levels of SMAD4 and JAC markers (Figure S7; predominantly in categories IV and V) than those of primary tumors (Figure S7; predominantly in categories I, II, and III). Interestingly, we found that low SMAD4-expressing subpopulations (categories I and II) were more frequently associated with JAC reduction in endometrioid cancer patients with increased BMI (Figure 7B and 7C).
Figure 7. Stratification of Endometrial Cell Subpopulations Based on SMAD4 and JAC Expression Levels and Patients’ BMIs.
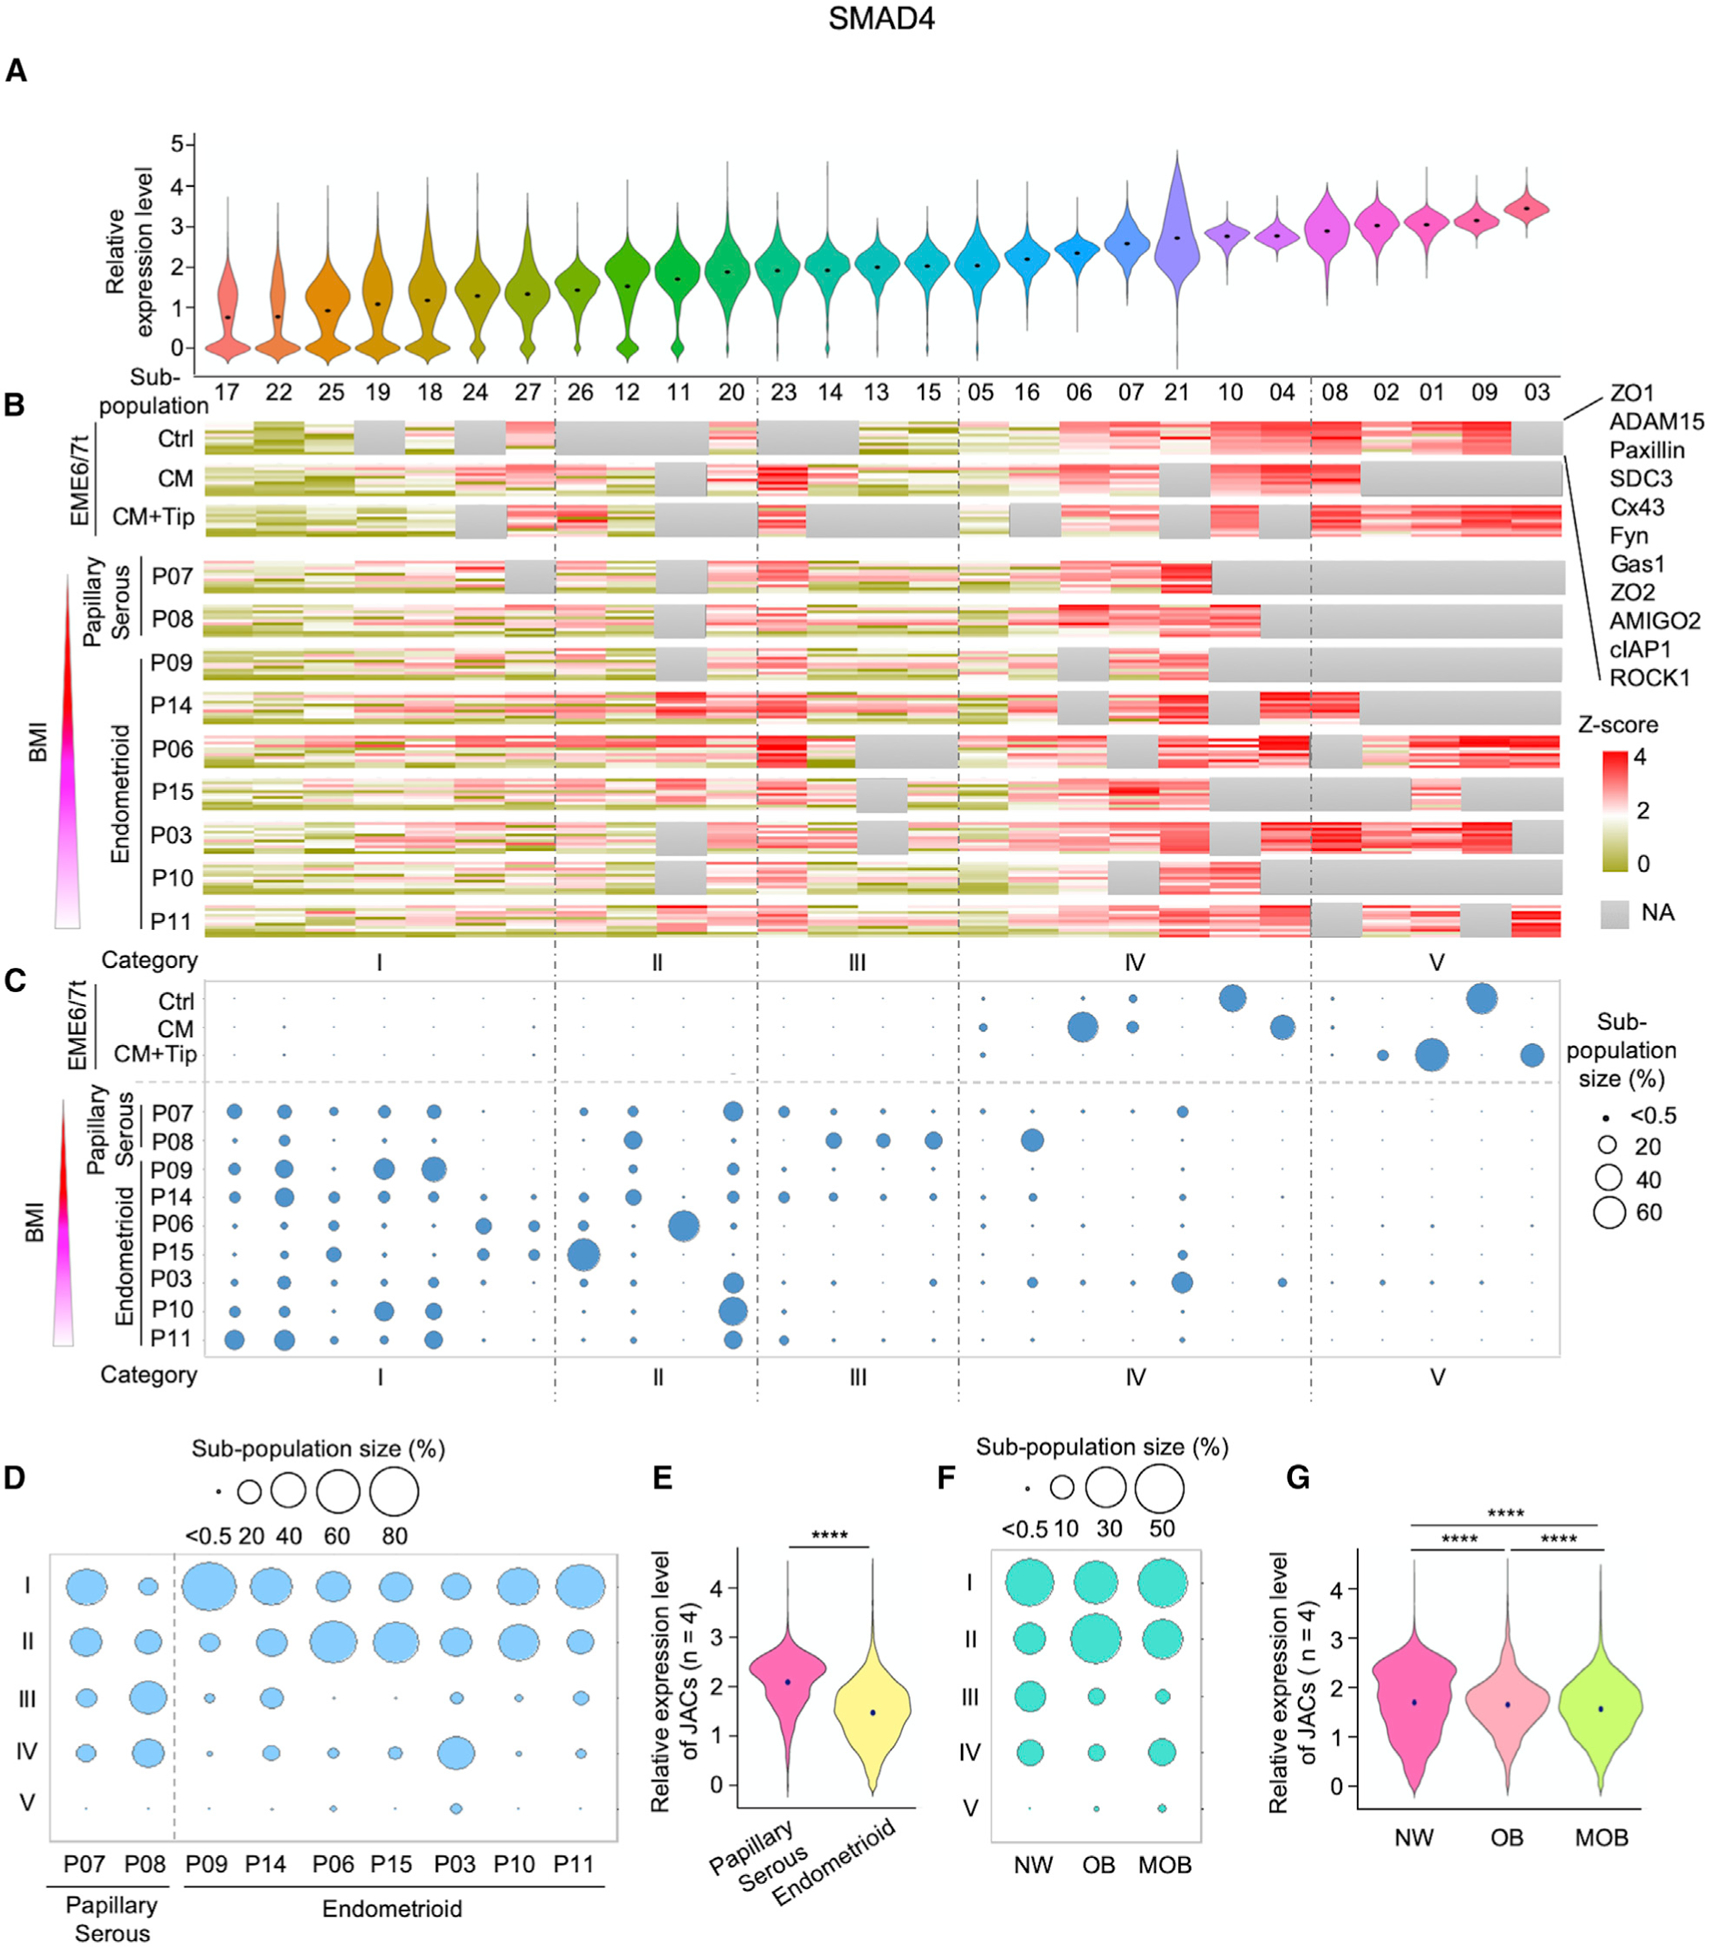
(A–C) Expression profiles of SMAD4 and JAC based on CyTOF were classified into five categories: I, II, III, IV, and V. Violin plots show ordered SMAD4 expression level (low to high) and distribution in the individual subpopulations (A). Expression heatmaps of JAC were aligned according to SMAD4 expression levels (in descending order) in different cellular subpopulations (B). Area of circle denotes relative cell proportion of a subpopulation within each sample and ordered in the aforementioned five categories in cellular subpopulations of EME6/7t lines and primary tumors (C). Tumors were ordered from top to bottom based on increased patients’ BMIs and histology classes.
(D) Balloon plots of subpopulation distributions of endometrial tumors in the five categories based on histology and BMI. Circle area indicates the size of each subpopulation. Categories IV and V were associated with relatively high expression levels of SMAD4 and JAC, whereas low levels of SMAD4 and JAC were noted in categories I, II, and III.
(E) Violin plots showing the average expression levels of four JAC markers—ADAM15, ROCK1, Cx43, and Gas1—based on patients’ tumor histology: papillary serous and endometrioid.
(F) Balloon plots of subpopulation distributions in the five categories stratified by BMI into three groups: normal weight (NW), obesity (OB), and morbid obesity (MOB).
(G) Violin plots showing the average expression levels of ADAM15, ROCK1, Cx43, and Gas1, based on three BMI groups: NW, OB, and MOB. Lower JAC expressions corresponded with patients with higher BMIs. ****p < 0.0001.
See also Figure S7.
When further aligning these EEC subpopulations with tumor histology, we found that patients with endometrioid endometrial cancers (i.e., P09, P14, P06, P15, P03, P10, and P11) tended to have larger proportions of low SMAD4-expressing cells (e.g., categories I and II) and smaller proportions of high SMAD4-expressing cells (e.g., categories III and IV) than patients with papillary serous carcinomas (i.e., P07 and P08) (Figure 7D; Table S2). The average expression of 4 of the 11 JAC markers analyzed (i.e., ADAM15, ROCK1, Cx43, and Gas1) was also decreased in the endometrioid group relative to the papillary serous group (p < 0.0001; Figure 7E). A similar trend of reduced expression of both SMAD4 and JAC markers was seen in obese and morbidly obese groups relative to the normal weight group (p < 0.0001; Figures 7F and 7G). This CyTOF finding further corroborates the notion that SMAD4-modulated JAC repression observed in vitro recapitulates a transcriptional regulatory program in vivo, particularly in endometrioid carcinomas.
DISCUSSION
ASCs derived from adipose tissues, including the parametrial fat near the uterus, can be mobilized via chemokine actions to the endometrial microenvironment and promote epithelial tumorigenesis (Ma et al., 2016; Zhang et al., 2010; Zhang and Kolonin, 2016). These adipocyte progenitors exert paracrine actions by secreting abundant PAI-1 and other factors that may alter signaling responses in nearby EECs. To simulate this event in vitro, we exposed EECs to ASC-CM for downstream analyses of gene and protein expression. Furthermore, transcriptomic profiling and pathway enrichment analysis identified TGF-β/SMAD as a key pathway negatively regulated by PAI-1, which could diminish TGF-β-mediated tumor suppressor activity. While the link between hyperplastic development and tumorigenesis is not directly addressed by the current in vitro exposure model, future studies will include EECs derived from endometrial hyperplasia to further assess the role of PAI-1 in promoting endometrial tumorigenesis. Long-term chronic ASC exposure may engender obesity-associated transcriptional repression profiles. These tumorigenic effects may be initiated early in pre-menopausal persons with obesity, resulting in the observed increased incidence of premenopausal endometrial hyperplasia and type 1 cancer. Alternatively, the PAI-1 tumorigenic effects may manifest later in life, resulting in the development of typical postmenopausal endometrial cancer (Gressel et al., 2015; Nevadunsky et al., 2014; Onstad et al., 2016; Wise et al., 2016). In the current study, ASC infiltration was associated positively with BMI in a premenopausal patient cohort (<50 years old). A limitation of the study was the absence of a postmenopausal study cohort. Future studies will examine the association of ASC infiltration in a large cohort of both premenopausal and postmenopausal patients, balanced BMI, and other clinical variables. In addition, a limited number of tumor samples, yet reflective of our patient population, was used in the current CyTOF analysis. These studies support the TCGA transcriptomic data that lower SMAD4 and corresponding JAC expression occurred in tumors from higher-BMI type 1 patients. Because of the extensive time needed to acquire a large set of prospective fresh tumor samples for CyTOF analysis, we will expand the patient cohort in future studies.
As a serine protease inhibitor, PAI-1 is a well-known antagonist of the plasminogen activator system (Czekay et al., 2011). However, a growing body of evidence indicates that PAI-1 interacts with signal transducer LRP1 and becomes internalized to regulate oncogenic transcription programs, resulting in epithelial-to-mesenchymal transition, cytoskeletal reorganization, and cellular migration and invasion (Czekay et al., 2011; Degryse et al., 2004; Xian et al., 2017; Yamada et al., 2019). Our present findings add to the list of PAI-1-mediated tumorigenic events by describing two functions of PAI-1-LRP1 interactions in deregulating TGF-β/SMAD signaling. First, PAI-1 mobilizes LRP1-ICD to bind the SMAD4 promoter for transcription repression. Second, the PAI-1-LRP1 signaling independently enhances ubiquitin-mediated SMAD4 degradation. These combined effects of transcriptional and post-translational regulation can greatly attenuate tumor-suppressive functions of TGF-β/SMAD signaling.
Among the PAI-1-dependent JAC factors we identified in the present study that are under the regulatory control of SMAD4, ADAM15, ROCK1, Cx43, and Gas1 are integral components involved in cell-cell adhesion, extracellular matrix (ECM) interaction, and inter-cellular communication (Jin et al., 2015; Parsons et al., 2010; Vicente-Manzanares et al., 2009). Consistently, turnover of focal adhesion factors is associated with a loss of integrin interactions with ECM substrates, leading to enhanced cellular motility (Nagano et al., 2010; Webb et al., 2002). Other studies showed that cell-ECM interactions are stabilized by ROCK1, whereas a loss of ROCK1 and internalization of integrins facilitate cell-cell detachment (Parsons et al., 2010; Vicente-Manzanares et al., 2009). In addition, cell-cell adhesion not only regulates, but is also stabilized by gap junctions, which are intercellular channels allowing for direct electro-chemical communication between adjacent cells (Evans and Martin, 2002; Kanaporis et al., 2008). The major gap-junction structural protein in the endometrium Cx43 is downregulated by PAI-1 in ASC-exposed EECs. These effects enhance cellular motility and facilitate cellular invasiveness (Polusani et al., 2019; Stuelten et al., 2018). Collectively, the data suggest that the deregulation of JAC by PAI-1 is a mechanism for enhancing pro-tumorigenic changes in obesity-driven endometrial cancer.
Overall, our studies outline mechanistic insights that ASC-secreted PAI-1 induces transcriptomic and proteomic programs altering tumor-suppressive TGF-β signaling activities and JAC gene expression, which are associated with decreased cellular and ECM interactions. These negative transcriptional regulatory effects are mediated in part by the suppression of SMAD4 via PAI-1-LRP1 interactions. The current study demonstrates a paracrine effect of tumor-infiltrating and PAI-1-secreting ASCs on tumorigenic events in the epithelial compartment. Importantly, we provide evidence that this effect is heightened in persons with obesity. Epidemiologic studies have shown a positive correlation between BMI and the incidence of breast, ovarian, colon, and endometrial cancers (Sahoo et al., 2018). As the obesity epidemic widens, it is expected that the incidence of obesity-mediated cancers will rise sharply. We recommend that the role of PAI-1-mediated mechanisms outlined in this study be studied in other obesity-associated malignancies. Future studies will also examine whether PAI-1-LRP1 initiates a transcriptomic program shift from SMAD4- to STAT1-mediated gene transactivation and whether the long-term loss of SMAD4 leads to epigenetic silencing of target loci (Degryse et al., 2004). The expression signatures mediated by PAI-1 will need to be evaluated further in adiposity-linked endometrial clinical samples for tumorigenic development. Therefore, our current data provide the rationale to pursue translational studies for the development of proteomic signatures that evaluate the risk of endometrial cancer development in women with obesity.
STAR★METHODS
RESOURCE AVAILABILITY
Lead Contact
Further information and requests for resources should be directed to and will be fulfilled by the Lead Contact, Tim Hui-Mng Huang (huangt3@uthscsa.edu).
Materials Availability
This study did not generate new unique reagents.
Data and Code Availability
The raw single-cell RNA-seq data have been deposited in NCBI GEO under accession number GSE140130. Original data of Figure 1C, 4B, 4C, and 4F have been deposited to Mendeley Data (http://doi.org/10.17632/5ywmdd6fnd.1).
EXPERIMENTAL MODEL AND SUBJECT DETAILS
Clinical Samples
Tumor tissues for tissue microarray and CyTOF analyses were collected following the IRB protocols at the University of Texas Health Science Center at San Antonio (Tables S1 and S2). The Cancer Genome Atlas (TCGA) Uterine Corpus Endometrial Carcinoma (UCEC) cohort was used to identify BMI-associated genes.
Cell Lines, Cell Culture and In Vitro Exposure Model
ASCs isolated from ten female subjects were purchased from Coriell Institute (Camden, NJ, Cat# AG17870) and Zen-Bio Inc. (Research Triangle Park, NC, Cat# ASC-F-SL Lot# ASC0051, ASC0053, ASC0060, ASC0061, ASC0065, ASC0064, Cat# ASC-F Lot# ASC032003, ASC050709B, Cat# ASC-F-D Lot# ASCD011906). ASCs were cultured in non-differentiating media (DMEM supplemented with 5% FBS) and grown on fibronectin-coated culture dishes. For ASC-condition media (ASC-CM) exposure model, cells were treated with ASC-CM of 48 hr (Polusani et al., 2019). Non-tumorigenic and immortalized endometrial epithelial cell (EEC) line EM-E6/E7/TERT-1 (designated as EME6/7t) were established and characterized by Kyo et al. (2003). Cell line authentication was carried out by STR analysis at ATCC. EECs were cultured in Dulbecco’s Modified Eagle Medium: Nutrient Mixture F-12 (DMEM/F-12) supplemented with 10% fetal bovine serum (FBS) and 100 U/mL penicillin/streptomycin. Un-immortalized human endometrial epithelial cells (HEuEC) were obtained from Lifeline Cell Technology (Cat# FC-0078) and cultured in reproductive medium complete kit (Lifeline Cell Technology, Cat# LL-0068) according to the manufacturer’s instructions. For scRNA-seq, CyTOF analysis and function assays, PAI-1 antagonist, tiplaxtinin (PAI-039, 50 μM, Selleckchem, Cat# S7922) was used with ASC-CM for 24 hr (Polusani et al., 2019). Before ASC-CM treatment, LRP1 antagonist, RAP (5 μg/mL, Millipore Sigma, Cat# 55-350-650UG) was used to treat cells for 30 min (Tanaga et al., 2004); Proteasome Inhibitor, MG132 (10 μM, Sigma Aldrich, Cat# M7449–200UL) was used to treat cells for 3 hr (van Tijn et al., 2007).
Generation of SMAD4 Stable Knockdown Cells
SMAD4 short hairpin RNA (shRNA) lentiviral particles were produced using MISSION shRNA Bacterial Glycerol Stock SMAD family member (TRCN0000040032, MISSION shRNA Bacterial Glycerol Stock; Sigma-Aldrich) according to the protocol provided. The shRNA nontargeting control vector pLKO.1 puro (Addgene, Cat# 8453) was used as a negative control. 293T cells were co-transfected with 2nd generation packaging system mix (ABM, Cat# LV003) according to the manufacturer’s instructions. The lentivirus was harvested 48 hr later, filtered and infected EECs for 24 hr. Stable cell clones were generated by replacing with complete media containing 2 μg/mL puromycin and selected for 3 weeks.
METHOD DETAILS
Immunohistochemistry (IHC)
Sections of formalin-fixed paraffin-embedded tissues were analyzed by using antigen retrieval, washing, and blocking. Adipose stromal cells (ASCs) were stained with the WAT7 peptide and endothelial cells with CD31 antibody, as described previously (Daquinag et al., 2017). Differences in the number of ASCs within the stromal compartment of the tumor sections were counted and scored as previously described by two investigators independently (Hammes et al., 2007).
Luminex Technology Multiplex Assays
Fresh conditioned media was collected from culture dishes, and debris/cells were removed by centrifugation and 0.45 μm filters. PAI-1 levels were measured along with other adipokines and cytokines (n = 11) by using MILLIPLEX MAP Human Adipocyte Magnetic Bead Panel - Endocrine Multiplex Assay (MilliporeSigma, Cat# HADCYMAG-61K) following the manufactures instructions. The values were detected by Luminex® 200 multiplexing system (MilliporeSigma). Levels of PAI-1 and other cytokines/adipokines were calculated in reference to a standard curve and normalized to total proteins from ASCs in cell culture.
Matrigel Invasion Assay
A 24-well chamber plate with polycarbonate member, 0.8 μm pore size (Thermo Scientific, Cat# 140629) was utilized to evaluate cell motility. The inserts were coated with Matrigel to shape a matrix barrier. 5×10⁴ cells were plated in the upper compartment and cultured in serum-free medium. The bottom chambers were filled with 600 μL ASC-CM or ASC’s regular media. Cells were incubated at 37°C for 18 hr and then removed by rubbing the upper surface of the membrane. After fixed in 70% methanol for 30 min, stained with 0.1% crystal violet for 10 min, and washed, migrated cells on lower surface of membrane were counted in six randomly selected microscopic fields and quantified using ImageJ software.
Cellular Proliferation and Migration Assays
Proliferation and migration assays were conducted using a live-cell imaging system IncuCyte (Essen Bioscience). For cellular proliferation, 3,000 cells/per well were plated in quadruplicate in 96 wells plates. For migration assay, cells were plated in quadruplicate in 96 wells plates and scratched using a 96-pin WoundMaker of IncuCyte scratch system when cells were grown to confluence. Cell and wound images were automatically carried. The real-time kinetic data of proliferation and migration was calculated as phase object confluence and wound confluence, respectively, and analyzed by IncuCyte software system.
Single-cell RNA-seq
For single-cell capture, cells were loaded into a 10–17 μm Fluidigm C1 mRNA Seq HT Integrated Fluidic Circuit (IFC), capable of capturing up to 800 cells, and processed by the C1 Single-Cell Auto Prep System. Single-cell cDNA was generated in the C1 System in an automated fashion, according to manufacturer’s protocols (Fluidigm). Single-cell cDNA samples were then subjected to tagmentation and amplification. Indices were added during the enrichment step using the Nextera XT Index Kit v2 (Illumina) top generate barcoded cDNA libraries. The cDNA libraries sequencing was performed in the NextSeq 500 sequencing system (Illumina), with each sample running in one lane of a 4 lanes flowcell. The loading amount was adjusted for each sample (1.8 pM pooled library + 20% Phix which adds diversity for sequencing quality) following manufacturer’s instruction.
Single-cell RNA-seq Data Processing
The output of scRNA-seq data from NextSeq 500 was first demultiplexed using stand-alone API script (Fluidigm), and R2 reads were aligned to GRCh38 human genome in STAR aligner (Dobin et al., 2013). The expression levels were further quantified as FPKM values using RSEM. For data quality purposes, sequenced cells with more than 150,000 reads were analyzed (n ≥ 600 cells). The average gene numbers of each treatment are Ctrl: 6,786, CM: 6,696, CM+Tip: 7,253. The average gene number of all single cells is 6,911. Seurat software was applied to assess the batch effect by canonical correlation analysis (CCA), cluster the cells by performing non-linear dimensional reduction, tSNE, based on the information of the principal component analysis (Butler et al., 2018). The differentially expressed genes (n = 1,301) across all clusters between the treatments were the same with and without CCA, indicating that the batch effect if any is minimal. The differentially expressed genes in each cluster were further identified using FindMarkers in Seurat.
scRNA-seq data z-score normalization was performed for expression analysis. Heatmaps, t-SNE and violin plots (R packages: Rtsne and ggplot2) were used to display the cluster maps of different cell treatments (Van Der Maaten and Hinton, 2008; Wickham, 2009). For the pseudotime analysis, z-score of each subpopulation was analyzed by the R package destiny, which produced a dimensionality reduction and a pseudotime prediction. The dimensionality of data (DC1 and DC2) and diffusion pseudotime (DPT) was calculated to display distribution maps of individual subpopulation and their expression patterns. In pathway enrichment analysis, gene lists were collected from Hallmark Gene Sets, and the distribution of different signaling pathways was plotted using R packages: reshape2 and ggplot2. For gene correlation matrix analysis, the correlation between oncogenic signaling pathways and cellular junction complexes was calculated using R package corrplot.
In Situ Proximity Ligation Assay (PLA)
Protein-protein interactions in different EECs treatment groups were examined by PLA using Duolink® In Situ Red Starter Kit following the manufactures instructions (Sigma Aldrich, Cat# DUO92101 and # DUO92105). For the association assay between LRP1 and PAI-1, cells were permeabilized with (intracellular interaction) or without (cell surface interaction) 0.2% (v/v) Triton X-100 for 10 min after fixing. Cells were incubated with rabbit polyclonal anti-LRP-1 antibody (1:250, Cell Signaling Technology, Cat# 64099S) and mouse monoclonal anti-PAI-1 antibody (1:200, Santa Cruz Biotechnology, Cat# sc-5297), which were tagged with anti-rabbit PLUS and anti-mouse MINUS probes. For the association assay between SMAD4 and ubiquitin, cells were permeabilized with 0.2% (v/v) Triton X-100 for 10 min after fixing and incubated with goat polyclonal anti-SMAD4 antibody (1:200, R&D Systems, Cat# AF2097) and rabbit polyclonal anti-ubiquitin antibody (1:200, Novus Biologicals, Cat# NB300129) which were tagged with anti-goat PLUS and anti-rabbit MINUS. The cells were then mounted with DAPI after washing and signal amplification with Duolink reagents. Cell images were acquired by the Zeiss LSM 710 confocal microscopy and ZEN blue software.
Chromatin Immunoprecipitation (ChIP)-qPCR
ChIP assays were performed using Pierce Magnetic ChIP Kit according to the manufacturer’s protocol (ThermoFisher Scientific, Cat# 26157). All reagents used were included in the kit. Briefly, 4 × 10⁶ cells were cross-linked using 1% paraformaldehyde for 5 min and reactions were quenched by glycine for 5 min at room temperature. After lysis and MNase digestion, DNA fragments in the cell lysates were sheared to size 300–500 bp by the Q800R3 Sonicator (20% amplitude, 10 s on, 20 s off for 8 min) (Qsonica). Then, cell lysates were incubated with an anti-SMAD4 antibody (R&D Systems, Cat# AF2097), anti-LRP1-ICD antibody (Abcam, Cat# ab92544), normal goat IgG antibody (Abcam, Cat# ab37373) or normal rabbit IgG antibody (Pierce Magnetic ChIP Kit, ThermoFisher Scientific, Cat# 26157) overnight at 4°C. The immunoprecipitated genomic DNA fragments were eluted and amplified using quantitative real-time PCR. Specific antibody signals were normalized to the input signals. Quantitative real-time PCR results were compared statistically using Student’s t test. Primers used for qPCR analysis are listed in Table S4.
Reverse Transcription (RT)-qPCR
RNA was isolated by Direct-zol RNA Microprep Kits (Zymo Research, Cat# R2062) and reversed transcribed using a High-Capacity cDNA Reverse Transcription Kit (Applied Biosystems, Cat# 4368814). Quantitative real-time PCR was performed using a LightCycler® 480 SYBR Green I Master (Roche, Cat# 04887352001) by LightCycler® 480 System (Roche). Each sample was tested at least in triplicate. Target gene expression levels were normalized based on the housekeeping ubiquitin (UBB) gene expression levels. Relative mRNA levels were calculated using the 2−ΔΔCt method. PCR primers for specific gene amplification are listed in Table S5.
Quantitative Capillary Western Immunoassay
Cells were lysed on ice using RIPA buffer (Thermo Fisher Scientific, Cat# 89901). The lysates were analyzed using the 12–230 kDa Wes separation module of the quantitative capillary Western immunoassay system (ProteinSimple). Anti-rabbit or anti-mouse detection module and anti-goat secondary antibodies were used for Wes per the manufacturer’s recommendation (ProteinSimple). Primary antibodies used were as follows: LRP1 (1:25, Cell Signaling Technology, Cat# 64099S), SMAD4 (1:10, R&D Systems, Cat# AF2097), and β-actin (1:200, R&D Systems, Cat# MAB8929) as a housekeeping control. Data were analyzed and displayed in Compass for SW (Version: 3.1.7).
CyTOF Mass Cytometry
CyTOF staining panels are detailed in Table S3. Antibodies were purchased from the Fluidigm or conjugated in-house according to the manufacturer’s instructions (Fluidigm). Tumors were dissociated in digestion medium as previously described (Lambrechts et al., 2018), and then passed through 40 μm filters into PBS at 4°C. The cells were centrifuged at 300 g for 5 min at 4°C and then depleted of erythrocytes by hypotonic lysis for 5 min at room temperature. Single-cell suspensions were incubated with Cell-ID Cisplatin (Fluidigm, Cat# 201064) to label dead cells to be excluded form analysis. Cells were fixed and permeabilized by Fix I Buffer (Fluidigm, Cat# 201065) and then patients’ samples were barcoded by Cell-ID 20-Plex Pd Barcoding Kit following the manufactures instructions (Fluidigm, Cat# 201060). After washing, cells were incubated with the panel of antibodies for 1h at room temperature for cell staining. Cells were then fixed with MaxPar Fix and Perm Buffer (Fluidigm, Cat #201067) containing Cell-ID Intercalator-Ir 191/193 (Fluidigm, Cat #201192A) at 0.125 mM and 4°C overnight to stain the nuclei. After signal beads were normalized by EQ Four Element Calibration, cell events were analyzed by Helios mass cytometer (Fluidigm).
After raw data debarcoding and normalization by the CyTOF software (Version 6.7.1014, Fluidigm), cell gating was performed in Cytobank (https://www.cytobank.org/, Cytobank Inc.) (Chen and Kotecha, 2014). Cytofkit (Chen et al., 2016) was used for qualitative assessments and visual illustrations by an automated clustering algorithm PhenoGraph. Using the R package Cytofkit, data was clustered and represented in t-SNE maps. Heatmaps (MeV), violin plots (R package ggplot2), and balloon plots (R package ggplot2) were employed to display differences in expression and subpopulation size in different clusters. For pseudotime analysis, normalized CyTOF data was analyzed by R package Destiny (version 3.8) which produces dimensionality reduction and pseudotime prediction (Angerer et al., 2016). Samples from each patient were randomly assessed for 300 cells by R package. DC1 and DC2 and DPT (R package ggplot2) were calculated to plot diffusion maps.
QUANTIFICATION AND STATISTICAL ANALYSIS
Statistical analysis was conducted using Microsoft excel Office 365 and Duncan’s multiple range test by R package. Mann-Whitney U tests were used to compare the expression of individual genes in tumor and normal samples in the Cancer Genome Atlas (TCGA) Uterine Corpus Endometrial Carcinoma (UCEC) cohort. scRNA-seq and CyTOF data were normalized before signal or expression analysis. Data was presented as mean ± SD (standard deviation) in the figure legends unless otherwise stated. Significance was determined by a Student’s t test and p values are indicated in the figure legends. A p < 0.05 was considered as statistical significance. Duncan’s multiple range test was employed to compare gene expression among different individuals with BMI in TCGA cohort.
Supplementary Material
KEY RESOURCES TABLE
| REAGENT or RESOURCE | SOURCE | IDENTIFIER |
|---|---|---|
| Antibodies | ||
| Anti-CD45 conjugated to 89Yb (clone H130) | Fluidigm | Cat# 3089003B; RRID:AB_2661851 |
| Anti-CD181 conjugated to 142 Nd (clone 8F1/CXCR1) | Fluidigm | Cat# 3142009B |
| Anti-CD31 conjugated to 144Nd (clone WM59) | Fluidigm | Cat# 3143016B |
| Anti-CD182 conjugated to 147Sm (clone 5E8/CXCR2) | Fluidigm | Cat# 3147010B |
| Anti-CD34 conjugated to 148Nd (clone 581) | Fluidigm | Cat# 3148001B; RRID:AB_2810243 |
| Anti-CD200 conjugated to 149Sm (clone OX104) | Fluidigm | Cat# 3149007B |
| CK8/18 (KRT8/18, clone C51) | Fluidigm | Cat# 3174014A |
| CD10 (clone HI10a) | Fluidigm | Cat# 3158011B |
| ZO2 (clone 3E8D9) | ThermoFisher Scientific | Cat# 37-4700; RRID:AB_2533321 |
| SMAD2 (clone 31H15L4) | ThermoFisher Scientific | Cat# 700048; RRID:AB_2532277 |
| Fyn (FYN) | ThermoFisher Scientific | Cat# PA5-14780; RRID:AB_2108443 |
| Gas1 (GAS1) | Thermo Fisher Scientific | Cat# PA5-48298; RRID:AB_2633756 |
| ZO1 (ZO1, clone 1A12) | ThermoFisher Scientific | Cat# 33-9100; RRID:AB_87181 |
| SDC3 (SDC3) | R&D Systems | Cat# AF3539; RRID:AB_622125 |
| SMAD4 (SMAD4, clone 253343) | R&D Systems | Cat# MAB2097; RRID:AB_2286470 |
| TGFR2 (TGFBR2) | R&D Systems | Cat# AF241-NA; RRID:AB_354416 |
| EpCAM (EPCAM) | R&D Systems | Cat# AF960; RRID:AB_355745 |
| SDC3 (SDC3) | R&D Systems | Cat# AF3539; RRID:AB_622125 |
| SMAD4 (SMAD4) | R&D Systems | Cat# AF2097; RRID:AB_355150 |
| cIAP1 (BIRC2) | Abcam | Cat# ab226031 |
| Paxillin (PXN, clone Y113) | Abcam | Cat# ab216652 |
| ROCK1 (ROCK1, clone EP786Y) | Abcam | Cat# ab219587 |
| ADAM15 (clone 23G9) | Novus Biologicals | Cat# MAB935-100 |
| Ubiquitin | Novus Biologicals | Cat# NB300129; RRID:AB_2180545 |
| PAI-1 (clone C-9) | Santa Cruz Biotechnology | Cat# sc-5297; RRID:AB_628154 |
| CD31 | Santa Cruz Biotechnology | Cat# sc-1506-R; RRID:AB_831096 |
| Cx43 | Cell Signaling Technology | Cat# 3512S; RRID:AB_1007667 |
| Cx43 (GJA1) | Sigma | Cat# SAB4501175; RRID:AB_10746172 |
| AMIGO2 (AMIGO2) (clone 30G9.1G2) | Kerafast | Cat# EBS001 |
| LRP1 | Cell Signaling Technology | Cat# 64099S; RRID:AB_2799654 |
| LRP1-ICD | Abcam | Cat# ab92544; RRID:AB_2234877 |
| β-actin | R&D Systems | Cat# MAB8929; RRID:AB_10716360 |
| 20X Anti-Rabbit HRP Conjugate | ProteinSimple | Cat# 043-426 |
| Normal goat IgG antibody | Abcam | Cat# ab37373 |
| Normal rabbit IgG antibody | ThermoFisher Scientific Pierce Magnetic ChIP Kit | Cat# 26157 |
| Biological Samples | ||
| Human endometrial tumor FFPE tissues | The University of Texas Health Science center | Protocol: HSC20180584HR |
| Human endometrial tumors for CyTOF | The University of Texas Health Science center | Protocol: HSC20180584HR |
| Chemicals, Peptides, and Recombinant Proteins | ||
| WAT7 peptides | This paper | N/A |
| Cell-ID Cisplatin | Fluidigm | Cat# 201064 |
| Cell-ID Intercalator-Ir | Fluidigm | Cat# 201192A |
| Tiplaxtinin (PAI-039) | Selleckchem | Cat# S7922 |
| RAP | Millipore Sigma | Cat# 55-350-650UG |
| MG132 | Sigma Aldrich | Cat# M7449-200UL |
| RIPA buffer | Thermo Fisher Scientific | Cat# 89901 |
| Fix I Buffer | Fluidigm | Cat# 201065 |
| Critical Commercial Assays | ||
| MILLIPLEX MAP Human Adipocyte Magnetic Bead Panel - Endocrine Multiplex Assay | MilliporeSigma | Cat# HADCYMAG-61K |
| Qubit dsDNA HS Assay Kit | Invitrogen | Cat# Q32854 |
| C1 Single-Cell mRNA Seq HT 10–17 mm IFC | Fluidigm | Cat# 101-4982 |
| C1 Single-Cell mRNA Seq HT Reagent Kit v2 | Fluidigm | Cat# 101-3473 |
| Nextera® XT DNA Library Prep Kit | Illumina | Cat# FC-131-1096 |
| Nextera® XT Index Kit v2 Set A | Illumina | Cat# FC-131-2001 |
| Nextera® XT Index Kit v2 Set B | Illumina | Cat# FC-131-2002 |
| Direct-zol RNA Microprep Kits | Zymo Research | Cat# R2062 |
| High-Capacity cDNA Reverse Transcription Kit | Applied Biosystems | Cat# 4368814 |
| LightCycler® 480 SYBR Green I Master | Roche | Cat# 04887352001 |
| 12–230 kDa Wes Separation Module, 8 × 25 capillary cartridges | ProteinSimple | Cat# SM-W004 |
| Anti-Rabbit Detection Module for Wes, Peggy Sue or Sally Sue | ProteinSimple | Cat# DM-001 |
| Anti-Mouse Detection Module for Wes, Peggy Sue or Sally Sue | ProteinSimple | Cat# DM-002 |
| 2nd Generation Packaging System Mix | Abcam | Cat# LV003 |
| Duolink® In Situ Red Starter Kit Mouse/Rabbit | Sigma Aldrich | Cat# DUO92101 |
| Duolink® In Situ Red Starter Kit Goat/Rabbit | Sigma Aldrich | Cat# DUO92105 |
| Pierce Magnetic ChIP Kit | ThermoFisher Scientific | Cat# 26157 |
| Cell-ID 20-Plex Pd Barcoding Kit | Fluidigm | Cat# 201060 |
| Deposited Data | ||
| Raw Single-cell RNA-seq data | This paper | GEO: GSE140130 |
| Experimental Models: Cell Lines | ||
| EME6/E7/TERT | Kyo et al., 2003 | N/A |
| Adipose stromal cells | Coriell Institute | Cat# AG17870 |
| Adipose stromal cells | Zen-Bio Inc. | Cat# ASC-F-SL Lot# ASC0051, ASC0053, ASC0060, ASC0061, ASC0065, ASC0064, Cat# ASC-F Lot# ASC032003, ASC050709B, Cat# ASC-F-D Lot# ASCD011906 |
| Human endometrial epithelial cells (HEuEC) | Lifeline Cell Technology | FC-0078 |
| Oligonucleotides | ||
| SMAD4 shRNA | Sigma-Aldrich | Cat# TRCN0000040032 |
| Primers for qRT-PCR primers, see Table S5 | This paper | N/A |
| Primers for ChIP-qPCR primers, see Table S4 | This paper | N/A |
| Recombinant DNA | ||
| pLKO.1 puro | Addgene | Cat# 8453 |
| Software and Algorithms | ||
| ZEN blue software | Zeiss Company | N/A |
| Seurat algorithm | Butler et al., 2018 | https://satijalab.org/seurat/ |
| MeV | N/A | http://mev.tm4.org |
| R package: ggplot2 | Wickham, 2009 | https://ggplot2.tidyverse.org |
| R package: Rtsne | Van Der Maaten and Hinton, 2008 | https://github.com/jkrijthe/Rtsne |
| Compass for SW (Version: 3.1.7) | ProteinSimple | N/A |
Highlights.
ASC infiltration in endometrial tumor microenvironments positively correlates with BMI
ASC-secreted PAI-1 influences heterogeneous endometrial epithelial cell subpopulations
PAI-1-LRP1-modulated SMAD4 downregulation leads to JAC repression in vitro
Repressive JAC is present in cancer cell subpopulations of persons with obesity
ACKNOWLEDGMENTS
The authors acknowledge the assistance of the University of Texas Health San Antonio Next-Generation Sequencing Core for RNA-seq; the Bioanalytics and Single-Cell Core for single-cell capture and sequencing library generation as well as CyTOF Mass Cytometry studies; and the Optical Imaging Core Facility for confocal microscopy. This work was supported by NIH grants R01 CA172279 and P30 CA054174, the Cancer Prevention and Research Institute of Texas (CPRIT) grant RP150600, the San Antonio Cancer Council, and the Max and Minnie Tomerlin Voelcker Fund.
Footnotes
SUPPLEMENTAL INFORMATION
Supplemental Information can be found online at https://doi.org/10.1016/j.celrep.2020.108253.
DECLARATION OF INTERESTS
The authors declare no competing interests.
REFERENCES
- Angerer P, Haghverdi L, Büttner M, Theis FJ, Marr C, and Buettner F (2016). destiny: diffusion maps for large-scale single-cell data in R. Bioinformatics 32, 1241–1243. [DOI] [PubMed] [Google Scholar]
- Aoki-Kinoshita KF, and Kanehisa M (2007). Gene annotation and pathway mapping in KEGG. Methods Mol. Biol 396, 71–91. [DOI] [PubMed] [Google Scholar]
- Butler A, Hoffman P, Smibert P, Papalexi E, and Satija R (2018). Integrating single-cell transcriptomic data across different conditions, technologies, and species. Nat. Biotechnol 36, 411–420. [DOI] [PMC free article] [PubMed] [Google Scholar]
- Carmeliet P (2003). Angiogenesis in health and disease. Nat. Med 9, 653–660. [DOI] [PubMed] [Google Scholar]
- Chen TJ, and Kotecha N (2014). Cytobank: providing an analytics platform for community cytometry data analysis and collaboration. Curr. Top. Microbiol. Immunol 377, 127–157. [DOI] [PubMed] [Google Scholar]
- Chen H, Lau MC, Wong MT, Newell EW, Poidinger M, and Chen J (2016). Cytofkit: a bioconductor package for an integrated mass cytometry data analysis pipeline. PLoS Comput. Biol 12, e1005112. [DOI] [PMC free article] [PubMed] [Google Scholar]
- Chusyd DE, Wang D, Huffman DM, and Nagy TR (2016). Relationships between rodent white adipose fat pads and human white adipose fat depots. Front. Nutr 3, 10. [DOI] [PMC free article] [PubMed] [Google Scholar]
- Crandall DL, Quinet EM, El Ayachi S, Hreha AL, Leik CE, Savio DA, Juhan-Vague I, and Alessi MC (2006). Modulation of adipose tissue development by pharmacological inhibition of PAI-1. Arterioscler. Thromb. Vasc. Biol 26, 2209–2215. [DOI] [PubMed] [Google Scholar]
- Czekay RP, Wilkins-Port CE, Higgins SP, Freytag J, Overstreet JM, Klein RM, Higgins CE, Samarakoon R, and Higgins PJ (2011). PAI-1: An integrator of cell signaling and migration. Int. J. Cell Biol 2011, 562481. [DOI] [PMC free article] [PubMed] [Google Scholar]
- Daquinag AC, Tseng C, Zhang Y, Amaya-Manzanares F, Florez F, Dadbin A, Zhang T, and Kolonin MG (2016). Targeted proapoptotic peptides depleting adipose stromal cells inhibit tumor growth. Mol. Ther 24, 34–40. [DOI] [PMC free article] [PubMed] [Google Scholar]
- Daquinag AC, Dadbin A, Snyder B, Wang X, Sahin AA, Ueno NT, and Kolonin MG (2017). Non-glycanated decorin is a drug target on human adipose stromal cells. Mol. Ther. Oncolytics 6, 1–9. [DOI] [PMC free article] [PubMed] [Google Scholar]
- Degryse B, Neels JG, Czekay RP, Aertgeerts K, Kamikubo Y, and Loskutoff DJ (2004). The low density lipoprotein receptor-related protein is a motogenic receptor for plasminogen activator inhibitor-1. J. Biol. Chem 279, 22595–22604. [DOI] [PubMed] [Google Scholar]
- Dobin A, Davis CA, Schlesinger F, Drenkow J, Zaleski C, Jha S, Batut P, Chaisson M, and Gingeras TR (2013). STAR: ultrafast universal RNA-seq aligner. Bioinformatics 29, 15–21. [DOI] [PMC free article] [PubMed] [Google Scholar]
- Elokdah H, Abou-Gharbia M, Hennan JK, McFarlane G, Mugford CP, Krishnamurthy G, and Crandall DL (2004). Tiplaxtinin, a novel, orally efficacious inhibitor of plasminogen activator inhibitor-1: design, synthesis, and pre-clinical characterization. J. Med. Chem 47, 3491–3494. [DOI] [PubMed] [Google Scholar]
- Escobedo N, and Oliver G (2017). The lymphatic vasculature: its role in adipose metabolism and obesity. Cell Metab. 26, 598–609. [DOI] [PMC free article] [PubMed] [Google Scholar]
- Evans WH, and Martin PE (2002). Gap junctions: structure and function (Review). Mol. Membr. Biol 19, 121–136. [DOI] [PubMed] [Google Scholar]
- Freese KE, Kokai L, Edwards RP, Philips BJ, Sheikh MA, Kelley J, Comerci J, Marra KG, Rubin JP, and Linkov F (2015). Adipose-derived stems cells and their role in human cancer development, growth, progression, and metastasis: a systematic review. Cancer Res. 75, 1161–1168. [DOI] [PubMed] [Google Scholar]
- Ghosh S, Hughes D, Parma DL, Ramirez A, and Li R (2014). Association of obesity and circulating adipose stromal cells among breast cancer survivors. Mol. Biol. Rep 41, 2907–2916. [DOI] [PMC free article] [PubMed] [Google Scholar]
- Gressel GM, Parkash V, and Pal L (2015). Management options and fertility-preserving therapy for premenopausal endometrial hyperplasia and early-stage endometrial cancer. Int. J. Gynaecol. Obstet 131, 234–239. [DOI] [PubMed] [Google Scholar]
- Haghverdi L, Büttner M, Wolf FA, Buettner F, and Theis FJ (2016). Diffusion pseudotime robustly reconstructs lineage branching. Nat. Methods 13, 845–848. [DOI] [PubMed] [Google Scholar]
- Hammes LS, Korte JE, Tekmal RR, Naud P, Edelweiss MI, Valente PT, Longatto-Filho A, Kirma N, and Cunha-Filho JS (2007). Computer-assisted immunohistochemical analysis of cervical cancer biomarkers using low-cost and simple software. Appl. Immunohistochem. Mol. Morphol 15, 456–462. [DOI] [PubMed] [Google Scholar]
- Ishii K, Takahashi S, Sugimura Y, and Watanabe M (2018). Role of stromal paracrine signals in proliferative diseases of the aging human prostate. J. Clin. Med 7, 68. [DOI] [PMC free article] [PubMed] [Google Scholar]
- Jin S, Martinelli DC, Zheng X, Tessier-Lavigne M, and Fan CM (2015). Gas1 is a receptor for sonic hedgehog to repel enteric axons. Proc. Natl. Acad. Sci. USA 112, E73–E80. [DOI] [PMC free article] [PubMed] [Google Scholar]
- Kanaporis G, Mese G, Valiuniene L, White TW, Brink PR, and Valiunas V (2008). Gap junction channels exhibit connexin-specific permeability to cyclic nucleotides. J. Gen. Physiol 131, 293–305. [DOI] [PMC free article] [PubMed] [Google Scholar]
- Kauts ML, Pihelgas S, Orro K, Neuman T, and Piirsoo A (2013). CCL5/CCR1 axis regulates multipotency of human adipose tissue derived stromal cells. Stem Cell Res. (Amst.) 10, 166–178. [DOI] [PubMed] [Google Scholar]
- Kost ER, Valente PT, Lynch BA, Krishnegowda NK, Hertz AM, Hall KL, Riddle ND, and Tekmal RR (2016). Clinical and pathologic features of hispanic endometrial cancer patients with loss of mismatch repair expression. Int. J. Gynecol. Cancer 26, 1129–1136. [DOI] [PubMed] [Google Scholar]
- Kyo S, Nakamura M, Kiyono T, Maida Y, Kanaya T, Tanaka M, Yatabe N, and Inoue M (2003). Successful immortalization of endometrial glandular cells with normal structural and functional characteristics. Am. J. Pathol 163, 2259–2269. [DOI] [PMC free article] [PubMed] [Google Scholar]
- Lachance JA, Everett EN, Greer B, Mandel L, Swisher E, Tamimi H, and Goff B (2006). The effect of age on clinical/pathologic features, surgical morbidity, and outcome in patients with endometrial cancer. Gynecol. Oncol 101, 470–475. [DOI] [PubMed] [Google Scholar]
- Lambrechts D, Wauters E, Boeckx B, Aibar S, Nittner D, Burton O, Bassez A, Decaluwé H, Pircher A, Van den Eynde K, et al. (2018). Phenotype molding of stromal cells in the lung tumor microenvironment. Nat. Med 24, 1277–1289. [DOI] [PubMed] [Google Scholar]
- Liberzon A, Birger C, Thorvaldsdóttir H, Ghandi M, Mesirov JP, and Tamayo P (2015). The Molecular Signatures Database (MSigDB) hallmark gene set collection. Cell Syst. 1, 417–425. [DOI] [PMC free article] [PubMed] [Google Scholar]
- Lin X, Liang M, Liang YY, Brunicardi FC, Melchior F, and Feng XH (2003). Activation of transforming growth factor-beta signaling by SUMO-1 modification of tumor suppressor Smad4/DPC4. J. Biol. Chem 278, 18714–18719. [DOI] [PubMed] [Google Scholar]
- Ma T, Luan SL, Huang H, Sun XK, Yang YM, Zhang H, Han WD, Li H, and Han Y (2016). Upregulation of CC chemokine receptor 7 (CCR7) enables migration of xenogeneic human adipose-derived mesenchymal stem cells to rat secondary lymphoid organs. Med. Sci. Monit 22, 5206–5217. [DOI] [PMC free article] [PubMed] [Google Scholar]
- Nagano M, Hoshino D, Sakamoto T, Kawasaki N, Koshikawa N, and Seiki M (2010). ZF21 protein regulates cell adhesion and motility. J. Biol. Chem 285, 21013–21022. [DOI] [PMC free article] [PubMed] [Google Scholar]
- Nevadunsky NS, Van Arsdale A, Strickler HD, Moadel A, Kaur G, Levitt J, Girda E, Goldfinger M, Goldberg GL, and Einstein MH (2014). Obesity and age at diagnosis of endometrial cancer. Obstet. Gynecol 124, 300–306. [DOI] [PubMed] [Google Scholar]
- O’Sullivan J, Lysaght J, Donohoe CL, and Reynolds JV (2018). Obesity and gastrointestinal cancer: the interrelationship of adipose and tumour microenvironments. Nat. Rev. Gastroenterol. Hepatol 15, 699–714. [DOI] [PubMed] [Google Scholar]
- Onstad MA, Schmandt RE, and Lu KH (2016). Addressing the role of obesity in endometrial cancer risk, prevention, and treatment. J. Clin. Oncol 34, 4225–4230. [DOI] [PMC free article] [PubMed] [Google Scholar]
- Parsons JT, Horwitz AR, and Schwartz MA (2010). Cell adhesion: integrating cytoskeletal dynamics and cellular tension. Nat. Rev. Mol. Cell Biol 11, 633–643. [DOI] [PMC free article] [PubMed] [Google Scholar]
- Polusani SR, Huang YW, Huang G, Chen CW, Wang CM, Lin LL, Osmulski P, Lucio ND, Liu L, Hsu YT, et al. (2019). Adipokines deregulate cellular communication via epigenetic repression of gap junction loci in obese endometrial cancer. Cancer Res. 79, 196–208. [DOI] [PMC free article] [PubMed] [Google Scholar]
- Rota M, Rumi F, Bagnardi V, Dal Maso L, Zucchetto A, Levi F, La Vecchia C, and Tavani A (2016). Modelling body mass index and endometrial cancer risk in a pooled-analysis of three case-control studies. BJOG 123, 285–292. [DOI] [PubMed] [Google Scholar]
- Sahoo SS, Lombard JM, Ius Y, O’Sullivan R, Wood LG, Nahar P, Jaa-back K, and Tanwar PS (2018). Adipose-derived VEGF-mTOR signaling promotes endometrial hyperplasia and cancer: implications for obese women. Mol. Cancer Res 16, 309–321. [DOI] [PubMed] [Google Scholar]
- Seo BR, Bhardwaj P, Choi S, Gonzalez J, Andresen Eguiluz RC, Wang K, Mohanan S, Morris PG, Du B, Zhou XK, et al. (2015). Obesity-dependent changes in interstitial ECM mechanics promote breast tumorigenesis. Sci. Transl. Med 7, 301ra130. [DOI] [PMC free article] [PubMed] [Google Scholar]
- Soliman PT, Oh JC, Schmeler KM, Sun CC, Slomovitz BM, Gershenson DM, Burke TW, and Lu KH (2005). Risk factors for young premenopausal women with endometrial cancer. Obstet. Gynecol 105, 575–580. [DOI] [PubMed] [Google Scholar]
- Strong AL, Ohlstein JF, Biagas BA, Rhodes LV, Pei DT, Tucker HA, Llamas C, Bowles AC, Dutreil MF, Zhang S, et al. (2015). Leptin produced by obese adipose stromal/stem cells enhances proliferation and metastasis of estrogen receptor positive breast cancers. Breast Cancer Res. 17, 112. [DOI] [PMC free article] [PubMed] [Google Scholar]
- Stuelten CH, Parent CA, and Montell DJ (2018). Cell motility in cancer invasion and metastasis: insights from simple model organisms. Nat. Rev. Cancer 18, 296–312. [DOI] [PMC free article] [PubMed] [Google Scholar]
- Tanaga K, Bujo H, Zhu Y, Kanaki T, Hirayama S, Takahashi K, Inoue M, Mikami K, Schneider WJ, and Saito Y (2004). LRP1B attenuates the migration of smooth muscle cells by reducing membrane localization of urokinase and PDGF receptors. Arterioscler. Thromb. Vasc. Biol 24, 1422–1428. [DOI] [PubMed] [Google Scholar]
- Van Der Maaten L, and Hinton G (2008). Visualizing data using t-SNE. J. Mach. Learn. Res 9, 2579–2625. [Google Scholar]
- van Tijn P, de Vrij FM, Schuurman KG, Dantuma NP, Fischer DF, van Leeuwen FW, and Hol EM (2007). Dose-dependent inhibition of proteasome activity by a mutant ubiquitin associated with neurodegenerative disease. J. Cell Sci 120, 1615–1623. [DOI] [PubMed] [Google Scholar]
- Vicente-Manzanares M, Choi CK, and Horwitz AR (2009). Integrins in cell migration–the actin connection. J. Cell Sci 122, 199–206. [DOI] [PMC free article] [PubMed] [Google Scholar]
- Wang J, Huo K, Ma L, Tang L, Li D, Huang X, Yuan Y, Li C, Wang W, Guan W, et al. (2011). Toward an understanding of the protein interaction network of the human liver. Mol. Syst. Biol 7, 536. [DOI] [PMC free article] [PubMed] [Google Scholar]
- Webb DJ, Parsons JT, and Horwitz AF (2002). Adhesion assembly, disassembly and turnover in migrating cells – over and over and over again. Nat. Cell Biol 4, E97–E100. [DOI] [PubMed] [Google Scholar]
- Wei X, Li S, He J, Du H, Liu Y, Yu W, Hu H, Han L, Wang C, Li H, et al. (2019). Tumor-secreted PAI-1 promotes breast cancer metastasis via the induction of adipocyte-derived collagen remodeling. Cell Commun. Signal 17, 58. [DOI] [PMC free article] [PubMed] [Google Scholar]
- Wickham H (2009). ggplot2: elegant graphics for data analysis (Springer).
- Wise MR, Jordan V, Lagas A, Showell M, Wong N, Lensen S, and Farquhar CM (2016). Obesity and endometrial hyperplasia and cancer in premenopausal women: A systematic review. Am. J. Obstet. Gynecol 214, 689.e681–689.e617. [DOI] [PubMed] [Google Scholar]
- Xian X, Ding Y, Dieckmann M, Zhou L, Plattner F, Liu M, Parks JS, Hammer RE, Boucher P, Tsai S, and Herz J (2017). LRP1 integrates murine macrophage cholesterol homeostasis and inflammatory responses in atherosclerosis. eLife 6, e29292. [DOI] [PMC free article] [PubMed] [Google Scholar]
- Yamada M, Hayashi H, Suzuki K, Sato S, Inoue D, Iwatani Y, Ohata M, Yuan B, and Takagi N (2019). Furin-mediated cleavage of LRP1 and increase in ICD of LRP1 after cerebral ischemia and after exposure of cultured neurons to NMDA. Sci. Rep 9, 11782. [DOI] [PMC free article] [PubMed] [Google Scholar]
- Yilmaz E, Gul M, Melekoglu R, Inci Coskun E, Sahin N, Gul S, Bastemur AG, and Ciplak B (2018). Neural precursor cell-expressed developmentally down-regulated 4-like: a new biomarker in the pathophysiology of endometrial cancer. J. Int. Med. Res 46, 3709–3716. [DOI] [PMC free article] [PubMed] [Google Scholar]
- Zhang Y, and Kolonin MG (2016). Cytokine signaling regulating adipose stromal cell trafficking. Adipocyte 5, 369–374. [DOI] [PMC free article] [PubMed] [Google Scholar]
- Zhang Y, Bellows CF, and Kolonin MG (2010). Adipose tissue-derived progenitor cells and cancer. World J. Stem Cells 2, 103–113. [DOI] [PMC free article] [PubMed] [Google Scholar]
- Zhang T, Tseng C, Zhang Y, Sirin O, Corn PG, Li-Ning-Tapia EM, Troncoso P, Davis J, Pettaway C, Ward J, et al. (2016). CXCL1 mediates obesity-associated adipose stromal cell trafficking and function in the tumour microenvironment. Nat. Commun 7, 11674. [DOI] [PMC free article] [PubMed] [Google Scholar]
Associated Data
This section collects any data citations, data availability statements, or supplementary materials included in this article.
Supplementary Materials
Data Availability Statement
The raw single-cell RNA-seq data have been deposited in NCBI GEO under accession number GSE140130. Original data of Figure 1C, 4B, 4C, and 4F have been deposited to Mendeley Data (http://doi.org/10.17632/5ywmdd6fnd.1).