Abstract
The influenza B M2 (BM2) proton channel is activated by acidic pH to mediate virus uncoating. Unlike influenza A M2 (AM2), which conducts protons with strong inward rectification, BM2 conducts protons both inward and outward. Here we report 1.4- and 1.5-angstrom solid-state NMR structures of the transmembrane domain of the closed and open BM2 channels in phospholipid environment. Upon activation, the transmembrane helices increase the tilt angle by 6˚ and the average pore diameter enlarges by 2.1 Å. BM2 thus undergoes a scissor motion for activation, which differs from the alternating-access motion of AM2. These results indicate that asymmetric proton conduction requires a backbone hinge motion whereas bidirectional conduction is achieved by a symmetric scissor motion. The proton-selective histidine and gating tryptophan in the open BM2 reorient on the microsecond timescale, similar to AM2, indicating that sidechain dynamics are the essential driver of proton shuttling.
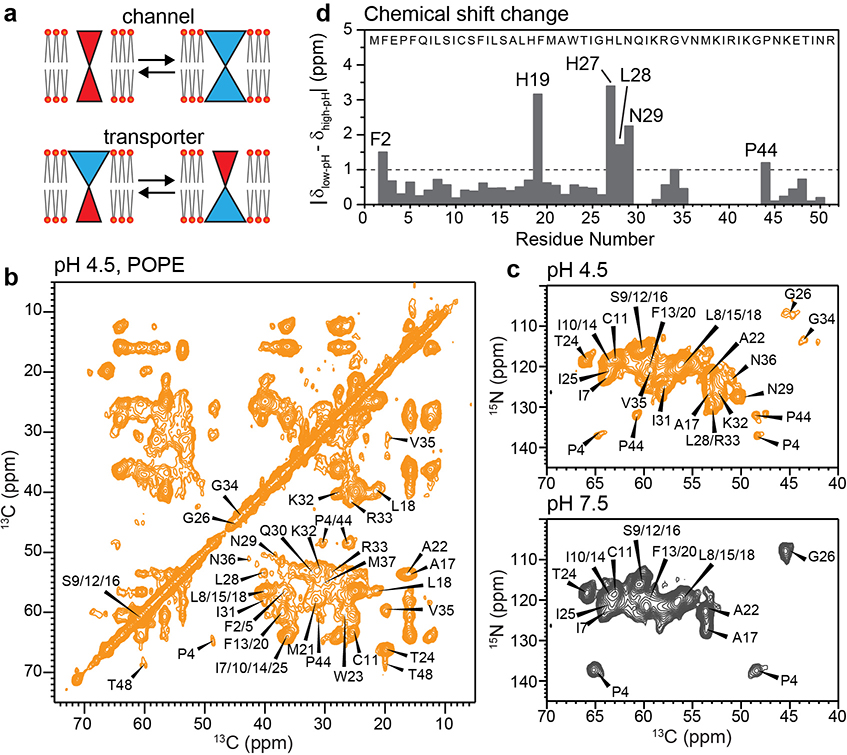
Precise control of ion movement into and out of cells and cellular compartments is essential for life. Ion channels and transporters carry out this function by converting between multiple conformations, but in distinct ways 1. Channels conduct substrates diffusively down their electrochemical gradients by opening a pore that is simultaneously accessible to both sides of the membrane, whereas transporters move substrates by alternatingly opening to one and the other side of the membrane 2,3 (Fig. 1a). Delineating the protein conformational dynamics that underlie channel and transporter functions is essential for elucidating the mechanism of transport, but it is challenging because it requires trapping multiple states, whose structural differences can be subtle, and because most high-resolution techniques do not directly measure molecular motion. Moreover, the channel-transporter distinction can be blurry, as exemplified by the influenza A virus matrix protein 2 (AM2). AM2 forms a tetrameric acid-activated proton channel that mediates virus uncoating 4,5. The proton-selective residue is a histidine (H37) and the gating residue is a tryptophan (W41), together defining a transmembrane (TM) HxxxW motif. AM2’s proton current saturates near pH 3.5 6,7 and shows strong inward rectification, i.e., the outward current is vanishing compared to inward current 8,9. The rate of proton conduction is also low, 100–1000 per second 10, suggesting that protein conformational motion limits the proton flux. Locally, the H37 imidazole and W41 indole rings reorient on the microsecond timescale at acidic pH 11–13, concomitant with H37-water proton exchange 14. Globally, AM2 converts between two conformations 15: an N-terminus-dilated and C-terminus-constricted (Nopen-Cclosed) conformation dominant at high pH 16–19, and an N-terminus-constricted and C-terminus-dilated (Nclosed-Copen) conformation dominant at low pH 20–22. H37 is thus alternately accessible to the two sides of the membrane. This transporter-like motion of AM2 occurs on the millisecond timescale 23, matching the proton conduction rate, indicating that AM2 behaves like an ion transporter, shuttling protons down the concentration gradient using fast sidechain motions and slow, rate-limiting, backbone motions.
Figure 1.
2D correlation solid-state NMR spectra indicate an α-helical TM domain for membrane-bound BM2. (a) Schematic of the key differences between ion channels and transporters. Open channels have a pore that is accessible to both sides of the lipid bilayer, whereas transporters are alternatingly accessible to one and the other side of the membrane. (b) 2D 13C-13C correlation spectrum of POPE-membrane bound BM2 at pH 4.5, measured at Tsample = 280 K. (c) 2D 15N-13Cα correlation spectrum of POPE-bound BM2 at pH 4.5 (orange) and pH 7.5 (grey), measured at Tsample = 290 K. (d) Residue-specific chemical shift differences between low and high pH. Most TM residues show negligible chemical shift changes, except for H19 and H27, which change their protonation states due to the pH change.
Are both local sidechain motion and global conformational motion required for proton transport? And is the function of the global conformational motion purely to limit the conduction rate? To answer these questions, we solved the structures of the closed and open influenza B virus M2 (BM2) channels using solid-state NMR. BM2 exhibits important functional differences from AM2: it shows no saturating current even at pH 3 7, conducts protons weakly outward in addition to inward 24, and has 2-fold higher specific activity than AM2 between pH 5.5 and 6.0 7,25. The amino acid sequence of BM2 also does not resemble that of AM2 except for the HxxxW motif, where the proton-selective residue is H19 and the gating residue is W23. BM2 has polar pore-facing residues 26 whereas AM2 has a hydrophobic pore (Extended Data Fig. 1a). This feature may explain BM2’s resistance to the antiviral drug amantadine, which inhibits AM2 27. A closed structure of BM2 in detergent micelles has been reported 25, but no information about the open structure is known, nor is there any structure in lipid bilayers.
Results
BM2 adopts a similar backbone conformation in the open and closed states
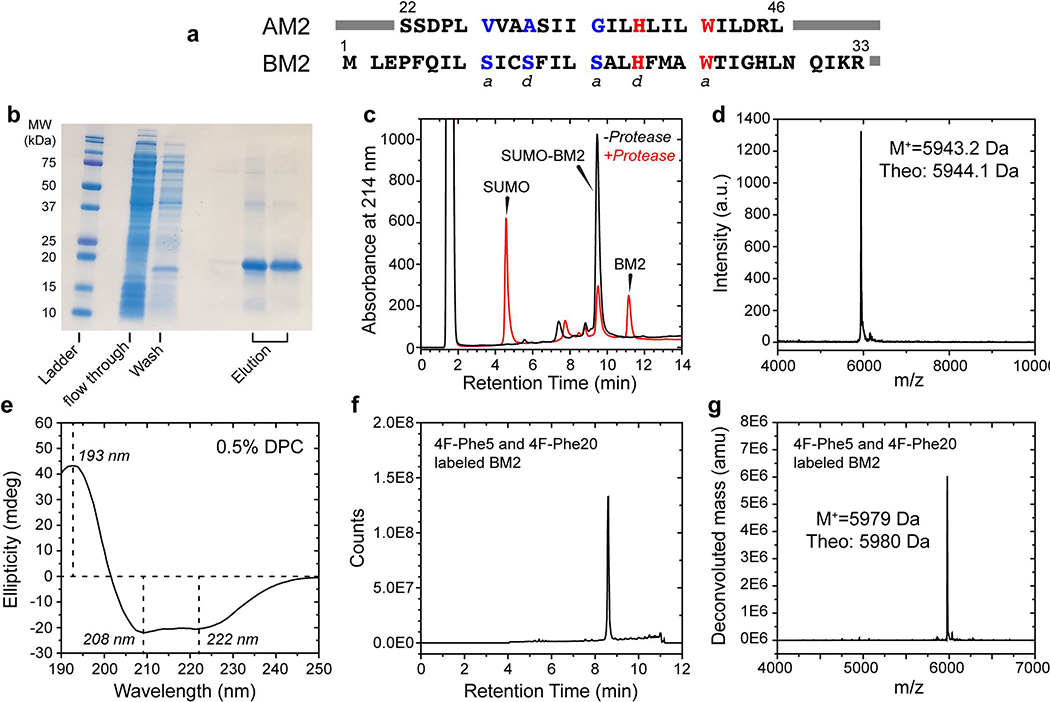
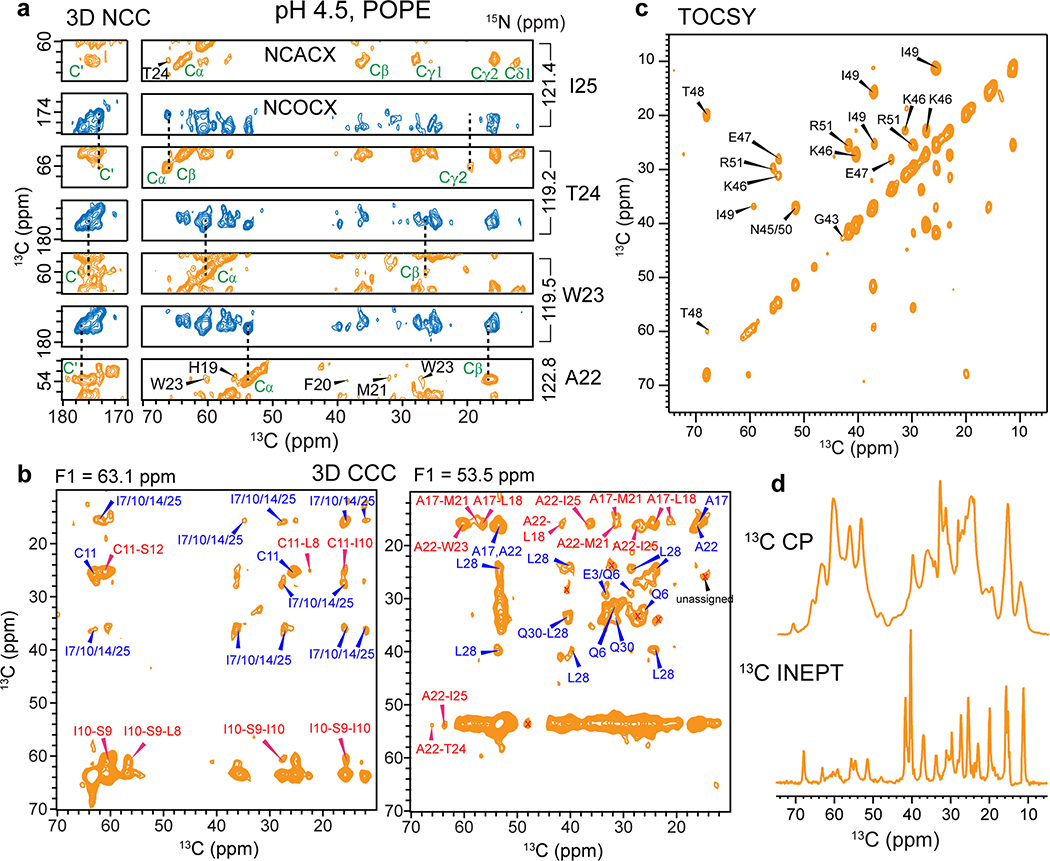
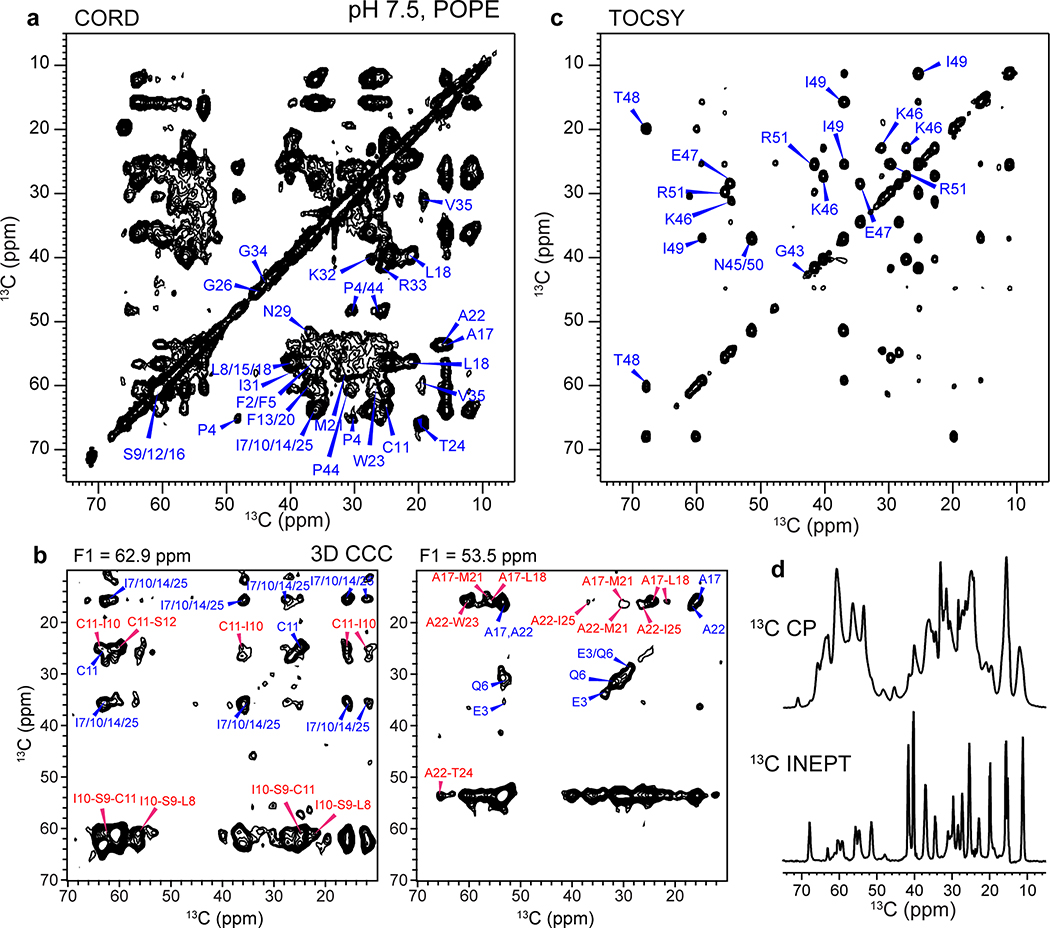
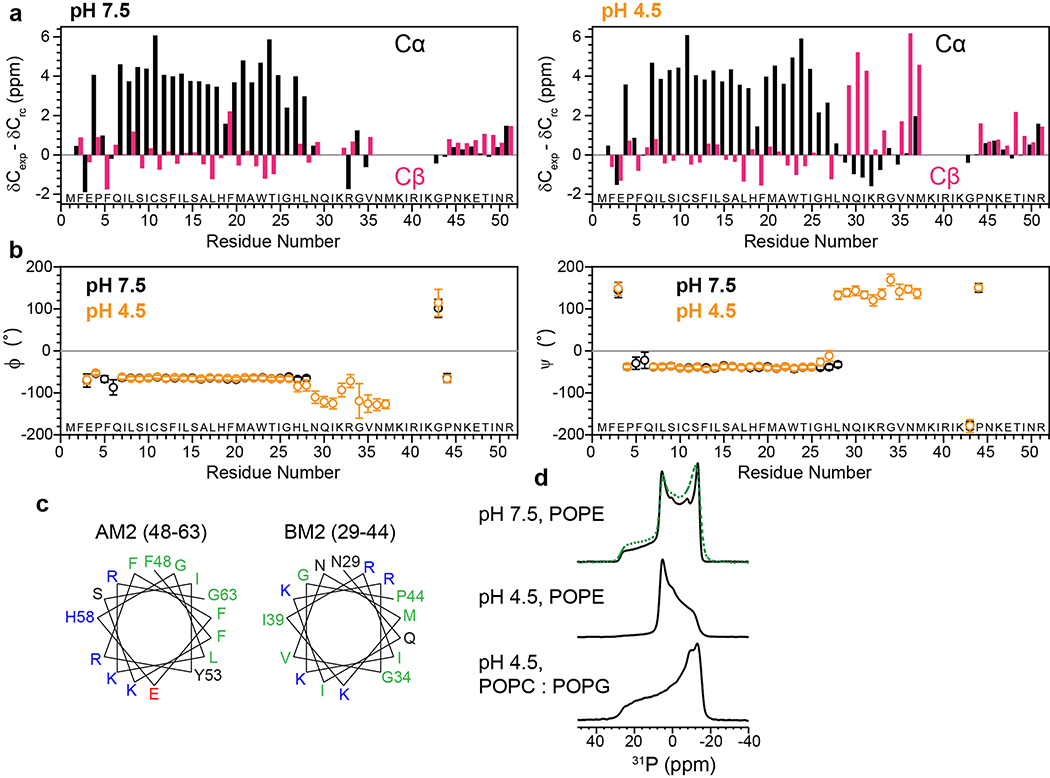
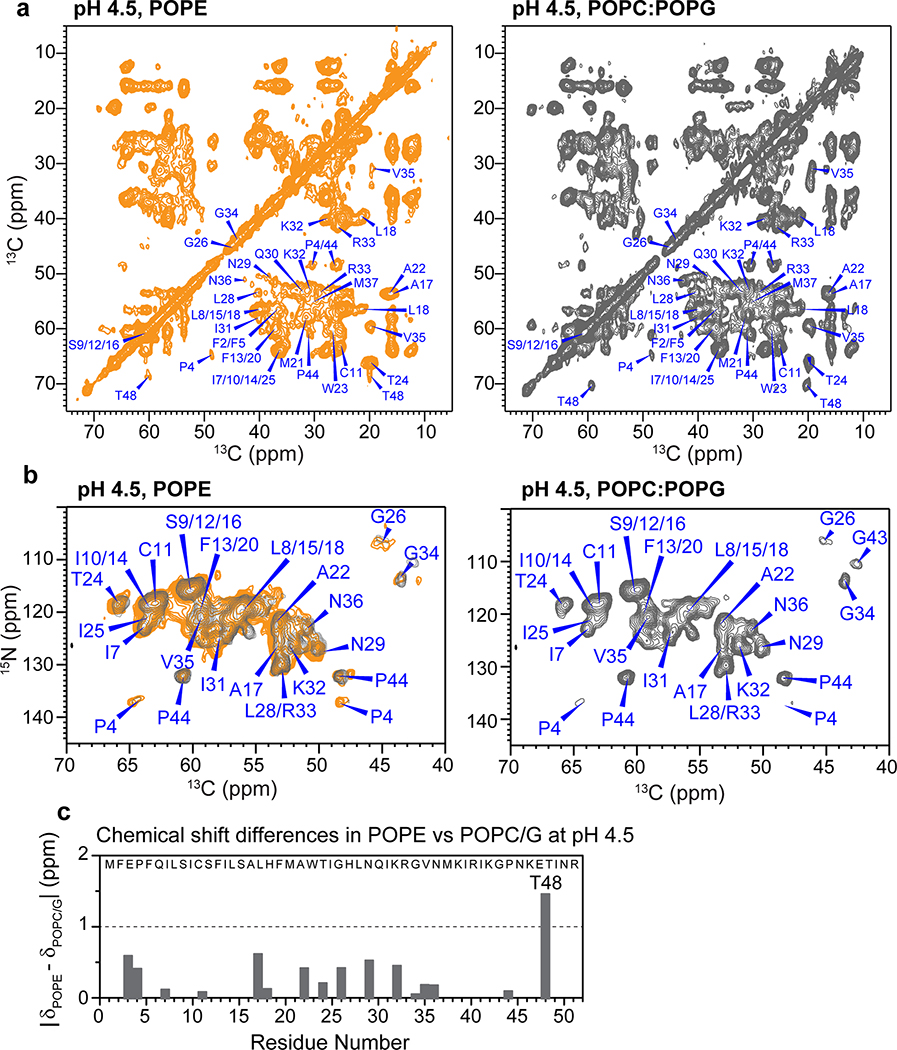
We expressed BM2(1–51) in E. coli (Extended Data Fig. 1b–e) and reconstituted it into 1-palmitoyl-2-oleoyl-sn-glycero-3-phosphoethanolamine (POPE) membranes at pH 7.5 and 4.5, to mimic the pH changes before and after virus endocytosis. This BM2 construct contains the full TM domain required for proton conduction and the part of the cytoplasmic domain necessary for targeting BM2 to the plasma membrane of the host cell 28. Extensive 2D and 3D 13C-13C and 15N-13C correlation spectra were measured to assign the 13C and 15N chemical shifts of all TM residues and most cytoplasmic residues at both pH (Fig. 1b–c, Extended Data Figs. 2 and 3), following previous assignment of a similar construct 29. We utilized sequential and medium-range cross peaks (i to i+1 or i+2) in the 3D NCCX and 3D CCC spectra to facilitate assignment of overlapping peaks. A single set of chemical shifts is observed at each pH (Supplementary Table 1). The 13C and 15N linewidths were 0.9–1.2 ppm and 2.8–3.5 ppm, respectively, indicating relatively high conformational homogeneity of the protein. The chemical shifts of the TM residues are very similar between high and low pH, except for the titratable proton-selective H19 and the peripheral H27, which show significant chemical shift differences due to the expected change of histidine protonation states with pH (Fig. 1d). Secondary-structure dependence of the chemical shifts indicates that residues 6–28 constitute the TM α-helical core (Extended Data Fig. 4a, b). In comparison, residues 29–37 show β-strand chemical shifts at low pH and weak intensities at high pH, indicating that this segment undergoes intermediate-timescale motion at high pH. 13C INEPT and 2D TOCSY (Extended Data Figs. 2 and 3) spectra indicate the presence of highly dynamic residues at both pH, which can be assigned to the cytoplasmic domain residues 43–51.
The cytoplasmic β-strand of BM2 at low pH corresponds to the amphipathic helix in AM2 (Extended Data Fig. 4c). The latter is known to generate membrane curvature to mediate membrane scission during influenza A virus budding and release 30–32. Interestingly, BM2 similarly caused membrane curvature, as shown by static 31P spectra (Extended Data Fig. 4d). At high pH, 35% of the POPE membrane converted to the non-bilayer hexagonal phase while the majority remained lamellar. At low pH, BM2 converted most of the POPE membrane to the hexagonal phase, but retained the lamellar morphology of the POPC : POPG membrane. Despite the POPE membrane curvature, 2D 13C-13C and 15N-13C correlation spectra (Extended Data Fig. 5) show very similar chemical shifts for the TM residues in the POPE and POPC : POPG membranes, indicating that the TM helix conformation is unaffected by the membrane curvature. This observation is consistent with the invariance of BM2 chemical shifts between DLPE and POPC : POPG membranes at high pH 29. Because the cytoplasmic domain forms a β-strand at low pH but is disordered at high pH, the membrane curvature is correlated with the β-strand conformation. Below we focus on the TM four-helix bundle structure that is relevant for the proton channel function.
The TM helices are more tilted and more separated from each other in the open state
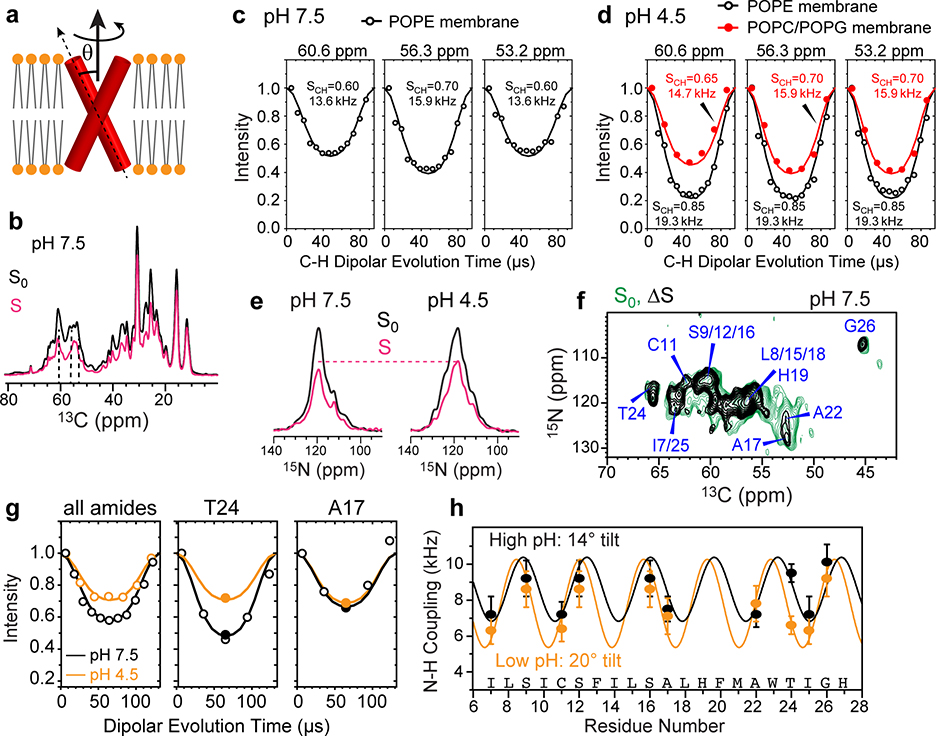
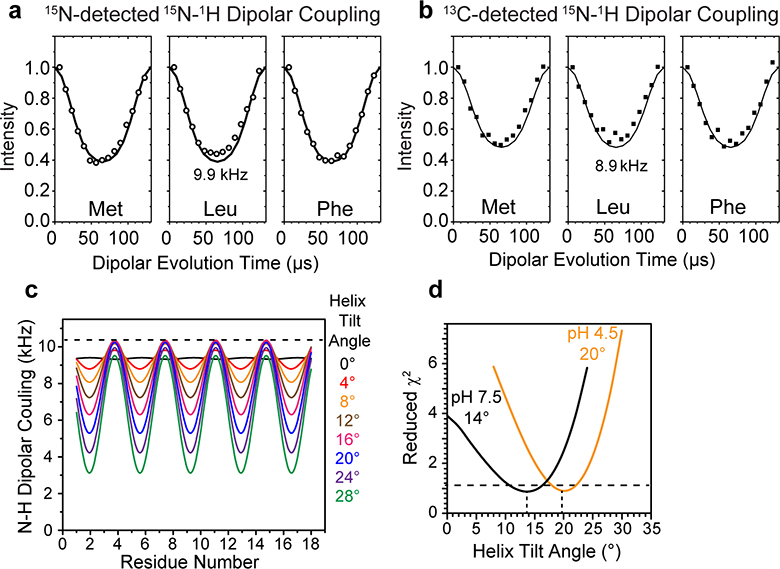
The persistence of a single set of TM chemical shifts from high to low pH indicates that the BM2 TM helix adopts similar (ϕ, ψ) torsion angles between the closed and open states (Extended Data Fig. 4b). This behavior differs qualitatively from AM2, which exhibits different chemical shifts between the closed and open states 17,23. Although the BM2 secondary structure is unaffected by pH, we hypothesized that the protein may adopt different helix tilt angles and inter-helical packing in the closed and open states. To test the first hypothesis, we measured rotationally averaged backbone amide N-H dipolar couplings (Fig. 2, Extended Data Fig. 6). When the four-helix bundle undergoes fast uniaxial rotation around the bilayer normal, the N-H dipolar couplings are scaled by a factor that depends on the N-H bond orientation from the bilayer normal, which in turn report the helix axis orientation in the membrane (Fig. 2a) 33,34. To ensure the presence of rotational diffusion, we measured the protein orientation at ~313 K, in the liquid-crystalline phase of the membranes. At high pH the POPE-bound BM2 exhibits the requisite motion, as verified by motionally averaged C-H dipolar couplings of backbone Cα sites (Fig. 2b, c). However, at low pH the whole-body uniaxial rotation is slowed down in the POPE membrane, which is likely due to the hexagonal-phase formation. Therefore, we measured the low-pH BM2 orientation in the POPC : POPG membrane, which retains the lamellar structure as well as the TM helix conformation (Fig. 2d, Extended Data Fig. 4d).
Figure 2.
Determination of the helix orientation of BM2 in the closed (high pH) and open (low pH) states. (a) Schematic of orientation measurement using rotationally averaged N-H dipolar couplings. (b) Representative 13C cross sections of the 2D 13C-1H DIPSHIFT spectra of POPE-bound BM2 at high pH. The S0 and S spectra were extracted from cross sections with dipolar evolution times of 0 μs and 41 μs. The spectra were measured at Tsample = 315 K under 10.5 kHz MAS. (c) 13C-1H DIPSHIFT curves of the POPE-bound BM2 at pH 7.5. Order parameters of 0.6–0.7 are observed for Cα sites, consistent with whole-body motion. (d) 13C-1H DIPSHIFT curves of BM2 at pH 4.5. The POPE-bound protein shows high order parameters, indicating immobilization, whereas the POPC : POPG-bound protein shows low order parameters of 0.65–0.70, consistent with whole-body motion. (e) Full (S0) and dipolar-dephased (S) 15N spectra of membrane-bound BM2. The protein shows higher S/S0 ratios at low pH than at high pH, indicating weaker N-H dipolar couplings. The spectra were measured under 7.6 kHz MAS at Tsample = 315 K at high pH and 313 K at low pH. (f) Control (S0) and difference (ΔS) 2D 15N-13C spectrum of membrane-bound BM2 at pH 7.5. The difference spectrum was obtained by subtracting a 57-μs N-H dephased spectrum from the control spectrum. Higher difference intensities indicate larger N-H dipolar couplings. (g) N-H DIPSHIFT curves for all amide groups obtained from 1D 15N spectra and for two residues resolved in the 2D 15N-13C spectra. The dipolar dephasing is weaker at low pH than at high pH. (h) Residue-specific N-H dipolar couplings at high pH (black) and low pH (orange). The couplings are best fit to dipolar waves for helix tilt angles of 14° and 20°, respectively.
We measured the N-H dipolar couplings using both 15N and 13C detection. The dipolar-dephased 15N spectra retain higher intensities for the low-pH protein than the high-pH protein (Fig. 2e), indicating that the motionally averaged N-H dipolar couplings are weaker at low pH. This observation is confirmed by site-resolved measurement of individual residues’ N-H dipolar dephasing using 2D 15N-13C correlation spectra. Two spectra were measured, with N-H dipolar evolution times of 0 and 57 μs, respectively. In the difference 2D spectrum (Fig. 2f), higher cross peak intensities indicate stronger dipolar dephasing and hence larger couplings. For example, T24 and G26 display stronger N-H dipolar couplings whereas C11, A17 and A22 show weaker couplings. The three serine residues, S9, S12 and S16, have overlapping 15N and 13Cα chemical shifts but occupy the same pore-facing position along the helix, thus they are approximated as having the same N-H dipolar couplings. The residue-specific N-H dipolar couplings show the periodic oscillations expected for α-helices (Fig. 2g, h, Supplementary Table 2). Best fit of these dipolar waves yielded a tilt angle of 14±2˚ for the closed state and 20±2˚ for the open state (Extended Data Fig. 6c, d). Therefore, activation of the BM2 channel at acidic pH indeed increases the TM helix tilt angle.
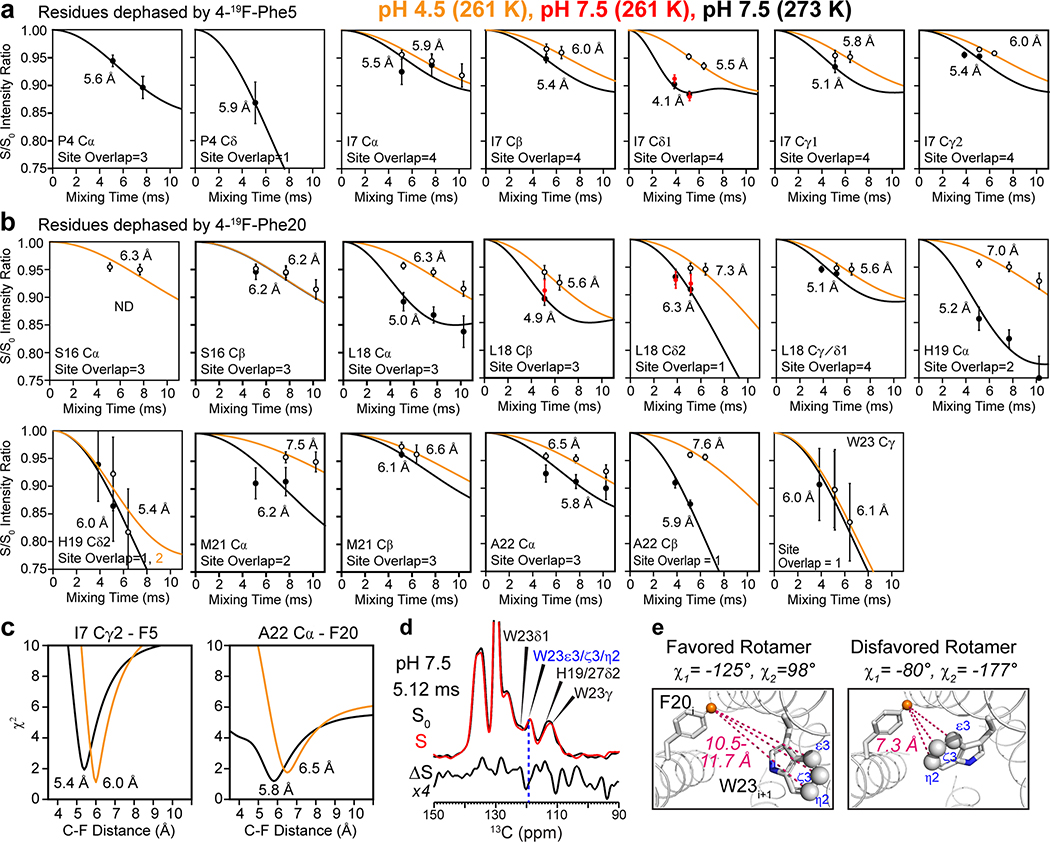
To test the second hypothesis that BM2’s inter-helical packing may be loosened at low pH, we measured inter-helical distances using a 1 : 1 mixture of fluorinated and 13C-labeled protein. Para-fluorinated F5 and F20 are introduced synthetically on one subunit (Extended Data Fig. 1f–g) to cause dipolar dephasing to 13C-labeled residues on the adjacent subunit (Fig. 3a). Mixing of fluorinated protein with 13C-labeled protein does not affect the protein conformation, as verified by identical 13C chemical shifts (data not shown). Two 13C spectra were measured without (S0) and with (S) 19F pulses using the rotational-echo double-resonance (REDOR) experiment 35,36. To ensure that the distance-dependent dipolar couplings are not averaged by motion, we measured the REDOR spectra in the gel-phase membrane where the protein is immobilized. The high-pH POPE-bound protein was measured at 273 K and 261 K with identical results (Extended Data Fig. 7), indicating that the protein was immobilized at these temperatures. For the low-pH protein, we conducted the REDOR experiments at 261 K in the POPC : POPG membrane, to ensure that the distance restraints are obtained in the same membrane as the orientation measurements. 13C sites that show intensity reduction due to the 19F pulses are in close proximity to the fluorinated F5 or F20. We detected significant intensity differences for many sites such as P4 Cδ, L18 Cδ2, A22 Cβ and W23 Cγ (Fig. 3b). The normalized intensities (S/S0) as a function of REDOR mixing times are higher for the low-pH sample than the high-pH sample, indicating longer interhelical distances for the open channel (Fig. 3c, Extended Data Fig. 7). Best-fit simulations indicate that the distances between the two neighboring helices increase by an average of 0.75 Å at low pH for all quantifiable 13C-19F pairs (Supplementary Table 3). Therefore, the tetramer is indeed loosened in the open state compared to the closed state.
Figure 3.
Determination of interhelical distances of membrane-bound BM2 using 13C-19F REDOR. (a) Schematic of mixed fluorinated and 13C-labeled protein for measuring interhelical distances. (b) Representative 1D 13C-19F REDOR control (S0) and dephased (S) spectra, whose difference (ΔS) shows the signals of 13C spins that are in close proximity to the fluorinated Phe5 and Phe20. The 13C-19F REDOR spectra were measured in gel-phase membranes at a Tsample of 273 K for the POPE-bound BM2 at high pH and 261 K for the POPC : POPG-bound protein at low pH. (c) Representative 13C-19F REDOR dephasing curves. Weaker dephasing is observed for the low-pH protein, indicating longer interhelical distances. The site overlap factor for each site is indicated.
Atomic structures of open and closed BM2 reveal the activation mechanism
Combining these measured backbone torsion angles, helix orientational constraints, interhelical distances, and intrahelical correlations from 3D CCC spectra 37 (Extended Data Fig. 2b, 3b), we calculated the closed and open BM2 structures (Table 1). The structure calculation involved two stages: in the first stage, all measured (ϕ, ψ) torsion angles, 13C-19F and 13C-13C distances, and N-H bond orientations were inputted into the XPLOR-NIH program 38 together with standard potential energy terms and covalent geometry parameters (Supplementary Table 4). The resulting lowest energy structure was then inputted into the second stage for structure refinement, which used modified potential energy terms and additional back-calculated N-H dipolar couplings for the unresolved TM residues. Since the high-temperature uniaxial rotation of the four-helix bundle is rigid-body in nature, this motion does not affect the static structure, and the orientational constraints can be combined with the low-temperature distance constraints for structure determination. Comparison of the TM residues’ chemical shifts at high and low temperatures confirms that the TM conformation is unchanged between the gel and liquid-crystalline phases (Fig. 1c, Fig. 2f).
Table 1.
NMR and refinement statistics for protein structures
| pH 7.5 | pH 4.5 | |
|---|---|---|
| NMR distance and dihedral constraints | ||
| Distance constraints | ||
| Total NOE | 229 × 4 | 218 × 4 |
| Intraresidue | 0 × 4 | 0 × 4 |
| Inter-residue | 229 × 4 | 218 × 4 |
| Sequential (|i − j| = 1) | 98 × 4 | 90 × 4 |
| Medium range (2 ≤ |i − j| ≤ 4) | 68 × 4 | 63 × 4 |
| Long range (|i − j| ≥ 5) | 0 × 4 | 1 × 4 |
| Intermolecular | 25 × 4 | 26 × 4 |
| Hydrogen bonds | 38 × 4 | 38 × 4 |
| Total dihedral-angle restraints | ||
| ϕ | 26 × 4 | 29 × 4 |
| ψ | 26 × 4 | 29 × 4 |
| Total orientation constraints | 10 × 4 | 10 × 4 |
| 1H-15N dipolar couplings | 10 × 4 | 10 × 4 |
| Violations (mean ± s.d.) | ||
| Distance constraints (Å) | 0.06 ± 0.01 | 0.09 ± 0.01 |
| Dihedral-angle constraints (°) | 0.18 ± 0.22 | 0.32 ± 0.24 |
| Max. dihedral-angle violation (°) | 5.16 | 6.28 |
| Max. distance-constraint violation (Å) | 0.61 | 0.56 |
| Deviations from idealized geometry | ||
| Bond lengths (Å) | 0.002 ± 0.000 | 0.002 ± 0.000 |
| Bond angles (°) | 0.40 ± 0.03 | 0.39 ± 0.01 |
| Impropers (°) | 0.34 ± 0.03 | 0.35 ± 0.02 |
| Average pairwise r.m.s. deviation (Å)a | ||
| Heavy | 1.43 ± 0.25 | 1.46 ± 0.34 |
| Backbone | 0.71 ± 0.17 | 0.85 ± 0.30 |
Pairwise r.m.s.d. was calculated among 10 lowest-energy refined structures.
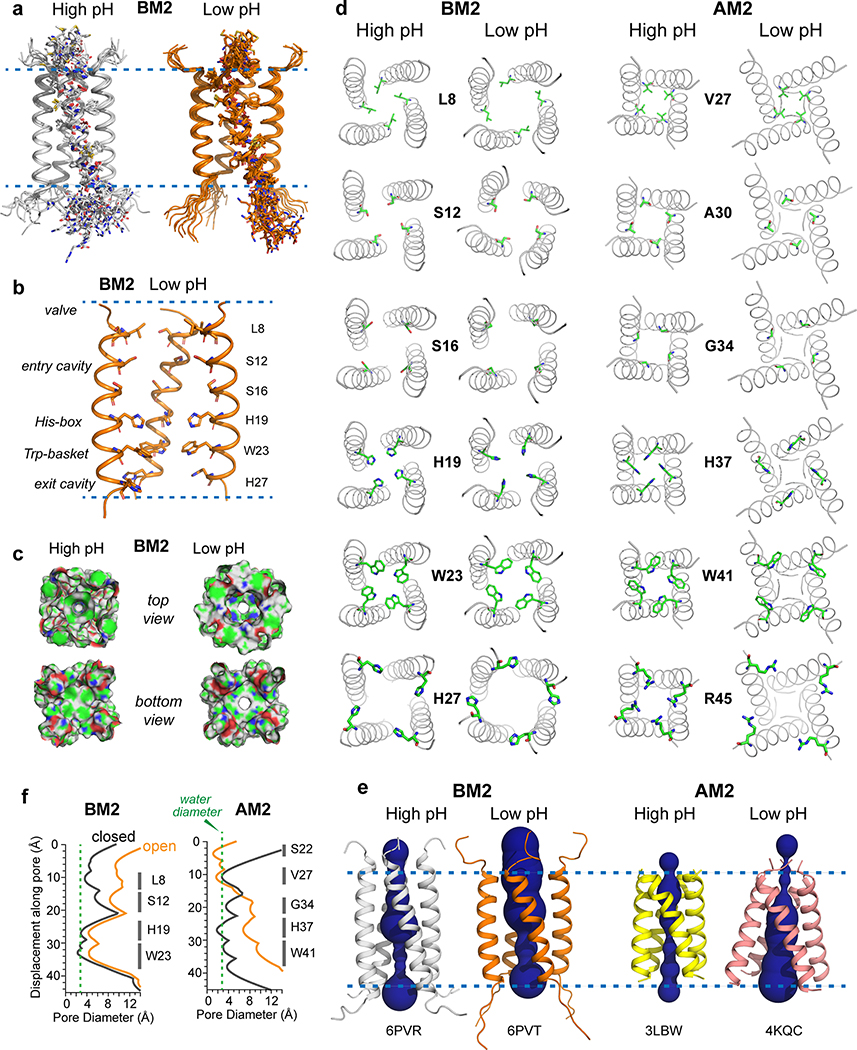
The BM2 structures were solved to 1.4 Å and 1.5 Å resolution and show a left-handed α-helical bundle with a crossing angle of 18° and 25˚ for the closed and open states, respectively (Fig. 4a). The closed and open structures differ in tetramer assembly (Fig. 4c) rather than subunit conformation: when the high-pH subunit is aligned with the low-pH subunit, the heavy-atom root-mean-square deviation (RMSD) is only 1.6 Å, which is much smaller than the 3.0 Å RMSD between the Nopen-Cclosed and Nclosed-Copen AM2 conformations 22. The tetrameric pore is lined by six layers of sidechains (Fig. 4b, d). The topmost layer is a L8 valve, which swings significantly outward upon activation due to the helix orientational change. Below this valve is an entry cavity formed by the hydrophilic S12 and S16, whose diameter expands by 2.8 Å upon activation, allowing occupation by hydrogen-bonded water molecules. This cavity is followed by the H19 tetrad, which expands in diameter by 1.4 Å at low pH, thus allowing imidazolium motion (vide infra). One helical turn below H19 is the W23 basket, which occludes the pore at high pH but rotates slightly outward at low pH, allowing proton passage. A final exit cavity is provided by the C-terminal H27, which is known to speed up proton dissociation from H19 39.
Figure 4.
Atomic structures of closed and open BM2 channels in lipid membranes. (a) Ensembles of ten lowest-energy structures, showing the backbones of all four helices and sidechains of one of the four helices. (b) Lowest-energy structure of the open channel, showing key sidechains along the pore. One of the four helices is omitted for clarity. (c) Solvent-excluded surface representations of closed (high pH) and open (low pH) BM2 and AM2 channels, viewed from the N-terminus (top view) and C-terminus (bottom view). Atoms coloring is green for carbons, white for hydrogens, red for oxygens, and blue for nitrogens. (d) C-terminal views of the channel pores and sidechain structures of six key residues in the closed and open BM2 and AM2. The open BM2 channel shows a larger N-terminal pore and tighter Trp gate compared to the open AM2. (e) Side view of the closed and open BM2 and AM2 channels, showing HOLE-calculated water-permeated pores. The average pore diameter for BM2 is 6.6 Å at high pH and 8.7 Å at low pH. (f) Pore diameters of BM2 and AM2 calculated using the HOLE program. The diameter of water molecules is shown as a green dashed line. Activation of BM2 enlarges the pore diameter along the entire channel axis, corresponding to a scissor motion, whereas activation of AM2 constricts the N-terminus while splaying the C-terminus, corresponding to a hinge motion.
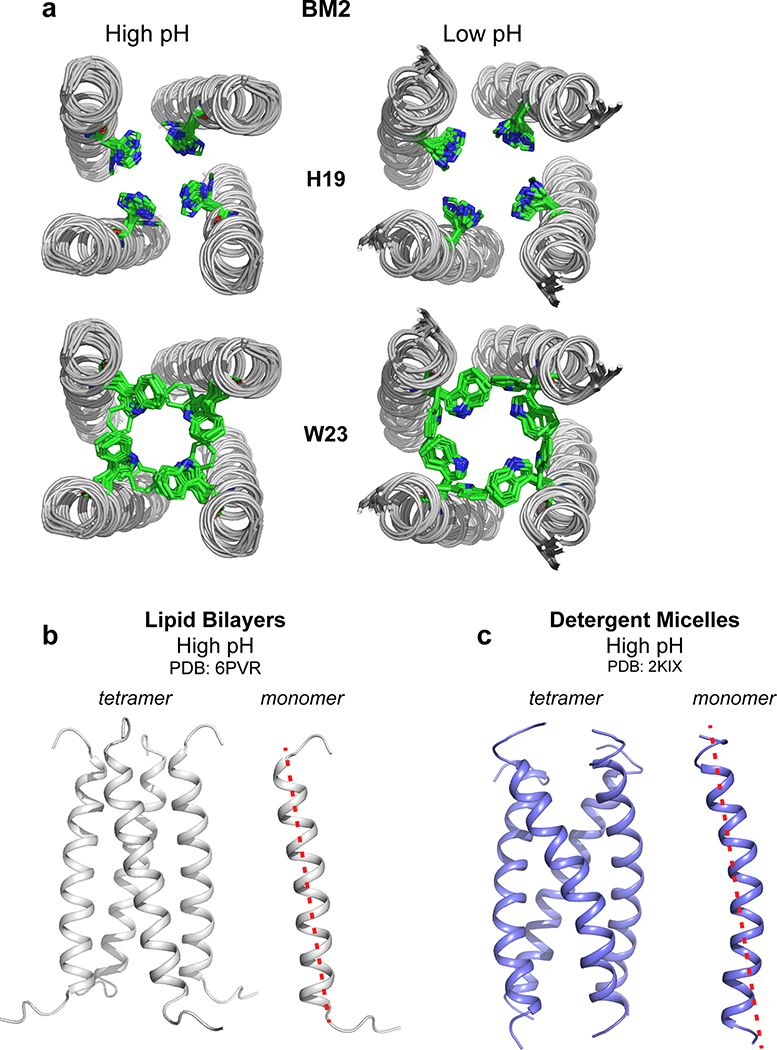
The closed and open BM2 channels differ significantly from the closed and open AM2 channels. Upon activation, BM2 expands its pore along the entire channel, while AM2 constricts its N-terminus but expands its C-terminus (Fig. 4e, f). This difference is the clearest at the N-terminal valve, which is wide open at L8 in BM2 but contracted at V27 in AM2 22. Thus, BM2 lacks the Nclosed conformation of AM2 at low pH. In the HxxxW motif (Extended Data Fig. 8a), BM2’s H19 χ1 is trans but the χ2 is not well constrained at both pH, while H37 in AM2 adopts the tt rotamer. The lowest-energy BM2 and AM2 open channels both show the imidazolium ring to be oriented parallel to the channel axis. This orientation primes the histidine for proton shuttling, since one imidazolium nitrogen points to the proton-rich N-terminal endosome while the other nitrogen points to the proton-poor C-terminal virion (Fig. 4d). W23 in BM2 adopts the t90 rotamer in both closed and open states (Extended Data Fig. 7d, e), the same as the W41 rotamer in AM2 13,20. However, because of the backbone orientation difference between BM2 and AM2, the W23 pore diameter increases only modestly from high to low pH, whereas the AM2 W41 gate swings wide open at low pH, again supporting the alternating-access motion of AM2.
The channel is more accessible to water and shows increased sidechain dynamics at low pH
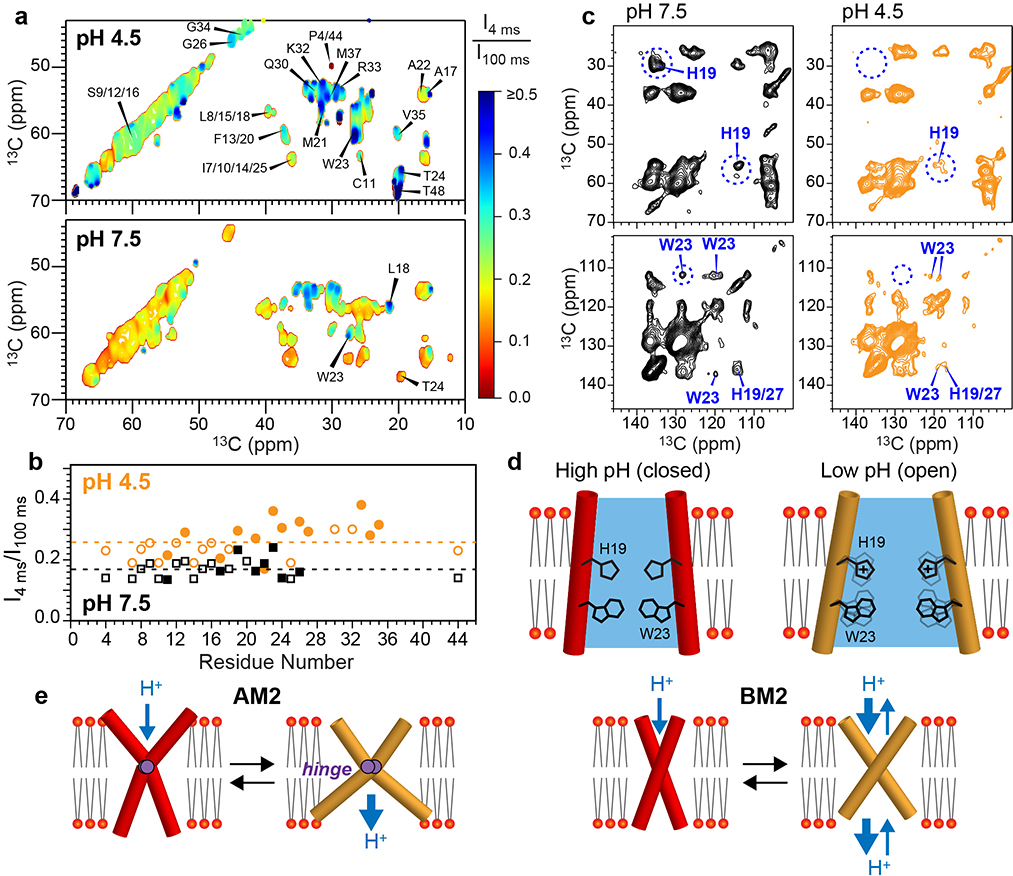
If the low-pH BM2 pore is indeed expanded, then we would expect larger water accessibilities and increased sidechain motions. To test these hypotheses, we measured water-edited 2D 13C-13C correlation spectra (Fig. 5a), where the protein intensities are transferred from water 1H magnetization through chemical exchange and spin diffusion 23,40. We normalized the water-transferred intensities at a short mixing time of 4 ms by the equilibrated intensities at 100 ms to compare the water accessibilities of the closed and open channels. The low-pH 2D spectrum displays much higher water-transferred intensities than the high-pH spectrum (Fig. 5a, Extended Data Fig. 9), especially for the C-terminal W23 and T24, the H19 and H27 sidechains, and the S9, S12, S16 triplet. Since chemical exchange is slower at acidic pH than at neutral pH, the faster water magnetization transfer is unambiguous evidence that the open state has a larger water-filled pore 39,41. The water-transferred intensities of the low-pH protein increase from the N-terminus to the C-terminus (Fig. 5b), indicating preferential hydration of the C-terminal end of the channel. Therefore, the activated BM2 channel is indeed more accessible to water (Fig. 5d). At a sample temperature of 280 K, the H19 and W23 sidechains show weaker signals at low pH than at high pH in the 2D 13C-13C correlation spectra (Fig. 5c), indicating that these sidechains are more dynamic in the open state. The H19 Cδ2 chemical shift increases by 3.7 ppm while the Nε1 and Nδ2 chemical shift increases by 8.9 ppm from high pH to low pH (Extended Data Fig. 9d), consistent with increased protonation of the H19 tetrad from a low-charge state of 0 and +1 to a high-charge state of +3 and +4 when the pH decreases from 7.5 to 4.5 39.
Figure 5.
Water accessibilities and sidechain motions of BM2 in the high-pH (closed) and low-pH (open) states. (a) Normalized water-edited 2D 13C-13C correlation spectra of BM2 at low and high pH, measured at Tsample = 273 K. The low-pH channel shows higher water-transferred intensities (blue contours) than the high-pH channel (red contours). (b) Intensity ratios of water-edited and full spectra. The low-pH channel shows higher intensities than the high-pH channel, and the C-terminus is more hydrated than the N-terminus. The intensities of resolved and overlapped signals are shown as closed and open symbols, respectively. Dashed lines indicate the average S/S0 values for the two pH conditions. (c) 2D 13C-13C correlation spectra of membrane-bound BM2 at Tsample = 280 K. H19 and W23 peaks are much weaker at low pH than at high pH, indicating that these residues are mobile in the open state. (d) Schematic of the larger water accessibility and increased HxxxW sidechain motions of BM2 at low pH. (e) Schematic models of AM2 and BM2’s backbone motion. AM2 undergoes an alternating-access hinge motion to conduct protons only inward, whereas BM2 undergoes a symmetric scissor motion to conduct protons both inward and outward.
Discussion
These data indicate that the open BM2 channel exhibits microsecond-timescale His and Trp sidechain motions, similar to AM2 11,13, but lacks the alternating-access hinge motion. Instead, BM2 opens by increasing the helix tilt angle and interhelical separation. This scissor motion, although modest in scope, is sufficient to enlarge the pore and permit motions of the critical H19 and W23 sidechains. Thus, the sidechain motions are necessary for proton shuttling, whereas the backbone hinge motion is not. What is then the functional significance of the backbone hinge motion in AM2? The proton-conduction differences between BM2 and AM2 suggest that the transporter-like alternating-access motion of AM2 ensures unidirectional proton conductance, but at the cost of reduced proton flux, whereas the symmetric scissor motion of BM2 allows bidirectional current, as dictated by the proton concentration difference across the membrane (Fig. 5e). Our data thus indicate that BM2 is more channel-like than AM2: once low pH causes the TM helices to become more tilted and increase the helix-helix separation within each tetramer, then H19 shuttles protons into the virion by sidechain motion.
Which amino acid sequence features cause the alternating-access motion and the asymmetric conductance of AM2 and their absence in BM2? Mutagenesis, functional and structural data suggest that three key amino acid residues account for this divergence. First, AM2 contains a glycine, G34, in the middle of the TM domain, which allows the N- and C-terminal halves of the TM helix to adopt distinct orientations, as shown by solid-state NMR data of drug-bound AM2 42. In BM2 this G34 is replaced by S16, which reinforces the helical backbone and prevents separate motion of the two halves of the TM helix (Fig. 5e). Second, BM2 has a symmetric HxxxWxxxH motif that is absent in AM2 (Extended Data Fig. 1a). The membrane-surface H27 has solution-like acid-dissociation constants 41, so that the H27 tetrad acquires an average charge of +2.1 at the mildly acidic pH of 6. Electrostatic repulsion within the H27 tetrad is attenuated because of the interfacial position of the H27 sidechains, but the cationic H27 speeds up proton dissociation from H19. The H27-facilitated proton dissociation is manifested in 15N NMR data that indicate low H19 pKa values in wild-type BM2 but higher pKa’s when H27 was mutated to Ala 39,43. Finally, H27 is preceded by G26, which does not interfere with the electrostatic properties of H27. In comparison, most AM2 sequences contain a D44-R45 pair at the corresponding positions, which are neutral at mildly acidic pH, thus inhibiting C-terminus opening 44. Moreover, it is known that D44 stabilizes the Trp gate: mutation of D44 to neutral residues increases the proton conductance 2–4 fold 6,8,45. When G26-H27 in BM2 are mutated to D26-R27, the outward current is abolished 7. Therefore, the electrostatic properties of the C-terminal residues in BM2. together with the absence of a central flexible Gly, likely explain the symmetric backbone scissor motion of BM2 for channel activation and the consequent bidirectional proton conductance. Future structural studies of BM2 mutants can further test the hypothesis that these key C-terminal residues control the proton conduction direction of the channel. Overall, the M2 sequence of influenza B virus appears to have evolved to encode a distinct backbone conformational motion that increases both the inward and outward conductance compared to influenza A virus. We speculate that this increased forward conductance, which accompanies the reverse conductance, may serve the function of triggering the fusion activity of influenza B hemagglutinin at pH lower than 5.5, which in turn increases the fitness of the influenza B virus in humans 46. Influenza B virus only infects humans, whereas influenza A virus infects both humans and animals. Hemagglutinin of the human-adapted influenza A subtypes is triggered at lower pH than hemagglutinin of the avian and swine subtypes 47, suggesting that triggering of hemagglutinin at lower pH is important for virus fitness in humans.
The solid-state NMR strategy used here to determine the open and closed BM2 channel structures integrates the measurement of backbone conformation, protein orientation, and intermolecular distances. These structures, solved to 1.4 Å and 1.5 Å in lipid bilayers, identify the subtle differences between the closed and open channels, without the potential distortion that may be caused by less ideal membrane-mimetic solvents such as detergent micelles. Indeed, the previous high-pH structure of BM2 solved in DHPC micelles shows a coiled-coil conformation 25, which differs significantly from the bilayer-bound BM2 structure at high pH (Extended Data Fig. 8b, c). The presence of distinct conformations in bilayers and micelles is supported by 15N chemical shift differences between the bilayer-based chemical shifts measured here and the micelle-based chemical shifts 29. In phospholipid bilayers, we are able to compare the closed and open BM2 structures to gain detailed insights into the type of protein motions required for directional proton conduction. These data show that fast local sidechain motion is the indispensable microscopic driver for proton shuttling, whereas the type of global backbone motion controls the directionality and overall rate of proton conduction.
Online Methods
Expression and purification of 13C, 15N-labeled BM2
Residues 1–51 of influenza B/Maryland/ 1/2001 (MFEPFQILSICSFILSALHFMAW-TIGHLNQIKR-GVNMKIRIKGPNKETINR) were expressed and purified for structure determination. This construct includes the TM domain for proton conduction and the cytoplasmic portion that is necessary for membrane targeting of the protein 28. We expressed BM2(1–51) using an N-terminal His6-SUMO tag, purified it with Ni2+ affinity chromatography (Extended Data Fig. 1), cleaved the SUMO tag, then used reversed-phase HPLC to purify native BM2(1–51). Circular dichroism (CD) spectrum of DPC-bound BM2 indicates ~60% α-helicity and ~40% turn or disordered structures. Most SSNMR experiments used uniformly 13C and 15N-labeled protein.
The plasmid encoding BM2(1–51) was obtained from Integrated DNA Technologies. The gene was cloned into a Champion pET-SUMO plasmid, which was then transfected into E. coli BL21 (DE3) cells to express SUMO-BM2. A glycerol cell swab was used to inoculate a 10 mL LB culture containing 100 μg/mL kanamycin. The starter culture was then used to inoculate 2 L of LB media containing 100 μg/mL kanamycin. Cells were grown at 37°C until an OD600 of 0.6–0.8 and harvested by centrifugation at 4,424x g for 10 minutes at 20°C. The cells were resuspended in 1 L of M9 media (pH 7.8, 48 mM Na2HPO4, 22 mM KH2PO4, 8.6 mM NaCl, 4 mM MgSO4, 0.2 mM CaCl2, 50 mg kanamycin) containing 1 g/L 15N-NH4Cl and 3 g/L U-13C glucose for 15N, 13C-labeling. The cells were incubated in M9 media for 45 minutes at 37°C, then protein expression was induced by addition of 0.4 mM isopropyl β-D-1-thiogalactopyranoside (IPTG). Protein expression proceeded overnight at 30°C, reaching an OD600 of ~1.1.
The cells were spun down at 4°C and 4,424x g for 15 min, resuspended in 60 mL lysis buffer (pH 8.0, 50 mM Tris-HCl, 100 mM NaCl, 0.5% Triton X-100, 1X Halt Protease inhibitors without EDTA, 10 mM imidazole). Cells were lysed at 4°C by sonication (5 seconds on and 5 seconds off) for 1 hour using a probe sonicator. The soluble fraction of the cell lysate was separated from the inclusion bodies by centrifugation at 10,000x g for an hour at 4°C. The supernatant was filtered through a 0.22 μm filter, the pH was adjusted to 8.8, then the solution was loaded onto a pre-equilibrated gravity-flow chromatography column with ~7 mL nickel affinity resin (Profinity IMAC, BioRad). The solution was bound to the resin for 10–20 minutes by gentle shaking at 4°C. 100 mL of wash buffer (pH 8.8, 50 mM Tris-HCl, 100 mM NaCl, 50 mM Imidazole) was used to wash the column till the absorbance at 280 nm was <0.15, then SUMO-BM2 was collected with ~20 mL elution buffer (pH 8.8, 50 mM Tris-HCl, 100 mM NaCl, 300 mM Imidazole).
The eluted protein (~20 mL) was dialyzed against 1 L of buffer (pH 8.8, 20 mM Tris-HCl, 100 mM NaCl, 1mM DTT) at room temperature using 3.5 kDa dialysis tubing (Spectrum Labs) for 2.5 hours. The SUMO tag was cleaved by addition of ~1:10 (w/w) SUMO protease with respect to SUMO-BM2 for ~2 hours at room temperature. The reaction was quenched by addition of 0.2% SDS and 1 mM DTT. The cleavage reaction was typically ~75% complete, as assessed by analytical reversed-phase HPLC (RP-HPLC). The protein was purified using preparative RP-HPLC on a Varian ProStar 210 System using an Agilent C3 column (5 μm particle size, 21.2 mm × 150 mm), and was eluted using a linear gradient of 30–70% acetonitrile : water containing 0.1% trifluoroacetic acid over 60 minutes at a flow rate of 12 mL/min. The purified protein was lyophilized and stored at −20°C. The protein yield was about 3 mg/L of M9 media.
Fast-flow synthesis of fluorinated BM2(1–51) peptides
4-19F-Phe5 and 4-19F-Phe20 labeled BM2(1–51) peptide was synthesized using a combination of batch synthesis and an automated fast-flow solid phase peptide synthesizer 48. The entire peptide was directly synthesized without chemical ligation, which was reported previously 49. Several milligrams of protein were obtained at high purity (Extended Data Fig. 1f, g) without lengthy protocol optimization, demonstrating the robustness of this method for synthesizing highly hydrophobic membrane proteins. Briefly, 150 mg H-Rink polyethyleneglycol resin at 0.44 mmol/g (Pcas Biomatrix) was loaded into the automated flow peptide synthesizer, and BM2 was synthesized until residue F20. In batch, 1 mmol Fmoc-4-19F-Phe-OH was dissolved in 2.5 mL of 0.4 M 2-(7-Aza-1H-benzotriazole-1-yl)-1,1,3,3-tetramethyluronium hexafluoro-phosphate (HATU, Chem-Impex International) in DMF and 0.5 mL diisopropylethylamine (DIEA) and was added to the deprotected peptidylresin. Resin was placed back onto the automated flow peptide synthesizer to resume synthesis until residue F5, where 4-19F-Phe-OH was coupled again as before, after which synthesis was completed on automated flow peptide synthesizer. Crude BM2 was subjected to global deprotection via resuspension in trifluoroacetic acid (TFA) : thioanisole : water : phenol : 1,2-ethanedithiol (82.5:5:5:5:2.5 v/v, 5mL) and incubation at room temperature for 2 hours. The peptide was precipitated from cleavage solution by trituration with ice cold diisopropyl ether, washed twice with ice cold diisopropyl ether, and lyophilized. Crude peptide was purified by preparative RP-HPLC (Agilent Zorbax SB C3 column: 9.4 × 250mm, 5 μm) with a gradient of 5–55% acetonitrile in water with 0.1% TFA, run over 100 minutes. Pure fractions were pooled and lyophilized and the final purity was confirmed by LC-MS.
Membrane sample preparation
Five membrane samples at different pH and in different lipid membranes were used in this study. Three membrane samples contain U-13C, 15N-labeled protein while two samples contain a 1 : 1 mixture of 13C, 15N-labeled protein and fluorinated peptide. The first sample was BM2(1–51) bound to 1-palmitoyl-2-oleoyl-sn-glycero-3-phosphoethanolamine (POPE) bilayers at pH 7.5. The second sample is POPE-bound BM2 at pH 4.5. The third sample is BM2 bound to 4 : 1 (w/w) 1-palmitoyl-2-oleoyl-glycero-3-phosphocholine (POPC) : 1-palmitoyl-2-oleoyl-sn-glycero-3-phospho-(1’-rac-glycerol) (POPG) bilayers at pH 4.5. For these three samples, the peptide : lipid (P : L) molar ratio was 1 : 16, the peptide mass was 8–9 mg each, obtained from 3 L expression, and the samples were packed in 3.2 mm thick-wall MAS rotors. The fourth and fifth samples have a 1 : 1 mixture of 4-19F-F5, 4-19F-F20-labeled peptide and U-13C, 15N-labeled protein at pH 7.5 in POPE and at pH 4.5 in 4 : 1 POPC : POPG bilayers. These mixed-labeled samples had a P : L molar ratio of 1 : 13, a total peptide mass of ~3 mg, and were packed into 1.9 mm MAS rotors.
To reconstitute BM2 into lipid bilayers, we dissolved 3–5 mg protein in 1 mL trifluoroethanol (TFE) with 5 mM tris(2-carboxyethyl)phosphine (TCEP), and mixed with appropriate amounts of lipids in 300 μL chloroform. The solvents were removed under a stream of nitrogen gas, and the film was dried under vacuum at room temperature overnight. The proteoliposome film was resuspended in 4 mL of pH 7.5 buffer (20 mM Tris-HCl, 2 mM ethylenediaminetetraacetic acid (EDTA), 0.2 mM NaN3, and 2 mM TCEP) or pH 4.5 buffer (20 mM sodium citrate, 2 mM EDTA, 0.2 mM NaN3, and 2 mM TCEP) by vortexing and sonicating 2–3 times for 2 min each until a homogeneous suspension was obtained. The sample was then freeze-thawed 7 times between a 40°C water bath and liquid nitrogen. The proteoliposomes were ultracentrifuged for 2–3 hours at 164,000x g in a SW60 Ti rotor (Beckman Coulter) and 4°C to obtain homogeneous membrane pellets. The pellet was allowed to dry in a desiccator to a final hydration level of ~40% by mass, then packed into MAS rotors using a benchtop centrifuge for solid-state NMR experiments.
Circular dichroism experiments
CD spectra were measured at room temperature on an AVIV 202 spectrophotometer using a 1 mm path-length quartz cuvette. Three scans were co-added for each spectrum. The protein was dissolved in an n-dodecylphosphocholine (DPC) buffer (pH 7.5, 10 mM NaHPO4, 0.5% w/w DPC) at a protein concentration of 0.15 mg/mL (15 μM). The protein-free buffer spectrum was subtracted from the protein-containing spectrum. The CD spectral intensities are reported as ellipticity in units of millidegrees. Spectral deconvolution was conducted using the BestSel web server 50.
Solid-state NMR experiments and data analysis
Most solid-state NMR spectra were measured on a Bruker Avance II 800 MHz (18.8 T) spectrometer using a 3.2 mm E-free HCN probe. Intermolecular 13C-19F REDOR measurements were carried out on an Avance III HD 600 MHz (14.1 T) spectrometer using a 1.9 mm HFX probe. Static 31P spectra were measured on an Avance III HD 400 MHz (9.4 T) using a 4 mm HXY probe operating in HP double-resonance mode, at a probe thermocouple temperature of 303 K. MAS frequencies were 14 kHz for the 800 MHz experiments, except for the N-H doubled DIPSHIFT experiments 51, which were conducted at 7.6 kHz MAS, and the C-H doubled DIPSHIFT experiments, which were carried out at 10.5 kHz MAS. Radiofrequency (RF) field strengths on the 3.2 mm probe were 50–71 kHz for 1H, 50 kHz for 13C, and 33–42 kHz for 15N. RF field strengths on the 1.9 mm probe were 83–130 kHz for 1H, 62.5 kHz for 13C, and 71 kHz for 19F. Reported experimental temperatures are reported as either direct readings from the probe thermocouple (Tbearing) or as estimated sample temperature (Tsample) based on known spinning-induced frictional heating. We estimate that the frictional heating is 5 K under 7.6 kHz MAS and 10 K under 14 kHz MAS in 3.2 mm MAS rotors. For 1.9 mm rotors, the frictional heating is estimated to be 13 K under 25 kHz MAS. The orientational measurements were conducted in the liquid-crystalline phases of the membranes at a sample temperature Tsample of 315 K for the high-pH BM2 in POPE membranes and 313 K for the low-pH protein in POPC : POPG membranes. The 13C-19F REDOR distance experiments and 13C-13C correlation proximity experiments were carried out in gel-phase membranes where the protein was immobilized. The sample temperatures were 273 K for the high-pH BM2 in POPE membranes and 261 K for the low-pH protein in the POPC : POPG membranes. Because the uniaxial rotational diffusion is a rigid-body motion, the orientational constraints measured at high temperature can be combined with the distance constraints measured at low temperature to obtain “static” structural models that do not contain any information on local sidechain motions.
The pulse sequences for key 2D and 3D correlation experiments are shown in Extended Data Fig. 10. 2D and 3D 13C-13C correlation experiments were conducted using COmbined -Driven (CORD) mixing 52 for 13C spin diffusion. 2D 15N-13C and 3D 15N-13C-13C correlation spectra were measured using the out-and-back Transferred-Echo Double Resonance (TEDOR) pulse sequence 53. Detailed conditions for the 2D and 3D correlation experiments and the 13C-19F REDOR experiments are given in Supplementary Table 5.
13C chemical shifts were referenced externally to the adamantane CH2 chemical shift at 38.48 ppm on the tetramethylsilane scale and 15N chemical shifts were referenced to the 15N peak of N-acetylvaline at 122.00 ppm on the liquid ammonia scale. All spectra were processed using the TopSpin software and chemical shift assignment was conducted in Sparky 54. (ϕ, ψ) torsion angles were calculated using the TALOS-N 55 software after 13C chemical shifts were converted to the DSS scale by adding 2.00 ppm 56. Residue-specific chemical shift differences between the low-pH and high-pH proteins were calculated using all available 13C and backbone 15N chemical shifts according to , where n is the number of shifts for each residue assigned at both low-pH and high-pH.
2D contour maps of normalized water-edited 2D 13C-13C correlation spectra were generated using a Python script that removes spectral noise while calculating intensity ratios. The intensities of the 4 ms spin diffusion spectrum (S) and the control 100 ms spectrum (S0) were read in using the NMRglue package 57. Any intensity that is lower than 4.5 times the average noise level in an empty region of the 2D spectrum was set to zero for the S spectrum and set to a very large number for the S0 spectrum. These noise-filtered signals for the two 2D spectra were then divided and further scaled by the number of scans to obtain a 2D contour map, I4 ms/I100 ms.
Simulation of N-H dipolar couplings for orientation determination
A 19-residue ideal α-helix was generated in PyMOL 2.2 using segment S9-H27 of the BM2 sequence. The (ϕ, ψ) angles of residues 2–18 were set to (−65°, −40°), which match the TALOS-N predicted torsion angles for the BM2 TM domain. These (ϕ, ψ) angles constrain the amide N-H bonds to be 14.9±0.2° from the helix axis. This relative orientation is calculated as the scalar product between the individual H-N vectors (b) and the helix axis (h), which is the average of 18 consecutive H-N vectors. The helix axis is taken to be the direction of the bilayer normal. We then calculated a unit vector (p) perpendicular to the helix axis by setting the dot product of the two vectors to zero. This vector p is used to rotate all 18 H-N bond vectors (b) by an angle θ using Rodrigues’ rotation formula. Each of the 18 rotated H-N bond vectors (b′) is calculated using:
The angle ψ is calculated as the scalar product between each of the rotated H-N bond vectors (b’) and the bilayer normal h, then the N-H dipolar coupling was calculated from ψ according to:
where the rigid-limit H-N dipolar coupling is 10.4 kHz.
The helix tilt angle θ was varied from 0° to 30°. The maximum and minimum N-H dipolar coupling for each tilt angle was used to obtain the amplitude and offset of the dipolar wave. The measured N-H dipolar couplings were then fit in OriginPro using
where A is the amplitude, O is the offset, r is the number of residues per turn, and ϕ is the phase of the dipolar wave. The amplitude and offset were obtained from the simulations, r was set to 3.6 residues per turn, and the phase was obtained from the fitting. Allowing the number of residues r per turn to be fit yielded the same value of 3.6 within experimental uncertainty. The reduced χ2 for each tilt angle was obtained from OriginPro to obtain the best-fit tilt angle, and the uncertainty of ±2° was estimated from the χ2 distribution for the 5 degrees of freedom in the fit (7 independent data points and 1 free variable), using (χ2+1) for 1 standard deviation and (χ2+4) for 2 standard deviations. This uncertainty estimate was consistent with visual inspection that showed that simulated dipolar waves for tilt angles differing by more than 4° from the best fit clearly disagreed with the experimental data.
Simulation of 13C-19F REDOR curves for interhelical distance determination
13C-19F REDOR data were simulated using the SIMPSON software 58. Powder averaging used the REPULSION320 scheme 59 with 64 γ angles. The REDOR simulations accounted for finite 19F and 13C 180° pulse lengths, 19F pulse imperfections, and 19F chemical shift anisotropy (CSA) 36. The 19F pulse imperfection was treated by adding REDOR curves for 19F pulse flip angles of 180° to 145° using weights that match a normal distribution centered at 180° with a standard deviation of 15° 36. The weighted average REDOR curves were calculated for 3.0–12.0 Å distances in 0.1 Å increments. The 19F CSA was obtained from fitting the 19F CSA sideband intensities of the pH 7.5 POPE sample and the pH 4.5 POPC : POPG sample using the Solids Lineshape Analysis module in Topspin. The fitting used two sidebands on either side of the isotropic peak in a 19F CP spectrum measured at 14 kHz MAS. The best-fit CSA was δiso = -116.1 ppm, δCSA = 52±2 ppm, and η = 0.65±0.1 for the high pH sample and δiso = -116.2 ppm, δCSA = 55±2 ppm, and η = 0.6±0.1 for the low pH sample. Numerical simulations indicate that under these experimental conditions, the REDOR dephasing is insensitive to the 19F CSA tensor orientation relative to the dipolar vector, with a maximum uncertainty of 0.5 Å due to the unknown orientations of the two tensors.
The REDOR distance analysis required two other considerations. First, the 1 : 1 13C and 19F mixed peptides means that only 50% of all 13C-labeled helices have an adjacent 19F-labeled helix. Thus, the lowest possible REDOR S/S0 value is 0.5. Second, remaining resonance overlap in the 1D 13C spectrum means that the overlapped peaks will not experience complete dipolar dephasing if some of the carbons contributing to an overlapped signal are far from a 19F spin. We initially localized the regions of the protein experiencing dephasing using resolved 13C sites, such as P4 Cα, P4 Cδ, L18 Cδ2, H19 Cδ2, A22 Cβ and W23 Cγ. Once we had a preliminary structural model, we could attribute specific sites to other resonances that showed dephasing but were overlapped, only considering sites that were one α-helical turn away from the 19F labels at F5 and F20 (covering a ~12 Å range total for each 19F site). For example, we see strong dephasing of an Ile spin system, within 3.84 ms of REDOR mixing, indicating a distance of ˂6 Å. There are four Ile in the TM domain: I7, I10, I14 and I25. Of these, I10, I14 and I25 are too far away from F20 to observe strong dephasing. We also do not detect dephasing for the resolved T24 and G26, which provide evidence that I25 is too far away from F20. Meanwhile, I7 is less than one helical turn away from P4, and is thus the most probable candidate to have dipolar dephasing. Making the reasonable assumption that each Ile Cδ1 contributes equal intensity, we account for this overlap factor by correcting the simulated full-amplitude REDOR curves (S/S0)sim according to:
where f is the fraction of an overlapped 13C peak that can be dephased by 19F. For example, for the 4-fold overlapped 12-ppm Ile Cδ1 peak with f = 0.25, the lowest possible S/S0 value is ~0.875.
The random uncertainty σ(S/S0) of the measured S/S0 values at various mixing times were propagated from the signal-to-noise ratios of the S and S0 spectra. Best-fit distances were obtained as the distance with the lowest χ2 value between the measured and simulated S/S0 intensities. The distance uncertainty was obtained by doubling the best-fit χ2. Extended Data Fig. 7 shows the REDOR data and best-fit simulations for all sites that show noticeable dipolar dephasing. All sites show less dephasing at pH 4.5 than at pH 7.5. The lower and upper distance limits for structure calculation were set by multiplying the fitting distance uncertainty from the best-fit value by 2.5 times or by choosing distances that are 1.0 Å from the best-fit value, whichever was larger.
XPLOR-NIH structure calculations and analysis
We calculated the high-pH and low-pH BM2 structures for TM residues 1–33 using XPLOR-NIH 38 hosted on the NMRbox computing platform 60. In the first structure calculation phase, four extended BM2 monomers were placed in a square geometry spaced by 20 Å. 120 independent runs were performed with 5000 steps of torsion angle dynamics at 5000 K followed by annealing to 20 K in decrements of 15 K with 100 steps at each temperature. After the annealing, final energy minimizations in torsion angle and Cartesian coordinates were carried out. During the annealing, the four monomers were restrained to be identical using the non-crystallographic symmetry term PosDiffPot and the translational symmetry term DistSymmPot. Chemical-shift derived (ϕ, ψ) torsion angles were implemented with the XPLOR dihedral angle restraint term CDIH with ranges set to double the TALOS-N predicted uncertainty or 20°, whichever was larger. The ten measured N-H dipolar couplings (Supplementary Table 2) were implemented in units of Hz instead of kHz using the XPLOR residual dipolar coupling term RDC. The magnitude of the alignment tensor (Da) was set to 5.2 Hz, half the rigid-limit N-H dipolar coupling of 10.4 kHz, and the rhombicity of the alignment tensor was set to 0 due to uniaxial-rotation. The interhelical distance restraints (Supplementary Table 3) were implemented as contacts from the HZ atom of F5 or F20 of helix i to the corresponding carbon atoms of helix i+1, using the NOE term. In principle, the contacts could also be from helix i to helix i-1, but structure calculations under identical conditions revealed these structures to have 48% higher energies; thus this ambiguity was removed during the final structure calculation. The 13C-13C correlations were implemented as intra-molecular NOE distance restraints with an upper limit of 6.5 Å, 7.5 Å and 8.5 Å for contacts observed with 55 ms, 110 ms and 300 ms CORD mixing, respectively. Inter-residue cross peaks to the aromatic sidechains of F13, F20 and W23 were violated repeatedly at both high and low pH, and consequently the upper distance limit was increased to 12 Å for cross peaks to these long aromatic sidechain carbons. Residues 6–28 were constrained to be an α-helix by introducing artificial i to i+4 hydrogen bond restraints. These were implemented as NOE distance restraints from Oi-Ni+4 (2.95±0.10 Å) and Oi-HNi+4 (2.00±0.10 Å), hydrogen-bond angle restraints using the term HBDA, and implicit hydrogen bonds using the hydrogen-bonding database potential term HBDB. Finally, standard XPLOR potentials were used to restrain the torsion angles using a structural database with the term TorsionDB, and standard bond angles and lengths were set with terms BOND, ANGL, IMPR and RepelPot. The structures were sorted by energy, using all the potentials in the calculation. The scales for all potentials are given in Supplementary Table 4.
After the initial structure calculation, the lowest-energy structure was used as the input for the second round of structure refinement. 120 independent XPLOR-NIH runs were performed with 5000 steps of torsion angle dynamics at 3500 K followed by annealing to 20 K in decrements of 10 K with 100 steps at each temperature. This was followed by final energy minimizations in torsion angle and Cartesian coordinates. All the potentials employed in round one were used for round two, but the scales of the NOE, RDC, NCS and TorsionDB potentials were increased in round two (Supplementary Table 4). In this second round of structure calculation, we also added in back-calculated N-H dipolar couplings for the 13 residues lacking experimental data (Supplementary Table 2), assuming tilt angles of 14° at high pH and 20° at low pH. This was important for capturing the 20˚ helix tilt in the low pH structure, while the high pH structure was only slightly affected by inclusion of these additional restraints. The ten structures with the lowest energies were included in the final structural ensembles.
In the low-pH structure calculation, two REDOR restraints (F20 HZi-H19 Cai+1 and F20 HZi-M21 Cbi+1) were violated by 0.6 Å in 55% of the models but not in the lowest energy model. This is most likely due to partial resonance overlap in the low-pH spectra. We increased the upper distances and shortened the lower distance limit for these two REDOR restraints by 30% to accommodate the larger uncertainty. In addition, three 13C-13C (H27 CΑ - R33 CZ, H27 C - R33 CZ, and K32 CΒ - N29 CΑ) contacts in the β-strand were violated. Two H27-R33 contacts were violated by 0.6 Å in 10% of all structures, none of which were in the lowest energy structures. A K32-N29 contact was violated by 2.6 Å in 100% of calculated models. This severe violation suggests that the cross peak may be intermolecular in origin. Because these cross peaks all concern the β-strand region, whose structures we do not determine, and because the cross peaks likely result from intermolecular contacts, we removed these three constraints from the structure calculation. When the low-pH structural ensemble was recalculated including these three restraints, the structure of the TM segment (residues 6–28) has only a small heavy-atom RMSD of 0.21 Å from the ensemble calculated without the three constraints, confirming that removing these three restraints does not affect the conclusion of the TM structure.
The reported channel diameters are calculated using the HOLE program 61 and are the diameter of the largest sphere that can be accommodated from exclusion of the van der Waals diameter of all atoms at each XY plane along the Z channel coordinate, which is collinear with the direction of proton conduction.
Reporting Summary
Further information on experimental design is available in the Nature Research Reporting Summary linked to this article.
Data availability
NMR chemical shifts, and torsion angle, distance and orientation restraints for high-pH and low-pH BM2 have been deposited in the Biological Magnetic Resonance Bank (BMRB) with ID numbers 30645 and 30646. The structural coordinates for the high-pH closed and low-pH open BM2 have been deposited in the Protein Data Bank with accession codes 6PVR and 6PVT.
Extended Data
Extended Data Fig. 1. Purification and characterization of BM2(1–51).
(a) Amino acid sequences of the TM domain of AM2 and BM2. The conserved proton-selective histidine and the gating tryptophan are shown in red. The other pore-lining heptad a and d residues are polar in BM2 and hydrophobic in AM2 (blue) (b) SDS-PAGE gel showing Ni2+-affinity purification of SUMO-BM2. The flow through contains all soluble cellular proteins with low affinity for Ni2+. The column was washed with 50 mM imidazole, and SUMO-BM2 (18 kDa band) was eluted in two fractions at >90% purity with 300 mM imidazole. (c) Analytical reverse-phase HPLC chromatogram of BM2 before (black) and after (red) protease cleavage of the SUMO tag to give native BM2 at an elution time of 11.2 min. (d) MALDI mass spectrum of purified BM2(1–51), showing excellent agreement between the observed mass and the theoretical mass. (e) Circular dichroism spectrum of BM2 in 0.5% n-dodecylphosphocholine solution at pH 7.5. Spectral deconvolution indicates 60% α-helicity and 40% disordered or turn structures. (f) LC-MS total ion chromatogram of purified 4-19F-Phe5, 4-19F-Phe20 labeled synthetic BM2(1–51), showing excellent purity. (g) Deconvolution of extracted ion chromatogram of purified 4-19F-Phe5, 4-19F-Phe20 BM2. The measured molecular weight is in excellent agreement with the expected molecular weight.
Extended Data Fig. 2. Resonance assignment and inter-residue correlations of membrane-bound BM2 at pH 4.5.
(a) Representative strips of the NCACX (orange) and NCOCX (blue) regions of the 3D NCC spectrum to obtain sequential resonance assignment. The spectrum was measured at Tsample = 280 K. (b) Representative F2-F3 planes of the 3D CCC spectrum, showing various inter-residue correlations (assigned in red) that restrain the structure. The spectrum was measured using spin diffusion mixing times of 41 ms and 274 ms, at Tsample = 280 K. (c) 2D 13C-13C TOCSY spectrum with 7.7 ms mixing, collected at Tsample = 290 K. Residues 43–51 are dynamic and exhibit chemical shifts indicative of random coil conformation. (d) 1D 13C cross-polarization (CP) spectrum preferentially detects immobilized residues while the 13C INEPT spectrum preferentially detects highly dynamic residues. These 1D spectra were measured at Tsample = 280 K.
Extended Data Fig. 3. Resonance assignment and inter-residue correlations of membrane-bound BM2 at pH 7.5.
(a) 2D 13C-13C correlation spectrum with 55 ms CORD spin diffusion, measured at Tsample = 280 K. (b) Representative F2-F3 strips from the 3D CCC spectrum, showing various inter-residue correlations (assigned in red) that restrain the structure. The spectrum was measured using spin diffusion mixing times of 41 ms and 274 ms, at Tsample = 280 K. (c) 2D 13C-13C TOCSY spectrum with 7.7 ms mixing, collected at Tsample = 290 K. Residues 43–51 are dynamic and exhibit chemical shifts indicative of random coil conformation. (d) 13C CP spectrum preferentially detects immobilized residues while the 13C INEPT spectrum preferentially detects highly dynamic residues. These 1D spectra were measured at Tsample = 280 K.
Extended Data Fig. 4. Secondary structure of BM2 in the closed (high pH) and open (low pH) states.
(a) Cα (black) and Cβ (magenta) secondary chemical shifts at pH 7.5 and pH 4.5. (b) Chemical-shift derived (ϕ, ψ) torsion angles at pH 7.5 (black) and pH 4.5 (orange). At both pH, the TM domain is α-helical while the cytoplasmic tail is mostly disordered. In addition, a short β-strand segment is present at low pH. (c) Helical wheel representations of residues 48–63 in AM2 and the corresponding residues 29–44 in BM2. Hydrophobic residues are colored green, polar residues black, positively charged residues blue, and negatively charged residues red. AM2 has a separate hydrophobic face and a hydrophilic face, indicative of an amphipathic helix, while BM2 has alternating polar and non-polar residues, consistent with a β-strand conformation. (d) Static 31P spectra of BM2-containing POPE membrane at high and low pH and POPC/POPG membranes at low pH, all measured at a sample temperature of 303 K. At high pH the POPE membrane consists of ~65% bilayer and ~35% hexagonal phase. At low pH BM2 converts most of the POPE membrane to the hexagonal phase, but retains the lamellar form for the POPC/POPG membrane. Green dashed line is a superposition of 35% of the pH 4.5 POPE spectrum and 65% of the pH 4.5 POPC : POPG spectrum.
Extended Data Fig. 5. BM2 has similar conformations in POPE and POPC:POPG bilayers.
(a) 2D 13C-13C CORD spectra of BM2 in the two lipid membranes at low pH. (b) 2D 15N-13C correlation spectra of BM2 in the two lipid membranes at low pH. The POPE sample was measured at Tsample = 290 K for the 2D NC spectrum and 280 K for the 2D CC spectrum, while the POPC : POPG sample was measured at Tsample = 270 K to account for the lower phase transition temperature of this membrane. The lipid bilayers of both samples were in the gel phase, as assessed by 1H spectra of the sample. Both spectra were measured under 14 kHz MAS on an 800 MHz spectrometer. (c) Chemical shift differences between the POPE and POPC:POPG samples at low pH. Residues in the α-helical TM domain and the β-strand do not show significant chemical shift differences.
Extended Data Fig. 6. Measurement of BM2 helix orientation using rotationally averaged 15N-1H dipolar couplings.
(a-b) N-H DIPSHIFT data of the tripeptide formyl-MLF, measured at Tsample = 315 K using (a) 15N detection and (b) 13C detection. The dipolar-doubled version of DIPSHIFT is used in these experiments. The 15N-detected DIPSHIFT data were analyzed using the total intensities from the centerband and sidebands. The 13C-detected N-H couplings used a 15N-13C TEDOR mixing time of 2.11 ms. The 13C-detected N-H couplings are 0.9 times the 15N-detected values, indicating incomplete powder averaging. This scaling factor was included in determining the BM2 orientation from 13C-detected N-H dipolar couplings. (c) Calculated 15N-1H dipolar waves as a function of the helix tilt angle. An 18-residue ideal α-helix with (ϕ, ψ) angles of (−65˚, −40˚) were tilted from an external axis by 0°–30°. The 15N-1H dipolar couplings show the expected sinusoidal oscillations with a periodicity of 3.6 residues. The amplitude and offset of the dipolar wave indicate the helix tilt angle. (d) Reduced χ2 values of the measured and simulated 15N-1H dipolar couplings of membrane-bound BM2 at high and low pH. The minimum χ2 value is found at a tilt angle of 14˚ for high-pH BM2 and 20˚ for low-pH BM2. The ±2˚ uncertainty represents one standard deviation.
Extended Data Fig. 7. 13C-19F REDOR data for measuring interhelical distances of BM2 at high pH (black curves and filled symbols) and low pH (orange curves and open symbols).
The high pH data were measured at a sample temperature (Tsample) of 273 K, while the low pH data were measured at 261 K. Additional high-pH data measured at Tsample = 261 K (red symbols in some of the panels) are indistinguishable from 273 K data, confirming that the protein is immobilized at both temperatures. (a) N-terminal residues that are dephased by 4F-Phe5. (b) C-terminal residues whose dephasing is attributed to 4F-Phe20. All sites show less dephasing for the low-pH sample than the high-pH sample, indicating longer distances for the open channel. P4 has negligible dephasing at low pH. (c) Representative χ2 as a function of 13C-19F distance, showing the extraction of the best-fit distances and uncertainties. (d) Aromatic region of representative 13C-19F REDOR spectra of BM2 at high pH. The difference spectrum (ΔS) shows no dephasing for the 119-ppm W23 Cε3/ζ3/η2 peak (blue dashed line), indicating that 4F-Phe20 of the neighboring helix is far from these indole carbons. This is consistent with a W23 rotamer of t90 (χ1 = -125°, χ2 = 98°) but inconsistent with the mt rotamer (χ1=−80°, χ2=−177°).
Extended Data Fig. 8. HxxxW motif rotamers and comparison of the closed BM2 structures in lipid bilayers versus detergent micelles.
(a) Structural ensembles of H19 and W23 in the conserved HxxxW conduction motif at high pH (left) and low pH (right). The H19 χ1 is trans but the χ2 is not constrained well by experimental data. W23 predominantly adopts the t90 rotamer in both closed and open structural ensembles. (b-c) Comparison of the high-pH BM2 TM structure in lipid bilayers versus in detergent micelles. (b) Solid-state NMR structure determined here in POPE membranes. (c) Solution NMR structure determined in DHPC micelles 1.
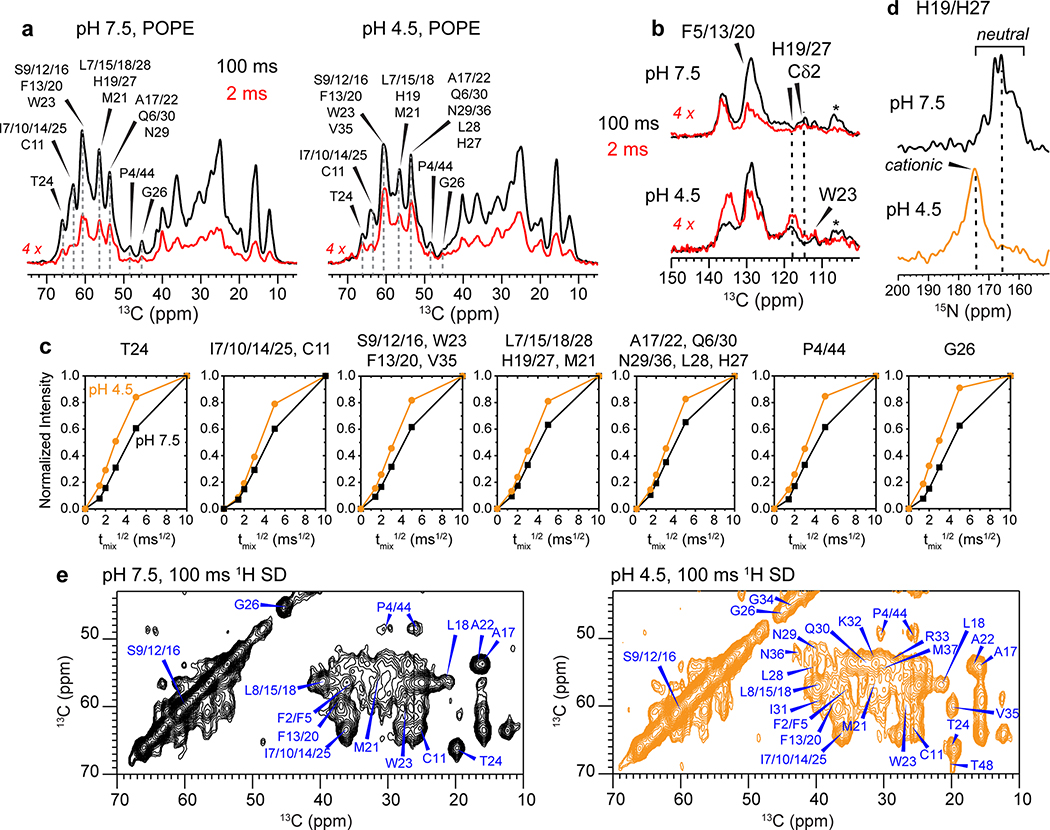
Extended Data Fig. 9. Hydration of membrane-bound BM2.
(a) Aliphatic region of the 13C spectra measured with 100 ms (black) and 2 ms (red) 1H polarization transfer from water to the protein, measured at Tsample = 273 K. The low-pH protein shows higher intensities, indicating higher water accessibility. (b) Aromatic region of the 13C spectra also show significantly higher water-transferred intensities at low pH than high pH. (c) Water-to-protein polarization transfer curves for various residues. The buildup rates are faster at low pH (orange) than at high pH (black). (d) 1D 15N CP spectra of the H19 and H27 sidechains of BM2 at high and low pH, measured at Tsample = 280 K. The imidazole 15N signals are shifted 8–9 ppm downfield at low pH compared to high pH, indicating increased protonation of the histidines. (e) Control 2D 13C-13C correlation spectrum, measured using a 1H-1H spin diffusion time of 100 ms to allow water magnetization to equilibrate with the protein. The spectra were measured at Tsample = 273 K.
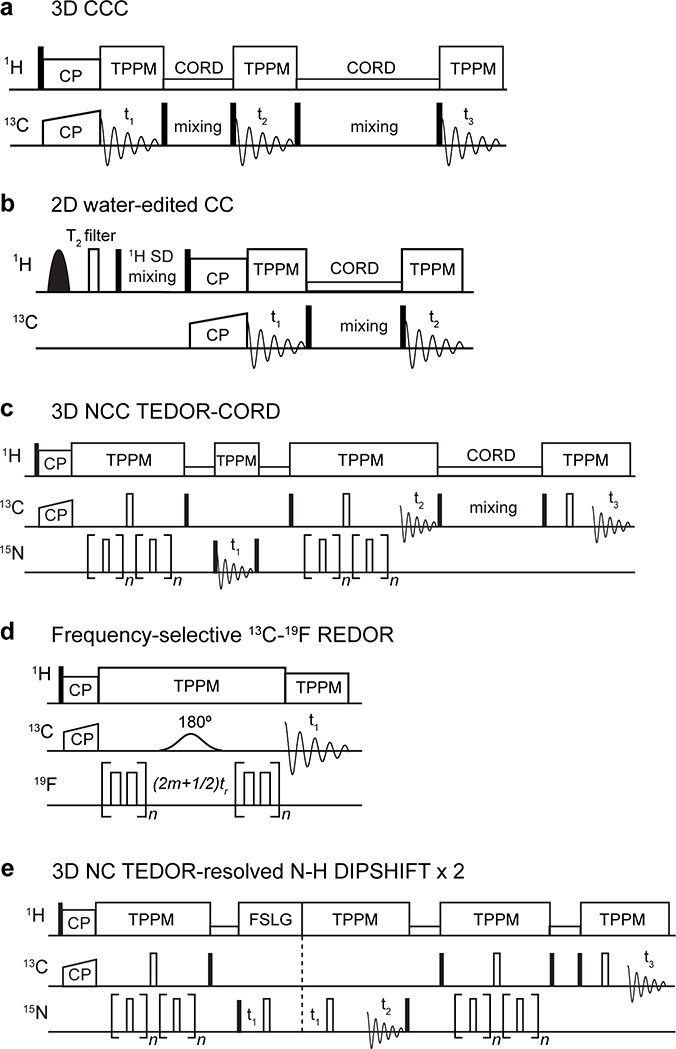
Extended Data Fig. 10. Pulse sequences of key 2D and 3D correlation experiments used for determining the structures of closed and open BM2 channels.
(a) 3D CCC experiment. The first 13C spin diffusion period is short to obtain intra-residue correlations while the second is long to obtain inter-residue cross peaks. (b) Water-edited 2D CC experiment. A selective 90˚ pulse excites the water 1H magnetization, a 1H T2 filter removes the rigid protein magnetization, then the water magnetization is transferred to the protein. Filled and open rectangles indicate 90° and 180° pulses, respectively. (c) 3D NCC experiment involving an out-and-back 15N-13C TEDOR period followed by 13C spin diffusion. The experiment simultaneously detects NCACX and NCOCX correlations. (d) Frequency-selective 13C-19F REDOR for distance measurements. (e) 3D NC-resolved N-H dipolar-doubled DIPSHIFT experiment for measuring helix orientations.
Supplementary Material
Acknowledgements
This research is funded by National Institutes of Health grant GM088204 to M. Hong. The authors thank B. Kwon for help with protein purification, and M. D. Gelenter and A. J. Dregni for discussions about structure calculation. This study made use of NMRbox: National Center for Biomolecular NMR Data Processing and Analysis, a Biomedical Technology Research Resource (BTRR), which is supported by NIH grant P41GM111135 (NIGMS).
Footnotes
Competing interests
The authors declare no competing financial interests.
References
- 1.Gadsby DC Ion channels versus ion pumps: the principal difference, in principle. Nat. Rev. Mol. Cell Biol 10, 344–352 (2009). [DOI] [PMC free article] [PubMed] [Google Scholar]
- 2.Mitchell P A general theory of membrane transport from studies of bacteria. Nature 180, 134–136 (1957). [DOI] [PubMed] [Google Scholar]
- 3.Forrest LR, Krämer R & Ziegler C The structural basis of secondary active transport mechanisms. Biochim. Biophys. Acta 1807, 167–188 (2011). [DOI] [PubMed] [Google Scholar]
- 4.Pinto LH & Lamb RA The M2 proton channels of influenza A and B viruses. J. Biol. Chem 281, 8997–9000 (2006). [DOI] [PubMed] [Google Scholar]
- 5.Hong M & DeGrado WF Structural basis for proton conduction and inhibition by the influenza M2 protein. Prot. Sci 21, 1620–1633 (2012). [DOI] [PMC free article] [PubMed] [Google Scholar]
- 6.Chizhmakov IV et al. Differences in conductance of M2 proton channels of two influenza viruses at low and high pH. J. Physiol 546, 427–438 (2003). [DOI] [PMC free article] [PubMed] [Google Scholar]
- 7.Ma C & Wang J Functional studies reveal the similarities and differences between AM2 and BM2 proton channels from influenza viruses. Biochim. Biophys. Acta 1860, 272–280 (2018). [DOI] [PMC free article] [PubMed] [Google Scholar]
- 8.Ma C et al. Asp44 stabilizes the Trp41 gate of the M2 proton channel of influenza A virus. Structure 21, 2033–2041 (2013). [DOI] [PMC free article] [PubMed] [Google Scholar]
- 9.DiFrancesco ML, Hansen UP, Thiel G, Moroni A & I. S Effect of cytosolic pH on inward currents reveals structural characteristics of the proton transport cycle in the influenza A protein M2 in cell-free membrane patches of Xenopus oocytes. PLoS One 9, e107406 (2014). [DOI] [PMC free article] [PubMed] [Google Scholar]
- 10.Ivanovic T et al. Kinetics of proton transport into influenza virions by the viral M2 channel. PLoS One, e31566 (2012). [DOI] [PMC free article] [PubMed] [Google Scholar]
- 11.Hu F, Luo W & Hong M Mechanisms of proton conduction and gating in influenza M2 proton channels from solid-state NMR. Science 330, 505–508 (2010). [DOI] [PMC free article] [PubMed] [Google Scholar]
- 12.Hu F, Schmidt-Rohr K & Hong M NMR detection of pH-dependent histidine-water proton exchange reveals the conduction mechanism of a transmembrane proton channel. J. Am. Chem. Soc 134, 3703–3713 (2012). [DOI] [PMC free article] [PubMed] [Google Scholar]
- 13.Williams JK, Zhang Y, Schmidt-Rohr K & Hong M pH-dependent conformation, dynamics, and aromatic interaction of the gating tryptophan residue of the influenza M2 proton channel from solid-state NMR. Biophys. J 104, 1698–708 (2013). [DOI] [PMC free article] [PubMed] [Google Scholar]
- 14.Hong M, Fritzsching KJ & Williams JK Hydrogen-bonding partner of the proton-conducting histidine in the influenza M2 proton channel revealed from 1H chemical shifts. J. Am. Chem. Soc 134, 14753–14755 (2012). [DOI] [PMC free article] [PubMed] [Google Scholar]
- 15.Khurana E et al. Molecular dynamics calculations suggest a conduction mechanism for the M2 proton channel from influenza A virus. Proc. Natl. Acad. Sci. U. S. A 106, 1069–1074 (2009). [DOI] [PMC free article] [PubMed] [Google Scholar]
- 16.Cady SD et al. Structure of the amantadine binding site of influenza M2 proton channels in lipid bilayers. Nature 463, 689–692 (2010). [DOI] [PMC free article] [PubMed] [Google Scholar]
- 17.Hu F, Luo W, Cady SD & Hong M Conformational plasticity of the influenza A M2 transmembrane helix in lipid bilayers under varying pH, drug binding, and membrane thickness. Biochim. Biophys. Acta 1808, 415–423 (2011). [DOI] [PMC free article] [PubMed] [Google Scholar]
- 18.Sharma M et al. Insight into the mechanism of the influenza A proton channel from a structure in a lipid bilayer. Science 330, 509–512 (2010). [DOI] [PMC free article] [PubMed] [Google Scholar]
- 19.Andreas LB et al. Structure and Mechanism of the Influenza A M218–60 Dimer of Dimers. J. Am. Chem. Soc 137, 14877–14886 (2015). [DOI] [PMC free article] [PubMed] [Google Scholar]
- 20.Acharya A et al. Structural mechanism of proton transport through the influenza A M2 protein. Proc. Natl. Acad. Sci. USA 107, 15075–15080 (2010). [DOI] [PMC free article] [PubMed] [Google Scholar]
- 21.Stouffer AL et al. Structural basis for the function and inhibition of an influenza virus proton channel. Nature 451, 596–599 (2008). [DOI] [PMC free article] [PubMed] [Google Scholar]
- 22.Thomaston JL et al. High-resolution structures of the M2 channel from influenza A virus reveal dynamic pathways for proton stabilization and transduction. Proc. Natl. Acad. Sci. USA 112, 14260–14265 (2015). [DOI] [PMC free article] [PubMed] [Google Scholar]
- 23.Mandala VS, Gelenter MD & Hong M Transport-Relevant Protein Conformational Dynamics and Water Dynamics on Multiple Time Scales in an Archetypal Proton Channel: Insights from Solid-State NMR. J. Am. Chem. Soc 140, 1514–1524 (2018). [DOI] [PMC free article] [PubMed] [Google Scholar]
- 24.Mould JA et al. Influenza B virus BM2 protein has ion channel activity that conducts protons across membranes. Dev. Cell 5, 175–184 (2003). [DOI] [PubMed] [Google Scholar]
- 25.Wang J, Pielak RM, McClintock MA & Chou JJ Solution structure and functional analysis of the influenza B proton channel. Nat. Struct. Mol. Biol 16, 1267–71 (2009). [DOI] [PMC free article] [PubMed] [Google Scholar]
- 26.Ma C et al. Identification of the pore-lining residues of the BM2 ion channel protein of influenza B virus. J. Biol. Chem 283, 15921–31 (2008). [DOI] [PMC free article] [PubMed] [Google Scholar]
- 27.Wang C, Takeuchi K, Pinto LH & Lamb RA Ion channel activity of influenza A virus M2 protein: characterization of the amantadine block. J. Virol 67, 5585–5594 (1993). [DOI] [PMC free article] [PubMed] [Google Scholar]
- 28.Watanabe S, Imai M, Ohara Y & Odagiri T Influenza B Virus BM2 Protein Is Transported through the trans-Golgi Network as an Integral Membrane Protein. J. Virol 77, 10630–10637 (2003). [DOI] [PMC free article] [PubMed] [Google Scholar]
- 29.Mandala VS, Liao SY, Gelenter MD & Hong M The Transmembrane Conformation of the Influenza B Virus M2 Protein in Lipid Bilayers. Sci. Rep 9, 3725 (2019). [DOI] [PMC free article] [PubMed] [Google Scholar]
- 30.Rossman JS, Jing XH, Leser GP & Lamb RA Influenza Virus M2 Protein Mediates ESCRT-Independent Membrane Scission. Cell 142, 902–913 (2010). [DOI] [PMC free article] [PubMed] [Google Scholar]
- 31.Wang T, Cady SD & Hong M NMR Determination of Protein Partitioning into Membrane Domains with Different Curvatures and Application to the Influenza M2 Peptide. Biophys. J 102, 787–794 (2012). [DOI] [PMC free article] [PubMed] [Google Scholar]
- 32.Elkins MR et al. Cholesterol-binding site of the influenza M2 protein in lipid bilayers from solid-state NMR. Proc. Natl. Acad. Sci. U. S. A 114, 12946–12951 (2017). [DOI] [PMC free article] [PubMed] [Google Scholar]
- 33.Cady SD, Goodman C, Tatko C, DeGrado WF & Hong M Determining the orientation of uniaxially rotating membrane proteins using unoriented samples: a 2H, 13C, and 15N solid-state NMR investigation of the dynamics and orientation of a transmembrane helical bundle. J. Am. Chem. Soc 129, 5719–5729 (2007). [DOI] [PubMed] [Google Scholar]
- 34.Hong M & Doherty T Orientation determination of membrane-disruptive proteins using powder samples and rotational diffusion: a simple solid-state NMR approach. Chem. Phys. Lett 432, 296–300 (2006). [DOI] [PMC free article] [PubMed] [Google Scholar]
- 35.Gullion T & Schaefer J Rotational echo double resonance NMR. J. Magn. Reson 81, 196–200 (1989). [DOI] [PubMed] [Google Scholar]
- 36.Shcherbakov AA & Hong M Rapid Measurement of Long-Range Distances in Proteins by Multidimensional 13C-19F REDOR NMR under Fast Magic-Angle Spinning. J. Biomol. NMR 71, 31–43 (2018). [DOI] [PMC free article] [PubMed] [Google Scholar]
- 37.Li S, Zhang Y & Hong M 3D (13)C-(13)C-(13)C correlation NMR for de novo distance determination of solid proteins and application to a human alpha-defensin. J. Magn. Reson 202, 203–10 (2010). [DOI] [PMC free article] [PubMed] [Google Scholar]
- 38.Schwieters CD, Kuszewski JJ, Tjandra N & Clore GM The Xplor-NIH NMR molecular structure determination package. J. Magn. Reson 160, 65–73 (2003). [DOI] [PubMed] [Google Scholar]
- 39.Kwon B, Roos M, Mandala VS, Shcherbakov AA & Hong M Elucidating Relayed Proton Transfer through a His-Trp-His Triad of a Transmembrane Proton Channel by Solid-State NMR. J. Mol. Biol 431, 2554–2566 (2019). [DOI] [PMC free article] [PubMed] [Google Scholar]
- 40.Williams JK & Hong M Probing membrane protein structure using water polarization transfer solid-state NMR. J. Magn. Reson 247, 118–127 (2014). [DOI] [PMC free article] [PubMed] [Google Scholar]
- 41.Williams JK, Shcherbakov AA, Wang J & Hong M Protonation equilibria and pore-opening structure of the dual-histidine influenza B virus M2 transmembrane proton channel from solid-state NMR. J. Biol. Chem 292, 17876–17884 (2017). [DOI] [PMC free article] [PubMed] [Google Scholar]
- 42.Hu J et al. Backbone structure of the amantadine-blocked trans-membrane domain M2 proton channel from Influenza A virus. Biophys. J 92, 4335–4343 (2007). [DOI] [PMC free article] [PubMed] [Google Scholar]
- 43.Williams JK, Tietze D, Lee M, Wang J & Hong M Solid-State NMR Investigation of the Conformation, Proton Conduction, and Hydration of the Influenza B Virus M2 Transmembrane Proton Channel. J. Am. Chem. Soc 138, 8143–8155 (2016). [DOI] [PMC free article] [PubMed] [Google Scholar]
- 44.Liang R et al. Acid activation mechanism of the influenza A M2 proton channel. Proc. Natl. Acad. Sci. USA 113, E6955–E6964 (2016). [DOI] [PMC free article] [PubMed] [Google Scholar]
- 45.Balannik V et al. Functional studies and modeling of pore-lining residue mutants of the influenza a virus M2 ion channel. Biochemistry 49, 696–708 (2010). [DOI] [PMC free article] [PubMed] [Google Scholar]
- 46.Laporte M et al. Hemagglutinin cleavability, acid-stability and temperature dependence optimize influenza B virus for replication in human airways. J. Virol, Epub ahead of print (2019). [DOI] [PMC free article] [PubMed] [Google Scholar]
- 47.Russell CJ, Hu M & Okda FA Influenza Hemagglutinin Protein Stability, Activation, and Pandemic Risk. Trends Microbiol. 26, 841–853 (2018). [DOI] [PMC free article] [PubMed] [Google Scholar]
- 48.Mijalis AJ et al. A fully automated flow-based approach for accelerated peptide synthesis. Nat. Chem. Biol 13, 464–466 (2017). [DOI] [PubMed] [Google Scholar]
- 49.Baumruck AC, Tietze D, Steinacker LK & Tietze AA Chemical synthesis of membrane proteins: a model study on the influenza virus B proton channel. Chem. Sci 9, 2365–2375 (2018). [DOI] [PMC free article] [PubMed] [Google Scholar]
- 50.Micsonai A et al. Accurate secondary structure prediction and fold recognition for circular dichroism spectroscopy. Proc. Natl. Acad. Sci. U. S. A 112, E3095–103 (2015). [DOI] [PMC free article] [PubMed] [Google Scholar]
- 51.Hong M et al. Coupling Amplification in 2D MAS NMR and Its Application to Torsion Angle Determination in Peptides. J. Magn. Reson 129, 85–92 (1997). [DOI] [PubMed] [Google Scholar]
- 52.Hou GJ, Yan S, Trebosc J, Amoureux JP & Polenova T Broadband homonuclear correlation spectroscopy driven by combined R2(n)(v) sequences under fast magic angle spinning for NMR structural analysis of organic and biological solids. J. Magn. Reson 232, 18–30 (2013). [DOI] [PMC free article] [PubMed] [Google Scholar]
- 53.Daviso E, Eddy MT, Andreas LB, Griffin RG & Herzfeld J Efficient resonance assignment of proteins in MAS NMR by simultaneous intra- and inter-residue 3D correlation spectroscopy. J. Biomol. NMR 55, 257–265 (2013). [DOI] [PMC free article] [PubMed] [Google Scholar]
- 54.Goddard TD & Kneller DG SPARKY 3. University of California, San Francisco. [Google Scholar]
- 55.Shen Y & Bax A Protein backbone and sidechain torsion angles predicted from NMR chemical shifts using artificial neural networks. J. Biomol. NMR 56, 227–241 (2013). [DOI] [PMC free article] [PubMed] [Google Scholar]
- 56.Harris RK et al. Further conventions for NMR shielding and chemical shifts (IUPAC recommendations 2008). Pure Appl. Chem 80, 59–84 (2008). [DOI] [PubMed] [Google Scholar]
- 57.Helmus JJ & Jaroniec CP Nmrglue: an open source Python package for the analysis of multidimensional NMR data. J. Biomol. NMR 55, 355–367 (2013). [DOI] [PMC free article] [PubMed] [Google Scholar]
- 58.Bak M, Rasmussen JT & Nielsen NC SIMPSON: a general simulation program for solid-state NMR spectroscopy. J. Magn. Reson 147, 296–330 (2000). [DOI] [PubMed] [Google Scholar]
- 59.Bak M & Nielsen NC REPULSION, A Novel Approach to Efficient Powder Averaging in Solid-State NMR. J. Magn. Reson 125, 132–9 (1997). [DOI] [PubMed] [Google Scholar]
- 60.Maciejewski MW et al. NMRbox: A Resource for Biomolecular NMR Computation. Biophys. J 112, 1529–1534 (2017). [DOI] [PMC free article] [PubMed] [Google Scholar]
- 61.Smart OS, Neduvelil JG, Wang X, Wallace BA & Sansom MS HOLE: a program for the analysis of the pore dimensions of ion channel structural models. J. Mol. Graph 14, 354–360 (1996). [DOI] [PubMed] [Google Scholar]
Associated Data
This section collects any data citations, data availability statements, or supplementary materials included in this article.
Supplementary Materials
Data Availability Statement
NMR chemical shifts, and torsion angle, distance and orientation restraints for high-pH and low-pH BM2 have been deposited in the Biological Magnetic Resonance Bank (BMRB) with ID numbers 30645 and 30646. The structural coordinates for the high-pH closed and low-pH open BM2 have been deposited in the Protein Data Bank with accession codes 6PVR and 6PVT.


