Abstract
Climate models project significant twenty-first-century declines in water availability over the American West from anthropogenic warming. However, the physical mechanisms underpinning this response are poorly characterized, as are the uncertainties from vegetation’s modulation of evaporative losses. To understand the drivers and uncertainties of future hydroclimate in the American West, a 35-member single model ensemble is used to examine the response of summer soil moisture and runoff to anthropogenic forcing. Widespread dry season soil moisture declines occur across the region despite increases in total water-year precipitation and ubiquitous increases in plant water-use efficiency. These modeled soil moisture declines are initially forced by significant snowpack losses that directly diminish summer soil water, even in regions where water-year precipitation increases. When snowpack priming is coupled with a warming- and CO2-induced shift in phenology and increased primary production, widespread increases in leaf area further reduces summer soil moisture and runoff by outpacing decreased stomatal conductance from high CO2. The net effects lead to the cooccurrence of both a “greener” and “drier” future across the western United States. Because simulated vegetation exerts a large influence on predicted changes in water availability in the American West, these findings highlight the importance of reducing the substantial uncertainties in the ecological processes increasingly incorporated into numerical Earth system models.
1. Introduction
Freshwater availability in the American West is both scarce and variable. Future projections of hydroclimatic changes due to greenhouse gas increases over the region show substantial declines in several terrestrial water measures—diagnostic (Seager et al. 2007, 2013; Simpson et al. 2016), prognostic (Cook et al. 2015; Ault et al. 2016), and offline calculations alike (Dai 2013; Cook et al. 2014, 2015; Coats and Mankin 2016; Ault et al. 2016; Scheff and Frierson 2015). Together these projections of hydroclimate suggest that present-day water stresses in the American West will likely increase with warming as seasonal aridity rises to levels far outside contemporary human experience (Dai 2013; Cook et al. 2014, 2015; Ault et al. 2016; Seager et al. 2013; Williams et al. 2013; Fu and Feng 2014; Coats and Mankin 2016; Udall and Overpeck 2017).
Despite the consistent direction and magnitude of projected drying over the American West, the interpretation of these responses is complicated by the question of whether expected increases in surface resistance to evapotranspiration (ET) are well represented in calculations of aridity (Roderick et al. 2015; Milly and Dunne 2016; Swann et al. 2016). In particular, there is the question of the appropriateness of potential evapotranspiration (PET) to assess future hydroclimate changes under high CO2 (Roderick et al. 2015; Milly and Dunne 2016; Swann et al. 2016). PET is a theoretical quantity representing the radiative and aerodynamic constraint on surface water evaporation given no water limitations (Cook et al. 2014; Scheff and Frierson 2014; Wang and Dickinson 2012). PET monotonically increases with warming (Scheff and Frierson 2014; Sherwood and Fu 2014; Fu and Feng 2014), but common PET formulations consider bulk surface resistance to ET as time invariant (Allen et al. 1998, 1–15) and therefore neglect the physiological (and thus hydrological) consequences of high CO2 on vegetation.
A common (but not universal) fundamental physiological response of plants to increased CO2 is to close their stomata, causing, all else being equal, decreased ecosystem-scale canopy transpiration (Cowan 1978; Ball et al. 1987; Field et al. 1995). The first-order hydrological response is thus an increase in soil moisture and runoff (Field et al. 1995; Betts et al. 2007; Cao et al. 2010; Roderick et al. 2015; Swann et al. 2016). A corollary to such stomatal closure is decreased water costs of carbon assimilation, or what is called plant water-use efficiency (WUE): at higher levels of ambient CO2, plants can fix the same amount of carbon while transpiring less water per unit of carbon assimilated (Field et al. 1995). Thus, aridity metrics that are methodologically reliant on PET—such as the Palmer drought severity index (PDSI) (Rind et al. 1990; Cook et al. 2015; Ault et al. 2016), the standardized precipitation evapotranspiration index (SPEI) (Vicente-Serrano et al. 2010), the supply-demand drought index (SDDI) (Rind et al. 1990; Touma et al. 2015), or the ratio of precipitation to potential evapotranspiration (P/PET) (Scheff and Frierson 2014; Sherwood and Fu 2014; Fu and Feng 2014)—potentially overestimate future terrestrial drying, as they ignore such physiological forcing of the land surface by CO2 (Roderick et al. 2015; Milly and Dunne 2016; Swann et al. 2016).
In contrast to offline aridity metrics reliant on PET, the hydroclimate responses from the subset of climate models with biogeochemical schemes, called Earth system models (ESMs), include model representations of stomatal conductance, and by extension the transient responses in surface resistance to ET (Friedlingstein et al. 2006). Diagnostic measures from ESMs, such as annual precipitation minus evapotranspiration (P — E), can therefore give different (and generally “wetter”) pictures of changes in future terrestrial water than those from widely used PET-based metrics like PDSI (Swann et al. 2016). PET-based metrics like PDSI are nevertheless a powerful means of characterizing soil moisture, one that is biophysically meaningful enough to be a skillful reconstruction target in dendroclimatology (Cook et al. 2004). Further complicating the ease with which projections of PDSI can be dismissed is that the PDSI response looks quite similar to that from modeled soil moisture, including from ESMs that include active biogeochemistry (Cook et al. 2015; Ault et al. 2016; Feng et al. 2017).
Soil moisture—water stored in the vadose zone—is a critical climate quantity that plays an active role in the balances of energy, water, biogeochemistry, land–atmosphere interactions, and boundary layer circulation (Seneviratne et al. 2010). Projections of soil moisture from ESMs, like the diagnostic P – E, include changes in surface resistance due to physiological forcing. Unlike P – E, however, soil moisture is endogenous to the model and provides a direct prognostic measure of water availability at the land surface. Given the rightful concerns about drought and aridity projections based only on PET-based PDSI, the shared response of soil moisture and PDSI—despite their very different assumptions—prompts important questions about the physical drivers of projected soil moisture declines in the American West. Here we undertake an effort to understand the drivers of shallow and deep soil moisture and runoff decline to high CO2 in the American West in a large single model ensemble with active biogeochemistry: version 1 of the Community Earth System Model (CESM). We specifically ask the following questions: 1) In the absence of large declines of precipitation, what are the mechanistic drivers of soil moisture and runoff mean state declines? 2) What accounts for the spatial and depth-dependent heterogeneities across the American West in these hydroclimatic responses? 3) What do these hydroclimatic responses suggest about structural model uncertainties? In working toward a mechanistic understanding of future aridity in the American West, we also reconcile some of the divergences in different measures of drought.
2. Data and methods
a. Climate model configuration
Climate model data come from the 35-member Community Earth System Model–Large Ensemble (CESM-LE or LENS) experiment produced by the National Center for Atmospheric Research (NCAR) (Kay et al. 2015). The LENS simulations are fully coupled, using NCAR’s ocean model (POP2; 60 vertical levels), which was run on a “gx1v6” displaced pole grid (~1° resolution), and hydrostatic atmosphere (CAM5; 30 vertical levels), land (CLM4), and sea ice (CICE) components all run at a 0.9° × 1.25° finite-volume grid resolution, which is an out-of-the-box and well-vetted grid combination used in NCAR production runs. The component set is the same as that for phase 5 of the Coupled Model Intercomparison Project (CMIP5), although the forcing protocol and experimental design differ from the CMIP5 simulations as discussed below.
The experimental design of the LENS provides a robust estimate of CESM’s uncertainty in future projections that derives from internal climate variability induced by the atmosphere–ocean system. The experimental strategy is born of efforts in decadal climate prediction that emphasize the role of initial condition uncertainty (rather than boundary condition uncertainty) as being the dominant source of near-term climate uncertainty (Meehl et al. 2009; Hawkins and Sutton 2009). A large ensemble provides a robust estimate of internal variability generated by atmosphere-ocean processes against which the forced signal (ensemble mean) can be compared.
To estimate internal variability in the CESM, each LENS ensemble member is forced with the same greenhouse gas assumptions; the only difference among runs is the round-off error (on the order of 10−14K) introduced into each member’s initial atmospheric temperature field on the same date (Kay et al. 2015). Each ensemble member experiences the same forcing pathway and has full interaction among the atmosphere, ocean, and other Earth system components, allowing the initial conditions to propagate through the coupled system. The ensemble spread at the end of the simulations represents internal variability generated by the modeled Earth system and the ensemble mean represents an estimate of the forced response common to all ensemble members. This experimental design contrasts with the individual or small ensemble model realizations within the CMIP5 archive that do not fully sample internal variability and hence do not allow identification of the forced signal on a model-by-model basis (Mankin et al. 2017, 2015).
In the present analysis, we analyze data from 35 historical (1920–2005) and future (2006–2100) simulations (ensemble numbers 1–30 and 101–105, chosen based on the hydroclimate data archived) downloaded from the Earth system grid at NCAR. In contrast to the CMIP5 CESM simulations, the LENS uses more realistic ozone forcing derived from a set of simulations with a coupled high-top atmosphere chemistry-climate model (CESM1-WACCM; cf. Kay et al. 2015). Ensemble member 1 simulates climate from 1850 to 2100 branched from the 2200-yr preindustrial control simulation (PI-control, of which 1800 years were archived) with historical forcing from 1850 to 2005 and then the representative concentration pathway 8.5 (RCP8.5) from 2006 to 2100 (Meinshausen et al. 2011). Ensemble members 2 through 35 are initialized by perturbing the temperature fields of 1 January 1920 in ensemble member 1. Each run then simulates climate from 1920 to 2100 with the same forcing protocol described above (from historical to RCP8.5).
We focus our analysis on monthly hydroclimatic and vegetation output from CLM4, the land surface component of CESM. CLM4 has 15 soil levels, the top 10 of which (from 0 to ~286 cm) are hydrologically active globally, meaning that these soil levels are part of the surface hydrology scheme of the model and have soil moisture that varies with time. The land model has prognostic biological production and biogeochemical cycles: it provides 15 possible plant functional types (PFTs), the community assemblages of which are prescribed as fractional areas of grid cells; ecosystem demography and biogeography are not active in this set of simulations and so land cover changes and PFTs are prescribed as boundary conditions in the simulations. Leaf areas are prognostic, transiently evolving in the simulations within each PFT fraction and grid cell (Oleson et al. 2010). Leaf photosynthesis in C3 plants is parameterized following Farquhar et al. (1980) and Collatz et al. (1991) for sunlit and shaded leaves, with stomatal conductance being a function of the relative humidity gradient between the inside of the leaf and the immediately surrounding ambient air, ambient CO2, and the CO2 assimilation rate as determined by the Ball–Berry formulation (Oleson et al. 2010). Vertical transport of soil water is calculated one-dimensionally with a modified Richards equation (Zeng and Decker 2009) and is a function of infiltration from precipitation, surface and subsurface runoff, soil water potential, evaporation from the soil, snow sublimation and melt, and canopy transpiration.
The simulation of root structures warrants discussion because they represent the interface between vegetation and soil moisture, and thus influence transpiration and its uncertainty. CLM4 simulates prognostic growth of root structures for each PFT (both coarse and fine root state variables). Such PFT-dependent growth is determined by allometric relationships within the biogeochemical subcomponent of CLM (Oleson et al. 2010) and is based on root fraction parameters that determine the fraction of a PFT’s roots in each layer of the soil column given that prognostic growth. Total grid cell transpiration, which is determined by boundary layer physics and moisture limitation (boundary layer and stomatal resistances), is distributed vertically and across all PFTs present in the soil column. This distribution is a function of CLM4’s parameterization of plant hydraulics: the combination of the root fraction of each PFT and the soil water potential in each layer, given the plant wilting factors over all soil levels (βt), determines the root water uptake in that level.
b. Data
We analyze monthly-scale gridded LENS output (CESM variable names are indicated in quotation marks). From supply we use precipitation (mms−1), which we calculate as the sum of SNOW (mms−1) and RAIN (mms−1) from the land component; snowpack or snow water equivalent (SWE) (H2OSNO; mm); and snowmelt (QSNOMELT; mms−1). For demand, we analyze monthly ET (mms−1), which is the grid point sum of ground evaporation (soil and snow evaporation plus sublimation minus dew; QSOIL; mms−1), canopy evaporation (QVEGE; mms−1), and transpiration (QVEGT; mms−1). We calculate the canopy water flux as the sum of canopy evaporation and transpiration. Volumetric soil moisture (volume of water per unit volume of soil, θ) from the hydrologically active top 10 levels is presented (H2OSOI; m3m−3) along with total runoff (mms−1), which we calculate as the grid point sum of total surface [from glaciers, lakes, and wetlands (QRGWL) and surface runoff (QOVER); both in mms−1) and subsurface (QDRAI; mms−1) runoff. We group the 15 PFTs into four classes: trees, shrubs, grasses, and crops. We also analyze canopy photosynthesis in the form of gross primary productivity (GPP; gC m−2 s−1), which is the sum of sunlit and shaded leaf photosynthesis before down-regulation from water stress and nutrient limitation and respiration, and the leaf area index (TLAI; unitless). We also calculate annual-scale WUE as the ratio between annual average net primary productivity (NPP; gC m−2 s−1, postrespiration) and annual average transpiration at the grid point scale. We note this could be calculated with GPP but we choose NPP to include the model effects of soil moisture and nutrient limitation on growth.
c. Analyses
We examine the American West, bounded by 28°–50°N and 100°–128°W during the dry season [June–August (JJA)]. We subdivide this domain into three regions: 1) the Northwest Coast, which includes central and northern California, Oregon, and Washington; 2) Southern California, and 3) the Montane West, which includes large fractions of seven high-elevation states spanning the Rocky Mountains. We define the water-year (WY) as October–August to be up to but not exceeding the summer season.
Where standardized variables are presented, we standardize each variable in each simulation using their 1800-yr annual, monthly, or seasonal PI-control mean and standard deviation, leaving them in common units of standard deviations relative to the preindustrial era. Where applicable, we also present variables in native units. To estimate the drivers of interannual variability in soil moisture, we calculate nonparametric Spearman’s rank correlation coefficients for different variables (seasonal and monthly) at individual levels within the soil column. Prior to performing the correlation estimates within each ensemble member, we area-weight average quantities in native units at the regional-scale, standardize the values to the PI-control as described above, and detrend the standardized time series within each analyzed 30-yr period to remove the linear trend associated with anthropogenic forcing. We also include several tests of significance of the ensemble means in our analyses. Statistically significant changes for the ensemble mean maps are denoted with solid colors; insignificant changes are hatched. We define significant changes in the ensemble mean if two criteria are satisfied: 1) the ensemble mean of the 30-yr climatology must be above or below the 97.5th or 2.5th percentile of the distribution defined by the 1770 overlapping 30-yr mean states derived from the PI-control, and 2) at least 90% of the 35 LENS members (~32) must agree with the direction of the ensemble mean change. For the nonparametric correlations, we perform a two-sided bootstrapped (1000) Kolmogorov-Smirnov (K-S) test of similarity (N = 35) on the ensemble distributions of correlations between the historical (1976–2005) and end-of-century (2071–2100) periods.
3. Projected drying in the American West
a. Soil moisture
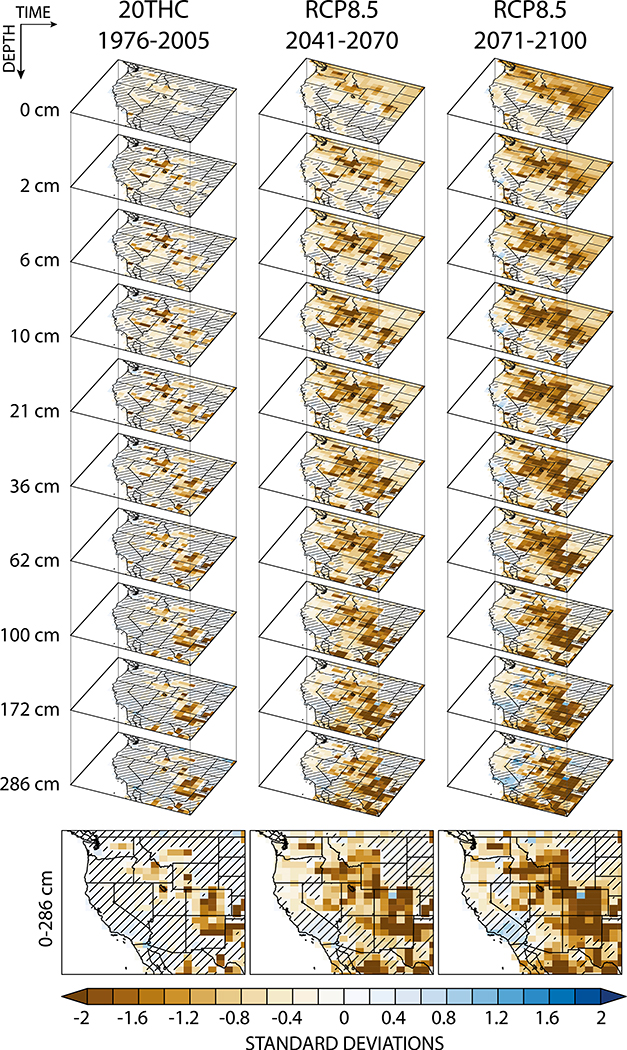
Shallow and deep soil layers are projected to dry robustly throughout vast areas of the American West by the end of the twenty-first century during summer in the LENS simulations (Fig. 1). This remarkably consistent picture of regional summertime drying persists at all hydrologically active layers in the soil column relative to both the preindustrial and twentieth-century climates.
Fig. 1.
Summer (JJA) soil moisture response to anthropogenic forcing [(left) historical, (center) RCP8.5 midcentury, (right) RCP8.5 end of century] in (top)–(bottom) each hydrologically active layer and the full (0–~3 m) column-weighted response. Each panel shows the ensemble mean of the 30-yr average time series standardized to the 1800-yr PI-control simulation mean and standard deviation from each run. Insignificant change is denoted with hatching.
Beginning in the late-twentieth century (1976–2005), robust JJA drying emerges in the top half meter of the soil throughout the central-west and southwestern United States. Deeper in the soil column—down to ~3 m—only Colorado and northern New Mexico show consistent drying, and the drying signal at depth in that area is of greater relative magnitude than that seen at the surface (Fig. 1, left). Inconsistent or uncertain changes across the ensemble, denoted by hatching in the left column of Fig. 1, dominate the entirety of the West Coast at all levels at the end of the twentieth century and increase in spatial extent with depth. Integrating over the entire soil column (0–286 cm; Fig. 1, bottom left) reveals a swath of twentieth-century drying with magnitudes increasing from −0.5 in the northwestern domain to greater than −2.0 standard deviations in the southeastern domain. The varied response with depth suggests that the modest anthropogenic forcing to date has caused a differential response in shallow versus deep soil moisture over considerable regions of the American West.
As forcing increases, the spatial- and depth-based heterogeneities disappear, the ensemble converges on robust drying and, halfway through the twenty-first century (2041–70), ~54% of the domain shows column-integrated 30-yr soil moisture anomalies more negative than −0.5 standard deviations (Fig. 1, center). These anomalies are on par with definitions of persistent droughts (e.g., megadroughts), identified as multidecadal periods with standardized anomalies in hydroclimate indices more negative than −0.5 standard deviations (Ault et al. 2014; Cook et al. 2015; Ault et al. 2016; Coats and Mankin 2016). Soil layers in the first half meter of the column show an expansion in the spatial extent and magnitude of drying relative to the twentieth century. Modest but significant soil moisture decreases also extend to parts of the northwest coast of Oregon and Washington State. In the near surface (0–10 cm), the drying extends as far south as California’s Central Valley (Fig. 1, center).
By the end of the twenty-first century in the high RCP8.5 emissions scenario, the integrated 0–3-m soil moisture in the American West is, on average, more than one standard deviation drier than in a preindustrial climate, and three-quarters of a standard deviation drier than the late-twentieth century. Over 87% of the 4.6 × 10⁶ km2 domain shows negative mean states in 0–3-m JJA soil moisture, with ~50% of the area exhibiting significant negative ensemble mean values (Fig. 1, bottom right). Additionally, 37% of the domain has integrated soil moisture values more negative than −1.0 standard deviations, encompassing the states of Oregon, Washington, Idaho, Colorado, New Mexico, and Utah, as well as western Montana and Wyoming, and eastern Nevada and Arizona. This spatial pattern of soil moisture decline is consistent with depth. Southern California stands out as the lone region of increases in summertime soil moisture, although these increases are statistically insignificant, at all depths except for the deepest soil layer.
b. Runoff
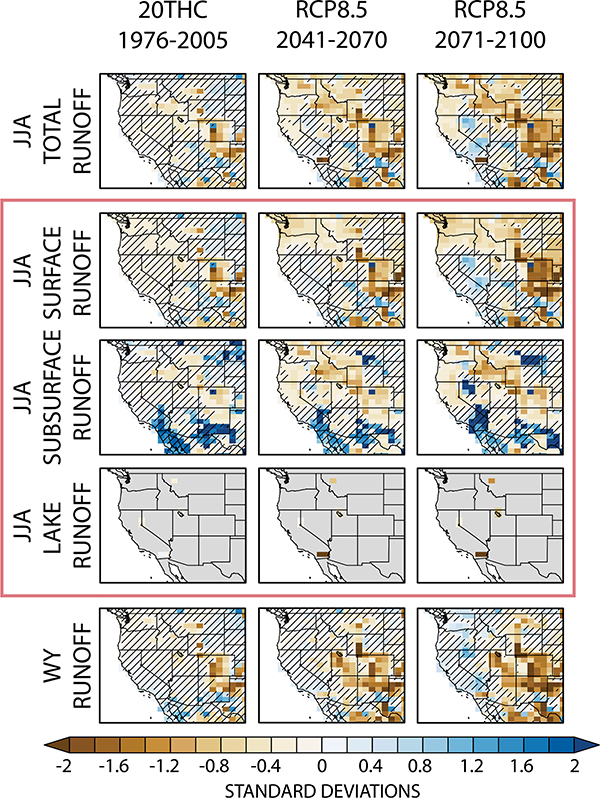
Figure 2 shows the response of JJA total runoff to anthropogenic forcing by the late-twentieth century and the mid- and late-twenty-first century. The change in total runoff has the same northwest to southeast band of reduction seen in soil moisture. However, the magnitudes of the decrease are smaller: the domain average decrease in runoff is nearly −0.5 standard deviations by 2100, compared to over twice that for full-column soil moisture. About 20% of the area—some 2.8 × 10⁶km2—exhibits summer runoff declines of more than one standard deviation, predominantly in Colorado and New Mexico. The regions of slight summer runoff increases reside on the western flank of the Rocky Mountains and in Southern California.
Fig. 2.
Summer (JJA) runoff response to anthropogenic forcing [(left) historical, (center) RCP8.5 mid-twenty-first century, (right) RCP8.5 end of century]. We decompose (top) JJA-mean total runoff into its three components outlined in the red box: (second row) surface, (third row) subsurface, and (fourth row) lake–glacier–wetland runoff in JJA. Water-year (WY) runoff is the bottom row. Each panel shows the ensemble mean of each run’s 30-yr average time series standardized to the 1800-yr PI-control simulation mean and standard deviation. Insignificant change is denoted with hatches.
The decomposition of JJA total runoff into its constituent variables is also shown in Fig. 2. Surface runoff exhibits the most similar spatial pattern to total runoff, a function of the fact that over the Western American domain, surface runoff comprises ~(76%–78%) of total runoff over all model runs, regardless of time period (preindustrial, historical, or future). Notable, albeit insignificant, increases exist in subsurface summer runoff in parts of Southern California, northwestern Mexico, southern New Mexico, and western Texas (Fig. 2).
The WY runoff exhibits a similar spatial pattern to JJA runoff, with statistically significant declines over the interior of the American West that expand with forcing, extending from Montana to Texas by the end of the century (Fig. 2, bottom). Few places see significant increases in WY runoff; the majority of increases are modest and insignificant given preindustrial variability.
4. Projected hydroclimatic supply and demand in the American West
a. Sources of hydroclimatic supply
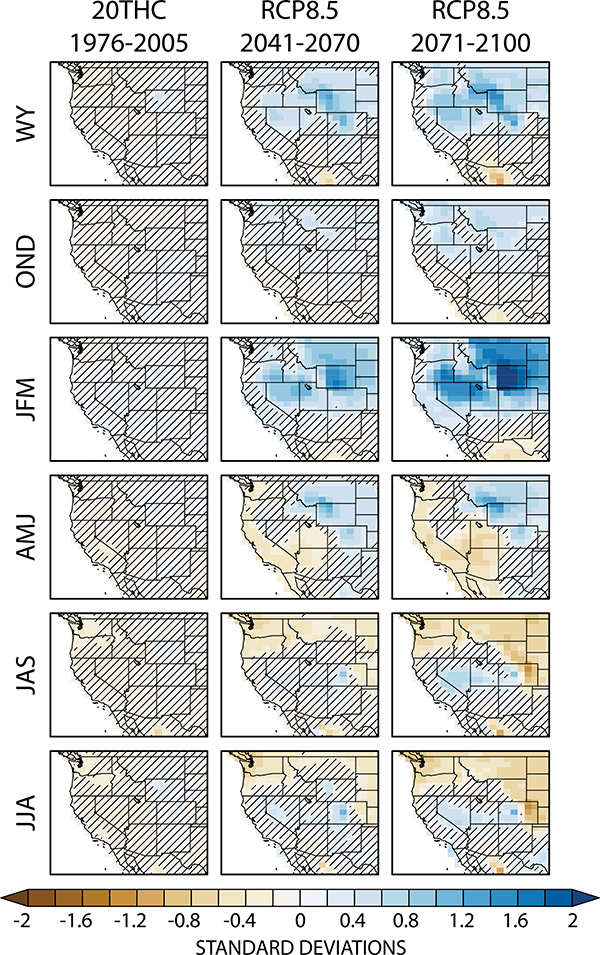
The late-twentieth century sees no statistically significant changes in water-year (October–August) or seasonal precipitation across the domain (Fig. 3, left). By the second half of the twenty-first century, however, domain averaged WY precipitation increases in the northern part of the domain covering 75% of the American West, with ~40% of the western United States exhibiting significantly positive changes (Fig. 3, right). This increase emerges by midcentury over Colorado, northern Utah, Nevada, Wyoming, and southern Idaho and Montana and expands and intensifies slightly by the end of the twenty-first century. The majority of this precipitation increase arrives as rain in mid-to-late winter [January–March (JFM)] and is accompanied by widespread decreases in snowfall (Fig. 4).
Fig. 3.
Precipitation response to anthropogenic forcing [(left) historical, (center) RCP8.5 midcentury, and (right) RCP8.5 end-of-century]. We show (top)–(bottom) the WY (October–August), October–December (OND), JFM, AMJ, July–September (JAS), and JJA seasonal means. Each panel shows the ensemble mean of each run’s 30-yr average time series standardized to the 1800-yr PI-control simulation mean and standard deviation. Insignificant change is denoted with hatching.
Fig. 4.
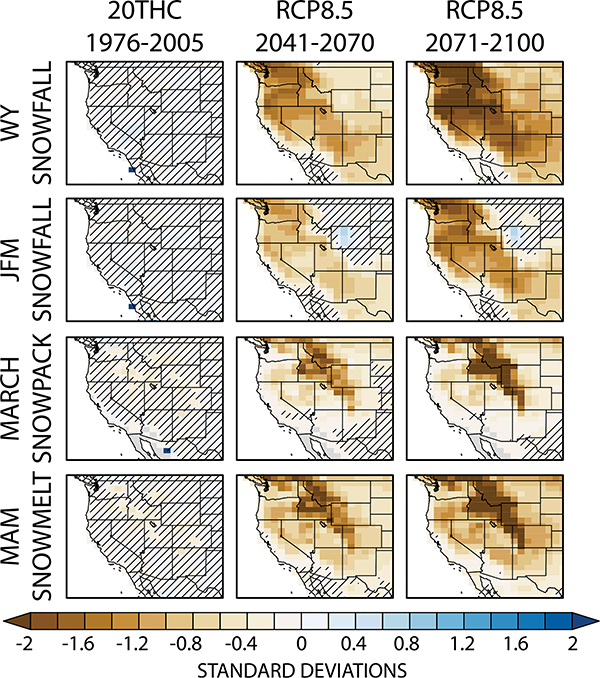
Snow response to anthropogenic forcing [(left) late-twentieth century, (center) RCP8.5 midcentury, and (right) RCP8.5 end of century]. We show changes in WY and JFM snowfall, March snowpack, and MAM snowmelt. Each panel shows the ensemble mean of each run’s 30-yr average time series standardized to the 1800-yr PI-control simulation mean and standard deviation. Insignificant change is denoted with hatching.
Seasonally, mid-to-late spring [April–June (AMJ)] sees significant decreases in precipitation for Arizona, California, Utah, and portions of Oregon, Washington, and Nevada (Fig. 3, right) and modest increases over the northeastern part of the domain, which includes Idaho, Wyoming, Montana, Colorado, and the Dakotas. Summer precipitation decreases significantly across the northern part of the domain.
Snow quantities generally show a much less complicated response, with consistent decreases by midcentury across the entire domain of snowfall, snowpack, and snowmelt (Fig. 4). A notable exception is the modest increase in high-altitude (>2300 m) wintertime (JFM) snowfall in Wyoming that persists through 2100. WY snowfall and spring snowmelt [March–May (MAM)] nevertheless ubiquitously decline, with 100% of the domain showing decreases by the end of the century, and 94% of the domain showing statistically significant decreases.
In summary, of the two supply components of summertime soil moisture, snowpack shows robust declines. Precipitation is more seasonally and spatially variable but generally increases in the annual and WY average, even in regions of robust soil moisture decreases. Consequently, the changes in supply do not account for the full picture of widespread western aridification seen in soil moisture and runoff.
b. Sources of hydroclimatic demand
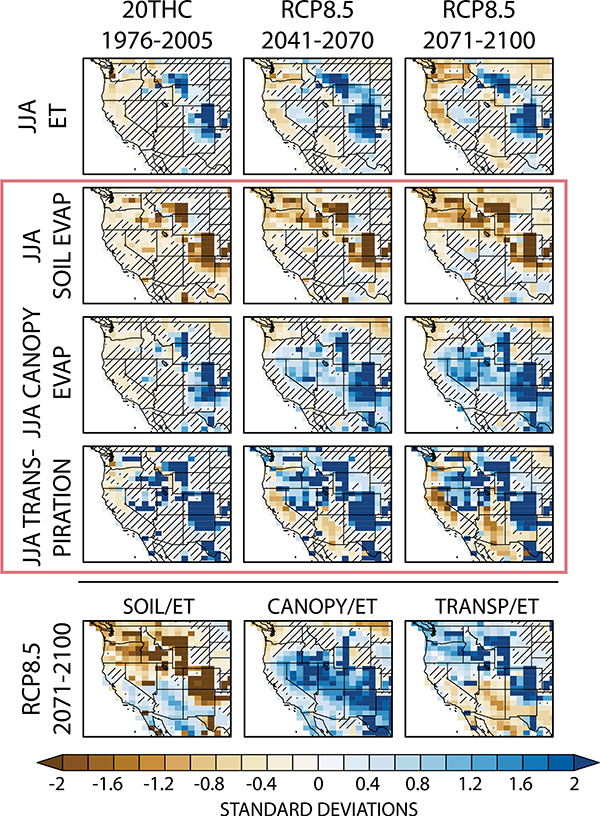
ET, which is limited by water availability, represents the actual water transferred from surface to atmosphere (Fig. 5). By the end of the twenty-first century, WY ET increases by a domain average of 1.1 standard deviations, with 74% of the American West exhibiting increases, and approximately 60% of the total domain having significant increases. Summertime (JJA) ET change exhibits a more complex spatial pattern than WY totals, with significant increases across the Montane West coupled with decreases in the northwestern coastal states. This spatial pattern of JJA ET response is established within the historical period and strengthens over time (Fig. 5).
Fig. 5.
Summertime (JJA) évapotranspiration (ET) response to anthropogenic forcing [(left) historical, (center) RCP8.5 midcentury, (right) RCP8.5 end of century]. For all panels, we show JJA seasonal means in total ET and its three components (outlined in the red box in the middle): soil evaporation, canopy evaporation, and plant transpiration. (bottom) Maps showing the end-of-century (RCP8.5, 2071–2100) change in the fraction of total JJA ET coming from each component: soil, canopy, and transpiration. Each panel shows the ensemble mean of each run’s 30-yr average time series standardized to the 1800-yr PI-control simulation mean and standard deviation. Insignificant change is denoted with hatching.
The mountainous region of increased summer ET is collocated with strong decreases in JJA soil evaporation (Fig. 5, second row) and increased canopy evaporation and transpiration (Fig. 5, third and fourth rows). Transpiration comprises the majority of JJA ET across the domain amounting to ~50% of summer ET in the preindustrial era and rising to ~54% by the late-twenty-first century. Canopy evaporation represents a small percentage of JJA ET: 5.5% in the preindustrial era and 6% by the end of the century. Soil evaporation decreases as a fraction of total ET, from ~44% of ET in the preindustrial to ~39% at the end of the century. Consequently, the majority of summer ET increases in the domain are due to increases in transpiration.
The spatial patterns of the late-twenty-first century changes in the ratio of summertime soil evaporation to ET, canopy evaporation to ET, and transpiration to ET are plotted in Fig. 5 (bottom). Domain-average decreases in the fraction of ET coming from soil evaporation are driven by decreases across the Montane West and Northwest Coast. While canopy evaporation represents a small fraction of total ET across the domain, its increase relative to its preindustrial variability is large with strong and statistically significant increases across the domain except in small regions in western Washington and the Dakotas. Perhaps most notably, changes in transpiration and soil evaporation are in opposite directions across the western domain, a phenomenon we address in section 6b.
5. Accounting for the drivers of aridification in the LENS
a. Regional hydroclimatic responses
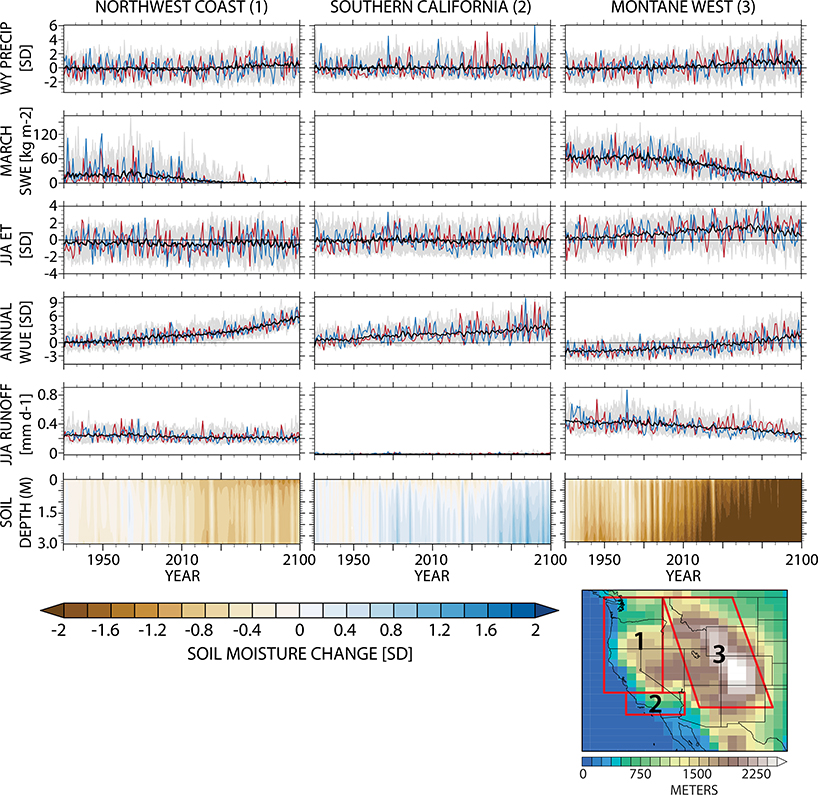
To account for the differential effects of supply and demand on JJA soil moisture across the domain, we partition the American West into our chosen three regions (Fig. 6, bottom-right map). Figure 6 shows the time series of supply (WY precipitation and March snowpack) and demand components (JJA ET), along with runoff and JJA soil moisture (as a function of depth) for the three area-weighted regional averages from 1920 to 2100.
Fig. 6.
Regional time series of change, 1920–2100. For each region—(left) the Northwest Coast, (center) Southern California, and (right) the Montane West—we show the LENS time series of WY (October-August) precipitation (standardized), March snowpack (kg m−2), JJA evapotranspiration (ET, standardized), annual water-use efficiency (WUE, standardized), and JJA runoff (mm day−1). (bottom) Contours of soil moisture as a function of depth and time. The five panels from top show the time series for each ensemble member (gray) and the ensemble mean (black). We also highlight the ensemble member with the largest Theil-Sen (T-S) linear trend estimate (red) and the smallest T-S estimate (blue). All series show change relative to the 1800-yr PI-control simulation. Inset map shows the regional domains and CESM CAM5 elevation (in m).
At WY scales, Northwest Coast precipitation varies about the preindustrial mean, with multidecadal periods of decreases and increases, ending with a modest ensemble mean increase (Fig. 6, left). March snowpack—a common measure of the total snow that has accumulated over the boreal cold-season and remains before spring melt (Mote et al. 2005; Mankin and Diffenbaugh 2015; Kapnick and Hall 2012)—begins to decline around 1980 contemporaneous with decreasing mean runoff and a shift toward consistently drier conditions in the soil column. Summer ET and runoff show no clear change over the period (Fig. 6, left).
Southern California is the only region among the three to exhibit summertime soil wetting: an increase in most layers of JJA soil moisture of up to ~1.1 standard deviations (Fig. 6, center) that is only significant in the bottom layer of the soil column (~3 m) at the end of the twenty-first century. Supply in Southern California in the CESM comes almost entirely from winter precipitation, as locally stored snowpack is negligible, and essentially remains unchanged over the twenty-first century (Fig. 4). Southern California summertime runoff is limited and not responsible for the projected increases in soil moisture.
The largest of the regions, the Montane West, spans vast portions of seven states and includes the Colorado, Rio Grande, and the Great Basin watersheds. It exhibits the starkest drop in JJA soil moisture and runoff, despite increases in WY precipitation (Fig. 6, right). Notable in all three regions is the striking increase in WUE from CO2, as vegetation can fix the same biomass while using less water.
b. Canopy water flux increases account for mean soil moisture declines
To better synthesize the regional results discussed above and identify the relative contributions of supply and demand to the mean state changes in summer soil moisture, we perform a simple soil moisture budget analysis. The soil moisture tendency at time t ΔSMt can be approximated as a function of fluxes in supply, demand, and loss, as well as changes in water storage from the previous time step (t − 1):
where R and S are rainfall and snowfall fluxes, Eg and Ec are evaporation from the soil and canopy, respectively, T is canopy transpiration, Q is the runoff flux, and ΔWS is the change in canopy, snow, and aquifer storage. To assess the supply and demand drivers of mean state soil moisture change in the LENS, we focus on the soil moisture change as a function of the first two terms in this budget, the WY supply (R and S) and demand (Eg, Ec, and T).
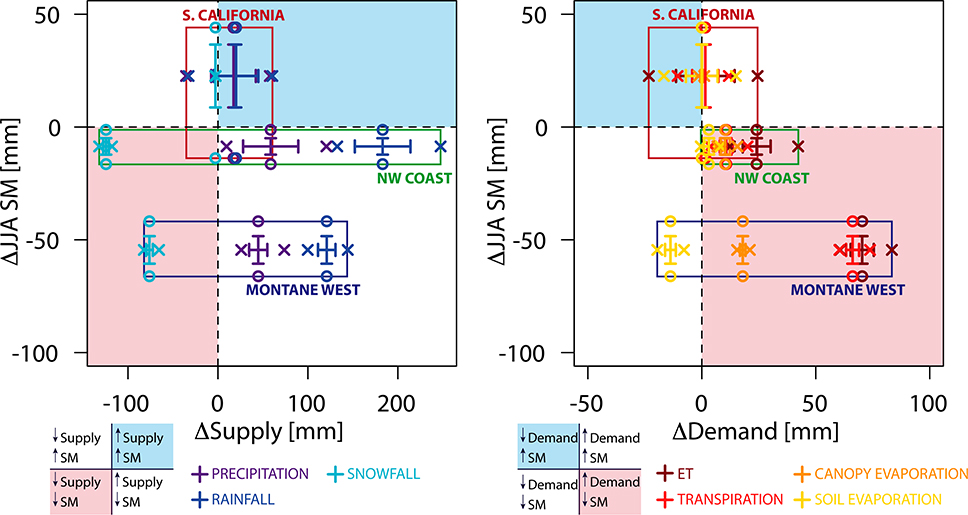
Figure 7 (left) shows that the Northwest Coast and Montane West regions experience full-column JJA soil moisture declines despite net increases in supply from increased WY precipitation. In contrast, Southern California exhibits a general wetting in both precipitation and soil moisture, although internal variability is such that some ensemble members have declines in both WY supply and in summer soil moisture (Fig. 7, left). Southern California has nearly no change in WY demand from ET, although its variability is of similar magnitude to its supply-side response. It is therefore the changes in supply that are responsible for the slight increase in soil moisture during the dry Southern California summer (Cheng et al. 2016).
Fig. 7.
Summertime soil moisture budget change. For each region (the Northwest Coast, Southern California, and the Montane West), we show (left) the net end-of-century change in WY precipitation and its components, WY rainfall and snowfall, against net full-column (0–2.86 m) JJA soil moisture change and (right) the same for WY ET and its components, WY transpiration, soil evaporation, and canopy evaporation. In each, the whiskers show 1.5 × IQR (the interquartile range) of the ensemble distribution while the × and ○ symbols show the full ensemble range for supply/demand and soil moisture, respectively. Inset panels show expected changes in soil moisture based on supply/demand quadrant placements.
The WY ET increases sufficiently in both the Northwest Coast and the Montane West to account for the soil moisture declines in those regions, with much less variability than that in the supply components (Fig. 7, right). In the Northwest Coast and the Montane West the majority of ET increases are due to increased canopy water fluxes—water evaporated from and transpired by leaves. This response counters what would be expected from increased surface resistance to ET due to stomatal conductance decreases, a feature we return to in the discussion section. It is clear from this analysis that modeled drying in the soil column for the Northwest Coast and Montane West is driven by a net increase in the water flux from vegetation.
c. Interannual variability in projected soil moisture
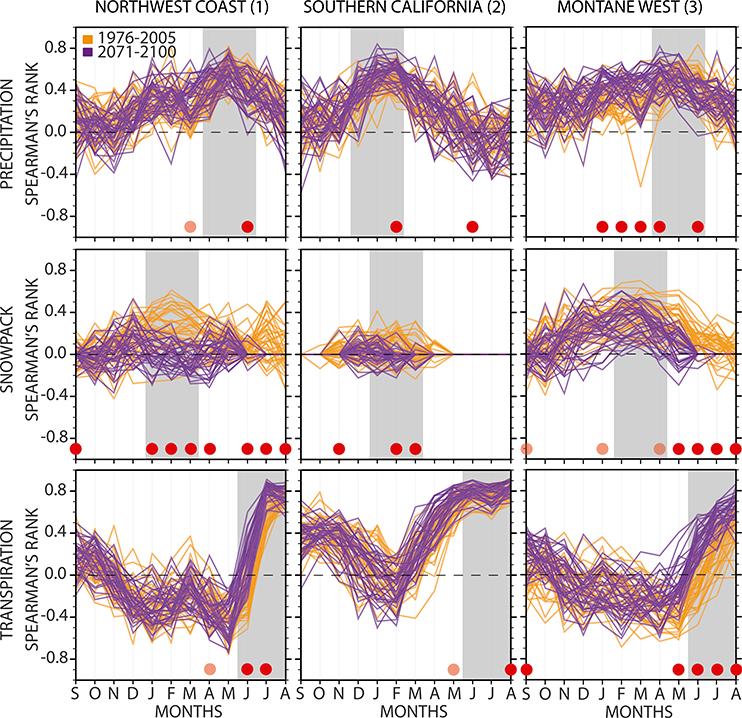
To better discern the physical mechanisms that cause the regional hydrological shifts under global warming, we analyze the drivers of interannual summer soil moisture variability and how those drivers change with forcing. To do this, we estimate the season of peak correlation between JJA full-column soil moisture and the preceding months’ precipitation, snowpack, and transpiration (all for standardized and detrended variables) in each of the three regions for the historical (1976–2005) and late-twenty-first century (2071–2100) periods (Fig. 8). Soil moisture has memory from month to month and the individual summer month contributions to the summer season average will vary with location, season, vegetation, soil type, and other factors. To capture these differences and assess whether seasonal soil moisture is driven by quantities from particular months, we calculate the correlation for each month (September to August) in each ensemble member; we use the Spearman’s rank nonparametric estimate to generate an ensemble distribution of correlations.
Fig. 8.
Monthly Spearman’s rank correlations of (top) precipitation, (middle) snowpack, and (bottom) transpiration with summer (JJA) 0–2.86-m soil moisture (except for Southern California, where we use the bottom layer, 2.86 m) for (left)–(right) the Northwest Coast, Southern California, and the Montane West. For the months preceding the JJA soil moisture (September–August), we show the ensemble range in correlations in two 30-yr time periods: historical (1976–2005, orange color) and the future (2071–2100, purple color). Months with statistically significant differences based on a bootstrapped K-S test in the ensemble distributions between historical and future are denoted with dark red dots (1% level) and light red dots (5% level) at the bottom of each panel. We also highlight in gray the months chosen for correlations presented in Fig. 9, which is based on the ensemble mean historical peak correlation.
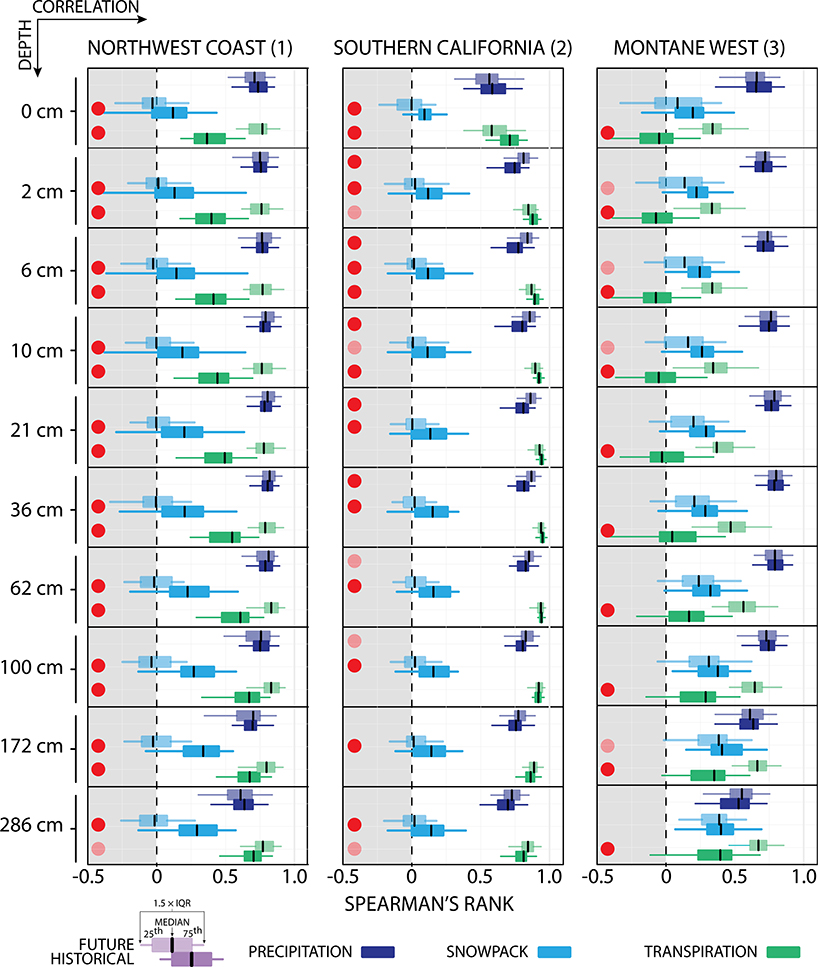
For all three regions, the pattern of correlations between monthly precipitation and full-column JJA soil moisture is similar for the historical and future periods (Fig. 8, top), suggesting that the influence of precipitation on summertime soil moisture does not change appreciably with forcing. Summer soil moisture is best correlated with prior spring, winter, and spring precipitation in the Northwest Coast, Southern California, and Montane West, respectively. In contrast, correlations between JJA soil moisture and snowpack in the Northwest Coast and Montane West shift to earlier in the year and weaken over time, consistent with a shorter winter season with less snow accumulation (Fig. 8, middle). In all regions, the correlations among monthly transpiration and JJA soil moisture follow the same profiles: high winter transpiration is associated with lower summer soil moisture, but high summer transpiration is correlated with high summer soil moisture. In the Northwest Coast and the Montane West, a positive summer correlation emerges earlier and with greater magnitudes in the future, pointing to a strengthening of transpiration as a direct indicator of JJA soil moisture.
We use the results from Fig. 8 to identify, for each variable, the seasons in the historical period that exert the greatest impact on JJA soil moisture as suggested by the peak of the seasonal correlation curves. These peak seasons are then used to quantify how the ensemble distributions of correlations between the historical and future periods change as a function of soil depth.
Figure 9 shows these results for the three regions, highlighting how the influence of each variable on summer soil moisture varies with depth and time, and thus which variables are associated with interannual variations in future summer soil moisture within each soil layer. While there is a strong correlation between precipitation and JJA soil moisture at all levels in the Northwest Coast and the Montane West, this influence does not change between the historical and future climates (Fig. 9, left and right). In contrast, the positive soil moisture-transpiration correlation increases significantly in both regions by the end of the twenty-first century based on a bootstrapped K-S test at each soil level (Fig. 9, left and right).
Fig. 9.
Spearman’s rank correlation between JJA soil moisture as a function of soil level, variable, and time period (historical 1975–2005, future 2071–2100) for (left) the Northwest Coast, (center) Southern California, and (right) the Montane West. The standard box plots show the ensemble range in 30-yr correlations of area-weighted average detrended standardized time series in the selected variable with JJA soil moisture. The seasonal average used is based on the Fig. 8, which highlighted peak seasonal correlations: for the Northwest Coast and the Montane West, AMJ precipitation; for Southern California, DJF precipitation; also, for the Northwest Coast and Southern California, JFM snowpack, for the Montane West, February–April (FMA) snowpack. All regions show JJA transpiration. Dark red dots show variables with statistically significant correlation distributions at the 1% level based on a bootstrapped K-S test; light red dots show significance at the 5% level.
In the historical period over the Northwest Coast and the Montane West, snowpack represents an important control on deep soil moisture, indicated by the increasing correlation with depth in those regions (Fig. 9, left and right). For the Northwest Coast, the snow decline between the historical and future periods eliminates the relationship between JFM snowpack and JJA soil moisture. By the end of the twenty-first century, the Northwest Coast has a set of interannual correlations for precipitation, snowpack, and transpiration with JJA soil moisture that looks very similar to those for the considerably drier Southern California region.
In the Montane West, as in the Northwest Coast, the correlation of JJA soil moisture with JJA transpiration exhibits the largest change among the variables (Fig. 9, right). In the historical period, Montane West transpiration tends to be neutrally or inversely correlated with the soil moisture layers in the first half meter of the soil column (albeit insignificantly so). This implies that plant transpiration either was not reliant on soil moisture in those layers, and/or was energy limited instead of moisture limited due to snow cover and cooler temperatures. With increased greenhouse gas forcing, however, the correlation between JJA soil moisture and JJA transpiration becomes positive at all layers in the Montane West, suggesting that transpiration becomes more limited by JJA soil moisture at all depths due to drier soils.
6. Discussion
a. The drivers of increased ET over the American West
We attribute the WY ET increases that occur in the Northwest Coast and the Montane West to increased canopy water fluxes (Fig. 7). In CLM4, bulk canopy water fluxes (Ev) are a function of vapor pressure deficit (VPD) between the canopy and the surrounding air :
where ρatm is the atmospheric density of the canopy air, qs is the specific humidity of the atmosphere, is saturation specific humidity at the canopy temperature, and rtotal (sm−1) is the sum of leaf boundary layer and stomatal resistances (Oleson et al. 2010). In all runs of the LENS, canopy-based VPD increases across the domain in all months with a domain-average ensemble mean increase of nearly five standard deviations, consequently increasing the canopy water flux.
In addition to VPD, the canopy water flux is also governed by the total resistance rtotal that is a function of water availability at the land surface, aridity of the atmosphere, and the physiological behavior of plants. In CLM4, stomatal conductance gs is modeled according to the Ball–Berry function as the inverse of stomatal resistance, which uses canopy relative humidity hr, CO2 concentrations C, and the photosynthetic rate A to estimate plant–atmosphere gas exchange (with PFT-based parameters g0 and g1) (Oleson et al. 2010):
Based on the biophysical processes encoded in this relationship, stomatal conductance decreases due to reductions in relative humidity and increases in CO2. In the Northwest Coast, summer relative humidity declines by ~10%. In the Montane West the declines are larger, on the order of ~18%. Such decreased stomatal conductance causes increases in surface resistance to transpiration and consequently increases in soil water. Despite this straightforward cause-and-effect chain, however, expected soil moisture increases do not occur in the LENS projections over vast swaths of the American West.
Our soil moisture budget analysis in Fig. 7 shows that for the two regions exhibiting mean state changes toward drier summer seasons with CO2 forcing—the Northwest Coast and the Montane West—aridification is driven by increased vegetation water fluxes from canopy evaporation and transpiration (Fig. 7). Another feature that makes this response notable is that CESM precipitation increases over the American West are greater than that from the average CMIP5 model (Ault et al. 2016; Collins et al. 2013) (although at the global scale, the CESM precipitation response is near the mean of the CMIP5 distribution; Pendergrass et al. 2015). Thus, this aridification occurs in both regions in spite of increased WUE of surface vegetation (Fig. 6, fourth row), increased WY precipitation (Figs. 4 and 6), and stomatal closure from high CO2 and low relative humidity.
b. Simulated vegetation as an important driver of aridification in the American West
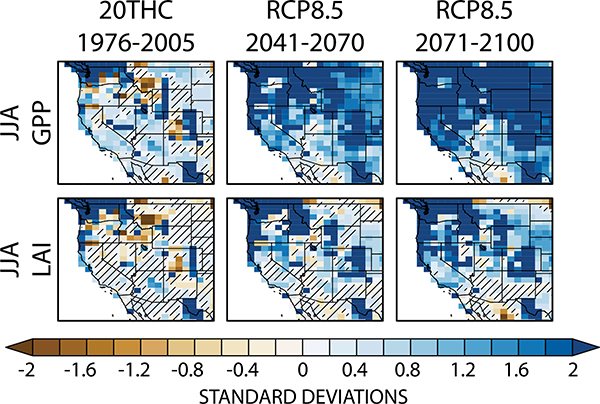
Increased concentrations of greenhouse gas significantly intensify simulated summertime photosynthetic activity across the American West, reflected in primary production (Fig. 10, top). This pattern of increasing GPP emerges within the historical period, nearly saturates the domain by the mid-twenty-first century, and covers it completely by the late-twenty-first century, suggesting a strong effect of CO2 fertilization in CESM. Accompanying the increased photosynthesis in LENS are widespread increases in leaf area index (LAI). The spatial patterns in the late-twentieth and early-twenty-first centuries are more complex (Fig. 10, bottom), however, and are possibly a function of the PFT assemblages within different grid cells in the domain and the complex environmental determinants of leaf areas (Mahowald et al. 2016). Nonetheless, by the end of the twenty-first century, LAI significantly increases across ~66% of the American West, in some places—such as the Northwest Coast and into Canada—by a striking six standard deviations or more (Fig. 10, bottom).
Fig. 10.
Vegetation response to anthropogenic forcing [(left) historical, (center) RCP8.5 midcentury, (right) RCP8.5 end of century]. We show changes in JJA (top) seasonal mean photosynthesis [gross primary productivity (GPP)] and (bottom) leaf area index (LAI). Each panel shows the ensemble mean of each run’s 30-yr average time series standardized to the 1800-yr PI-control simulation mean and standard deviation. Insignificant change is denoted with hatches.
This large LAI response is consistent with many of the other models participating in the CMIP5 that generally simulate large increases in LAI globally (Mahowald et al. 2016). However, whether such a large CO2-induced LAI response is reasonable is unclear as it is difficult to validate a future LAI response against observations. Instead we can place the CESM-simulated response within the larger CMIP5 ensemble. Like most CMIP5 models, CESM overestimates observed mid-latitude LAI but shares a high spatial correlation with satellite-derived observations (Mahowald et al. 2016). In terms of the response to forcing, the CESM has a global CO2 fertilization effect that is low relative to other models, in part because it incorporates the effect of nitrogen limitations (Arora et al. 2013), but has a mid-latitude LAI response magnitude that ranks in the upper tercile of CMIP5 models. LAI increases under forcing nevertheless are not simply due to CO2 fertilization effects—precipitation and radiative effects are also crucial (Mahowald et al. 2016)—making it difficult to create observational constraints on model projections of LAI.
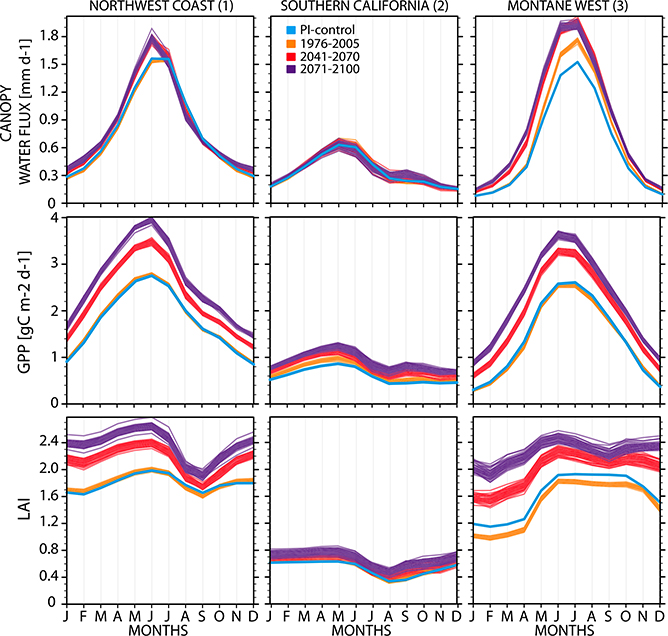
Taken together, GPP and LAI give a clear picture of large-scale prognostic increases in carbon assimilation by vegetation in the Northwest Coast and Montane West in a CO2-enriched climate. This response could be a function of many factors beyond CO2 fertilization (Friedlingstein et al. 2006), such as the model’s carbon allocation scheme, indirect radiative effects from warmer and wetter winters, surface albedo feedbacks, or some combination thereof. In absolute terms, both photosynthesis and leaf areas increase in all months most markedly in the Northwest Coast and the Montane West—the two regions with robust soil moisture declines (Fig. 11). In the Montane West, which exhibits the starkest drying (Fig. 9), the end-of-century LAI annual minimum (February) exceeds its historical maximum (June) (Fig. 11). This is nearly the case for the Northwest Coast as well. For both of the drying regions, canopy water fluxes peak a month earlier (June) by midcentury and increase by ~16% following the increase in spring photosynthesis. GPP curves also show considerable change with forcing, likely a function of factors beyond CO2 fertilization, such as reduced snowpack and warmer winters (Fig. 11, left).
Fig. 11.
Seasonal cycles (January-December) of (top) net canopy water flux (sum of canopy evaporation and transpiration), (middle) gross primary productivity (GPP), and (bottom) leaf area index (LAI) for each region: (left) Northwest Coast, (center) Southern California, and (right) the Montane West. For each panel, four seasonal climatologies are shown for all ensemble members, that for the PI-control in blue, the historical period (1976–2005) in orange, mid-twenty-first century (2041–70) in red, and the end of the twenty-first century (2071–2100) in purple.
A notable departure is Southern California (Fig. 11, center), which has little to no change in the canopy water flux, and only modest increases in GPP and LAI relative to the stark increases in the Northwest Coast and Montane West. The Southern California case appears to follow the expected response of vegetation to high CO2: surface resistance increases, coupled with modest wintertime precipitation increases, generate a modest increase in deep soil water availability, with little to no changes in the minimal summertime runoff.
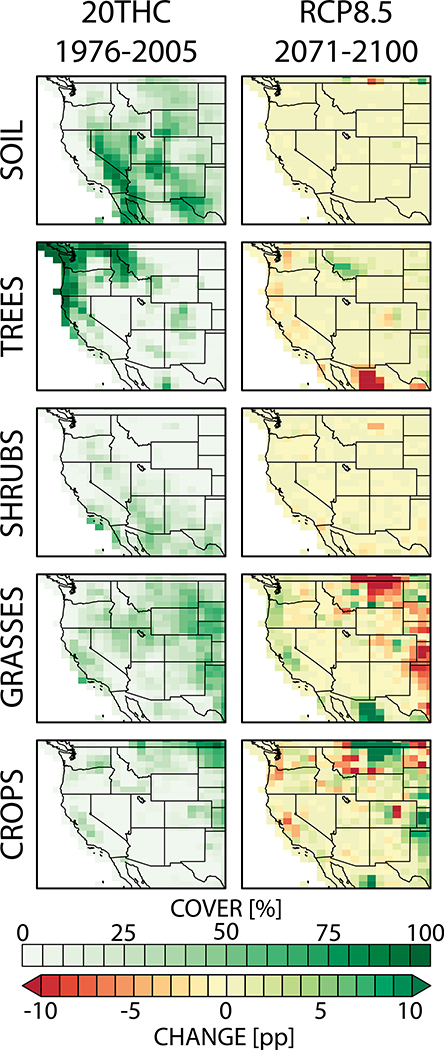
But in the Northwest Coast and Montane West, a knock-on (i.e., secondary and unanticipated) effect of increased CO2 is a positive forcing on transpiration caused by increased leaf area, which outweighs the positive physiological forcing due to rising CO2 and lower relative humidity, resulting in net increases in canopy water fluxes and a state change toward drier soils and reduced runoff. This vegetation-induced soil drying is not due to large-scale biogeographical changes in the grid cell distributions of PFTs. There are, however, important land cover differences between the preindustrial control and the twentieth- and twenty-first-century simulations. This effect can be seen in the Montane West, where the LAI annual cycle shows a lower mean than the preindustrial control due to higher grid cell fractions of forest cover and grasses pre-1850. Over the twentieth and twenty-first centuries, however, the grid cell PFT assemblages remain largely unchanged except for grassland–crop transitions in the far eastern portion of the domain (Fig. 12).
Fig. 12.
Prescribed land cover changes in the LENS. We aggregate the 15 plant functional types in CLM into four vegetation classes plus soil cover (from top to bottom). The late-twentieth-century land cover grid cell percentages in each class are shown at left and the end-of-century change in that grid cell percentage, as a percentage point change (pp), at right. Note that there is no biogeography in this set of simulations; all PFTs and their changes are prescribed as boundary conditions.
Thus, the extent to which there is an association of a “greener” world with one that is “wetter,” we have both drying in the soil column that is consistent with PDSI (albeit for different reasons that we discuss below), coupled with increased WUE and larger leaf areas. This picture of greening and drying is also consistent with the inverse relationship among transpiration and soil evaporation across the western domain (Fig. 5). As leaf areas increase, exposed soil decreases, reducing the water flux directly from the ground surface. This duality could serve to reconcile some of the divergent indications of surface water changes in model projections (Roderick et al. 2015; Milly and Dunne 2016; Swann et al. 2016; Berg et al. 2016; Cheng et al. 2016; Ault et al. 2016; Cook et al. 2015), but also raises some important questions about the relevance of this response to the real world and thus future drought risks over the American West.
c. Structural uncertainties in future soil moisture change
Based on the results presented, model representations of soil–plant–water coupling play a large role in driving projected changes in soil moisture, and thus drought risk, across the American West. In CLM4 (and CLM4.5), plant water stress is parameterized by βt (∈[0, 1]), which is a simple linear function of soil matric potential that is estimated for each grid cell based on PFT-based root distributions (Oleson et al. 2010). In this function, a value of 1 corresponds to no plant water stress, while 0 represents the wilting point. In CLM4, βt directly down-regulates photosynthesis by scaling photosynthetic activity and respiration. It also determines the distribution of transpiration over the roots in the soil column. [In CLM4.5, the parameter also acts to reduce minimal stomatal conductance in the Ball–Berry model, analogous to the way isohydric plant species endeavor to maintain constant leaf water potentials in the face of decreased soil water potentials (Oleson et al. 2013).] In CLM4, βt therefore only indirectly influences transpiration (rather than directly by altering stomatal conductance) and thus only superficially influences the canopy water flux and additional vegetation growth that accounts for soil drying in the Northwest Coast and the Montane West. An effort to more realistically treat plant hydraulics and variable plant strategies is being undertaken for CLM5. That implementation will drop the βt parameterization scheme and use a water transport module through the soil–plant–atmosphere continuum to include a water stress function that directly influences the calculation of stomatal conductance, photosynthesis, and respiration.
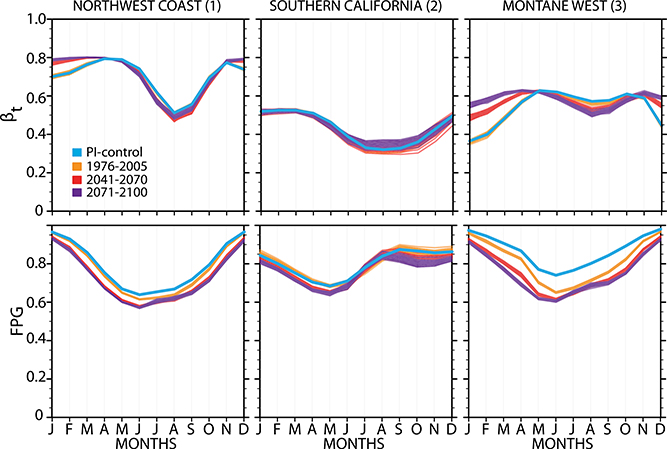
Figure 13 shows the mean annual cycles of βt and how they are projected to change. Projections indicate a decrease in plant water stress in the winter and spring wet season and slight increases in water stress in summer with forcing in the Montane West (Figs. 3 and 13). A coarse representation of plant hydraulic stress such as βt has significant implications for the carbon and water balance at the land surface, and yet βt has little physical basis and observational constraints (Kala et al. 2016). Furthermore, it does not capture the highly variable strategies plants pursue in conditions of drought (e.g., McDowell et al. 2008; Fatichi et al. 2015; Konings et al. 2017). Furthermore, real-world forests in the American West suffer legacy effects from seasonal-scale droughts, diminishing ecosystem-scale carbon (Anderegg et al. 2015), forest health, and resilience, making trees more susceptible to fire, pests, and wind throw (Williams et al. 2013; van der Molen et al. 2011). A more realistic treatment of plant hydraulic stress, drought-related mortality, and succession dynamics would certainly affect the picture of ecosystem health presented in Figs. 10 and 11 and, by extension, the net changes in canopy water fluxes culpable in soil drying.
Fig. 13.
Seasonal cycle of (top) the water stress parameter βt and (bottom) the GPP nitrogen limitation down-regulation parameter FPG for PI-control (blue), 1976–2005 (orange). 2041–2070 (red), and 2071–2100 (purple).
Nitrogen nutrient limitations (parameterized by a variable termed the “fraction of potential GPP” or FPG in CLM4; Fig. 13, bottom) would also affect the efficacy of CO2 fertilization. In the current version of CESM, FPG downregulates carbon assimilation after stomatal conductance has been calculated (Lee et al. 2013)—plants transpire as if nitrogen were free. Like βt, a more realistic implementation would influence net carbon uptake, and by extension the future increases in LAI and attendant canopy fluxes.
Such separation between biogeochemical and biogeophysical processes, as well as the numerical implementations of subgrid parameterizations, can generate errors that propagate through the ESM. When such implementations are coupled with other known structural sources of uncertainty that are not yet implemented within the model, it suggests that land surface model improvements could either temper or intensify the drying projected to occur over swaths of the American West. Specific examples of such unimplemented processes include carbon allocation and root dynamics, the lack of leaf mass changes (Poorter et al. 2009), hillslope hydrology (Clark et al. 2015; Weiler and Beven 2015), soil–water partitioning (Good et al. 2015), variable soil depths (Oleson et al. 2010; Clark et al. 2015), and bedrock permeability (Fan et al. 2015), all of which are crucial for simulating soil moisture in the topographically complex Montane West.
The key question about the inclusion of these unresolved processes is not whether they improve the representation of the real-world physics that will govern the surface moisture response to CO2. The question instead is whether their inclusion would alter the direction of surface moisture change we see in this set of simulations. We hypothesize that for the Montane West at least, where the most robust drying and damping of runoff occurs, this direction would not change.
More generally, open questions remain about interspecies differences in how plants respond to increased CO2 in the face of enhanced aridity. The answers depend on ecological processes such as plant mortality, disturbance recovery, plant biogeography, and species interactions not represented in the models. Consequently, we consider it premature to place confidence in the model projections of combined soil moisture drying and vegetation greening.
d. Diminishing snowpack as a driver of aridification in the American West
Although vegetation clearly dominates the projected JJA soil moisture declines, this culpability is also shared with the important effects of decreased winter snow accumulation. The timing of the shift toward large snowpack (SWE) declines around 1980 in both the Northwest Coast and the Montane West is emblematic of snow’s importance as it coincides with the state change toward drier soils for those regions (Fig. 6). Thus the timing of the shift from a snow to a rain regime serves as an independent driver of soil moisture declines in those regions. Projected snow reductions also suggest a crucial interaction with vegetation to further induce soil moisture drying: with diminished snowpack and snowfall from warming (Figs. 4 and 7), seasonal phenological cycles initiate earlier in the year (Fig. 11), promoting additional vegetation growth (Fig. 10), which itself is bolstered by CO2 forcing and increased winter–spring rains that in turn reinforce the soil drying first primed by the snowpack declines. Our analysis suggests, therefore, that snowpack declines have a dual role in causing summer soil moisture declines: directly through diminishing the recharge to deep soils, and indirectly through enabling early-season vegetation growth, creating a state shift toward intensified JJA aridity across the American West.
e. Reconciling measures of drought under forcing
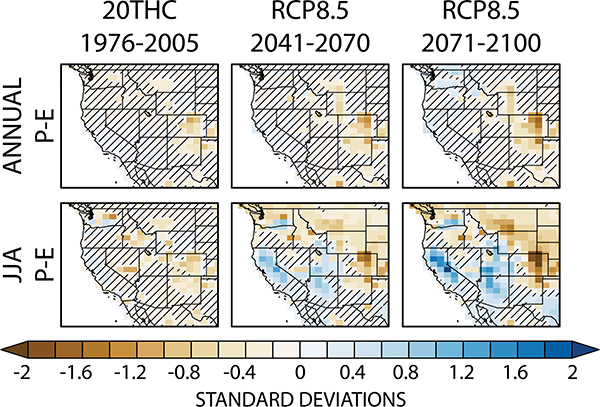
Soil moisture projections in the American West from CESM resemble projections of PDSI (e.g., Cook et al. 2015; Ault et al. 2016; Coats and Mankin 2016) more than projections of P – E (Figs. 1 and 14). In contrast to soil moisture, P – E exhibits a far more attenuated or even a wetting response. This is in part because P – E and soil moisture are measuring different quantities in the climate system, and because ET can decrease on seasonal time scales due to soil moisture limitations, such that seasonal P – E may remain static or rise despite soil moisture decreases (Fig. 14, bottom). Such supply limits to seasonal-scale ET can allow an increase in seasonal-scale P – E due to insufficient water to evapotranspire. This response can be seen in the end-of-century summer along the northern coast of California, where both JJA rainfall and ET decline, JJA P – E increases, and there are robust decreases in both JJA soil moisture and runoff (Figs. 3, 4, 14 and 1, 2). Given these considerations and the importance of seasonal-scale drought, P – E is reasonably characterized as “an incomplete metric” of drying (Greve and Seneviratne 2015), contrary to recent arguments that have favored its use (e.g., Swann et al. 2016).
Fig. 14.
Precipitation minus evapotranspiration (P – E): (top) at the annual scale and (bottom) for summer (JJA) [(left) historical, (center) RCP8.5 midcentury, (right) RCP8.5 end of century]. Each panel shows the ensemble mean of each run’s 30-yr average time series standardized to the 1800-yr PI-control simulation mean and standard deviation. Insignificant change is denoted with hatching.
Other recent results suggest that projected PDSI only reflects surface-layer soil moisture from climate models and does not reflect the moisture response from the deeper soils more critical to vegetation (Cheng et al. 2016; Berg et al. 2016). In contrast to these arguments, however, our results show a spatially consistent and coherent pattern of summertime soil moisture declines with depth across the American West in the CESM. It suggests that, in this region of this model, PDSI projections cannot be dismissed as simply characterizing surface moisture, and that more work is necessary to identify the sources of consistency and divergence among ESM soil moisture and offline aridity metrics like PDSI.
Collectively, our results highlight a few key points about divergent estimates of future drought. First, it is clear that different characterizations of future surface water availability across much of the American West can give divergent answers, even within the same ESM. Consider, for example, the collocation of “greening” in the form of high LAIs (Fig. 10), increased WUE (Fig. 6), and modest increases in JJA P – E (Fig. 14) coupled with “drying” in the form of decreased summer soil moisture (Fig. 1), PDSI, and runoff (Fig. 2). Second, while these divergences are in part a function of the fact that these measures are integrating different aspects of hydroclimate, there are large sources of structural uncertainties in each. For example, the shared responses between soil moisture and PDSI are both uncertain for different reasons—PDSI potentially overstates the role of thermodynamics in drying the land surface, while soil moisture, runoff, and P – E in CESM are dependent on poorly constrained assumptions about the transient response of surface ecology and hydrological processes. Third, these structural uncertainties suggest that that no one measure, whether it is a PET-based metric like PDSI, a diagnostic one like P – E, or a prognostic one like soil moisture, is necessarily any more reliable or certain as a measure characterizing aridity changes from CO2 forcing. Instead, measures characterizing hydroclimatic changes should be selected based on the question at hand, as no single measure can sufficiently characterize stationary hydroclimate or its change under forcing. There is considerable work to be done, and in particular a significant imperative to focus on soil moisture, as the extant uncertainties we identify in soil–vegetation interactions likely influence the effect of soil moisture on other factors, such as the partitioning of turbulent fluxes at the land surface, and thus the risk estimates of heat waves and hydroclimatic extremes (Herold et al. 2016; Skinner et al. 2017).
7. Conclusions
We have leveraged a large ensemble (35 fully coupled global simulations) of the NCAR CESM1 in a plausible high-emissions scenario (RCP8.5) to examine the terrestrial hydrological response to anthropogenic forcing in the American West. In particular, we focus on the depth-dependent pattern and drivers of soil moisture change, as well as their subregional heterogeneities. The large ensemble allows us to ensure the transiently emerging signals and drivers we identify are not spuriously induced by CESM’s representation of climate variability.
We report four findings:
There is a robust mean-state summertime drying signal reflected at all hydrologically active levels in the soil column by the end of the twenty-first century, in particular in the Northwest Coast and Montane West. The soil moisture response is more consistent with offline measures like PDSI than with diagnostic measures like P – E, despite the fact that soil moisture is endogenous to the model and is impacted by surface resistance changes due to physiological forcing.
The seasonal soil drying in these two regions is, in part, directly induced by snow declines from warming, despite WY precipitation increases. Warmer WY temperatures diminish both the fraction of cold-season precipitation falling as snow, as well as the net winter snowpack that accumulates, reducing spring/summer runoff and soil recharge from snowmelt.
These snow declines allow surface vegetation to begin photosynthesis and draw on soil moisture earlier in the calendar year, with domain-average February GPP increasing by ~76%.
When coupled with direct and indirect CO2 effects, net carbon assimilation by the land surface increases, resulting in greater leaf areas that increase canopy water fluxes, despite increased stomatal resistance from high CO2.
Together, these results suggest that in the American West, additional vegetation growth, brought on by a mix of radiative forcing (reduced snowpack, warmer temperatures) and CO2 fertilization, dries out the soil column and reduces summer water availability, despite physiological forcing of the land surface.
Because we find a strong dependence of the CESM soil moisture response on model representation of future vegetation, our results have large implications for interpreting projections of future water availability and drought in the American West. In particular, summer runoff declines on the order of 15% and 40% occur in the Northwest Coast and the Montane West, and represent large changes in blue water availability that would have considerable implications for water management in the American West. And yet at the same time that seasonal aridity increases, model vegetation does not appear to exhibit water stress, suggesting that there is sufficient soil moisture for vegetation growth. It is noteworthy, however, that despite this healthy-looking vegetation, the mean changes in soil moisture we quantify are large departures from unforced internal variability, and occur in an already dry and often water-stressed regime. Furthermore, this soil drying occurs in spite of net increases in precipitation. Despite the interpretations of these CESM responses taken at face value, it is also clear that the βt parameter governing plant hydraulics is not a meaningful indicator of the real-world response of plants to water stress for the reasons we discuss above. Thus the future real-world vegetation may not be as healthy as the model suggests.
The diagnosis we undertake here, while model and region specific, can be applied to other models and regions to identify whether the curious response in the American West is unique. However, because of the numerous structural uncertainties in representing Earth system processes that shape future profiles of turbulent fluxes, runoff, and soil moisture under anthropogenic forcing, other models likely face similar challenges in their representations of surface ecology and thus their aridity responses. This renders the scientific community in a learning state with regards to estimating ecological influences on future hydroclimate in ESMs. The efforts of initiatives like the Land Surface, Snow and Soil Moisture Model Intercomparison Project (LS3MIP; van den Hurk et al. 2016), phase 4 of the Coupled Climate Carbon Cycle Model Intercomparison Project (C4MIP; Jones et al. 2016), and the Land-Use Model Intercomparison Project (LUMIP; Lawrence et al. 2016), all being implemented as part of CMIP6, will help position drought researchers to parse the influence of model choices on future aridity.
Our results indicate that implementations of biophysical–biogeochemical coupling in the soil–plant–atmosphere continuum matter greatly for mean state changes in aridity over the American West. Such a soil–vegetation response, if incorrect, would have implications for interpretations of modeled runoff and soil moisture. Furthermore, it would likely have implications for turbulent fluxes, water recycling, and hydroclimatic extremes, not just in the American West but also globally. If instead such a soil-vegetation response proves correct, because increased WY ET implies less water for runoff, it portends an increased competition for scarce water resources in the American West between ecosystems and people for use in irrigation, hydropower, and water supply.
Acknowledgments.
We acknowledge the CESM1 (CAM5) Large Ensemble Community Project generated by the National Center for Atmospheric Research (NCAR) and the computing resources provided by the Division of Ocean and Climate Physics at the Lamont-Doherty Earth Observatory of Columbia University. Our work was supported by the Earth Institute (to J.S.M) and the Center for Climate and Life (to A.P.W.), both of Columbia University, the NASA Modeling, Analysis, and Prediction Program (MAPPS; to B.I.C.) and Grants AGS-1243204 and AGS-1401400 from the U.S. National Science Foundation (to J.E.S. and R.S.). Lamont-Doherty Earth Observatory contribution number 8141.
Footnotes
Denotes content that is immediately available upon publication as open access.
Contributor Information
Justin S. Mankin, Lamont-Doherty Earth Observatory, Columbia University, Palisades, and NASA Goddard Institute for Space Studies, New York, New York, and Department of Geography, Dartmouth College, Hanover, New Hampshire
Jason E. Smerdon, Lamont-Doherty Earth Observatory, Columbia University, Palisades, New York
Benjamin I. Cook, NASA Goddard Institute for Space Studies, New York, and Lamont-Doherty Earth Observatory, Columbia University, Palisades, New York
A. Park Williams, Lamont-Doherty Earth Observatory, Columbia University, Palisades, New York.
Richard Seager, Lamont-Doherty Earth Observatory, Columbia University, Palisades, New York.
REFERENCES
- Allen R, Pereira L, Raes D, and Smith M, 1998: Crop evapotranspiration—Guidelines for computing crop water requirements. FAO Irrigation and Drainage Paper 56, 300 pp., http://www.fao.org/docrep/X0490E/X0490E00.htm. [Google Scholar]
- Anderegg WRL, and Coauthors, 2015: Pervasive drought legacies in forest ecosystems and their implications for carbon cycle models. Science, 349, 528–532, doi: 10.1126/science.aab1833. [DOI] [PubMed] [Google Scholar]
- Arora VK, and Coauthors, 2013: Carbon-concentration and carbon-climate feedbacks in CMIP5 Earth system models. J. Climate, 26, 5289–5314, doi: 10.1175/JCLI-D-12-00494.1. [DOI] [Google Scholar]
- Ault TR, Cole JE, Overpeck JT, Pederson GT, and Meko DM, 2014: Assessing the risk of persistent drought using climate model simulations and paleoclimate data. J. Climate, 27, 7529–7549, doi: 10.1175/JCLI-D-12-00282.1. [DOI] [Google Scholar]
- ____, Mankin JS, Cook BI, and Smerdon JE, 2016: Relative impacts of mitigation, temperature, and precipitation on 21st-century megadrought risk in the American Southwest. Sci. Adv, 2, e1600873, doi: 10.1126/sciadv.1600873. [DOI] [PMC free article] [PubMed] [Google Scholar]
- Ball JT, Woodrow IE, and Berry JA, 1987: A model predicting stomatal conductance and its contribution to the control of photosynthesis under different environmental conditions Progress in Photosynthesis Research, Biggins J, Ed., Springer, 221–224, 10.1007/978-94-017-0519-6_48. [DOI] [Google Scholar]
- Berg A, Sheffield J, and Milly PCD, 2016: Divergent surface and total soil moisture projections under global warming. Geophys. Res. Lett, 44, 236–244. doi: 10.1002/2016GL071921. [DOI] [Google Scholar]
- Betts RA, and Coauthors, 2007: Projected increase in continental runoff due to plant responses to increasing carbon dioxide. Nature, 448, 1037–1041, doi: 10.1038/nature06045. [DOI] [PubMed] [Google Scholar]
- Cao L, Bala G, Caldeira K, Nemani R, and Ban-Weiss G, 2010: Importance of carbon dioxide physiological forcing to future climate change. Proc. Natl. Acad. Sci. USA, 107, 9513–9518, doi: 10.1073/pnas.0913000107. [DOI] [PMC free article] [PubMed] [Google Scholar]
- Cheng L, and Hoerling MP, AghaKouchak A, Livneh B, Quan X-W, and Eischeid J, 2016: How has human-induced climate change affected California drought risk? J. Climate, 29, 111–120, doi: 10.1175/JCLI-D-15-0260.1. [DOI] [Google Scholar]
- Clark MP, and Coauthors, 2015: Improving the representation of hydrologic processes in Earth system models. Water Resour. Res, 51, 5929–5956, doi: 10.1002/2015WR017096. [DOI] [Google Scholar]
- Coats S, and Mankin JS, 2016: The challenge of accurately quantifying future megadrought risk in the American Southwest. Geophys. Res. Lett, 43, 9225–9233, doi: 10.1002/2016GL070445. [DOI] [PMC free article] [PubMed] [Google Scholar]
- Collatz GJ, Ball JT, Grivet C, and Berry JA, 1991: Physiological and environmental regulation of stomatal conductance, photosynthesis and transpiration: A model that includes a laminar boundary layer. Agric. For. Meteor, 54, 107–136, doi: 10.1016/0168-1923(91)90002-8. [DOI] [Google Scholar]
- Collins M, and Coauthors, 2013: Long-term climate change: Projections, commitments, and irreversibility Climate Change 2013: The Physical Science Basis, Stocker TF et al. , Eds., Cambridge University Press, 1029–1136. [Google Scholar]
- Cook BI, Smerdon JE, Seager R, and Coats S, 2014: Global warming and 21st century drying. Climate Dyn, 43,2607–2627, doi: 10.1007/s00382-014-2075-y. [DOI] [Google Scholar]
- ________, Ault TR, and Smerdon JE, 2015: Unprecedented 21st century drought risk in the American Southwest and Central Plains. Sci. Adv, 1, e1400082, doi: 10.1126/sciadv.1400082. [DOI] [PMC free article] [PubMed] [Google Scholar]
- Cook ER, Woodhouse CA, Eakin M, Meko DM, and Stahle DW, 2004: Long-term aridity changes in the western United States. Science, 306,1015–1018, doi: 10.1126/science.1102586. [DOI] [PubMed] [Google Scholar]
- Cowan I, 1978: Stomatal behaviour and environment. Adv. Bot. Res, 4, 117–228, doi: 10.1016/S0065-2296(08)60370-5. [DOI] [Google Scholar]
- Dai A, 2013: Increasing drought under global warming in observations and models. Nat. Climate Change, 3, 52–58, doi: 10.1038/nclimate1633. [DOI] [Google Scholar]
- Fan Y, and Coauthors, 2015: DigitalCrust—A 4D data system of material properties for transforming research on crustal fluid flow. Geofluids, 15, 372–379, doi: 10.1111/gfl.12114. [DOI] [Google Scholar]
- Farquhar GD, von Caemmerer S, and Berry JA, 1980: A biochemical model of photosynthetic CO2 assimilation in leaves of C3 species. Planta, 149, 78–90, doi: 10.1007/BF00386231. [DOI] [PubMed] [Google Scholar]
- Fatichi S, Pappas C, and Ivanov VY, 2015: Modeling plant-water interactions: An ecohydrological overview from the cell to the global scale. Wiley Interdiscip. Rev.: Water, 3, 327–368, doi: 10.1002/wat2.1125. [DOI] [Google Scholar]
- Feng S, Trnka M, Hayes M, and Zhang Y, 2017: Why do different drought indices show distinct future drought risk outcomes in the U.S. Great Plains? J. Climate, 30, 265–278, doi: 10.1175/JCLI-D-15-0590.1. [DOI] [Google Scholar]
- Field CB, Jackson RB, and Mooney HA, 1995: Stomatal responses to increased CO2: Implications from the plant to the global scale. Plant Cell Environ, 18, 1214–1225, doi: 10.1111/j.1365-3040.1995.tb00630.x. [DOI] [Google Scholar]
- Friedlingstein P, and Coauthors, 2006: Climate-carbon cycle feedback analysis: Results from the C4MIP model intercomparison. J. Climate, 19, 3337–3353, doi: 10.1175/JCLI3800.1. [DOI] [Google Scholar]
- Fu Q, and Feng S, 2014: Responses of terrestrial aridity to global warming. J. Geophys. Res. Atmos, 119, 7863–7875, doi: 10.1002/2014JD021608. [DOI] [Google Scholar]
- Good SP, Noone D, and Bowen G, 2015: Hydrologic connectivity constrains partitioning of global terrestrial water fluxes. Science, 349,175–177, doi: 10.1126/science.aaa5931. [DOI] [PubMed] [Google Scholar]
- Greve P, and Seneviratne SI, 2015: Assessment of future changes in water availability and aridity. Geophys. Res. Lett, 42, 5493–5499, doi: 10.1002/2015GL064127. [DOI] [PMC free article] [PubMed] [Google Scholar]
- Hawkins E, and Sutton R, 2009: The potential to narrow uncertainty in regional climate predictions. Bull. Amer. Meteor. Soc, 90,1095–1107, doi: 10.1175/2009BAMS2607.1. [DOI] [Google Scholar]
- Herold N, Kala J, and Alexander LV, 2016: The influence of soil moisture deficits on Australian heatwaves. Environ. Res. Lett, 11, 064003, doi: 10.1088/1748-9326/11/6/064003. [DOI] [Google Scholar]
- Jones CD, and Coauthors, 2016: C4MIP—The Coupled Climate-Carbon Cycle Model Intercomparison Project: Experimental protocol for CMIP6. Geosci. Model Dev, 9, 2853–2880, doi: 10.5194/gmd-9-2853-2016. [DOI] [Google Scholar]
- Kala J, Kauwe MGD, Pitman AJ, Medlyn BE, Wang Y-P, Lorenz R, and Perkins-Kirkpatrick SE, 2016: Impact of the representation of stomatal conductance on model projections of heatwave intensity. Sci. Rep, 6, 23418, doi: 10.1038/srep23418. [DOI] [PMC free article] [PubMed] [Google Scholar]
- Kapnick SB, and Hall A, 2012: Causes of recent changes in western North American snowpack. Climate Dyn, 38, 1885–1899, doi: 10.1007/s00382-011-1089-y. [DOI] [Google Scholar]
- Kay JE, and Coauthors, 2015: The Community Earth System Model (CESM) large ensemble project: A community resource for studying climate change in the presence of internal climate variability. Bull. Amer. Meteor. Soc, 96, 1333–1349, doi: 10.1175/BAMS-D-13-00255.1. [DOI] [Google Scholar]
- Konings AG, Williams A, and Gentine P, 2017: Sensitivity of grassland productivity to aridity is controlled by stomatal and xylem regulation. Nat. Climate Change, 10, 284–288, doi: 10.1038/ngeo2903. [DOI] [Google Scholar]
- Lawrence DM, and Coauthors, 2016: The Land Use Model Intercomparison Project (LUMIP) contribution to CMIP6: Rationale and experimental design. Geosci. Model Dev, 9, 2973–2998, doi: 10.5194/gmd-9-2973-2016. [DOI] [PMC free article] [PubMed] [Google Scholar]
- Lee E, Felzer BS, and Kothavala Z, 2013: Effects of nitrogen limitation on hydrological processes in CLM4-CN. J. Adv. Model. Earth Syst, 5, 741–754, doi: 10.1002/jame.20046. [DOI] [Google Scholar]
- Mahowald N, Lo F, Zheng Y, Harrison L, Funk C, Lombardozzi D, and Goodale C, 2016: Projections of leaf area index in Earth system models. Earth Syst. Dyn, 7, 211–229, doi: 10.5194/esd-7-211-2016. [DOI] [Google Scholar]
- Mankin JS, and Diffenbaugh NS, 2015: Influence of temperature and precipitation variability on near-term snow trends. Climate Dyn, 45, 1099–1116, doi: 10.1007/s00382-014-2357-4. [DOI] [Google Scholar]
- ——, Viviroli D, Singh D, Hoekstra AY, and Diffenbaugh NS, 2015: The potential for snow to supply human water demand in the present and future. Environ. Res. Lett, 10, 114016, doi: 10.1088/1748-9326/10/11/114016. [DOI] [Google Scholar]
- ——,——, Mekonnen MM, Hoekstra AY, Horton RM, Smerdon JE, and Diffenbaugh NS, 2017: Influence of internal variability on population exposure to hydroclimatic changes. Environ. Res. Lett, 12, 044007, 10.1088/1748-9326/aa5efc. [DOI] [PMC free article] [PubMed] [Google Scholar]
- McDowell N, and Coauthors, 2008: Mechanisms of plant survival and mortality during drought: Why do some plants survive while others succumb to drought? New Phytol, 178, 719–739, doi: 10.1111/j.1469-8137.2008.02436.x. [DOI] [PubMed] [Google Scholar]
- Meehl GA, and Coauthors, 2009: Decadal prediction: Can it be skillful? Bull. Amer. Meteor. Soc, 90,1467–1485, doi: 10.1175/2009BAMS2778.1. [DOI] [Google Scholar]
- Meinshausen M, and Coauthors, 2011: The RCP greenhouse gas concentrations and their extensions from 1765 to 2300. Climatic Change, 109, 213–241, doi: 10.1007/s10584-011-0156-z. [DOI] [Google Scholar]
- Milly PCD, and Dunne KA, 2016: Potential evapotranspiration and continental drying. Nat. Climate Change, 6, 946–949, doi: 10.1038/nclimate3046. [DOI] [Google Scholar]
- Mote PW, Hamlet AF, Clark MP, and Lettenmaier DP, 2005: Declining mountain snowpack in western North America. Bull. Amer. Meteor. Soc, 86, 39–49, doi: 10.1175/BAMS-86-1-39. [DOI] [Google Scholar]
- Oleson KW, and Coauthors, 2010: Technical description of version 4.0 of the Community Land Model (CLM). NCAR Tech. Note NCAR/TN-478+STR, 257 pp., doi: 10.5065/D6FB50WZ. [DOI] [Google Scholar]
- _____, and Coauthors, 2013: Technical description of version 4.5 of the Community Land Model (CLM). NCAR Tech. Note NCAR/TN-503+STR, 420 pp., doi: 10.5065/D6RR1W7M. [DOI] [Google Scholar]
- Pendergrass AG, Lehner F, Sanderson BM, and Xu Y, 2015: Does extreme precipitation intensity depend on the emissions scenario? Geophys. Res. Lett, 42, 8767–8774, doi: 10.1002/2015GL065854. [DOI] [Google Scholar]
- Poorter H, and Coauthors, 2009: Causes and consequences of variation in leaf mass per area (LMA): A meta-analysis. New Phytol, 182, 565–588, doi: 10.1111/j.1469-8137.2009.02830.x. [DOI] [PubMed] [Google Scholar]
- Rind D, Goldberg R, Hansen J, Rosenzweig C, and Ruedy R, 1990: Potential evapotranspiration and the likelihood of future drought. J. Geophys. Res, 95, 9983–10 004, doi: 10.1029/JD095iD07p09983. [DOI] [Google Scholar]
- Roderick ML, Greve P, and Farquhar GD, 2015: On the assessment of aridity with changes in atmospheric CO2. Water Resour. Res, 51, 5450–5463, doi: 10.1002/2015WR017031. [DOI] [Google Scholar]
- Scheff J, and Frierson DMW, 2014: Scaling potential evapotranspiration with greenhouse warming. J. Climate, 27, 1539–1558, doi: 10.1175/JCLI-D-13-00233.1. [DOI] [Google Scholar]
- ——, and ——, 2015: Terrestrial aridity and its response to greenhouse warming across CMIP5 climate models. J. Climate, 28, 5583–5600, doi: 10.1175/JCLI-D-14-00480.1. [DOI] [Google Scholar]
- Seager R, and Coauthors, 2007: Model projections of an imminent transition to a more arid climate in southwestern North America. Science, 316,1181–1184, doi: 10.1126/science.1139601. [DOI] [PubMed] [Google Scholar]
- ______, Ting M, Li C, Naik N, Cook BI, Nakamura J, and Liu H, 2013: Projections of declining surface-water availability for the southwestern United States. Nat. Climate Change, 3, 482–486, doi: 10.1038/nclimate1787. [DOI] [Google Scholar]
- Seneviratne SI, Corti T, Davin EL, Hirschi M, Jaeger EB, Lehner I, Orlowsky B, and Teuling AJ, 2010: Investigating soil moisture-climate interactions in a changing climate: A review. Earth-Sci. Rev, 99, 125–161, doi: 10.1016/j.earscirev.2010.02.004. [DOI] [Google Scholar]
- Sherwood S, and Fu Q, 2014: A drier future? Science, 343, 737–739, doi: 10.1126/science.1247620. [DOI] [PubMed] [Google Scholar]
- Simpson IR, Seager R, Ting M, and Shaw TA, 2016: Causes of change in Northern Hemisphere winter meridional winds and regional hydroclimate. Nat. Climate Change, 6, 65–70, doi: 10.1038/nclimate2783. [DOI] [Google Scholar]
- Skinner CB, Poulsen CJ, Chadwick R, Diffenbaugh NS, and Fiorella RP, 2017: The role of plant CO2 physiological forcing in shaping future daily-scale precipitation. J. Climate, 30, 2319–2340, doi: 10.1175/JCLI-D-16-0603.1. [DOI] [Google Scholar]
- Swann ALS, Hoffman FM, Koven CD, and Randerson JT, 2016: Plant responses to increasing CO2 reduce estimates of climate impacts on drought severity. Proc. Natl. Acad. Sci. USA, 113,10 019–10024, doi: 10.1073/pnas.1604581113. [DOI] [PMC free article] [PubMed] [Google Scholar]
- Touma D, Ashfaq M, Nayak MA, Kao S-C, and Diffenbaugh NS, 2015: A multi-model and multi-index evaluation of drought characteristics in the 21st century. J. Hydrol, 526, 196–207, doi: 10.1016/j.jhydrol.2014.12.011. [DOI] [Google Scholar]
- Udall B, and Overpeck JT, 2017: The twenty-first century Colorado River hot drought and implications for the future. Water Resour. Res, 53, 2404–2418, doi: 10.1002/2016WR019638. [DOI] [Google Scholar]
- van den Hurk B, and Coauthors, 2016: LS3MIP (v1.0) contribution to CMIP6: The Land Surface, Snow and Soil Moisture Model Intercomparison Project—Aims, setup and expected outcome. Geosci. Model Dev, 9, 2809–2832, doi: 10.5194/gmd-9-2809-2016. [DOI] [Google Scholar]
- van der Molen MK, and Coauthors, 2011: Drought and ecosystem carbon cycling. Agric. For. Meteor, 151, 765–773, doi: 10.1016/j.agrformet.2011.01.018. [DOI] [Google Scholar]
- Vicente-Serrano SM, Begueria S, and Lopez-Moreno JI, 2010: A multiscalar drought index sensitive to global warming: The standardized precipitation evapotranspiration index. J. Climate, 23,1696–1718, doi: 10.1175/2009JCLI2909.1. [DOI] [Google Scholar]
- Wang K, and Dickinson RE, 2012: A review of global terrestrial evapotranspiration: Observation, modelling, climatology, and climatic variability. Rev. Geophys, 50, RG2005, doi: 10.1029/2011RG000373. [DOI] [Google Scholar]
- Weiler M, and Beven K, 2015: Do we need a Community Hydrological Model? Water Resour. Res, 51, 7777–7784, doi: 10.1002/2014WR016731. [DOI] [Google Scholar]
- Williams A, and Coauthors, 2013: Temperature as a potent driver of regional forest drought stress and tree mortality. Nat. Climate Change, 3, 292–297, doi: 10.1038/nclimate1693. [DOI] [Google Scholar]
- Zeng X, and Decker M, 2009: Improving the numerical solution of soil moisture-based Richards equation for land models with a deep or shallow water table. J. Hydrometeor, 10, 308–319, doi: 10.1175/2008JHM1011.1. [DOI] [Google Scholar]


