Abstract
In this study, the effect of CurDAc, a water-soluble curcumin derivative, on the formation and stability of amyloid fibers is revealed. CurDAc interaction with amyloid is structurally selective, which is reflected in a strong interference with hIAPP aggregation while showing weaker interactions with human-calcitonin and amyloid-β1–40 in comparison. Remarkably, CurDAc also exhibited potent fiber disaggregation for hIAPP generating a toxic oligomeric species.
Graphical Abstract
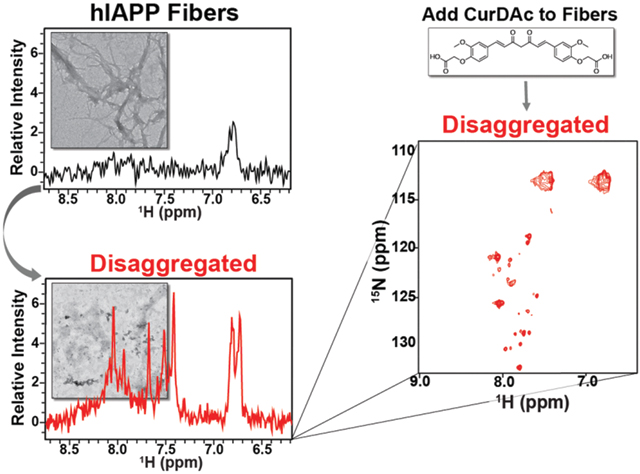
Small molecules have been sought out to interact with many different points in the aggregation process and can function as inhibitors, promoters, or disaggregators[1]. These tool compounds are advantageous for the targeting of many types of biological molecules, including amyloids. They are highly tunable for specific functions, can bind tightly to the target protein, and can pass through cell membranes with little difficulty [2]. CurDAc, a curcumin derivative, has increased water-solubility and stability compared to its parent molecule (Figure S1). It has- been shown to inhibit hIAPP, both in the presence and absence of lipid bilayers, and negate hIAPP’s aggregation-induced lipid membrane disruption.[3] In this study, the effects of CurDAc on three different amyloid peptides, amyloid-β (Aβ1–40), human islet amyloid polypeptide (hIAPP), and human calcitonin (hCT), were examined. While these three peptides have a similar length ranging from 32–42 amino acids, they differ in their isoelectric point, hydrophobicity, and aggregation kinetics (Figure S2). These similarities and differences make them ideal for understanding the structural specificity of small molecules. Fiber growth was monitored by utilizing Thioflavin-T (ThT),[4] which is a widely used fluorescence reporter for amyloid fiber formation that gives kinetic and mechanistic information about amyloid aggregation (Figure 1). Both inhibition and disaggregation profiles were obtained using ThT fluorescence assays for all three peptides, hIAPP (Fig.1A and D), hCT (Fig. 1 B and E), and Aβ1–40 (Fig. 1 C and F). While CurDAc was able to modulate the aggregation of the three amyloid peptides, it displayed a distinct difference in potency. For hIAPP, as the concentration of CurDAc was increased from 0.06 to 2 molar equivalents, the overall final ThT signal intensity with respect to the control decreased, indicating a decrease of fiber formation (Figure 1A). Not only is the overall intensity lower, but also the slope of the elongation phase is extended, indicating a possible change in the secondary nucleation step. CurDAc acted as a fibrillation inhibitor for hCT as well; however, it was not as effective as compared to hIAPP. For Aβ1–40, the concentration range that was tested on hIAPP and hCT did not affect the inhibition of fibril formation (Figure 1C). Superstoichometric ratios (10–15 molar equivalents) were needed in order to see a depression of fibril formation in Aβ1–40 (Figure 1C). Interestingly, the lag-time at lower equivalencies of CurDAc was decreased by about 200 minutes, an effect that was not observed with the other two peptides. This change in kinetics could be attributed to the high concentration of CurDAc acting in the same fashion as a colloidal inhibitor and the charge-charge repulsion of CurDAc with Aβ1–40[5].
Figure 1.
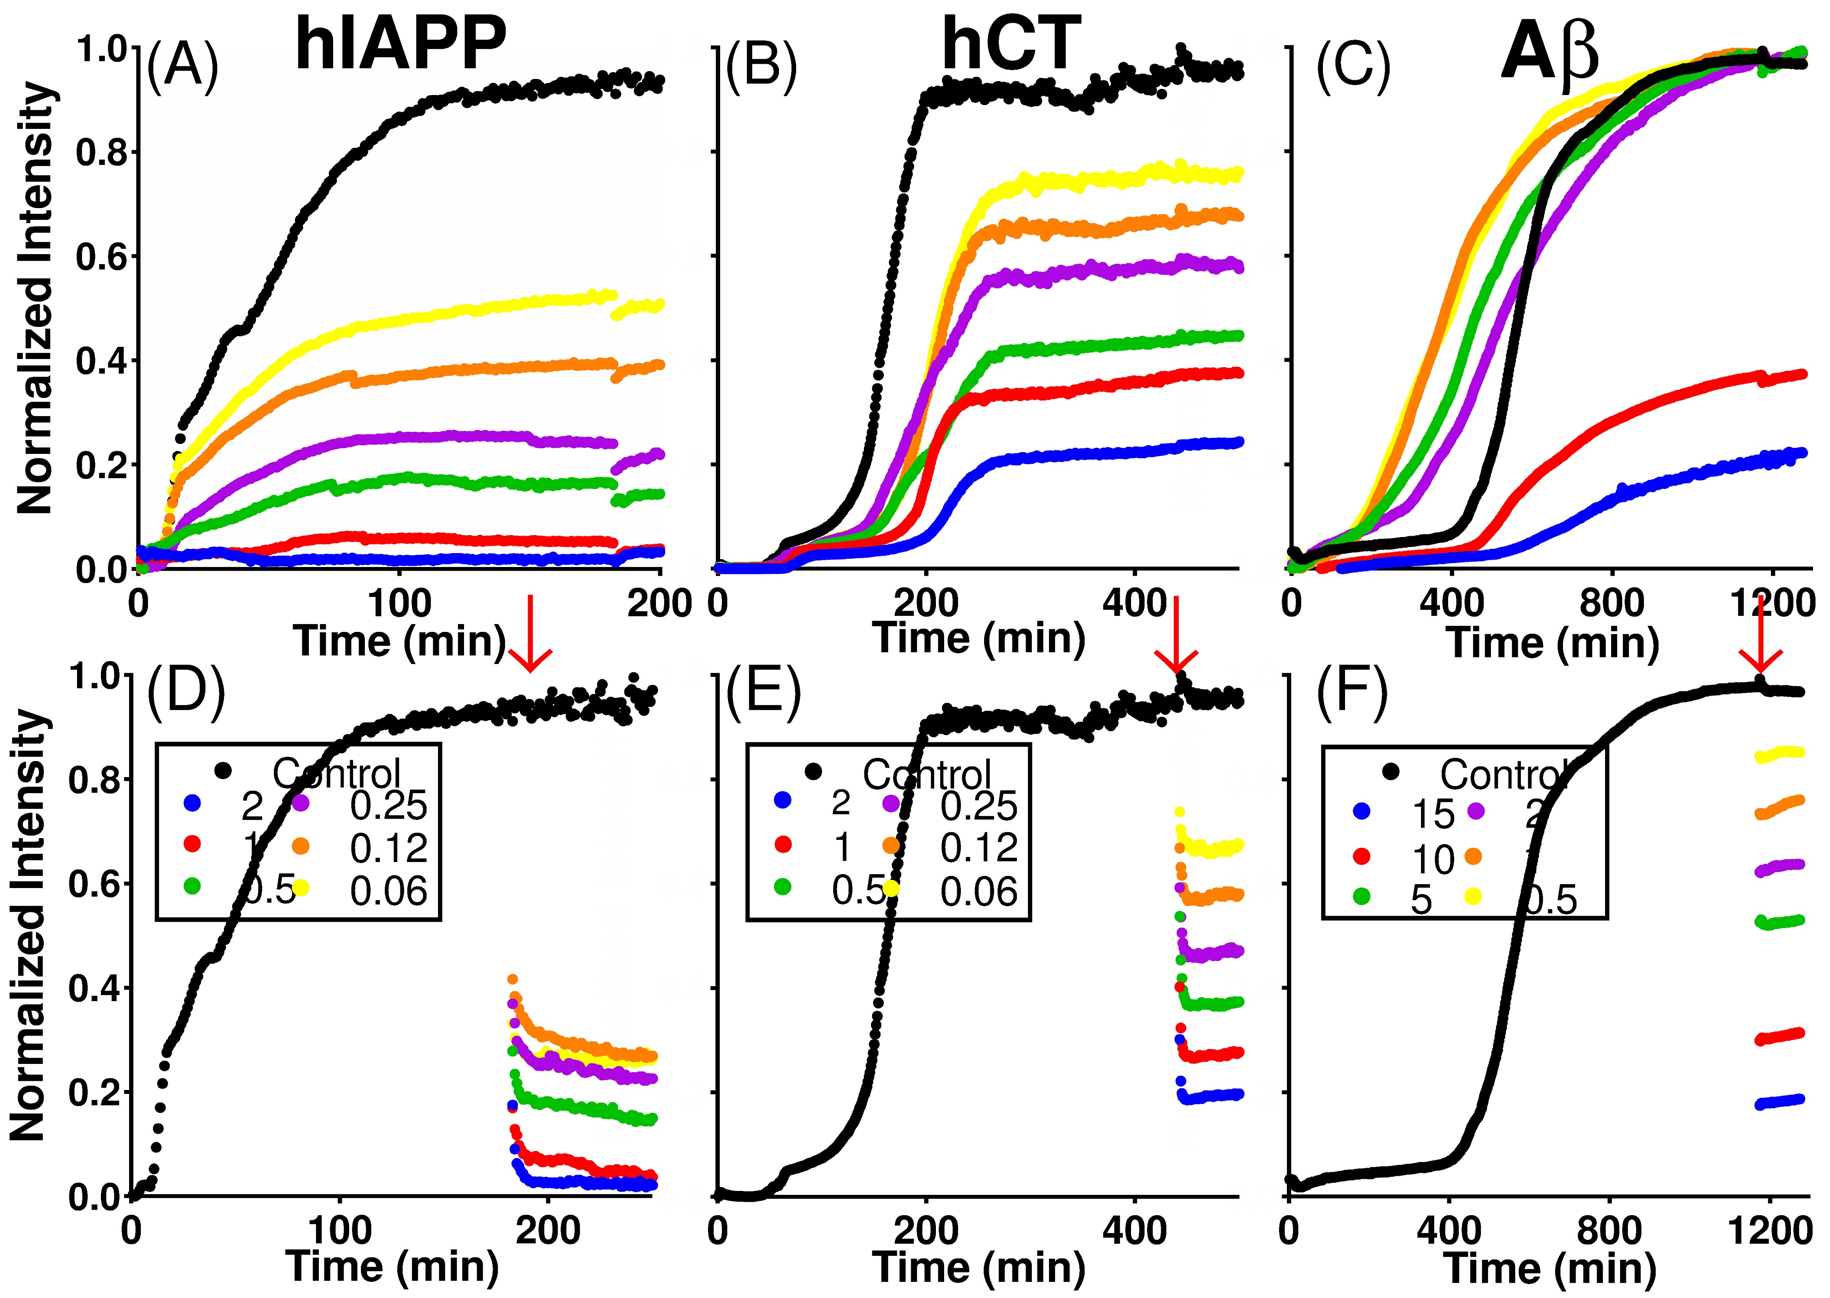
Inhibition and disaggregation of amyloid peptides by CurDAc. Amounts of CurDAc added are given in molar equivalences with respect to the peptide concentration. ThT fluorescence inhibition curves (A-C) and disaggregation curves of hIAPP, hCT and Aβ1–40 (D-F, respectively) in the presence of varying molar equivalents of CurDAc. Red arrow indicates the time when CurDAc was added.
Amyloid disaggregation as a method of removing plaque loads could be an avenue to reduced toxicity since plaques have been hypothesized to serve as nucleating sites for toxic oligomers.[6] In Figure 1D, ThT curves show the disaggregation of hIAPP fibers upon the addition of CurDAc (red arrows) in the same stoichiometric ratios of CurDAc as in the inhibition experiments. A similar trend was seen for hCT in that there is an immediate drop in ThT intensity followed by a decline and plateau; however, the steepness of decline is greater, and the curve plateaus more quickly as compared to that observed for hIAPP (Figure 1E). For Aβ, we unexpectedly observed drops in intensity for all of the equivalents examined, but these curves are stable in intensity after the initial drop (Figure 1F). The initial steep decline in ThT intensity is followed by an eventual plateau. To rule out the possibility of ThT displacement, we repeated these same experiments with higher excess of ThT, and the same trend was observed (Figure S3), leading us to believe that another mechanism is operative. Using Isothermal Titration Calorimetry (ITC), the binding of CurDAc to Aβ1–40 or hIAPP was studied to further investigate the nature of the interaction (Figure S4 and Table S1). In the ITC experiments for hIAPP, no interaction was observed between hIAPP monomers and CurDAc. CurDAc interaction with hIAPP fibers was found to have a dissociation constant (Kd) value of ~7 μM. For Aβ1–40 fibers, no binding could be detected for 10 molar equivalent concentrations of CurDAc. These data further support that the disaggregation effect is not a result of ThT displacement given the very similar binding constants of CurDAc to hIAPP fibers (~7μM) and ThT to amyloid fibers (~10 μM).[7] Building on the ThT data of selectivity and potent disaggregation of hIAPP, we performed NMR experiments to obtain a deeper understanding of this interaction. By observing the total proton NMR signal intensity of the amide region of hIAPP in solution, we analyzed the aggregation kinetics of hIAPP monomers in the presence of CurDAc (Figure S5). Interestingly, hIAPP in the presence of CurDAc at neutral pH loses signal intensity faster than in the absence of CurDAc. Most of the peaks in the NMR spectrum disappeared within 10 hours for the peptide alone. In the presence of CurDAc, the peaks in the NMR spectrum disappeared in less than one hour, indicating the formation of NMR invisible species, such as a large off-pathway oligomer [8].
Human-IAPP is an unstable peptide under in vitro conditions, which is in accordance with quick self-assembly of the peptide to form aggregates under neutral conditions [9]. It is also known that the formation of the N-terminus disulfide bridge is critical for its aggregation kinetics, and in this NMR study, the oxidized form of hIAPP is used throughout. Due to the accelerated aggregation and signal loss at neutral pH, we lowered the sample pH to 5.3, which is the physiological pH of hIAPP when stored in insulin granules at high concentrations in the pancreatic beta cells [10]. This strategy allowed us to perform longer NMR experiments on hIAPP and enabled us to complete additional analyses of the interaction with CurDAc due to the increased lifetime of the monomeric sample. At this pH, hIAPP remained relatively soluble for 30 hours with only 20% signal loss (Figures S5 and S6). At a 1:1 molar ratio with CurDAc, the hIAPP signal decreased more rapidly with 70% of the signal lost after 20 hours and with a complete signal loss at 40 hours (Figure S5). This observation suggests that CurDAc can quickly initiate hIAPP aggregation and inhibits the fibrillar structure morphology of the aggregate species in a similar yet different way as other flavanols. Using two-dimensional NMR techniques, such as SOFAST-HMQC, it is possible to obtain residue-specific information of the CurDAc-hIAPP complex interaction (Figure 2A).
Figure 2.
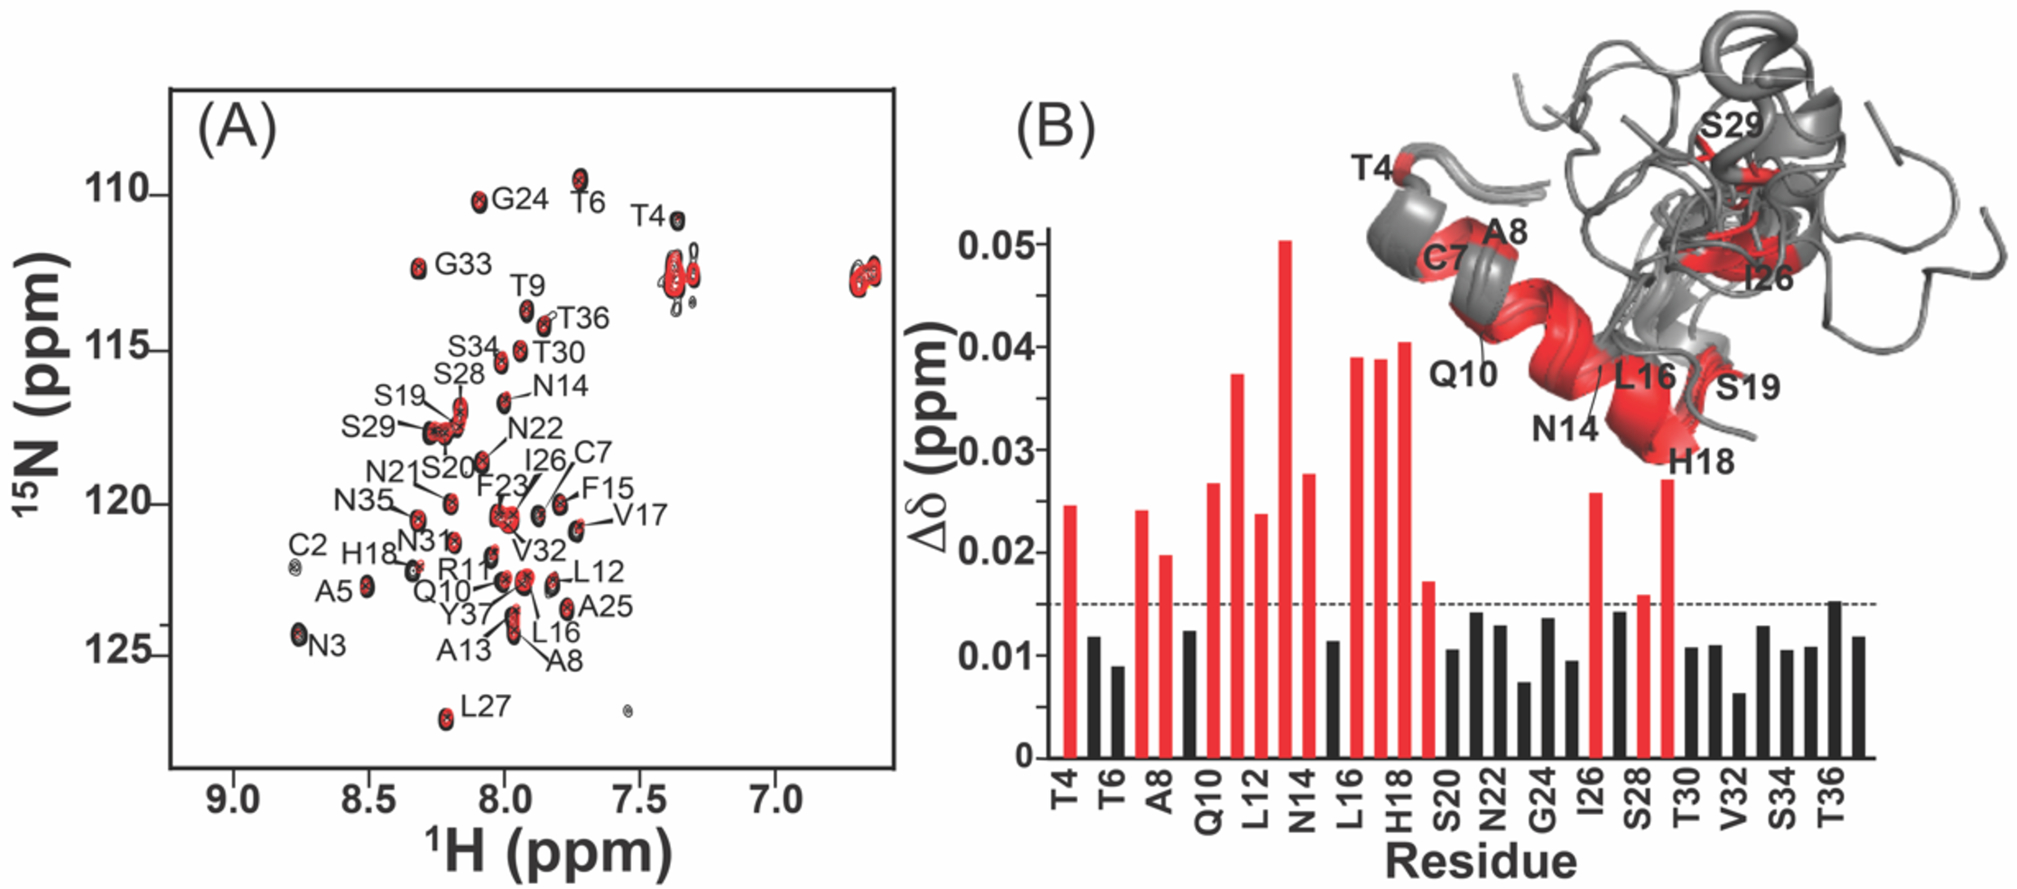
hIAPP monomer and CurDAc interactions characterized by NMR. (A) 2D 1H/15N SOFAST-HMQC spectra exhibiting the interaction between 100 μM hIAPP (black) with 100 μM CurDAc (red). (B) CSPs for the backbone amide 15N and proton resonances as a function of the amino acid sequence position. The dashed line indicates the mean for the observed CSPs with the stronger shift changes above 0.015 (shown in red) highlighted on the monomer structure of hIAPP (PDB:5MGQ).
In comparison to the reference 1H/15N HMQC spectrum of hIAPP alone, small chemical shift perturbations (CSPs) were observed, in CurDAc containing samples, for residues in the N terminal and central regions as indicated by the peaks above the (horizontal) dashed line indicating the mean (Figure 2B). Most strongly affected residues include T4, C7, A8, Q10-N14, L16-S19, I26, and S29 and are highlighted on the monomeric structure (Figure 2B)[11]. 3D HNCA, HN(CO)CA, and HNCACB experiments were performed on the hIAPP monomer in the presence of CurDAc (Table S2). Using three different kinds of software to predict secondary structure, the Random-Coil Index, Secondary Structural Propensities database, and the Δδ of the Cα chemical shift, Δδ Cα - Δδ Cβ, and the Cα, Cβ, HN and 15N chemical shifts were analyzed and are shown in Figure S7. All approaches predict that the N-terminus of hIAPP has an alpha-helical conformation, with a slight beta-sheet tendency near the amyloidogenic core (residues 24–27) and the remainder of the peptide present is in a random-coil, which is similar to the structure of the hIAPP monomer as shown in Figure 2B as well as the oxidized structure of the hIAPP monomer PDB:5MGQ.
Fibers represent a large insoluble form that is invisible for the traditional solution NMR experiments due to the presence (or incomplete averaging) of line-broadening anisotropic interactions such as dipolar couplings and chemical shift anisotropy[12]. To further examine the CurDAc induced fiber disaggregation observed in the ThT assay (Fig.1D), solution NMR experiments were carried out on hIAPP fibers with and without CurDAc. In the event that portions of the peptides that form the fibers start to become soluble and can tumble sufficiently fast in solution, the peptide signal will become narrow, and the newly generated soluble peptide species can be identified and quantified by solution NMR. The starting NMR spectrum of hIAPP fibers at pH 7.4 shown in Figure 3A (in black) exhibits very few peaks. 72 hours after the addition of CurDAc, narrow peaks appeared in the spectrum (Figure 3A, red). As shown in Figure 3B, after the addition of CurDAc to fibers, the signal intensity for the peaks observed in the proton NMR spectrum increased steadily over 72 hours indicating the formation of small hIAPP species. In an attempt to identify the amino acid residues corresponding to these new resonances in Figure 3A (red), 2D SOFAST-HMQC (Figure 3C, red; Figure S8), 3D HNCA (Figures S9 and S10), 3D HN(CO)CA (Figures S9 and S10) and 3D HNCACB (not included due to very weak signal-to-noise ratio) were carried out on the 13C&15N-hIAPP fibers treated with CurDAc for 72 hours.
Figure 3. NMR observation of disaggregation of hIAPP fibers.
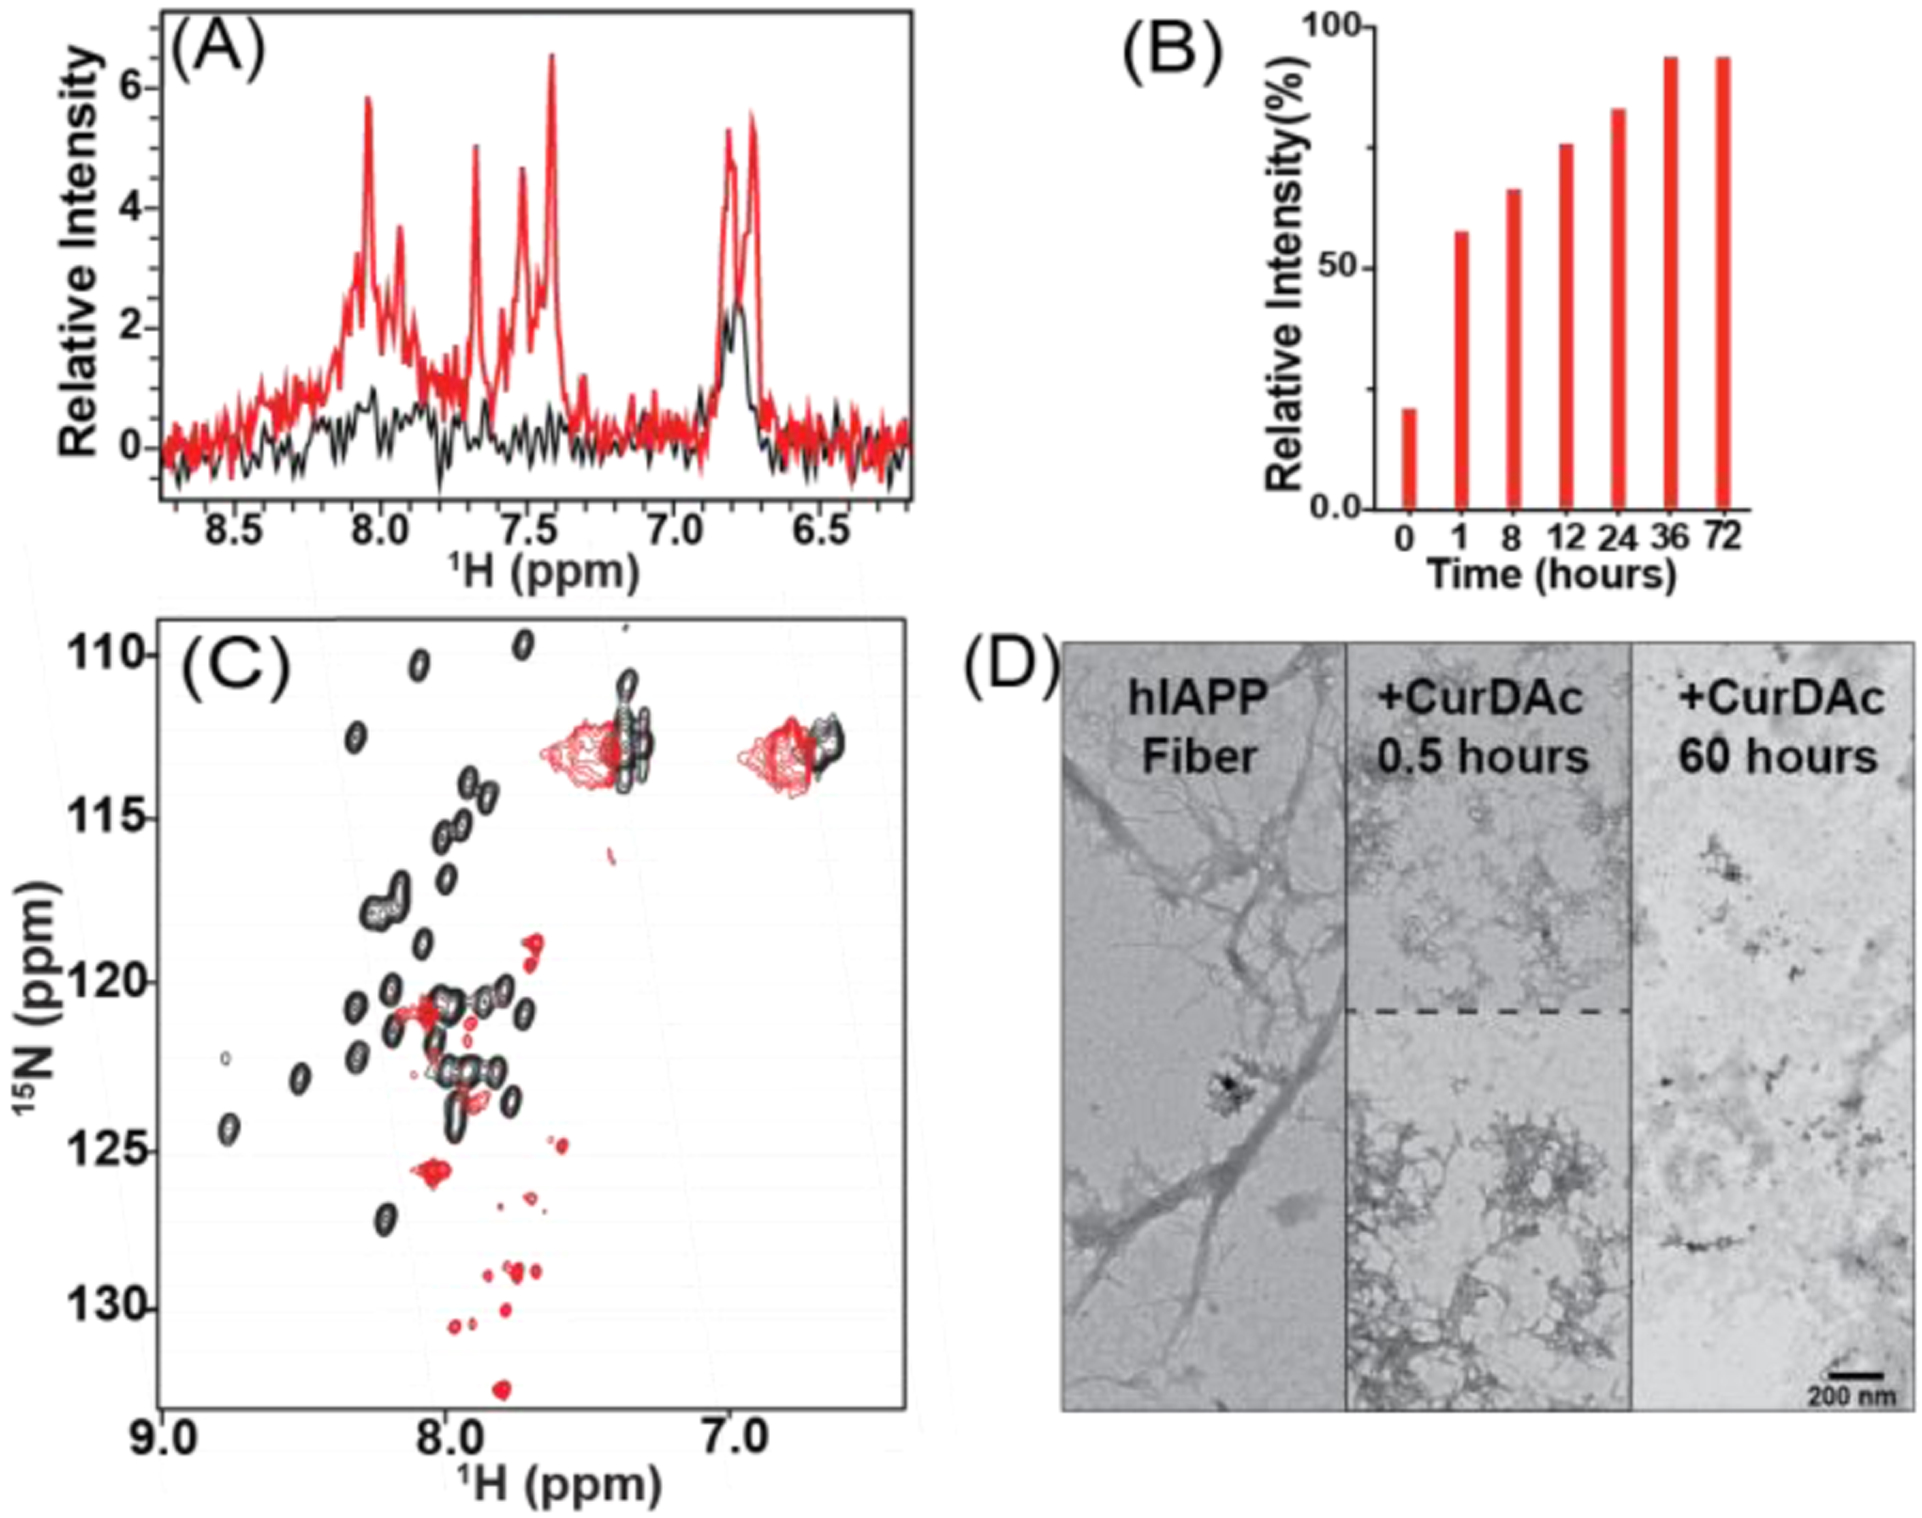
(A) Proton NMR spectra of 100 μM hIAPP fibers (black) and 100 μM hIAPP after 72-hour incubation with CurDAc (red) at pH 7.4 in phosphate buffer. (B) Normalized overall proton peak intensity of hIAPP fibers as a function of disaggregation by CurDAc over 72 hours. (C) 2D 1H/15N SOFAST-HMQC NMR spectra of hIAPP monomers (black) and the disaggregated species (red) at a 1:1 peptide:CurDAc molar ratio with the possible residues for each peak shown. (D) TEM images of hIAPP fibers (left) and hIAPP species after 0.5 hours (middle) and 60 hours (right) disaggregation.
By using 2D 1H/15N SOFAST-HMQC NMR experiments, we were able to observe most of the peaks (about 29 resolved resonances; see Figure S8) which appeared after 72h of adding CurDAc to hIAPP fibers at pH 7.4. The chemical shift values observed for these resonances are different from that of monomers; and they are attributed to CurDAc induced disaggregated peptide species formed from hIAPP fibers in solution (Figures 3C(red) and S8). Assignment of resonances observed in the 3D NMR spectra was quite challenging due to the absence of many resonances (and lack of sequence continuation) and poor S/N. Nevertheless, we were able to come up with an approximation for the residues (Figures S9 and S10). Using CcpNmr software, we compared the statistics presented for CA chemical shifts for the 20 amino acid and compared it to the chemical shifts that we observed. Although this procedure helped us to come up with assignment possibilities, these are tentative and it is worthwhile to carry out a detailed NMR experimental investigation to accurately assign the resonances and solve the structure of the CurDAc induced fiber-disaggregated species. Here, based on the reported results, we can conclude that CurDAc has the ability to disaggregate fibers, and CurDAc could be an excellent chemical tool for deeper investigation for many types of amyloids.
Out of the 37 residues in hIAPP, 15 residues are named as the likely possibilities for the 6 observed peaks in 3D spectra (Figures S9 and S10). There are possible explanations for the unobserved 22 residues. The first possibility is that the observed residues are from a highly flexible/mobile loop region of an oligomeric hIAPP species, while the unseen residues likely to be buried within the oligomer causing NMR signal loss. The second possibility is that while a smaller peptide species is generated from CurDAC induced fiber disaggregation, they could be exchanging between fiber-bound and unbound states causing broadening of resonances that were not observed in the spectrum. The atypical chemical shift values observed for these resonances (Figures 3C(red) and S8) may be due to the disordered conformation of the disaggregated hIAPP species and the ring-current effect from CurDAc bound to these species. Figure S11 provides a control experiment to rule out these peaks being due to peptide degradation due to prolonged incubation. The CurDAc induced disaggregation of hIAPP fibers is corroborated using TEM (Figure 3D). TEM shows the difference between hIAPP fiber morphology before and after the addition of CurDAc. The disruption of aggregates increases over time, as seen with the decreasing amount and size of hIAPP fibers indicating the fiber disaggregation.
Given this NMR data, we turned to other biophysical techniques to support our findings. By recording circular dichroism (CD) spectra of hIAPP overtime after the addition of CurDAc, the secondary structural changes associated with the disaggregation of fibers were monitored. Before the addition of CurDAc, a strong peak was observed at 218, a beta-sheet conformation (Figure S12). There was also a shoulder at 200 nm, which could indicate a portion of the peptide remaining in random-coil. Using CD fitting software, BeStSel, we analyzed the data to understand the possible distribution of conformations in the samples (Table S3). While a majority of the structural content was determined to be a beta-sheet, after the addition of CurDAc, a small helical conformation was observed between 30 minutes and 40 hours of the ongoing fiber dissociation. For Aβ1–40 and hCT, CD experiments indicated the formation of a stable beta-sheet secondary structure in the same period as the ThT curves, which was maintained after the addition of CurDAc (Figure S13). The CD samples were examined using transmission electron microscopy (TEM), and fibers were observed for all three different peptides before the addition of CurDAc. Since CurDAc’s effect on hIAPP is most pronounced, we monitored TEM over an extended time in accordance with NMR and CD experiments (Figures S12 and S13) in which the remodeling observed in the experiments mentioned above can be visualized. For hCT, after the addition of CurDAc, more amorphous type aggregates can be seen after remodeling with two molar equivalents (Figure S14). For Aβ1–40, the fibers maintained their architecture at 10 molar equivalents of CurDAc but appeared to be overall shorter in length than before addition (Figure S14).
There is considerable interest in understanding cellular toxicity of amyloid species in order to evaluate the potency of small molecule amyloid inhibitors and potentially to develop compounds to treat the related amyloid disease. While fibers are thought to be relatively inert, cytotoxic species are pointed at pre-fibrillar oligomers in the case of many different amyloid related diseases. In this study, the MTT dye (3-(4,5-dimethylthiazol-2-yl)-2,5-diphenyltetrazolium bromide) reduction assay and CellTox green assays were utilized. (Figure 4). Freshly prepared monomers, or fibers grown for 24 hours, were added to the rat pancreatic islet cell line, RIN-5F, at varying concentrations and were allowed to incubate with adherent cells for 24 hours before measuring toxicity. It was found that the fibers exhibited higher toxicity than the monomers by decreasing the cell viability by greater than 40 percent at the highest concentrations used. When monomers and fibers were treated with CurDAc after 24 hours, the toxicities of both increased in comparison to the non-treated samples. It is interesting to note that the toxicities of both monomers and fibers treated with CurDAc exhibited very similar levels of toxicity, indicating a level of similarity between the two. The toxicity of CurDAc to its parent compound curcumin was also compared, and it was found that both were nontoxic by the MTT assay (Figure S15). In order to corroborate our findings using the MTT assay, the CellTox Green assay was utilized (Figure S16). This assay was in agreement with MTT results, in which we observed increased toxicity for the peptide that had been treated with CurDAc after 13 hours of incubation. These results indicate that the co-incubation of hIAPP monomers or fibers with CurDAc promotes the formation of toxic species. Statistical significance calculations were performed using ordinary one-way ANOVA tests with Tukey’s multiple comparisons. All values of the comparisons are shown in Table S4.
Figure 4.
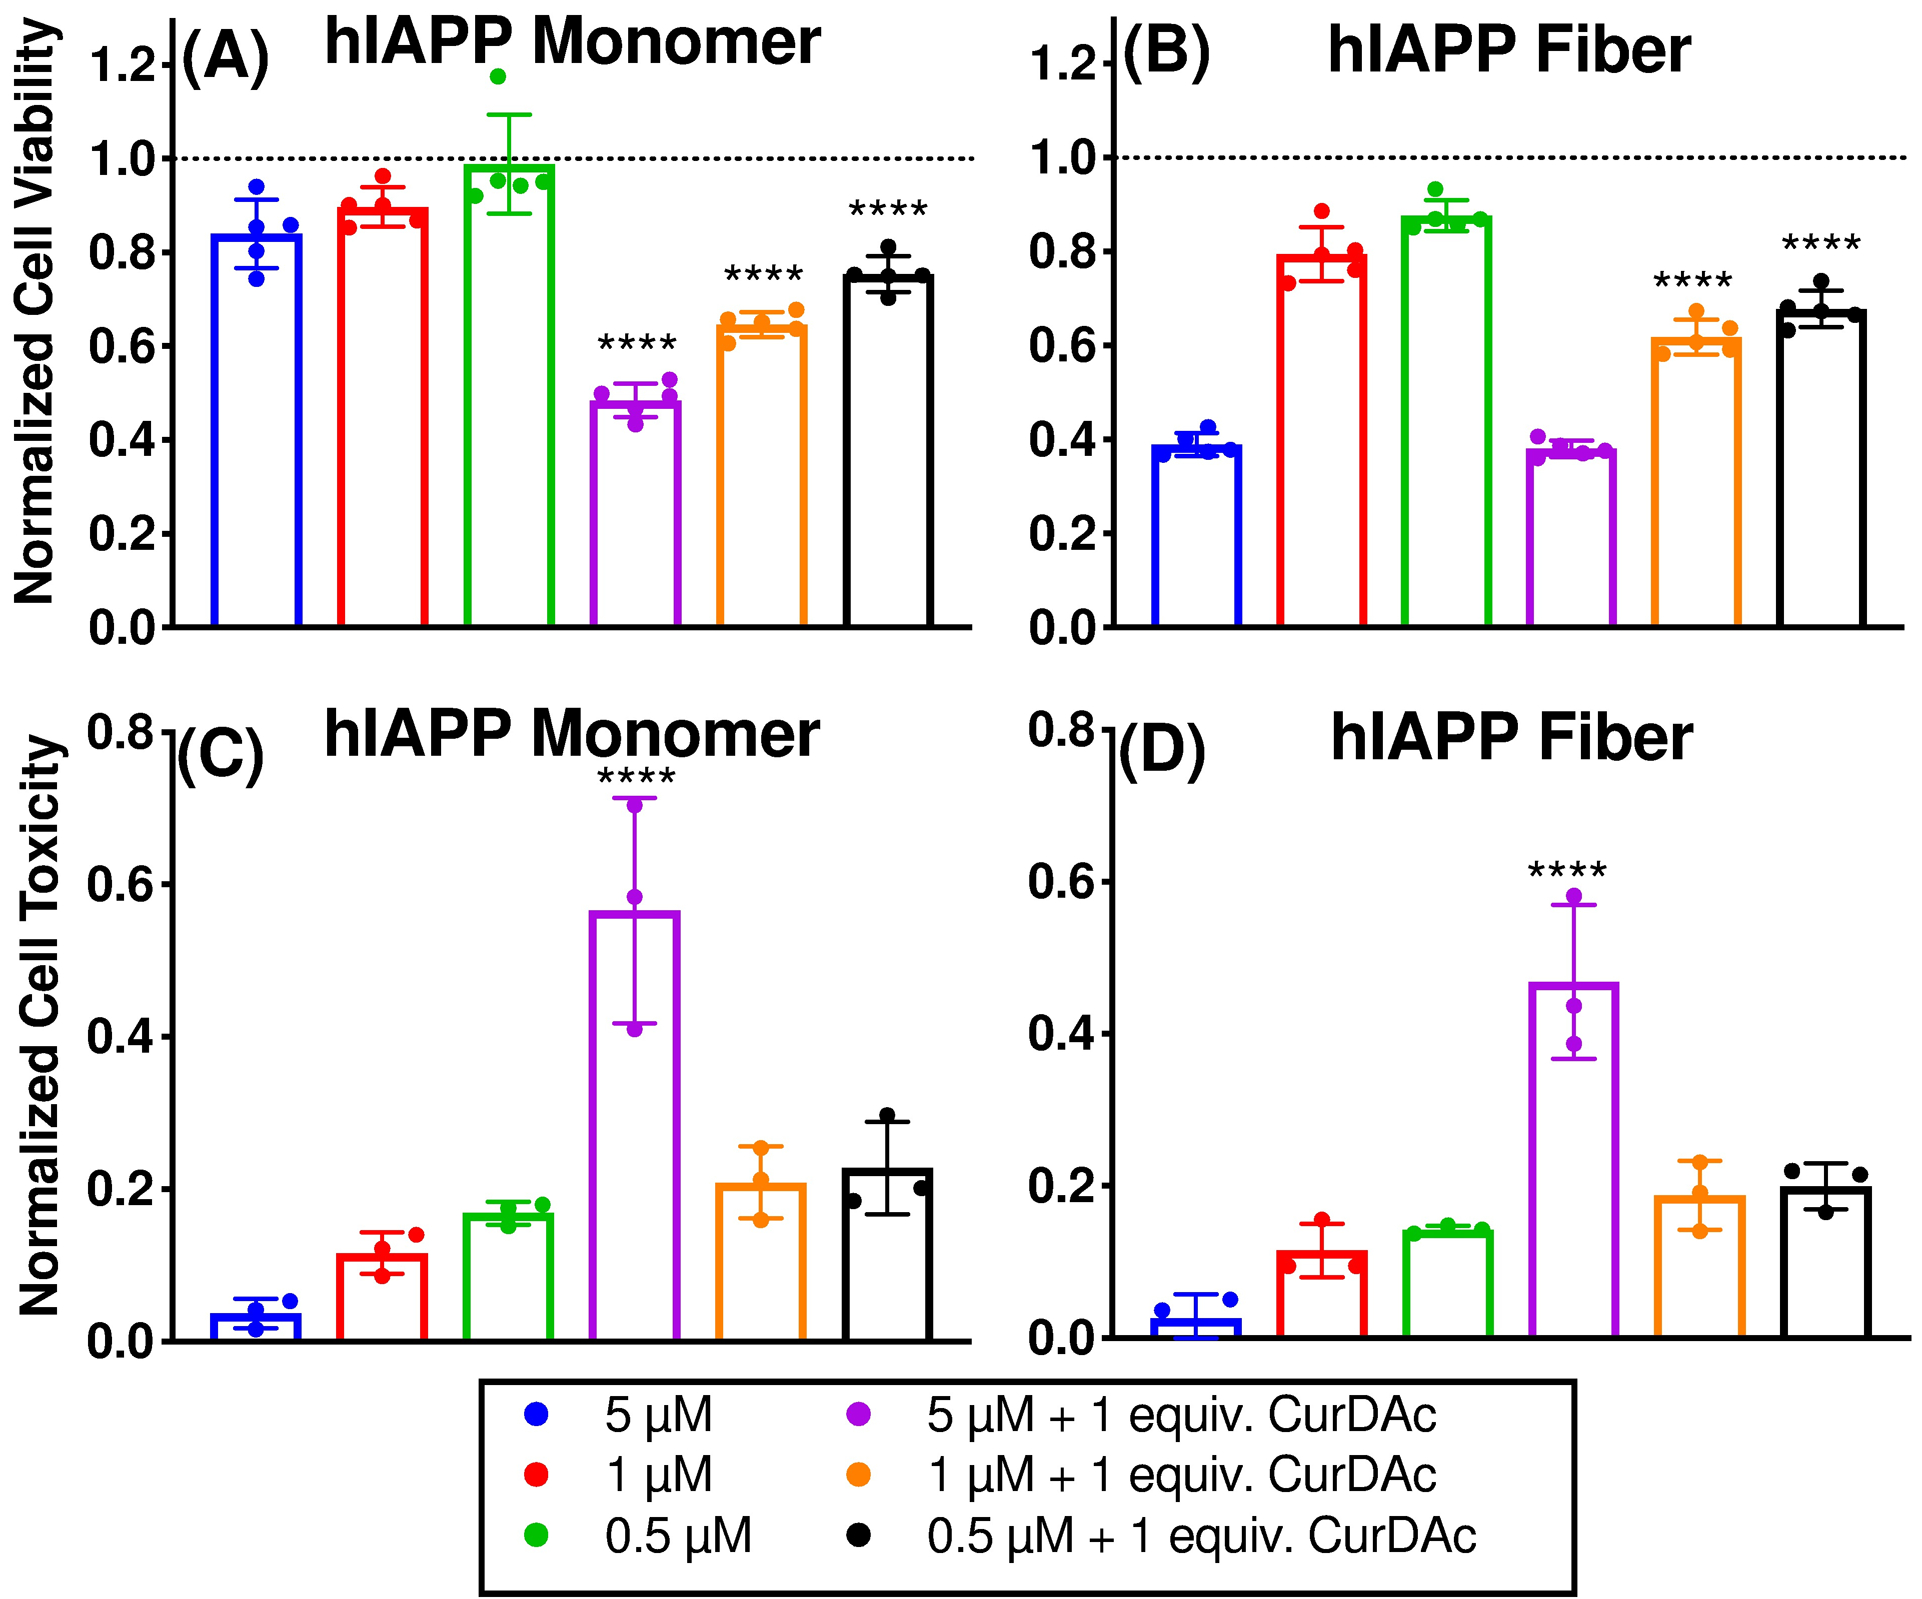
Cell toxicity measurements of hIAPP monomer and fibers in the presence and absence of CurDAc. RIN-5F cell viability measured by MTT reduction in the presence of hIAPP monomers and fibers without CurDAc and after 24-hour incubation with CurDAc (A-B). Cell toxicity final intensity after 13 hours of monitoring by CellTox Green fluorescence (C-D).
While amyloid aggregation has been extensively studied, the use of small molecules as a chemical biology tool provides advantages to traditional methods of stabilization. This study has shown the potential of CurDAc to act as a peptide-specific chemical probe to study hIAPP and to disrupt fully mature fibers and prevent monomers from forming fibers. This is the first example in the literature of using NMR to follow fiber disruption at atomic resolution, which allowed us to identify solvent-exposed residues in the species formed after disaggregation. Most of these residues, which are in the loop regions of known monomer and fiber structures, have distinct chemical shift values. This suggests that these residues are in a new chemical environment or structurally distinct and may be part of a larger oligomeric species that is not visible for solution NMR studies. TEM served as a visual confirmation in which the fibers can be seen being broken down upon incubation with equimolar amounts of CurDAc. Notably, these disaggregated species were more toxic than the fibers or monomers to cultured cells. We believe that the results reported in this study can be used to provide a starting point to develop other small molecules for amyloid modulation or oligomer characterization. Using tool compounds like CurDAc could provide new avenues to probe and isolate the pathways of oligomer formation, which may lead to further understanding of the toxic oligomer hypothesis.
Supplementary Material
Acknowledgements
This study is supported by funding from the National Institutes of Health (AG048934 to A.R.). We thank Dr. Bankala for help with NMR data processing, Dr. Yuxi Lin for ITC measurements, and Rajendran Sribalan for the preparation of CurDAc.
Footnotes
Electronic Supplementary Information (ESI) available: See DOI: 10.1039/x0xx00000x
Conflicts of Interest
The authors declare no conflicts of interest.
References
- 1.Hamley IW, Chem. Rev 2012, 112, 5147–92; [DOI] [PubMed] [Google Scholar]; Härd T, Lendel C, J. Mol. Biol 2012, 421, 441–465; [DOI] [PubMed] [Google Scholar]; LeVine H, Walker LC, Neurobiol. Aging 2016, 42, 205–212; [DOI] [PMC free article] [PubMed] [Google Scholar]; Ladiwala ARA, Dordick JS, Tessier PM, J. Biol. Chem 2011, 286, 3209–3218; [DOI] [PMC free article] [PubMed] [Google Scholar]; Reinke AA, Gestwicki JE, Chem. Biol. Drug Des 2011, 77, 399–411; [DOI] [PMC free article] [PubMed] [Google Scholar]; Cao FP, Raleigh DP, Biochemistry 2012, 51, 2670–2683. [DOI] [PMC free article] [PubMed] [Google Scholar]; Ren B, Liu Y, Zhang Y, Cai Y, Gong X, Chang Y, Xu L, & Zheng J ACS Chem. Neuro, 2018, 9, 1215–1224; [DOI] [PubMed] [Google Scholar]; Ren B, Liu Y, Zhang Y, Zhang M, Sun Y, Liang G, Xu J, & Zheng J J. of Mat. Chem. B, 2018, 6, 56–67. [DOI] [PubMed] [Google Scholar]
- 2.Schürmann M, Janning P, Ziegler S, Waldmann H, Cell Chem. Biol 2016, 23, 435–441; [DOI] [PubMed] [Google Scholar]; Khera N, Rajput S, J. Cell. Biochem 2017, 118, 959–961; [DOI] [PubMed] [Google Scholar]; Copeland RA, Boriack-Sjodin PA, Cell Chem. Biol 2018, 25, 128–134; [DOI] [PubMed] [Google Scholar]; Young LM, Ashcroft AE, Radford SE, Curr. Opin. Chem. Biol 2017, 39, 90–99; [DOI] [PMC free article] [PubMed] [Google Scholar]; Nat. Chem. Biol 2010, 6, 157–157. [DOI] [PubMed] [Google Scholar]
- 3.Pithadia AS, Bhunia A, Sribalan R, Padmini V, Fierke CA, Ramamoorthy A, Chem. Commun 2016, 52, 942–945. [DOI] [PMC free article] [PubMed] [Google Scholar]
- 4.Meisl G, Kirkegaard JB, Arosio P, Michaels TCT, Vendruscolo M, Dobson CM, Linse S, Knowles TPJ, Nat. Protoc 2016, 11, 252–272; [DOI] [PubMed] [Google Scholar]; Crespo R, Villar-Alvarez E, Taboada P, F. a. Rocha, A. M. Damas, P. M. Martins, J. Biol. Chem 2016, 291, 2018–2032 [DOI] [PMC free article] [PubMed] [Google Scholar]
- 5.Prade E, Barucker C, Sarkar R, Althoff-Ospelt G, Lopez del Amo JM, Hossain S, Zhong Y, Multhaup G, Reif B, Biochemistry 2016, 55, 1839–1849; [DOI] [PubMed] [Google Scholar]; Young LM, Saunders JC, Mahood RA, Revill CH, Foster RJ, Tu L-H, Raleigh DP, Radford SE, Ashcroft AE, Nat. Chem 2015, 7, 73–81. [DOI] [PMC free article] [PubMed] [Google Scholar]
- 6.Citron M, Nat. Rev. Drug Discov 2010, 9, 387–398. [DOI] [PubMed] [Google Scholar]
- 7.Groenning M, J. Chem. Biol 2010, 3, 1–18. [DOI] [PMC free article] [PubMed] [Google Scholar]
- 8.Soong R, Brender JR, Macdonald PM, Ramamoorthy A, J. Am. Chem. Soc 2009, 131, 7079–7085. [DOI] [PubMed] [Google Scholar]
- 9.Brender JR, Krishnamoorthy J, Sciacca MFM, Vivekanandan S, D’Urso L, Chen J, La Rosa C, Ramamoorthy A, J. Phys. Chem. B 2015, 119, 2886–2896. [DOI] [PMC free article] [PubMed] [Google Scholar]
- 10.Jha S, Snell JM, Sheftic SR, Patil SM, Daniels SB, Kolling FW, Alexandrescu AT, Biochemistry 2014, 53, 300–310. [DOI] [PubMed] [Google Scholar]
- 11.Rodriguez Camargo DC, Tripsianes K, Buday K, Franko A, Göbl C, Hartlmüller C, Sarkar R, Aichler M, Mettenleiter G, Schulz M, et al. , Sci. Rep 2017, 7, 44041. [DOI] [PMC free article] [PubMed] [Google Scholar]
- 12.Kotler SA, Brender JR, Vivekanandan S, Suzuki Y, Yamamoto K, Monette M, Krishnamoorthy J, Walsh P, Cauble M, Holl MMB, et al. , Sci. Rep 2015, 5, 11811; [DOI] [PMC free article] [PubMed] [Google Scholar]
Associated Data
This section collects any data citations, data availability statements, or supplementary materials included in this article.


