
Fig. 2.
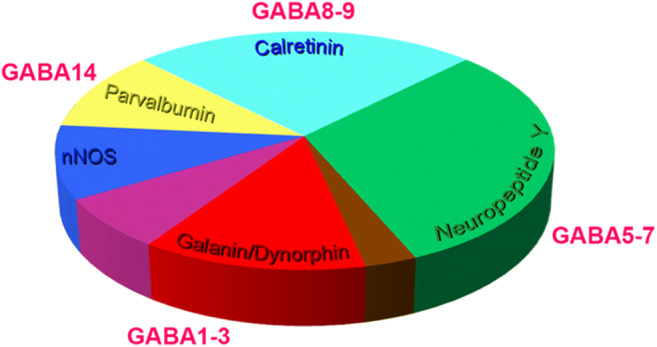
Neurochemical features of spinal inhibitory interneurons in laminae I and II. The estimated proportions of all inhibitory interneuron populations, as defined by their neurochemical profiles, are presented in the pie chart (modified from reference 10]. Four segments of this chart (parvalbumin, calretinin, neuropeptide Y, and galanin/dynorphin populations) correspond well with molecular clusters of inhibitory interneurons identified in single-cell RNA sequencing studies [12]. Taken together, these datasets provide a means of devising intersectional strategies to target subpopulations of interneuron with greater precision than possible previously