

INTRODUCTION
Potential overprescribing of opioids after surgery may contribute to opioid-related adverse events.1,2 The proportion of opioid naïve patients with a new opioid prescription within seven days after total knee arthroplasty (TKA) rose from 79.1% in 2004 to 82.0% in 20123. The DEA in 20144, CDC in 20165, and health systems, state governments, and health payers, implemented myriad policies to restrict opioid overprescribing. The impact of these policies on post-operative opioid prescribing is unknown. We examined rates of opioid prescribing and level of pain control in patients who underwent total hip arthroplasty (THA) and TKA from 2014 to 2017.
METHODS
This retrospective cohort study used the Optum® de-identified Electronic Health Record (EHR) dataset which includes more than 90 million patients from 38 hospital networks and 18 non-network hospitals in the US. We selected patients who underwent THA or TKA in an inpatient setting in 2014–2017 from the hospital networks (eTable in the Supplement). We analyzed whether patients received any opioid prescriptions from discharge to 60 days after discharge. Among those who received any opioid prescriptions, we calculated total morphine milligram equivalent dose prescribed in the study period.
We created level of pain at discharge by using an average pain score for all observations on the day closest to discharge. We used the same procedure to identify level of pain within 2 months post discharge at each time period, 7–14, 15–21, 22–29, 30–44, and 45–60 days.
We presented descriptive statistics on opioid prescription by years and separately for THA and TKA. Multivariable logistic regression models were built to assess characteristics associated with receiving opioid prescription within 60 days of discharge. Statistical significance was set at p<0.05. All analyses were performed using SAS statistical software version 9.4 (SAS Institute, Cary, NC).
RESULTS
Of 236,631 patients, 86,058 underwent THA at a mean (SD) age of 64.48 (11.17) and 150,573 underwent TKA at a mean age of 65.99 (9.59) (Table). A majority of patients were female and Caucasian.
Table.
Baseline Characteristics of Study Participants and Adjusted Odds Ratios of Receiving at least One Opioid Prescription Within 60 Days of Discharge After Total Hip or Knee Arthroplastya
| THA (n=86,058) | TKA (n=150,573) | |||||||||
|---|---|---|---|---|---|---|---|---|---|---|
| Patient Characteristicsa | N | % | OR | 95% CI | N | % | OR | 95% CI | ||
| Year of Surgery | ||||||||||
| 2014 | 18940 | 22.01 | 1.00 | 35267 | 23.42 | 1.00 | ||||
| 2015 | 21692 | 25.21 | 1.36 | 1.29 | 1.44 | 38595 | 25.63 | 1.42 | 1.36 | 1.47 |
| 2016 | 23228 | 26.99 | 1.66 | 1.57 | 1.75 | 39485 | 26.22 | 1.85 | 1.77 | 1.93 |
| 2017 | 22198 | 25.79 | 1.92 | 1.81 | 2.03 | 37226 | 24.72 | 2.40 | 2.30 | 2.52 |
| Level of pain at discharge | ||||||||||
| 0 | 5247 | 6.10 | 1.00 | 7316 | 4.86 | 1.00 | ||||
| 1–3 | 35372 | 41.10 | 1.38 | 1.28 | 1.49 | 48270 | 32.06 | 1.40 | 1.31 | 1.50 |
| 4–6 | 37824 | 43.95 | 1.50 | 1.39 | 1.62 | 76599 | 50.87 | 1.50 | 1.40 | 1.60 |
| 7–10 | 7615 | 8.85 | 1.32 | 1.20 | 1.46 | 18388 | 12.21 | 1.38 | 1.28 | 1.48 |
| Age at THA/TKA admission, mean (SD) | 64.48 | 11.17 | 65.99 | 9.59 | ||||||
| Age Category | ||||||||||
| <55 | 14906 | 17.32 | 1.00 | 17461 | 11.60 | 1.00 | ||||
| 55–64 | 27662 | 32.14 | 0.88 | 0.82 | 0.94 | 48598 | 32.28 | 0.85 | 0.81 | 0.91 |
| 65–74 | 26948 | 31.31 | 0.74 | 0.68 | 0.79 | 54567 | 36.24 | 0.74 | 0.70 | 0.79 |
| 75+ | 16542 | 19.22 | 0.55 | 0.51 | 0.60 | 29947 | 19.89 | 0.57 | 0.54 | 0.62 |
| Gender | ||||||||||
| Female | 46684 | 54.25 | 1.00 | 92726 | 61.58 | 1.00 | ||||
| Male | 39374 | 45.75 | 1.06 | 1.02 | 1.11 | 57847 | 38.42 | 1.04 | 1.01 | 1.07 |
| Race/Ethnicityb | ||||||||||
| Caucasian | 75604 | 87.85 | 1.00 | 129232 | 85.83 | 1.00 | ||||
| African American | 6177 | 7.18 | 0.79 | 0.74 | 0.86 | 11299 | 7.50 | 0.86 | 0.81 | 0.92 |
| Hispanic | 1660 | 1.93 | 0.60 | 0.53 | 0.68 | 4371 | 2.90 | 0.53 | 0.49 | 0.57 |
| Smoking Statusb,c | ||||||||||
| Current smoker | 13479 | 15.66 | 1.00 | 18178 | 12.07 | 1.00 | ||||
| Not currently smoking | 37234 | 43.27 | 0.86 | 0.81 | 0.92 | 66673 | 44.28 | 0.88 | 0.83 | 0.92 |
| Never smoked | 30762 | 35.75 | 1.07 | 1.01 | 1.15 | 57750 | 38.35 | 1.23 | 1.17 | 1.30 |
| Insuranceb | ||||||||||
| Commercial/Other (1 insurance) | 38640 | 44.90 | 1.00 | 62580 | 41.56 | 1.00 | ||||
| Medicare Only | 28,622 | 33.26 | 1.28 | 1.21 | 1.37 | 52797 | 35.06 | 1.28 | 1.22 | 1.34 |
| Medicaid Only | 3011 | 3.50 | 1.29 | 1.13 | 1.47 | 4298 | 2.85 | 1.18 | 1.06 | 1.32 |
| 2 or More Insurances | 11465 | 13.32 | 0.61 | 0.57 | 0.65 | 23729 | 15.76 | 0.56 | 0.53 | 0.59 |
| Anxiety | 13937 | 16.19 | 0.93 | 0.88 | 0.99 | 26086 | 17.32 | 1.01 | 0.97 | 1.06 |
| Depression | 16354 | 19.00 | 1.08 | 1.01 | 1.14 | 36101 | 23.98 | 0.98 | 0.94 | 1.02 |
| Substance Use Disorders | 4213 | 4.90 | 0.99 | 0.89 | 1.09 | 4979 | 3.31 | 0.92 | 0.85 | 1.01 |
| Number of Condition Categories, mean (SD) | 2.74 | 2.26 | 1.05 | 1.04 | 1.06 | 3.12 | 2.28 | 1.09 | 1.08 | 1.10 |
| Condition Categoriesd | ||||||||||
| Arrhythmia | 13348 | 15.51 | 25366 | 16.85 | ||||||
| Atherosclerosis | 11233 | 13.05 | 21281 | 14.13 | ||||||
| Cancer | 8744 | 10.16 | 15323 | 10.18 | ||||||
| Cellulitis | 2391 | 2.78 | 4743 | 3.15 | ||||||
| CHF | 3506 | 4.07 | 6561 | 4.36 | ||||||
| COPD | 7530 | 8.75 | 12606 | 8.37 | ||||||
| Dementia | 1506 | 1.75 | 2806 | 1.86 | ||||||
| Diabetes | 14116 | 16.40 | 34801 | 23.11 | ||||||
| Dialysis | 95 | 0.11 | 146 | 0.10 | ||||||
| Fluid or metabolic disorder | 7246 | 8.42 | 12828 | 8.52 | ||||||
| Hemolytic disorder | 211 | 0.25 | 287 | 0.19 | ||||||
| Hypertension | 52116 | 60.56 | 103799 | 68.94 | ||||||
| Major symptoms, abnormalities | 45451 | 52.81 | 86404 | 57.38 | ||||||
| Malnutrition | 406 | 0.47 | 395 | 0.26 | ||||||
| Metastatic cancer | 314 | 0.36 | 371 | 0.25 | ||||||
| Morbid obesity | 9086 | 10.56 | 25868 | 17.18 | ||||||
| Other injuries | 11991 | 13.93 | 28550 | 18.96 | ||||||
| Paralysis | 799 | 0.93 | 1300 | 0.86 | ||||||
| Pneumonia | 1499 | 1.74 | 2706 | 1.80 | ||||||
| Polyneuropathy | 8347 | 9.70 | 16993 | 11.29 | ||||||
| Psychiatric | 4314 | 5.01 | 8528 | 5.66 | ||||||
| Renal failure | 6993 | 8.13 | 13514 | 8.98 | ||||||
| Rheumatoid arthritis | 6037 | 7.02 | 10428 | 6.93 | ||||||
| Severe infection | 7186 | 8.35 | 13863 | 9.21 | ||||||
| Stroke | 920 | 1.07 | 1693 | 1.12 | ||||||
| Ulcer | 738 | 0.86 | 1219 | 0.81 | ||||||
| Vascular disorder | 9261 | 10.76 | 16801 | 11.16 | ||||||
Patients received THA or TKA in 2014–2017 from Optum EHR data which contains structured information, such as diagnosis, procedure codes, lab results and observations, including vital signs, blood pressure, pain and body mass index (BMI). It also contains unstructured information in the form of clinical notes from office visits, consultation reports, discharge summaries and reports from nursing records, pathology, radiology and cardiology. Using a natural language processing (NLP) system, Optum staff extract these unstructured data and organize them into structured fields for clinical assessment. Clinical measurements include numeric fields from clinical notes such as blood pressure, pain and BMI. We identified THA or TKA using ICD-9, ICD-10, or CPT codes (THA: ICD-9, 81.51; ICD-10, 0SR90J9, 0SR90JA, 0SR90JZ, 0SRB0J9, 0SRB0JA, 0SRB0JZ; CPT, 27130; TKA: ICD-9, 81.54; ICD-10, 0SRC07Z, 0SRC0JZ, 0SRC0KZ, 0SRC0LZ, 0SRD07Z, 0SRD0JZ, 0SRDD0KZ, 0SRD0LZ, 0SRT07Z, 0SRT0JZ, 0SRT0KZ, 0SRU07Z, 0SRU0JZ, 0SRU0KZ, 0SRV07Z, 0SRV0JZ, 0SRV0KZ, 0SRW07Z, 0SRW0JZ, 0SRW0KZ; CPT, 27447).
Other or unknown categories were included in the model, but not reported.
Smoking status (never, former, current, other) were obtained from clinical observations found in the EHR and were taken from the observation nearest to the day of discharge, up to 6 months prior to the date of discharge. When there were multiple recorded statuses for smoking or selected, we recorded the most severe category with the “other” category being the least severe (i.e. current smoker, former smoker, never smoker, other).
The number of condition categories were included in the model, not as individual, separate conditions. These condition categories came from the CMS report on hospital readmission for hip or knee arthroplasty and additional conditions, including anxiety, depression, and substance use disorder. All of these condition category variables were assessed in the 12 months prior to the joint arthroplasty.
From 2014 to 2017, the proportion of patients who received an opioid prescription within 60 days of discharge increased from 81.9% to 91.5% after TKA and 82.0% to 89.7% after THA. The mean of total MME prescribed within 60 days increased for both groups from 2014–2015, stayed stable from 2015–2016, and decreased from 2016–2017. The mean [SD] level of pain at discharge remained similar across years after THA (2014: 3.28 [2.02]; 2015: 3.43 [1.96]; 2016: 3.51 [1.94]; 2017: 3.42 [1.92]) and TKA (2014: 3.73 [2.02]; 2015: 3.87 [1.97]; 2016: 3.90 [1.94]; 2017: 3.90 [1.96]). Across years, the trajectory of post-operative pain from 7–14 days to 45–60 days post-discharge was similar after THA and TKA (Figure).
Figure.
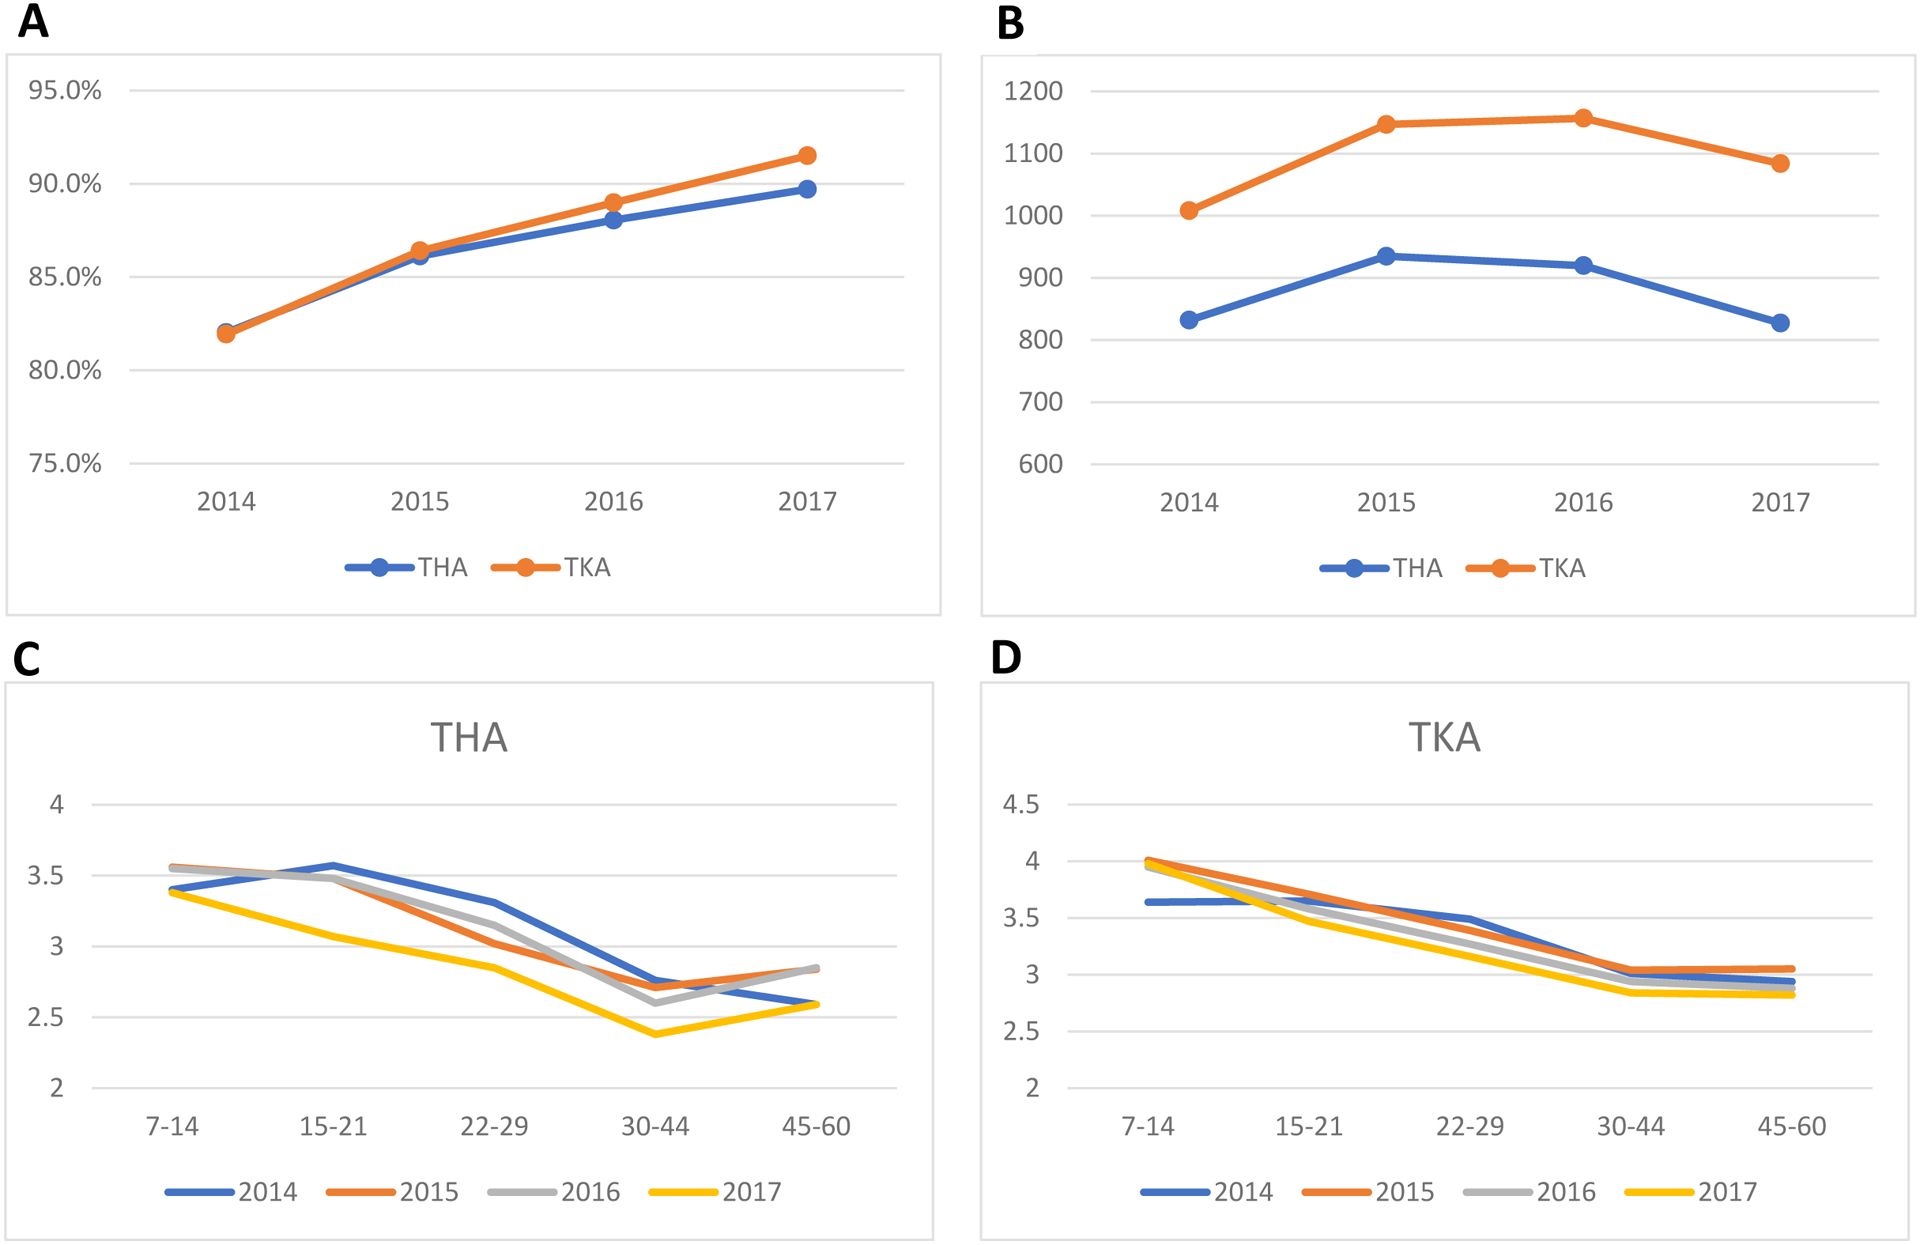
(A) Percentage of patients receiving any opioid prescription within 60 days of discharge after THA and TKA in 2014–2017a; (B) Mean of total opioid morphine milligram equivalent dose prescribed within 60 days of discharge after THA and TKA in 2014 −2017b; Mean pain scores post-discharge by year of surgery for (C) THA and (D) TKAc.
aTo capture opioid prescriptions possibly for post-discharge use, we included opioid prescribed up to 2 days before discharge, which accounted for additional 32% of patients received opioid in the study period.
bAbout 9.7% of patients with missing information on quantify prescribed were excluded and resulted in 67,579 THA and 118,473 TKA patients included in the analyses.
cThe pain variable from the 0-to-10 visual analogue scale was used when available. When the 0-to-10 structured data was not available, pain was obtained from the NLP-created structured fields for clinical measurements. This was done by selecting measurement records where the assessment term was “pain.” Values were excluded that were assessed on a different scale (e.g., 0 to 100) or were not numeric (e.g., “increased”). Number of patients with pain measurement at each period were 9,482, 5,628, 6,071, 10,053, and 7,226 for those with THA, and 21,689, 16,020, 17,691, 24,906, and 18,965 for those with TKA. Overall, 81.8% of pain value came from structured data.
In patients after THA, a more recent year of surgery (2015: aOR=1.36, CI=1.29–1.44; 2016: aOR=1.66, CI=1.57–1.75; 2017: aOR=1.92, CI=1.81–2.03), higher pain at discharge (1–3: aOR=1.38, CI=1.28–1.49; 4–6: aOR=1.50, CI=1.39–1.62; 7–10: aOR=1.32, CI=1.20–1.46), depression (aOR=1.08, CI-1.01–1.14), and each additional condition category (aOR=1.05, CI=1.04–1.06) were associated with higher odds of receiving at least one opioid prescription within 60 days of discharge (Table). Other significant predictors include male gender, former smokers, and being insured under Medicare or Medicaid only. Predictors were similar in patients after TKA.
DISCUSSION
There was a substantial increase, from 2014 to 2017, in the percentages of patients receiving opioids after THA and TKA, with no clinically meaningful improvement in post-operative pain level at discharge or even at two months post-surgery. These findings suggest that the impacts of policies aimed at curbing post-operative opioid overprescribing have been minimal. Our findings underscore the need to monitor effectiveness of policies in the “real world setting,” given the substantial amount of resources devoted to their implementations. More research is needed on opioid prescribing patterns over a longer time as new policies arise. Such research can inform development of effective approaches to reducing opioid overprescribing and improving post-operative pain control.6
This study has limitations, including its retrospective design, lack of data on whether patients actually used the prescribed opioids, and inability to evaluate impacts of individual policies and regulations on prescribing.
Supplementary Material
ACKNOWLEDGEMENTS
Financial Disclosure: This work was supported by grants R01-DA039192 and UL1TR001439 from the National Institute on Drug Abuse, National Institutes of Health.
Footnotes
Conflict of Interest: The authors have no financial, personal, or other potential conflicts of interest to disclose. The funding organizations had no role in design and conduct of the study; collection, management, analysis, and interpretation of the data; preparation, review, or approval of the manuscript; and decision to submit the manuscript for publication.
REFERENCES
- 1.Neuman MD, Bateman BT, Wunsch H. Inappropriate opioid prescription after surgery. Lancet. 2019;393(10180):1547–1557. [DOI] [PMC free article] [PubMed] [Google Scholar]
- 2.Bicket MC, Long JJ, Pronovost PJ, Alexander GC, Wu CL. Prescription Opioid Analgesics Commonly Unused After Surgery: A Systematic Review. JAMA Surg. 2017;152(11):1066–1071. doi: 10.1001/jamasurg.2017.0831. [DOI] [PMC free article] [PubMed] [Google Scholar]
- 3.Wunsch H, Wijeysundera DN, Passarella MA, Neuman MD. Opioids Prescribed After Low-Risk Surgical Procedures in the United States, 2004–2012. JAMA. 2016;315(15):1654–1657. [DOI] [PMC free article] [PubMed] [Google Scholar]
- 4.Drug Enforcement Administration. Schedules of Controlled Substances: Rescheduling of Hydrocodone Combination Products From Schedule III to Schedule II. Federal Register. https://www.federalregister.gov/documents/2014/08/22/2014-19922/schedules-of-controlled-substances-rescheduling-of-hydrocodone-combination-products-from-schedule. 2014. Accessed January 12, 2020. [PubMed] [Google Scholar]
- 5.CDC Guideline for Prescribing Opioids for Chronic Pain — United States, 2016. MMWR Recomm Rep. 2016;65. [DOI] [PubMed] [Google Scholar]
- 6.Parvizi J, Miller AG, Gandhi K. Multimodal pain management after total joint arthroplasty. J Bone Joint Surg Am. 2011;93(11):1075–1084. [DOI] [PubMed] [Google Scholar]
Associated Data
This section collects any data citations, data availability statements, or supplementary materials included in this article.