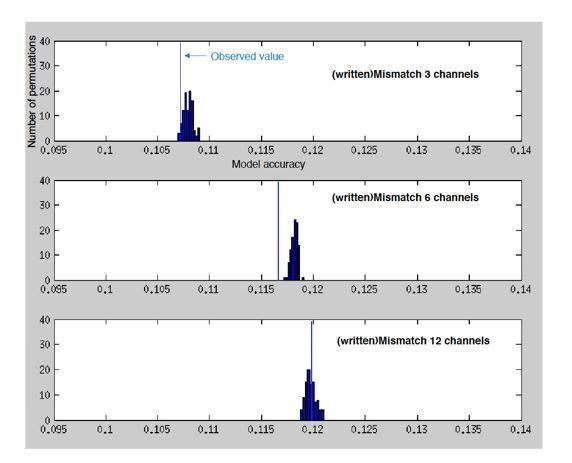
Author response image 2. Histograms showing the number of permutations (random shuffles of feature space across trials) as a function of (binned) model accuracy when predicting the MEG response from the spectrotemporal modulation representation of mismatching text.

Vertical blue lines indicate the observed (non-permuted) model accuracies.
