

Abstract
Objectives:
To examine the associations between nursing home (NH) quality and prevalence of newly admitted NH residents with Alzheimer’s disease and related dementias (ADRD), and to assess the extent to which market-level wages for certified nurse assistants (CNAs) and state Medicaid behavioral/mental health add-on policy may influence such associations.
Design:
Retrospective cohort study.
Setting and Participants:
The analytical sample included 2,777 NHs with either high- or low-quality, located in urban areas of 41 states from 2011 to 2014.
Methods:
The outcome variable was the prevalence of ADRD among newly admitted NH residents. NH quality was defined as dichotomous, based on the Nursing Home Compare (NHC) star rating system. We considered a NH with 5-star rating as having high-quality and with 1-star rating as having low-quality. Information on county-level CNA wages and state Medicaid behavioral/mental health add-on policies was included. Linear regression models with NH random effects and robust standard errors were estimated. A set of sensitivity analyses were performed.
Results:
After accounting for NH-level aggregated resident characteristics and market/state level factors, the prevalence of ADRD among newly admitted residents was 3% lower in high-quality NHs compared to low-quality NHs (P < 0.01). A one-dollar increase in CNA hourly wage was associated with a 0.9 percentage point decrease in the prevalence of ADRD among newly admitted residents (P < 0.01). State Medicaid behavioral/mental health add-on policy was associated with a 2.5 percentage point increase in the prevalence of ADRD in high-quality NHs (P < 0.05), but not in low-quality NHs.
Conclusions and Implications:
Our findings suggest that high-quality NHs are less likely to admit residents with ADRD. The effect size of this relationship is modest and may be influenced by state Medicaid behavioral/mental health add-on policies. Future studies are needed to better understand reasons leading to these association so that effective interventions can be developed to incentivize high-quality NHs to more readily serve residents with ADRD.
Keywords: Alzheimer’s disease and related dementias, nursing home residents, certified nurse assistants, state Medicaid behavioral/mental health add-on policy
Brief summary:
This study suggested that residents with ADRD are less likely to be admitted to high-quality NHs and state Medicaid add-on policies may attenuate these barriers. Higher CNA wages were associated with a lower prevalence of ADRD in NHs.
Introduction:
The population of individuals with Alzheimer’s disease and related dementias (ADRD) has grown rapidly in the U.S.. By 2060 the number of older adults (age ≥ 65) with ADRD is expected to reach almost 14 million, compared to 5 million in 2014.1 Nearly 12.5% of individuals with ADRD live in NHs, making this an important care setting for this vulnerable population.2
There are concerns that residents with ADRD may experience barriers in entering high-quality NHs and thus possibly receive less than optimal care.3–6 These residents may have special care needs compared to other residents – for example, many are likely to develop behavioral and psychological symptoms, such as verbal or physical aggressiveness.7–11 This may place additional strain on staff and affect the quality of care for both residents with and without ADRD.7,10,12,13 Proper care to accommodate these needs and the delivery of high quality dementia care can be resource intensive and potentially costly.14–18 There has also been a concern that Medicaid payment policies do not sufficiently reimburse NHs for the care that residents with ADRD who may require to treat behavioral symptoms associated with their illness.3,4 Therefore, NHs, especially high-quality NHs, may have disincentives to admitting residents with ADRD. High-quality NHs is generally in higher demand and with longer waiting list, and thus these NHs are more likely to be more selective of residents,19–21 particularly if residents have greater care needs and are potentially less profitable.
NH payment policies may modify NHs’ incentives to admit high-need residents.22–25 To assist with the care for residents with behavioral or mental health conditions, fourteen states have implemented Medicaid add-on policies that provide supplemental payments to NHs serving Medicaid residents with these conditions.26–28 Although some studies have suggested that an add-on payment policy may be associated with improved care delivered to patients receiving some types of services (e.g. patients in hospice),29 it is unknown whether the state Medicaid behavioral/mental health add-on policy is related to admissions of residents with ADRD in NHs, especially in high-quality NHs.
In addition, care costs may also affect a NH’s decision to admit high-need residents. Staffing is a major component of NH costs. Certified nursing assistants (CNAs) account for the largest proportion of staff in NHs and provide the most direct care to residents.30–32 Providing appropriate care to residents with ADRD, such as non-pharmacological approaches to manage residents’ behavioral issues, is labor intensive and generally requires higher levels of CNA staffing.33 Therefore, in markets with higher CNA wages, investment in CNA staffing can be more costly and thus may further disincentivize NHs to admit ADRD residents.34,35 However, empirical evidence on the relationship between market-level wages for direct care workers and access to high-quality NHs among ADRD residents is limited.
To address these gaps in knowledge, we examined the association between NH quality and prevalence of newly admitted residents with ADRD, and assessed whether such association can be affected by costs of care, specifically market-level CNA wages, and by state Medicaid behavioral/mental health add-on policy.
Methods
Data.
The 2011–2014 Nursing Home Compare (NHC) and the Minimum Data Set (MDS) 3.0 were linked at the NH level. The MDS contains information on residents’ demographics as well as their functional, cognitive, diagnostic, and therapeutic status, for all residents admitted to Medicaid and/or Medicare certified NHs in the US. The NHC contains information on NHs’ five-star-rating quality measures and is a tool for consumers to compare quality between NHs. Occupational Employment Statistics (OES) data for 2011–2014 were obtained and linked to NH level data at the metropolitan area (MSA) level. The OES contains annual employment and wage estimates for over 800 occupations. State Medicaid per diem rates and Medicaid policies on behavioral/mental add-on payment were collected from the American Health Care Association reports, sates government websites, and the Medicaid and CHIP Payment and Access Commission (MACPAC).26–28,36
Study population.
The analytical sample included 2,777 NHs with either high- or low-quality care (discussed below), located in urban areas in 41 states from 2011 to 2014. We excluded NHs in rural areas because market-level variables (e.g. CNA hourly wage, hourly wages of the registered nurse [RN] and the licensed practice nurse [LPN], and unemployment rate) for these areas were not collected by the OES. Lastly, we restricted the analysis to 41 states with available data on Medicaid payment policies.
Variables.
The outcome variable was the prevalence of ADRD among newly admitted NH residents. Identification of ADRD was based on the checkbox as well as on the ICD-9-CM codes from the MDS 3.0. Newly admitted residents were defined as those who did not have any NH episodes in 30 days prior to the index NH admission. If a resident had multiple eligible “new” admissions, we only counted the first NH admission.
The main variables of interest included NH quality, constructed from the NHC data, county-level CNA hourly wages, obtained from the OES data, and state Medicaid dementia/behavioral add-on policy based on the available MACPAC data.26 The determination of high- and low-quality NHs was based on each NH’s overall five-star rating in the baseline year (i.e. 2011). We used 2011 data to define quality so that NHs included in this study were consistently observed for the whole study period. We considered NHs with 5-star as high-quality facilities and those with 1-star as low-quality facilities because NHs’ star rating fluctuated and these 2 rating are more likely to reflect good vs. poor quality. This identification of high- versus low-quality NHs was also consistent with prior research.6,37,38 We also included interactions between NH quality and county-level CNA wages, as well as the interaction between NH quality and Medicaid add-on policies, to examine whether the relationship between ADRD admission and NH quality can be modified by CNA wages and Medicaid add-on policy.
In addition, for each year we accounted for NH-level aggregate individual characteristics, such as age, sex, race, percentage of residents admitted from hospital, chronic conditions, functional status, and case-mix index. Chronic conditions included cancer, respiratory failure, asthma, diabetes, coronary artery disease, heart failure, peripheral vascular disease, hypertension, and stroke. Functional status was based on the activities of daily living (ADL) score, and case-mix index was based on resource utilization groups (RUGs IV). These factors may affect residents’ needs for NH care as well as NHs’ ability to admit new residents. We also controlled for other state Medicaid NH policies (Medicaid per-diem rate and whether the reimbursement policy used case-mix methods), as well as market-level covariates (Herfindahl-Hirschman Index, RN and LPN hourly wages, CMS wage index, unemployment rate, and the number of home health aides [HHA] per 1,000 jobs). We used the HHA per 1,000 jobs as a proxy for the availability of health workers in community-based care. These state and market factors may affect NH admission of residents with ADRD.
Analysis.
All analyses were conducted at the NH level. We compared the aggregated individual characteristics, including the prevalence of ADRD, among residents newly admitted to high-versus low-quality NHs, as well as the characteristics of the markets where high- and low-quality NHs were located. We then fit three linear models with NH random effects and robust standard errors to examine the relationship between NH quality and the prevalence of ADRD among the newly admitted residents. The first model included only NH quality as the independent variable. In the second model, we added the CNA hourly wages, add-on policy indicator and other covariates to examine their effect on admission of ADRD residents. The interactions between NH quality and market- and state-level variables were introduced in the third model to examine whether and how the relationship between ADRD admissions and NH quality was modified by these two factors. We did not account for additional NH level characteristics such as ownership status, number of beds, and bed occupancy because they could be related to the quality of NH.
Lastly, we performed several sensitivity analyses to examine the robustness of the findings. First, we excluded NHs with great variations in quality rating over the years, including high-quality NHs whose star rating switched to 3 or lower and low-quality NHs whose star rating raised to 4 or higher during the study period. We used star-rating of 3 as the cut-off point for high- versus low-quality NHs, because the mean star-rating of NHs is 3.39 Overall, the proportion of NH switching from low-quality to high-quality was similar to those switching from high-quality to low-quality (about 30% NHs in each group). Second, we added county fixed-effects to control for time-invariant county-level factors that may affect NH admissions among individuals with ADRD (e.g. supply of community-based care). The county-fixed effects also accounted for all state-level time-invariant factors. Third, we excluded counties with only high- or low-quality NHs. Lastly, we redefined high-quality NHs as having 5- or 4-stars and redefined low-quality NHs as having 1-, 2-, or 3-stars, then repeated all the analyses.
All analyses were performed using STATA 14 (StataCorp LLC. College Station, TX.)
Results
In 2011, the overall prevalence of ADRD among newly admitted residents was 32% and 36%, in high- and low-quality NHs, respectively (Table 1). Residents admitted to high-quality NHs seemed to have fewer comorbidities. For example, the prevalence of heart failure, diabetes, stroke and respiratory failure was lower among residents admitted to high-quality NHs compared to those admitted to low-quality NHs. Residents admitted to high-quality NHs also appeared to be less functionally impaired (i.e. lower ADL score) than those admitted to low-quality NHs.
Table 1.
Characteristics of low and high quality NHs at the baseline year 2011
| Variable | Low-quality NHs N=1494 | High-quality NHs N=1283 | p value | |
|---|---|---|---|---|
| Mean (SD) / N (%) | Mean (SD) / N (%) | |||
| Dependent Variable | Prevalence of ADRD among new admissions (%) | 35.61(13.8) | 31.67(16.38) | <0.01 |
| Key Independent Variables | CNA hourly wage | 12.12(1.27) | 12.48(1.50) | <0.01 |
| State Medicaid Behavioral / mental add-on (Yes) | 38(2.54%) | 36(2.82%) | 0.64 | |
| State Medicaid per diem rate | 167.23(31.26) | 176.89(29.16) | <0.01 | |
| Other State/Market factors | Case-mix reimbursement (Yes)* | 1033(69.15%) | 791(61.64%) | <0.01 |
| CMS wage index | 0.99(0.13) | 1.03(0.16) | <0.01 | |
| Herfindahl-Hirschman index | 0.02(0.05) | 0.01(0.04) | 0.05 | |
| RN hourly wage | 32.34(4.66) | 33.45(5.23) | <0.01 | |
| LPN hourly wage | 20.58(2.36) | 21.10(2.67) | <0.01 | |
| HHA per 1000 jobs | 7.12(4.07) | 6.72(3.43) | 0.01 | |
| Unemployment rate (%) | 8.83(2.07) | 8.59(2.23) | <0.01 | |
| Aggregated case-mix characteristics | Average age of residents | 80.03(2.68) | 82.4(3.21) | <0.01 |
| Average ADL score | 16.83(2.56) | 16.44(2.87) | <0.01 | |
| Average case-mix index based on RUG4 groups | 1.29(0.17) | 1.26(0.18) | <0.01 | |
| Percentage of residents from hospital (%) | 0.67(0.16) | 0.70(0.18) | <0.01 | |
| Percentage of male (%) | 0.41(0.12) | 0.35(0.12) | <0.01 | |
| Percentage of white (%) | 0.76(0.26) | 0.86(0.23) | <0.01 | |
| Percentage of black (%) | 0.15(0.21) | 0.07(0.15) | <0.01 | |
| Percentage of other race (%) | 0.10(0.16) | 0.07(0.16) | <0.01 | |
| Cancer Prevalence (%) | 0.09(0.06) | 0.08(0.06) | 0.19 | |
| Coronary artery disease prevalence (%) | 0.21(0.1) | 0.20(0.11) | 0.65 | |
| Heart failure prevalence (%) | 0.22(0.09) | 0.21(0.10) | <0.01 | |
| Peripheral vascular disease prevalence (%) | 0.06(0.06) | 0.06(0.05) | <0.01 | |
| Diabetes prevalence (%) | 0.35(0.10) | 0.29(0.12) | <0.01 | |
| Hypertension prevalence (%) | 0.76(0.12) | 0.76(0.12) | 0.49 | |
| Asthma prevalence (%) | 0.25(0.09) | 0.22(0.10) | <0.01 | |
| Stroke prevalence (%) | 0.15(0.08) | 0.13(0.08) | <0.01 | |
| Respiratory failure prevalence (%) | 0.04(0.08) | 0.02(0.06) | <0.01 |
Case-mix reimbursement refers to how Medicaid pays NHs for the care of long-term care residents. This method aims to account for differences in the mix of resident attributes across NHs.
Table 2 presents the results from the linear regression models with NH random effects. Model-1 estimated the overall relationship between the prevalence of ADRD and NH quality (i.e. without controlling for other covariates), and suggested that the prevalence of ADRD among newly admitted NH residents was 3% lower in high-quality HNs compared to low-quality NHs (P<0.01). This relationship remained after we controlled for additional resident conditions, market- and state-level factors (Model-2). In addition, several market- and state-level variables appeared to be associated with the prevalence of ADRD admissions. As presented in Model-2, higher CNA wages were associated with a lower prevalence of ADRD: a one dollar increase in CNA hourly wage was associated with a decreased ADRD prevalence by 0.9 percentage point. State behavioral/mental add-on policy was associated with a 1.2 percentage point increase in ADRD prevalence (Table 2, Model 2).
Table 2.
Regressions of NH Quality on ADRD% among New Admissions from 2011–2014
| Model 1 Coefficient (robust standard errors) | Model 2 Coefficient (robust standard errors) | Model 3 Coefficient (robust standard errors) | |
|---|---|---|---|
| High Quality NHs | −2.995*** (0.539) |
−3.213*** (0.501) |
−3.432*** (0.515) |
| CNA hourly wage | -- | −0.891*** (0.253) |
−0.885*** (0.281) |
| High Quality NHs × Centered CNA hourly wage | -- | -- | 0.0728 (0.279) |
| Behavioral/Mental add-on | -- | 1.172** (0.504) |
0.191 (0.555) |
| High Quality NHs × Behavioral/Mental add-on | -- | -- | 2.151** (0.990) |
| Other State/Market factors | -- | Y | Y |
| Aggregated case-mix characteristics | -- | Y | Y |
| Years fixed effects | -- | Y | Y |
| Number of NHs | 2777 | 2777 | 2777 |
Model 1 only included the NH quality dummy variable. Model 2 also includes other state/market factors and aggregated case-mix characteristics that were listed in Table 1. In addition, years fixed effects were included in Model 2. Model 3 added the two interaction terms based on Model 2. Full models are shown in the Appendix-Table 1.
Random effect model grouped by facility
P < 0.10,
P < 0.05,
P < 0.01
As presented in Model-3, the interaction between CNA wages and high-quality NHs was not statistically significant. However, state behavioral/mental add-on policy was related to increased ADRD admissions, but mainly in high-quality NHs (i.e. the coefficient for the interaction between add-on policy and high-quality NH was 2.15, P < 0.05). For ease of interpretation, we calculated the adjusted prevalence of ADRD among the newly admitted residents in high- vs. low-quality NHs in states with and without behavioral/mental add-on policies. As illustrated in Figure 1, the adjusted prevalence of ADRD admission was 28% in high-quality NHs in states without Medicaid behavioral/mental add-on policies, and it increased to 30% in states with such policies (P < 0.01). In contrast, there was no statistically significant relationship between the Medicaid behavioral/mental add-on policies and the adjusted prevalence of ADRD in low-quality NHs (31.4% and 31.6 % in states without and with add-on policies, respectively, P = 0.73).
Figure 1.
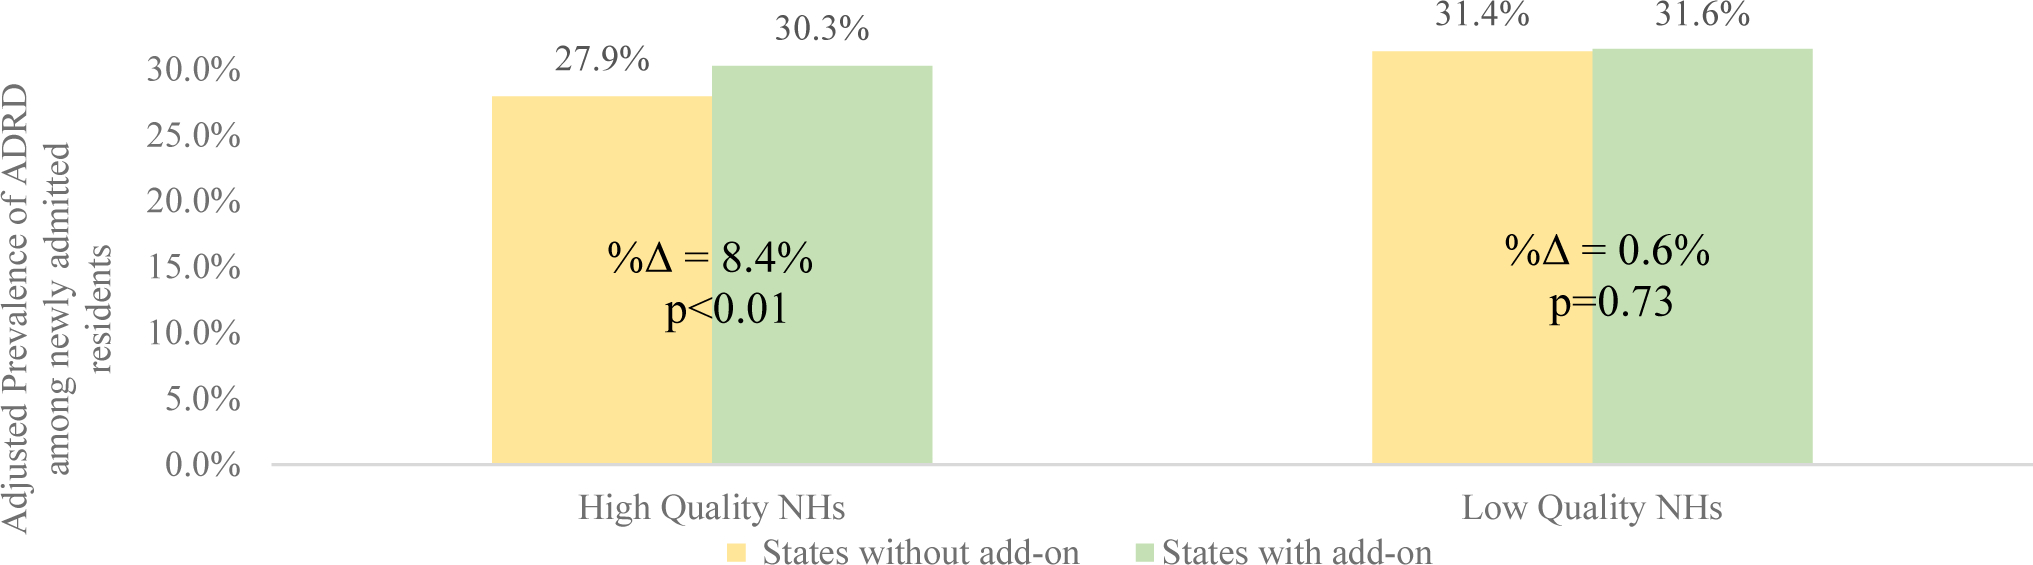
The Adjusted Prevalence of ADRD among New Admissions in NHs in States with and without Medicaid Behavioral/Mental Health Add-on Policy
The figure shows the adjusted prevalence of ADRD among new admissions in NHs in states with and without Medicaid behavioral/mental health add-on policy given the average NA hourly wage (i.e. $12.5). The adjusted prevalence of ADRD was calculated given other covariates at their mean value. Percentage point changes of prevalence of ADRD in low-quality NH relative to high-quality NH are labeled as “%Δ=”.
Our findings from the sensitivity analyses were consistent with the main analysis but with some variations (Appendix Table1). For example, the interaction between NH quality and add-on policy was not statistically significant when NHs with large changes in their star ratings were excluded (Appendix-Table 1, Model 4), although the direction and the effect size were similar to those found in Model 3. This may be due to the smaller sample size in the sensitivity analysis (about 30% of NHs were excluded). The findings from the analyses with county fixed-effects, excluding counties with either only high- or only low-quality NHs or redefining high- and low-quality NHs (Appendix-Table 1, Model 5–7) were consistent with the main findings.
Discussion
This study examined the relationship between NH quality and the prevalence of ADRD among newly admitted residents. We found the prevalence of ADRD among newly admitted residents to be lower in high-quality compared to low-quality NHs. We also found that state Medicaid behavioral/mental add-on policy was associated with an increase in the prevalence of ADRD among newly admitted residents to high-quality NHs. Higher CNA wages were associated with an overall reduction in the prevalence of ADRD newly admitted residents to high quality NHs.
Although this study is not focused on what may have caused these associations, several possibilities may be considered. It is unlikely that persons with ADRD would consistently prefer low-quality rather than high-quality NHs. However, the communities where these patients reside may limit their choices of NHs. Some studies have shown that ADRD residents were more likely to be dually eligible and have lower socio-economic status.16,40 High-quality NHs tend to be located close to relatively affluent areas,-41–43 thus high- and low-quality NHs may have different applicant pools. Therefore, it is possible that residents with ADRD are less likely to enter a high-quality NH due to the relative unavailability of high-quality NHs in their residential markets. However, reasons other than community-level factors may also contribute to the difference in ADRD prevalence by NH quality. The relationship between NH quality and admissions of ADRD residents persisted even after we accounted for county-level covariates and county fixed-effects or excluded counties with either only high- or low-quality NHs.
One possibility is that NHs make discretionary decisions when admitting residents. For example, a prior study found that post-acute patients with behavioral health disorders were less likely to be admitted to high-quality NHs (i.e. 5-star NHs).6 As previously discussed, residents with ADRD are more likely to have greater needs and are potentially less profitable than non-ADRD residents with similar comorbidities. Therefore, NHs, especially high-quality NHs, may not give admission priority to patients with underlying ADRD diagnosis.3,4 Moreover, our findings suggested that high-quality NHs are likely to be influenced by Medicaid behavioral/mental add-on policies regarding the admission of residents with ADRD. The Medicaid add-on policies provide additional payment to NHs caring for residents with cognitive impairment or behavioral issues,27,28,44 and thus may somewhat mitigate the negative financial incentives associated with the provision of care to residents with ADRD. As high-quality NHs are likely to have more discretion to which residents to admit, they may also be more sensitive to these financial incentives. We didn’t detect such relationship among low-quality NHs. Low-quality NHs, which generally have a lower occupancy rate,45 may not be able to be as selective as high-quality NHs, and thus maybe less sensitive to the additional financial incentives.
We also found that higher CNA hourly wages were associated with a lower prevalence of ADRD among newly admitted NH residents, in both high- and low-quality NHs. Investment in CNA staffing levels, which may be needed to provide appropriate levels of care to residents with ADRD, may be more costly in markets with higher wages, thus disincentivizing NHs from admitting individuals with ADRD. However, it is also likely that there are more alternative community based long-term care services available in communities with higher wages for direct care workers, thus reducing the overall demand for NH care. Unfortunately, this study was not able to differentiate between these two possibilities.
Several study limitations need to be acknowledged. Firstly, this study was only focused on the association between NH quality and the prevalence of ADRD among newly admitted residents and did not infer a causal relationship. Secondly, we used CMS’s overall five-star rating to represent overall NH quality. However, the overall five-star rating may not be the most sensitive measure of care quality provided to ADRD residents. Thirdly, this study was focused on residents who were already admitted to NHs. It is unknown whether persons with ADRD have barriers in entering NHs.
Conclusions and Implications
Our findings suggest that residents with ADRD may face some challenges in entering into high-quality NHs. State Medicaid behavioral/mental add-on policies may attenuate these barriers to some extent. Future studies are needed to understand how to effectively incentivize high-quality NHs to more readily serve residents with ADRD.
Acknowledgments
Funded by the NIA R01AG052451
Appendix:
Appendix-Table1:
Regressions of NH Quality on ADRD% among New Admissions from 2011–2014
| Model 1 β (SE) |
Model 2 β (SE) |
Model 3 β (SE) |
Model 4 β (SE) |
Model 5 β (SE) |
Model 6 β (SE) |
Model 7 β (SE) |
|
|---|---|---|---|---|---|---|---|
| High Quality NHs | −2.995*** (0.539) |
−3.213*** (0.501) |
−3.432*** (0.515) |
−4.683*** (0.658) |
−3.455*** (0.521) |
−3.370*** (0.517) |
−2.040*** (0.277) |
| CNA hourly wage | −0.891*** (0.253) |
−0.885*** (0.281) |
−0.940*** (0.338) |
−0.865*** (0.216) |
−0.971*** (0.282) |
−0.534*** (0.152) |
|
| High Quality NHs × Centered CNA hourly wage | 0.0728 (0.279) |
0.128 (0.328) |
0.0905 (0.281) |
0.133 (0.281) |
−0.138 (0.162) |
||
| Behavioral/Mental add-on | 1.172** (0.504) |
0.191 (0.555) |
0.00988 (0.682) |
0.0169 (0.552) |
0.219 (0.559) |
−0.451 (0.733) |
|
| High Quality NHs × Behavioral/Mental add-on | 2.151** (0.990) |
1.707 (1.251) |
1.813* (0.993) |
2.090** (0.994) |
2.003*** (0.718) |
||
| HHA per 1000 jobs | −0.134** (0.0535) |
−0.137** (0.0534) |
−0.168*** (0.0635) |
−0.134** (0.0539) |
−0.109*** (0.0392) |
||
| Medicaid per diem rate | −0.0105 (0.00848) |
−0.0106 (0.00847) |
−0.00421 (0.00995) |
−0.00880 (0.00852) |
−0.0109** (0.00496) |
||
| Case-mix reimbursement | −0.405 (0.428) |
−0.478 (0.430) |
−0.610 (0.543) |
−0.407 (0.431) |
0.143 (0.710) |
||
| RN hourly wage | 0.0764 (0.0887) |
0.0796 (0.0888) |
0.158 (0.107) |
0.0987 (0.0895) |
0.00320 (0.0631) |
||
| LPN hourly wage | 0.0885 (0.155) |
0.0688 (0.155) |
0.0175 (0.191) |
0.0539 (0.157) |
0.114 (0.0859) |
||
| CMS wage index | −2.780 (2.881) |
−2.977 (2.883) |
−1.832 (3.358) |
−3.307 (2.889) |
−4.722*** (1.832) |
||
| Herfindahl-Hirschman Index | 8.992** (4.491) |
9.046** (4.509) |
12.56* (6.573) |
3.912 (12.41) |
5.326** (2.431) |
||
| unemployment rate | 0.130 (0.127) |
0.139 (0.128) |
0.224 (0.151) |
0.154 (0.129) |
0.227*** (0.0700) |
||
| Average age of residents | 1.076*** (0.101) |
1.076*** (0.101) |
1.057*** (0.120) |
1.075*** (0.102) |
1.080*** (0.102) |
1.100*** (0.0641) |
|
| Percentage of Male | 3.586 (2.196) |
3.549 (2.197) |
4.450 (2.721) |
3.603 (2.208) |
3.707* (2.226) |
4.313*** (1.328) |
|
| Percentage of White | −3.729** (1.531) |
−3.780** (1.535) |
−3.399* (1.845) |
−2.547 (1.585) |
−3.735** (1.562) |
−4.184*** (1.045) |
|
| Percentage of Black | 4.597** (1.897) |
4.540** (1.902) |
4.791** (2.371) |
5.689*** (2.074) |
4.686** (1.930) |
5.005*** (1.247) |
|
| Cancer Prevalence | −9.086** (3.694) |
−9.132** (3.696) |
−11.23** (4.511) |
−9.201** (3.713) |
−8.870** (3.755) |
−13.28*** (2.799) |
|
| Coronary Artery Disease Prevalence | 11.39*** (2.539) |
11.44*** (2.537) |
11.21*** (3.058) |
11.38*** (2.532) |
11.24*** (2.580) |
8.063*** (1.822) |
|
| Heart Failure Prevalence | −4.032 (2.831) |
−4.107 (2.833) |
−4.325 (3.484) |
−4.107 (2.855) |
−4.130 (2.889) |
−5.765*** (1.956) |
|
| Peripheral Vascular Disease Prevalence | 8.895** (4.019) |
8.890** (4.007) |
8.788* (4.572) |
8.870** (4.034) |
9.057** (4.072) |
3.330 (3.357) |
|
| Diabetes Prevalence | 2.239 (2.484) |
2.295 (2.482) |
5.147 (3.173) |
2.314 (2.495) |
1.976 (2.509) |
−2.175 (1.548) |
|
| Hypertension Prevalence | 3.016 (1.953) |
3.028 (1.953) |
2.334 (2.454) |
2.710 (1.977) |
2.714 (1.984) |
6.288*** (1.488) |
|
| Asthma Prevalence | 3.178 (2.517) |
3.199 (2.515) |
4.731 (3.027) |
3.156 (2.519) |
3.601 (2.545) |
1.219 (1.861) |
|
| Stroke Prevalence | 2.726 (3.056) |
2.719 (3.057) |
1.101 (3.785) |
2.176 (3.062) |
2.539 (3.097) |
8.355*** (2.441) |
|
| Respiratory Failure Prevalence | 2.424 (3.712) |
2.342 (3.715) |
2.102 (4.489) |
2.507 (3.686) |
3.006 (3.733) |
4.621* (2.654) |
|
| Average ADL score based on 0–28 scale | 1.093*** (0.149) |
1.096*** (0.149) |
1.141*** (0.181) |
1.064*** (0.149) |
1.102*** (0.152) |
0.966*** (0.103) |
|
| Average case-mix index based on RUG4 groups | −20.81*** (2.347) |
−20.78*** (2.347) |
−22.91*** (2.904) |
−21.09*** (2.339) |
−20.88*** (2.368) |
−19.18*** (1.364) |
|
| Percentage of patients from hospital | −20.22*** (1.802) |
−20.19*** (1.803) |
−20.20*** (2.183) |
−19.87*** (1.810) |
−19.83*** (1.827) |
−20.72*** (1.195) |
|
| year=2012 | −1.376*** (0.334) |
−1.355*** (0.334) |
−1.205*** (0.390) |
−1.452*** (0.314) |
−1.407*** (0.338) |
−1.133*** (0.341) |
|
| year=2013 | −2.764*** (0.390) |
−2.730*** (0.390) |
−2.578*** (0.461) |
−2.892*** (0.332) |
−2.734*** (0.394) |
−2.329*** (0.360) |
|
| year=2014 | −2.948*** (0.543) |
−2.927*** (0.543) |
−2.469*** (0.628) |
−3.228*** (0.372) |
−2.930*** (0.550) |
−2.797*** (0.325) |
|
| Constant | 33.05*** (0.320) |
−34.12*** (8.956) |
−33.57*** (8.908) |
−34.57*** (10.78) |
−30.88*** (8.686) |
−34.46*** (9.011) |
−33.41*** (5.898) |
| County fixed effect | NA | NA | NA | NA | Yes | NA | NA |
| Number of NHs | 2777 | 2777 | 2777 | 1991 | 2777 | 2721 | 8729 |
In Model 4, we excluded high-quality NHs whose star rating switched to 3 or lower and low-quality NHs whose star rating switched to 4 or higher in the following years. In model 5, we estimated the regression with county fixed-effects. In Model 6, we excluded the counties that have either only high-quality NHs or only low-quality NHs. In model 7, we redefined high-quality NHs as 5- or 4-star NHs in the baseline year (i.e. 2011) and redefined low-quality NHs as 1-,2-, or 3-star NHs in the baseline year.
β represents the coefficient and SE represents the robust standard errors
random effect model grouped by facility
p < 0.10,
p < 0.05,
p < 0.01
Footnotes
Publisher's Disclaimer: This is a PDF file of an unedited manuscript that has been accepted for publication. As a service to our customers we are providing this early version of the manuscript. The manuscript will undergo copyediting, typesetting, and review of the resulting proof before it is published in its final form. Please note that during the production process errors may be discovered which could affect the content, and all legal disclaimers that apply to the journal pertain.
The authors declare no conflicts of interest.
References
- 1.Matthews KA, Xu W, Gaglioti AH, et al. Racial and ethnic estimates of Alzheimer’s disease and related dementias in the United States (2015–2060) in adults aged ≥65 years. Alzheimer’s Dement. 2018;15(1):17–24. doi: 10.1006/mpev.1997.0472 [DOI] [PMC free article] [PubMed] [Google Scholar]
- 2.Lepore M, Ferrell A, Wiener JM. Living Arrangements of People with Alzheimer’s Disease and Related Dementias: Implications for Services and Supports. Res Summit Dement Care Build Evid Serv Support. 2017;(October):1–14. [Google Scholar]
- 3.Sewell DD. Nursing Homes Are Turning Away Patients with Mental Health Issues. Care For Your Mind Org. http://careforyourmind.org/nursing-homes-are-turning-away-patients-with-mental-health-issues/. Published 2016.
- 4.Leys T. Confused, anxious and far from home: Dementia patients turned away from many Iowa nursing homes. Des Moines Register. https://www.desmoinesregister.com/story/news/health/2018/10/16/dementia-patient-iowa-nursing-home-alzheimers-disease-frontotemporal-degeneration-mental-health-care/1458481002/. Published 2018.
- 5.Li Y, Cai X, Cram P. Are patients with serious mental illness more likely to be admitted to nursing homes with more deficiencies in care? Med Care. 2011;49(4):397–405. doi: 10.1097/MLR.0b013e318202ac10 [DOI] [PMC free article] [PubMed] [Google Scholar]
- 6.Temkin-Greener H, Campbell L, Cai X, Hasselberg MJ, Li Y. Are Post-Acute Patients with Behavioral Health Disorders Admitted to Lower-Quality Nursing Homes? Am J Geriatr Psychiatry. 2018;26(6):643–654. doi: 10.1016/j.jagp.2018.02.005 [DOI] [PubMed] [Google Scholar]
- 7.Rahman M, Grabowski DC, Intrator O, Cai S, Mor V. Serious mental illness and nursing home quality of care. Health Serv Res. 2013;48(4):1279–1298. doi: 10.1111/1475-6773.12023 [DOI] [PMC free article] [PubMed] [Google Scholar]
- 8.Cen X, Li Y, Hasselberg M, Caprio T, Conwell Y, Temkin-greener H. Aggressive Behaviors Among Nursing Home Residents : Association With Dementia and Behavioral Health Disorders. J Am Med Dir Assoc. 2018;19(12):1104–1109.e4. doi: 10.1016/j.jamda.2018.09.010 [DOI] [PubMed] [Google Scholar]
- 9.Rosdinom R, Zarina MZN, Zanariah MS, Marhani M, Suzaily W. Behavioural and psychological symptoms of dementia, cognitive impairment and caregiver burden in patients with dementia. Prev Med (Baltim). 2013. doi: 10.1016/j.ypmed.2012.12.025 [DOI] [PubMed] [Google Scholar]
- 10.Hessler JB, Schäufele M, Hendlmeier I, et al. Behavioural and psychological symptoms in general hospital patients with dementia, distress for nursing staff and complications in care: Results of the General Hospital Study. Epidemiol Psychiatr Sci. 2018. doi: 10.1017/S2045796016001098 [DOI] [PMC free article] [PubMed] [Google Scholar]
- 11.Tanaka H, Hashimoto M, Fukuhara R, et al. Relationship between dementia severity and behavioural and psychological symptoms in early-onset Alzheimer’s disease. Psychogeriatrics. 2015. doi: 10.1111/psyg.12108 [DOI] [PubMed] [Google Scholar]
- 12.Kunik ME, Snow AL, Davila JA, et al. Consequences of Aggressive Behavior in Patients With Dementia. J Neuropsychiatry Clin Neurosci. 2010;22(1):40–47. doi: 10.1176/jnp.2010.22.1.40 [DOI] [PubMed] [Google Scholar]
- 13.Ramirez M, Watkins B, Teresi JA, Silver S, Sukha1 G, Bortagis1 G, Van Haitsma K, Lachs MS, y Pillemer K Using Qualitative Methods to Develop a Measure of Resident-to-Resident Elder Mistreatment in Nursing Homes. Int psychogeriatrics. 2013;25(8):1245–1256. doi: 10.3816/CLM.2009.n.003.Novel [DOI] [PMC free article] [PubMed] [Google Scholar]
- 14.Jutkowitz E, Kuntz KM, Dowd B, Gaugler JE, MacLehose RF, Kane RL. Effects of cognition, function, and behavioral and psychological symptoms on out-of-pocket medical and nursing home expenditures and time spent caregiving for persons with dementia. Alzheimer’s Dement. 2017;13(7):801–809. doi: 10.1016/j.jalz.2016.12.011 [DOI] [PMC free article] [PubMed] [Google Scholar]
- 15.Miller EA, Rosenheck RA, Schneider LS. Caregiver burden, health utilities, and institutional service use in Alzheimer’s disease. Int J Geriatr Psychiatry. 2012;27(4):382–393. doi: 10.1002/gps.2730 [DOI] [PMC free article] [PubMed] [Google Scholar]
- 16.Gaugler J, James B, Johnson T, Scholz K, Weuve J. 2016 Alzheimer’s disease facts and figures. Alzheimer’s Dement. 2016;12(4):459–509. doi: 10.1016/j.jalz.2016.03.001 [DOI] [PubMed] [Google Scholar]
- 17.Warchol K Dementia Care Model Facilitates Quality Outcomes. Aging Well. 2012;5(2):32–34. http://www.todaysgeriatricmedicine.com/archive/031912p32.shtml. [Google Scholar]
- 18.Emily Chmielewski E, Eastman PF of A. Excellence in Design: Optimal Living Space for People With Alzheimer’s Disease and Related Dementias; 2014.
- 19.Werner RM, Konetzka RT, Polsky D. Changes in Consumer Demand Following Public Reporting of Summary Quality Ratings : An Evaluation in Nursing Homes. Health Serv Res. 2016;51(2):1291–1309. doi: 10.1111/1475-6773.12459 [DOI] [PMC free article] [PubMed] [Google Scholar]
- 20.Schapira MM, Shea JA, Duey KA, Kleiman C, Werner RM. Card : Perceptions of Residents and Caregivers Regarding Quality Ratings and Nursing Home Choice. Health Serv Res. 2016;51(2):1212–1228. doi: 10.1111/1475-6773.12458 [DOI] [PMC free article] [PubMed] [Google Scholar]
- 21.Park J, Werner RM. Changes in The Relationship Between Nursing Home Financial Performance And Quality Of Care Under Public Reporting. Heal Econ. 2011;20:783–801. doi: 10.1002/hec [DOI] [PubMed] [Google Scholar]
- 22.Policies BC, Grabowski DC, Angelelli JJ. The Relationship of Medicaid Payment Adjusted Pressure Ulcers. Heal Serv Res. 2004;39(4):793–812. [DOI] [PMC free article] [PubMed] [Google Scholar]
- 23.Angelelli JJ, Mor V. Medicaid Payment And Risk-Adjusted Nursing Home Quality Measures. Heal Aff. 2004;23(5):243–252. doi: 10.1377/hlthaff.23.5.243 [DOI] [PubMed] [Google Scholar]
- 24.Feng Z, Grabowski DC, Intrator O. Effects of Payment Strategies The Effect of State Medicaid Case-Mix Payment on Nursing Home Resident Acuity. Heal Serv Res. 2006;414:1317–1336. doi: 10.1111/j.1475-6773.2006.00545.x [DOI] [PMC free article] [PubMed] [Google Scholar]
- 25.Intrator O, Grabowski DC, Zinn J, Feng Z, Miller S, Mor V. Nursing Home and Hospice Hospitalization of Nursing Home Residents : The Effects of States ‘ Medicaid Payment and Bed-Hold Policies. Heal Serv Res. 2007;42(4):1651–1671. doi: 10.1111/j.1475-6773.2006.00670.x [DOI] [PMC free article] [PubMed] [Google Scholar]
- 26.States’ Medicaid Fee-for-Service Nursing Facility Payment Policies. Medicaid and CHIP Payment and Access Commission. https://www.macpac.gov/publication/nursing-facilty-payment-policies/. Published 2014.
- 27.NY Administrative Codes, Section 86–2.40 http://w3.health.state.ny.us/dbspace/NYCRR10.nsf/11fb5c7998a73bcc852565a1004e9f87/9028b00603e1be46852579f2004e1ce4?OpenDocument. Published 2018.
- 28.NC State Plan Amendment, Attachment 4.19-D http://www.ncdhhs.gov/dma/plan/y.pdf.
- 29.Gozalo PL, Teno JM, Spence C. Hospice Visit Patterns in the Last Seven Days of Life and the Service Intensity Add-On Payment. J Palliat Med. 2017;20(12):jpm.2017.0214. doi: 10.1089/jpm.2017.0214 [DOI] [PubMed] [Google Scholar]
- 30.Davison TE, George K. Effectiveness of staff training programs for behavioral problems among older people with dementia AU - McCabe, M. P. Aging Ment Health. 2007;11(5):505–519. doi: 10.1080/13607860601086405 [DOI] [PubMed] [Google Scholar]
- 31.Jones AL, Dwyer LL, Bercovitz AR, Strahan GW. The National Nursing Home Survey: 2004 overview. Natl Cent Heal Stat Vital Heal Stat. 2009;13(167):1–155. doi: 10.1111/j.1532-5415.2009.02552.x [DOI] [PubMed] [Google Scholar]
- 32.Gould EW. Dementia Care Practice Recommendations for Assisted Living Residences and Nursing Homes Alzheimer’s Association Campaign for Quality Residential Care Building consensus on quality care for people living with dementia. Alzheimer’s Assoc Campaign Qual Resid Care. 2009. https://www.alz.org/national/documents/brochure_DCPRphases1n2.pdf.
- 33.Livingston G, Kelly L, Lewis-holmes E, et al. Non-pharmacological interventions for agitation in dementia : systematic review of randomised controlled trials. Br J Psychiatry. 2014;205(6):436–442. doi: 10.1192/bjp.bp.113.141119 [DOI] [PubMed] [Google Scholar]
- 34.Ehrenberg RGSRS. Modern Labor Economics: Theory and Public Policy. Routledge; 2016. [Google Scholar]
- 35.Couch KA, Wittenburg DC. The Response of Hours of Work to Increases in the Minimum Wage. South Econ J. 2001;68(1):171. doi: 10.2307/1061520 [DOI] [Google Scholar]
- 36.AHCA commissioned Eljay, LLC and Hansen Hunter & Company P.C. to compile Medicaid payments to nursing center providers. A Report on Shortfalls in Medicaid Funding for Nursing Center Care. 2011–2016. https://www.ahcancal.org/research_data/funding/Pages/Medicaid-Shortfall-Report.aspx
- 37.Gucwa AL, Dolar V, Ye C, Epstein S. Correlations between quality ratings of skilled nursing facilities and multidrug-resistant urinary tract infections. Am J Infect Control. 2016;44(11):1256–1260. doi: 10.1016/j.ajic.2016.03.015 [DOI] [PubMed] [Google Scholar]
- 38.Ogunneye O, Rothberg MB, Friderici J, Slawsky MT, Gadiraju VT, Stefan MS. The Association Between Skilled Nursing Facility Care Quality and 30-Day Readmission Rates After Hospitalization for Heart Failure. Am J Med Qual. 2015;30(3):205–213. doi: 10.1177/1062860614531069 [DOI] [PubMed] [Google Scholar]
- 39.Johari K, Kellogg C, Vazquez K, Irvine K, Rahman A, Enguidanos S. Ratings game: An analysis of Nursing Home Compare and Yelp ratings. BMJ Qual Saf. 2018;27(8):619–624. doi: 10.1136/bmjqs-2017-007301 [DOI] [PubMed] [Google Scholar]
- 40.Alzheimer’s Association. 2018 Alzheimer’s Disease Facts and Figures. Alzheimers Dement 2018;14(3):367–429. [Google Scholar]
- 41.Konetzka BRT, Grabowski DC, Perraillon MC, Werner RM. Nursing Home 5-Star Rating System Exacerbates Disparities In Quality, By Payer Source. Heal Aff. 2015;34(5):819–827. [DOI] [PMC free article] [PubMed] [Google Scholar]
- 42.Park YJ, Martin EG. Geographic Disparities in Access to Nursing Home Services : Assessing Fiscal Stress and Quality of Care. Heal Serv Res. 2018;53(1):2932–2951. doi: 10.1111/1475-6773.12801 [DOI] [PMC free article] [PubMed] [Google Scholar]
- 43.Boccuti C, Casillas G, Neuman T. Reading the Stars : Nursing Home Quality Star Ratings, Nationally and by State. The Henry J. Kaiser Family Foundation; http://files.kff.org/attachment/issue-brief-reading-the-stars-nursing-home-quality-star-ratings-nationally-and-by-state. Published 2015. [Google Scholar]
- 44.GA State Plan Amendment, Attachment 4.19-D http://www.georgiamedicaidlaw.net/gamedicaid/stateplan_nov2007/GAStatePlan-Attachment4.19-D.pdf.
- 45.Mph YY, Louis C, Cabral H, Schneider JC, Ryan CM, Kazis LE. Socioeconomic and Geographic Disparities in Accessing Nursing Homes With High Star Ratings. J Am Med Dir Assoc. 2018;19(10):852–859.e2. doi: 10.1016/j.jamda.2018.05.017 [DOI] [PubMed] [Google Scholar]