

Abstract
EphA2 receptor tyrosine kinase (RTK) is often expressed at high levels in cancer and has been shown to regulate tumor growth and metastasis across multiple tumor types, including non-small cell lung cancer. A number of signaling pathways downstream of EphA2 RTK have been identified; however, mechanisms of EphA2’s proximal downstream signals are less well-characterized. In this study, we used a yeast-two-hybrid screen to identify PLCγ1 as a novel EphA2 interactor. EphA2 interacts with PLCγ1 and the kinase activity of EphA2 was required for phosphorylation of PLCγ1. In human lung cancer cells, genetic or pharmacological inhibition of EphA2 decreased phosphorylation of PLCγ1 and loss of PLCγ1 inhibited tumor cell growth in vitro. Knockout of PLCγ1 by CRISPR-mediated genome editing also impaired tumor growth in a KrasG12D-p53-Lkb1 murine lung tumor model. Collectively, these data show that the EphA2-PLCγ1 signaling axis promotes tumor growth of lung cancer and provides rationale for disruption of this signaling axis as a potential therapeutic option.
Keywords: EphA2 RTK, PLCgamma, lung cancer
Implications
The EphA2-PLCG1 signaling axis promotes tumor growth of non-small cell lung cancer and can potentially be targeted as a therapeutic option.
Introduction
Receptor tyrosine kinases (RTKs) regulate signal transduction pathways that control cell proliferation, survival, and motility. Dysregulation of RTKs by mutations, amplifications, or overexpression can lead to oncogenic transformation and malignant progression (1). A number of RTKs have been identified as potential drivers of non-small cell lung cancer (NSCLC), one of which is EphA2 (2). The EphA2 RTK belongs to the EPH family, the largest family of RTKs, and is commonly overexpressed in NSCLC and associated with poor clinical outcomes (3). Targeted disruption of EphA2 impairs tumor growth in KRAS-mutant mouse models and in human NSCLC xenografts (4). Further, EphA2 is overexpressed in EGFR tyrosine kinase inhibitor (TKI)-resistant tumor cells (5). Loss of EphA2 reduced viability of erlotinib-resistant tumor cells harboring EGFRT790M mutations in vitro and inhibited tumor growth in an inducible EGFRL858R+T790M-mutant lung cancer model in vivo (5). Several EphA2 inhibitors including an antibody, a peptide, and a small molecule inhibitor have been developed (6). An EphA2-targeting DOPC-encapsulated siRNA is currently in Phase I clinical trials for advanced or recurrent solid tumors (NCT01591356). However, despite the interest in EphA2 as a therapeutic target, molecular mechanisms mediating EphA2 function, particularly its proximal downstream signals, are not well-characterized.
Phospholipase C Gamma (PLCγ) is a lipase activated by receptors in the cellular membrane, including RTKs and adhesion receptors. Once activated, PLCγ hydrolyzes phosphatidylinositol 4,5-bisphosphate (PIP2) to form diacylglycerol (DAG) and inositol 1,4,5-trisphosphate (IP3), the latter promoting the transient release of intracellular Ca2+, another important signaling molecule. PLCγ is ubiquitously expressed and exists in two isoforms, PLCG1 and PLCG2, each with distinct functions in a variety of cell types and disease states (7,8). PLCG1 plays a role in vasculogenesis and erythrogenesis as well as T-cell development and activity(9). Importantly, loss of PLCG1 is embryonic lethal in mice (10). PLCG2, meanwhile, is critical for B-cell development and maturation (8,11). Both PLCγ isoforms are enriched and mutated in many cancers (8). Elevated PLCγ1 has been shown to drive metastasis and progression of breast cancer (12,13), and its phosphorylation status is prognostic for metastatic risk (14). PLCγ has also been implicated in resistance to cancer treatment. In glioblastoma, PLCγ/HIF-1α mediated FGFR1-induced radioresistance (15), while in head and neck and esophageal squamous cell carcinoma the AXL-EGFR- PLCγ1 axis mediated resistance to PI3K inhibition (16). An acquired PLCG2 mutation also caused resistance to ibrutinib in chronic lymphocytic leukemia (17). While important roles for PLCγ have been identified in several cancer types, PLCγ’s role in lung cancer has yet to be elucidated.
In this report, we show that PLCγ is a novel target of the EphA2 RTK in lung cancer. We show that EphA2 interacts with and directly phosphorylates PLCγ for activation. Additionally, knockdown of PLCG1 significantly reduces the growth of KRAS-mutant lung cancer cells in vitro and inhibits lung tumor growth in an orthotopic Kras-p53-Lkb1 mutant mouse model in vivo. Collectively, these studies identify the EphA2- PLCγ1 axis as a potential therapeutic target for KRAS-mutant lung cancer.
Materials and Methods
Cell lines, plasmids, and reagents
293FT, COS-7, and mouse KPL lines were cultured in DMEM supplemented with penicillin/streptomycin and 10% FBS. Human lung cancer cell lines (A549, H23, H358, H2030, H2009, and HCC44) and BEAS2B cells were cultured in RPMI 1640 supplemented with penicillin/streptomycin and 10% FBS. All cell lines were purchased from ATCC, except the murine KPL line which was generated in our lab as shown in Figure 5. Cell lines were used between passages 1 and 50 after thaw and authenticated using short tandem repeat profiling at ATCC, most recently in June, 2019. Mycoplasma was routinely tested approximately every 6 months to exclude possible contamination, most recently in November 2019, using the PlasmoTest Kit from InvivoGen.
For transient knockdown, siRNAs were purchased from Dharmacon (smart pool siEphA2: #L-003116-00-0005; non-targeting pool: #D-001810-10-05; individual siPLCG1 #1-3: # J-003559-05, 07, 08). For stable shRNA knockdown, lentiviral vector pLKO.1 was used (EphA2 shRNA#1 CGGACAGACATATGGGATATT; EphA2 shRNA#2 GCGTATCTTCATTGAGCTCAA; PLCG1 shRNA#1 ATGACAAAGCAATGTGACTGG; PLCG1 shRNA#2 ATGTAAACTTTGTTTCCCTGG; PLCG1 shRNA#3 AATTTCACGAATGTCAATGGC; PLCG1 shRNA#4 ATACCATTCGTGGTTCACAGG; GFP shRNA control GCAAGCTGACCCTGAAGTTCAT). For Crispr/Cas9 mediated gene knockout, lentiviral vector LentiCRISPR v2 was used human PLCG1 gRNA #1 ATAGCGATCAAAGTCCCGTG; human PLCG1 gRNA #2 GTTCACTTCATCCTCAGATG; LacZ gRNA TGCGAATACGCCCACGCGAT; mouse PLCG1 gRNA #1 GCTAATGGAGGATACACTGC; mouse PLCG1 gRNA #2 CCGCGGCGCGGACAAAATCG). The PLCG1 full length cDNA plasmid was purchased from Sino Biological Inc (#MG50804-G) and PLCG1 was subcloned into pCDH-puro vector with Flag-tag at its C-terminus. The EphA2 full length cDNA plasmid (pCDH-puro EphA2-Myc) and its corresponding mutants (S897A, Y588F, Y594F, Y735F, Y930F, K646M, and D739N) were all from lab stocks. For AAV system, AAV9 and pΔF6 plasmids were purchased form Penn Vector Core at the University of Pennsylvania, and AAV-KPL plasmid was from Addgene (#60224). ALW-II-41-27, was purchased from MedChem Express (Monmouth Junction, NJ).
Building a human protein-protein interactome
To construct a comprehensive and high-quality human protein-protein interaction (PPI) network, we assembled 15 commonly used data sources with five types of experimental evidence: (1) binary PPIs tested by high-throughput yeast-two-hybrid (Y2H) systems; (2) binary, physical PPIs from protein three-dimensional structures; (3) kinase-substrate interactions from literature-derived low-throughput and high-throughput experiments; (4) signaling networks derived from low-throughput experiments; (5) literature-derived identified by affinity purification followed by mass spectrometry (AP-MS) and low-throughput experiments. In total, the updated human interactome consisted of 351,444 PPIs (edges or links) linked to 17,706 unique proteins (nodes). The detailed descriptions of building the human interactome are given in our recent studies(41–43). We then mapped the EPHA2, PLCG1 and PLCG2 into the PPIs network to construct EPHA2-PLCG1/PLCG2 sub-network. Next, we performed Kyoto Encyclopedia of Genes and Genomes (KEGG) enrichment analysis to identify the functional pathway related with PLCG1 and PLCG2.
Cell growth assays
MTT Assay was used to evaluate the short-term proliferation of cells. 2 × 10³ cells were plated into 96-well plates with six replicates in growth media. MTT reagent was added and the plates were read using plate reader (Synergy HT, BioTek) on days 1–6. Cell viability was normalized to day one. Colony formation assays were used to evaluate the long-term proliferation of cells. 400 cells were plated into 12-well plates with 3–4 replicates in growth media. For drug treatment experiments, drugs were added the day after cell attachment with an initial plating of 2 × 10⁴ cells. Cell colonies were visualized by crystal violet staining after 2 weeks for human cells or 1 week for mouse KPL cells.
Yeast-two-hybrid screen
Yeast two-hybrid (Y2H) screening was carried out by Hybrigenics Services, (hybrigenics-services.com). The cytoplasmic EphA2 tail (AA 559–976) was cloned as a N-LexA-EPHA2-C fusion to be the bait against a lung cancer cDNA library (mix of A549, H1703, and H460) and 79 positive clones were selected on DO-3 selective medium plates. A confidence score (Predicted Biological Score, PBS) was assigned to each interaction, then scores were stratified into categories based on the degree of confidence.
Proximity Ligation Assay
Cancer cells in culture medium were plated onto coverslips coated with 0.5% Gelatin in DPBS. Cells were washed with DPBS and fixed with 4% PFA after 24hr growth. 5% goat serum plus 0.3% triton X-100 in DPBS was used to permeabilize cells. Anti-PLCG1 rabbit polyclonal antibody (Santa Cruz, #SC-81, 1:200) and anti-EphA2 mouse monoclonal antibody (EMD Millipore, #05–480, 1:400) diluted in blocking buffer were applied to cells and incubated for overnight at 4°C. The DuoLink Proximity Ligation Kit (Sigma-Aldrich, #DUO92102) was used according to manufacturer’s instructions.
Immunoblots, immunoprecipitation, and immunohistochemistry
For western blotting, 10 to 30μg of total protein from cell lysates were separated by SDS-PAGE, transferred to a nitrocellulose membrane and probed with indicated antibodies. Primary antibodies used in this study were as follows: rabbit anti-EphA2 (Santa Cruz, #SC-924, 1:1000), mouse anti-EphA2 (EMD Millipore, #05–480, 1:1000), mouse anti-PLCG1 (Santa Cruz, #SC-7290, 1:500), rabbit anti-PLCG2 (Santa Cruz, #SC-407, 1:500), rabbit anti-EphA2 Y588 (Cell Signaling, #12677, 1:500), rabbit anti-PLCG1 Y783 (Cell Signaling, #14008, 1:500), mouse anti-β-Actin (Santa Cruz, #SC-47778, 1:1000). Secondary antibodies used were as follows: anti-rabbit IgG HRP (Promega, #W4011, 1:5000), anti-mouse IgG HRP (Promega, #W4021, 1:5000), anti-rabbit IgG IRDye 800CW (LI-COR, #926–32211), and anti-mouse IgG IRDye 680LT (LI-COR, #926–68020). Antibodies were diluted in PBST/5% nonfat milk. Signal was detected using ECL substrate (West Femto or West Pico, Thermo Fisher Scientific) or by LI-COR Odyssey Infrared Imaging System.
For immunoprecipitation, cells were lysed in IP buffer (10mM Tris-HCl pH=7.5, 150mM NaCl, 2mM EDTA, 0.5–1% Triton X-100). 1μg of total protein was incubated with anti-Myc tag or anti-Flag agarose beads or indicated antibody then Protein G Dynabeads (Invitrogen) overnight at 4°C. Beads were washed with lysis buffer and boiled with 20ul SDS loading buffer. The soluble fraction was loaded for immunoblot analysis.
Lung tumor sections were stained with hematoxylin and eosin by Vanderbilt University Translational Pathology Shared Resource. PCNA staining (Cell signaling, rabbit anti PCNA, #13110) for proliferation or terminal deoxynucleotidyl transferase dUTP nick end labeling (TUNEL) assay (Millipore, ApopTag Red In Situ Apoptosis Detection Kit, #S7165) for apoptosis was performed as described previously(44,45). Tumor area of 20x images was analyzed by ImageJ or CellSens software.
Formalin-fixed, paraffin-embedded human lung adenocarcinoma tissue arrays (#LC641) were purchased from Biomax. Following rehydration, antigen retrieval was accomplished using Retrievagen A (BD Biosciences) per manufacturer’s instructions. Following blockade of endogenous peroxidases using 3% H2O2, tissues were first permeabilized for 5 min with 0.3% Triton X-100 in PBS and then washed in PBS. Tissues were blocked with 2.5% goat serum and then probed with antibodies against EphA2 (10 μg/mL; #34–7400, Zymed Laboratories) or phospho-PLCγ1 (Tyr783) (1:50; #14008S, Cell Signaling Technologies) overnight at 4°C. Samples were incubated with biotinylated anti-rabbit IgG (1:250; #550338, BD Biosciences) and subsequently incubated with horseradish peroxidase streptavidin (#SA-5704,Vector Laboratories), both for 1 hr at RT, with thorough washing before and after each step. Staining was performed using liquid diaminobenzidine (DAB) (#SK-4103, Vector Laboratories) and hematoxylin (#H-3401, Vector Laboratories). Following dehydration, stained tissues were mounted using Cytoseal XYL. Slides were imaged on a Leica SCN400 Slide Scanner at 40x magnification at a resolution of 0.25 μm/pixel. The DAB stained area and total tissue area were determined from deconvoluted high-resolution images of each tissue core in the Leica Digital Image Hub. The percentage of tissue area positive for DAB staining is shown.
T7E1 Mismatch Detection Assay
Genomic DNA was extracted using QuickExtract DNA Extraction Solution (Lucigen) according to the manufacturer’s protocol. Target regions were amplified with indicated primers (Supplemental Figure 2) using the Q5 polymerase (NEB) and T7E1 mismatch detection assay was performed and analyzed according to previously published protocols (46).
Animal Studies
AAV was produced in 293FT cells, chemically purified and concentrated according to published methods(24). AAV titer was determined using AAVpro Titration Kita (Takara Bio Inc., #6233). A titer of 2×10¹¹ viral genome copies in 75ul DPBS was intratracheally injected into 7–8-week-old Rosa26-LSL-Cas9-EGFP mice (stock #: 024858, Jackson Labs). Tumor development was monitored weekly by MRI and by GFP imaging after sacrifice. For orthotopic lung tumor growth, KPL lines were transfected with luciferase expression plasmid and intravenously injected via tail vein. Lung tumor growth was measured once a week by bioluminescence imaging.
All animal experiments were pre-approved by the Vanderbilt Institutional Animal Care and Use Committee and followed all state and federal rules and regulations.
Statistical analysis
Data was presented as Mean ± SD or SEM and statistically analyzed by two-tailed student’s t-test or two-way ANOVA with Tukey’s post hoc correction. All experiments were performed at least two independent times and p < 0.05 was treated as statistically significant. GraphPad Prism 8 was used for statistical analysis.
Results
EphA2 interacts with PLCγ
To identify EphA2 interacting partners in human lung cancer cells, the intracellular domain (AA 559–976) of EphA2 was used as bait for a yeast-two-hybrid (Y2H) screen against the cDNA library of lung cancer cells (www.hybrigenics-services.com). 79 positive clones were screened, resulting in 15 total candidates. The candidates were stratified into three categories based on confidence of interaction- very high confidence (3 proteins, orange), high confidence (4 proteins, blue), and moderate confidence (8 proteins, green) (Figure 1A). 1–2 candidates were identified in each category that have been previously reported to interact with EphA2, validating the efficacy and accuracy of the Y2H screen (18,19). We chose to explore PLCG1 and PLCG2 further, since both are PLCγ family members and novel interactors with EphA2 identified in this screen with very high confidence and high confidence, respectively.
Figure 1. EphA2 interacts with PLCγ.
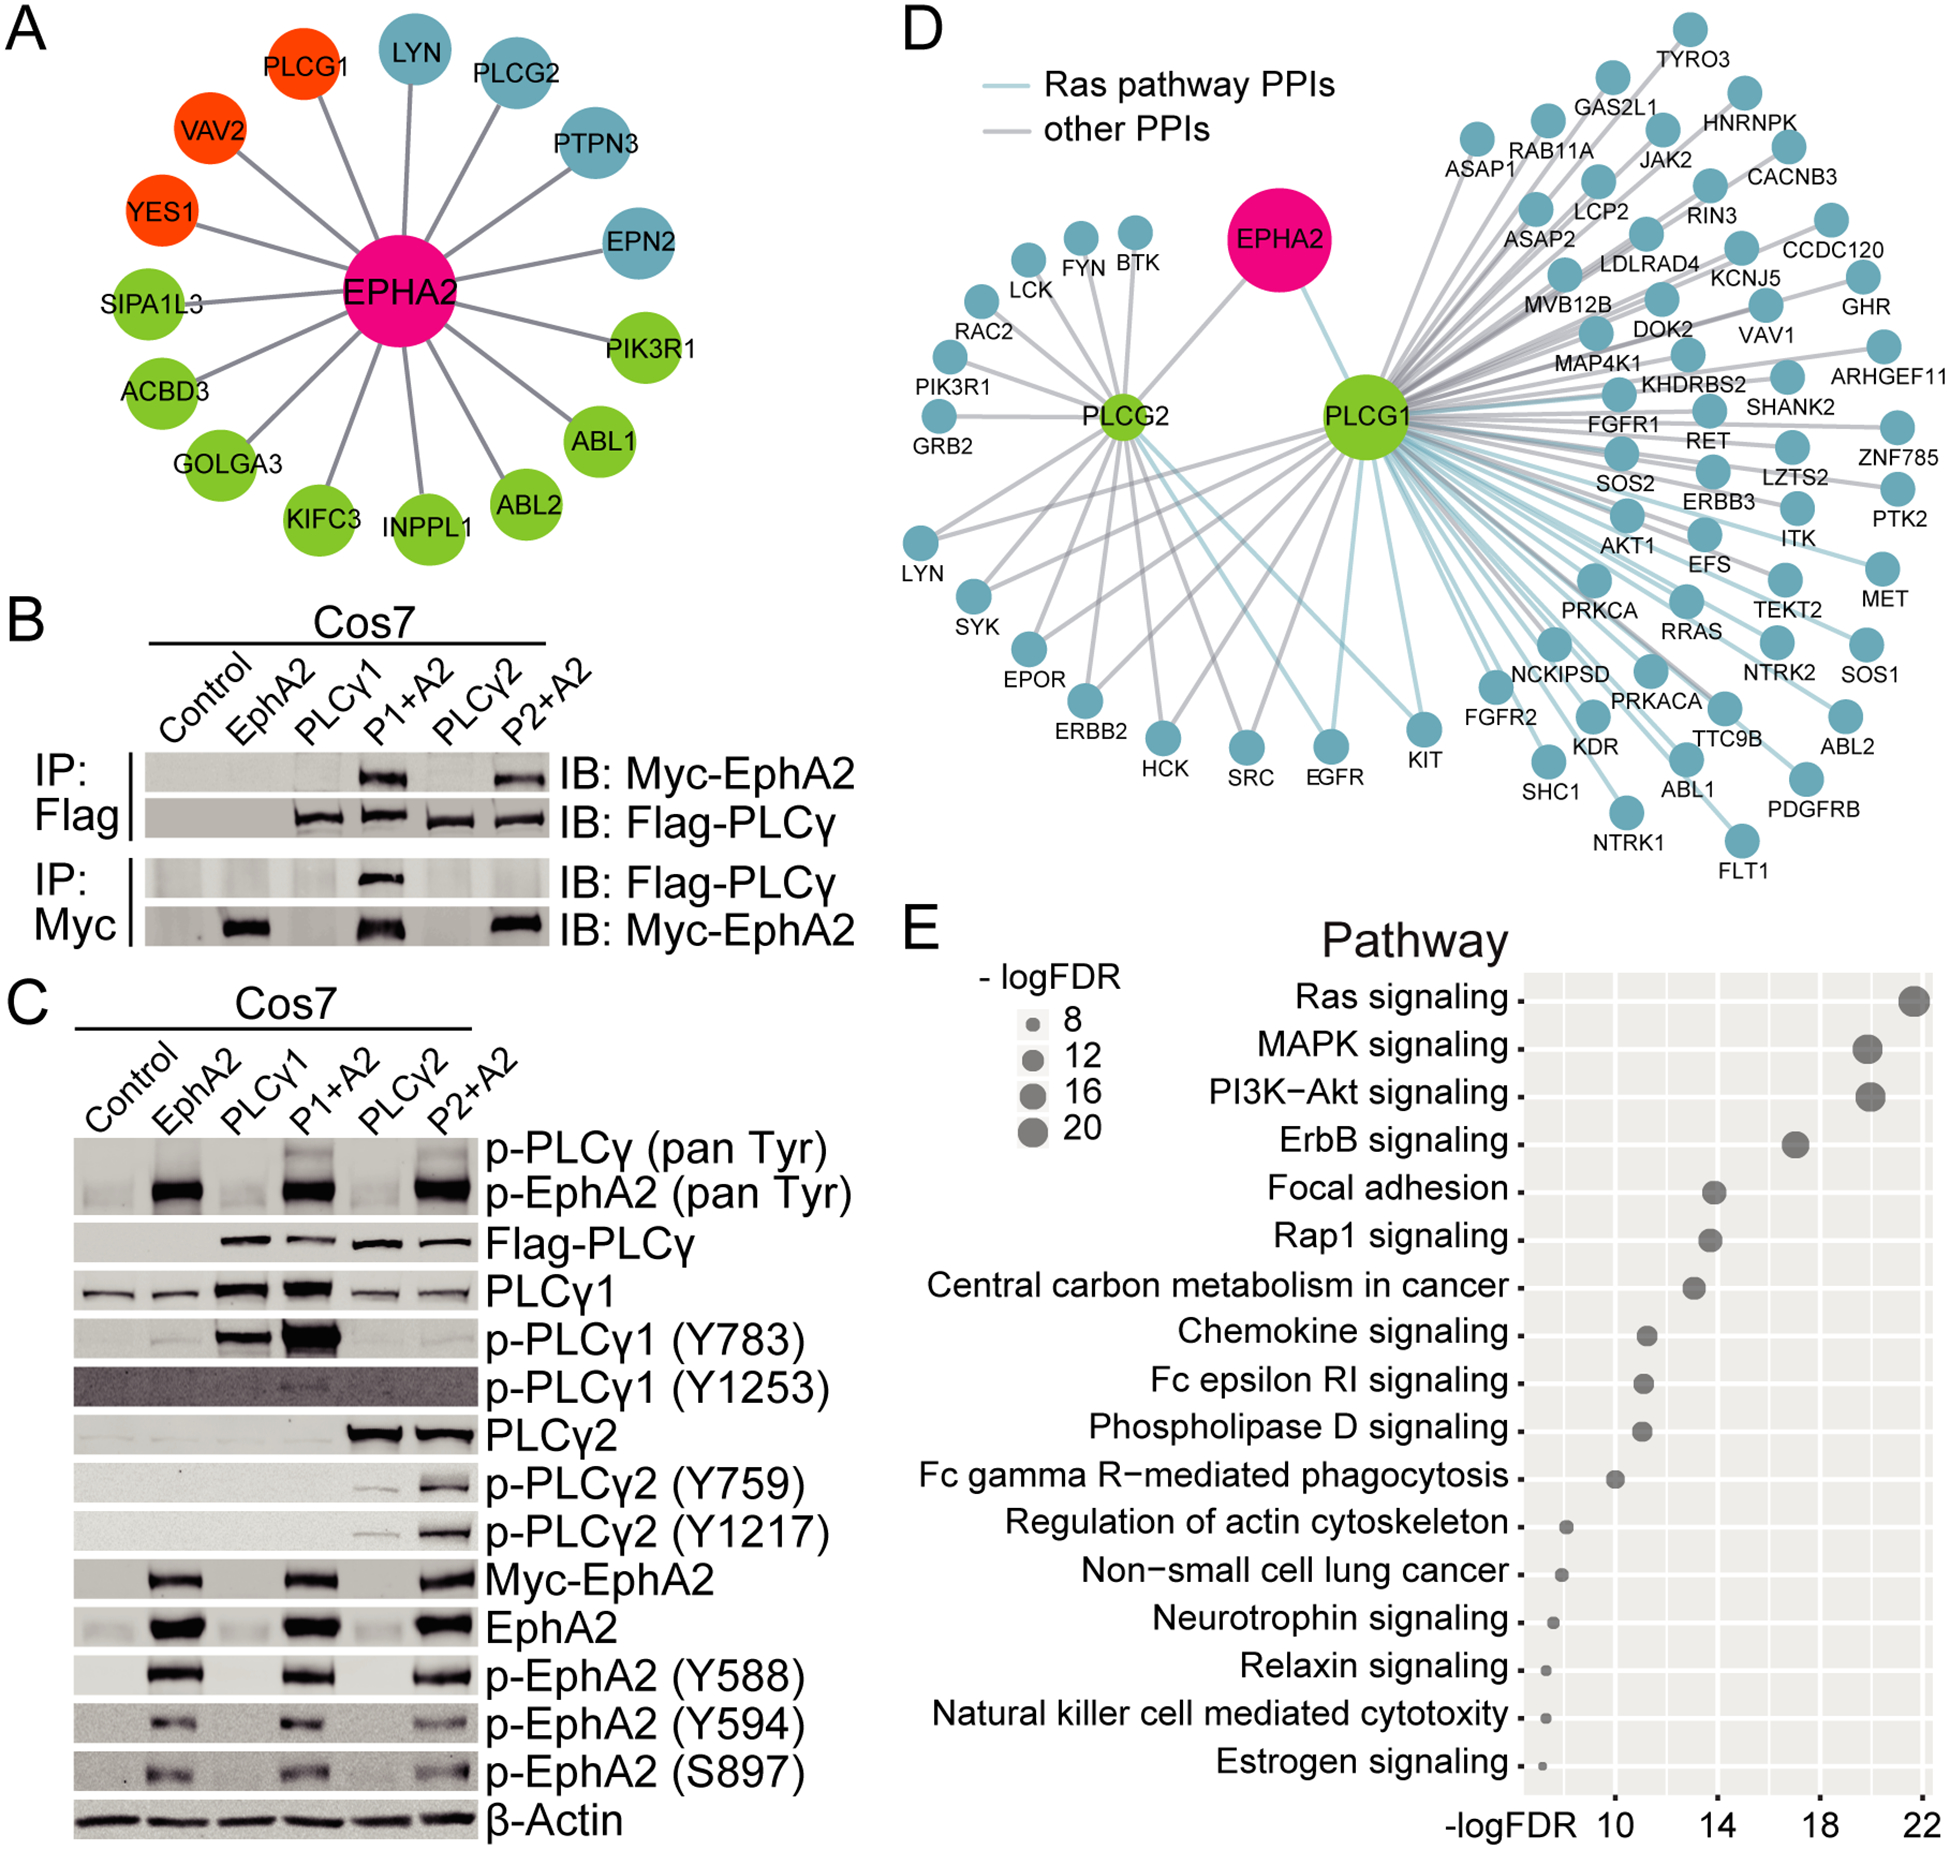
(A) A yeast-two-hybrid screen identified potential EphA2 interactors based on a lung cancer cDNA library. Orange, very high confidence; Blue, high confidence; Green, moderate confidence. (B&C) Combinations of EphA2 and either PLCG1 or PLCG2 were expressed in COS-7 cells. (B) Flag-PLCγ or Myc-EphA2 were immunoprecipitated and co-immunoprecipitating EphA2 or PLCγ was probed by western blotting. (C) Phosphorylation levels of EphA2 and PLCγ were measured by western blotting. (D) Map of the human EphA2-PLCγ1/PLCγ2 subnetwork analysis. Proteins in the Ras pathway are delineated by a blue line. (E) KEGG pathway enrichment analysis of the PLCγ interactome. FDR, False Discovery Rate.
To verify the interaction between EphA2 and PLCγ (PLCγ1 and PLCγ2) identified in the Y2H screen, EphA2 and PLCG1 or PLCG2 were expressed in COS-7 cells. Both PLCγ isoforms were immunoprecipitated with EphA2, however in the reverse direction, only immunoprecipitation of PLCγ1 was able to co-immunoprecipitate EphA2 (Figure 1B), suggesting a weaker interaction between EphA2 and PLCγ2 compared to PLCγ1.
PLCγ1 and PLCγ2 are important mediators of intracellular signal transduction and are activated by phosphorylation by upstream kinases (20). To determine if EphA2 is required for PLCγ activation, we assessed phosphorylation by immunoblotting. Expression of EphA2 increased the overall phosphorylation levels of both PLCγ1 and PLCγ2 including two different tyrosine sites on each protein (Y783 and Y1253 for PLCγ1, Y759 and Y1217 for PLCγ2) (Figure 1C). We also observed enhanced phosphorylation of Y783 on endogenous PLCγ1 in EphA2 overexpressing samples. Conversely, overexpression of PLCγ had no effect on the phosphorylation of EphA2 (Figure 1C), suggesting signaling proceeds from EphA2 to PLCγ.
Additional analysis of the PLCγ protein-protein interactome identified 57 interacting proteins for PLCγ1, far more than the 14 interacting proteins of PLCγ2 (Figure 1D). Interestingly, KEGG (Kyoto Encyclopedia of Genes and Genomes) enrichment analysis of the PLCγ1 interactome identified 22 proteins that were significantly enriched in the Ras signaling pathway (adjusted p value = 2.1e-22, Figure 1E), a pathway known to be important in driving a significant portion of NSCLC.
Since PLCγ1 had a stronger interaction with EphA2 (Figure 1B) and protein-protein interaction analysis of PLCG1 showed a broader functional network than PLCγ2, we focused on PLCγ1’s interaction with EphA2 in KRAS-mutant lung cancer for the remainder of the study.
EphA2 kinase activity is required for PLCγ1 phosphorylation
PLCγ is a well-known downstream effector of several receptor tyrosine kinases (RTKs), including EGFR, PDGFR, VEGFR, and TrkB (9). Phospho-tyrosine sites on the RTKs interact with the SH2 domain of PLCγ for activation (9). Consistent with other RTKs, our results from the Y2H screen indicated that the SH2 domain of PLCγ1 was involved in the interaction with the EphA2 intracellular domain. To characterize the interaction between EphA2 and PLCγ1, a series of EphA2 mutants were made, including two kinase dead mutants (K646M, D739N), four tyrosine phosphorylation site mutants (Y588F, Y594F, Y735F, Y930F) and one serine phosphorylation site mutant (S897A) (Figure 2A). These phosphorylation sites were chosen based on the literature and analysis of EphA2 in the PhosphoSitePlus PTM Resource (https://www.phosphosite.org/homeAction.action) as putative sites most likely to be involved in EphA2 kinase activity or its cellular function.
Figure 2. EphA2 kinase activity is required for phosphorylation of PLCγ.

Wild-type (wt) or mutant EphA2 was expressed in COS-7 or BEAS2B cells to assess their ability to phosphorylate PLCγ1. (A) Diagram showing the domains of EphA2 and the mutants used in the following experiments. (B) Whole cell lysates of COS-7 cells 48 hours post-transfection were analyzed by western blotting for phosphorylation of EphA2 and PLCγ1. (C) Quantification of the ratio of phospho-PLCγ to total PLCγ in EphA2 and PLCγ co-expressing cells from two independent experiments. p/t, phospho/total. (D) PLCG1 and EphA2 were co-transfected into COS-7 cells at a ratio of 1:0.1, 1:0.2, 1:0.4, and 1:1 and whole cell lysates were collected 48 hours post-transfection. Lysates were analyzed by western blotting and quantified in the bottom panel. (E) BEAS2B cells overexpressing EphA2 were cultured for 48 hours in growth medium or serum-starved and FBS-stimulated for 10 min before collection of lysates. Whole cell lysates were analyzed by western blotting using the indicated antibodies.
In EphA2 and PLCG1 co-expressing COS-7 cells (Figure 2B&C), wild-type EphA2 increased the level of phospho-PLCγ1, whereas the ability to phosphorylate PLCγ1 was impaired in cells expressing kinase dead or the two tyrosine mutants (Y588F and Y594F) that are situated within the juxtamembrane domain of EphA2 and are known to be required for proper kinase activity (21). Mutation of the other two tyrosine sites in the kinase domain and SAM domain as well as the serine site had little effect on PLCγ1 phosphorylation. Furthermore, the level of phospho-PLCγ1 was dependent on the level of EphA2 expression in the cells (Figure 2D). Consistent with Figure 2C, expression of the EphA2 kinase dead mutant (K646M) had no effect on phosphorylation of PLCγ1 even at very high doses. The Y588F mutant, which exhibited reduced kinase activity, only weakly affected phosphorylation of PLCγ1 at high expression levels.
We also expressed EphA2 in BEAS2B cells, a normal bronchial epithelial cell line with low endogenous EphA2 expression and analyzed the phosphorylation levels of endogenous PLCγ1 (Figure 2E). The result here showed that only wild-type EphA2, but not K646M or Y588F mutants, could phosphorylate PLCγ1, demonstrating that PLCγ1 phosphorylation is dependent on the kinase activity of EphA2.
EphA2 activates PLCγ1 in human lung cancer cells
EphA2 is highly expressed in many KRAS-mutant lung cancer cells and has been shown to regulate tumor malignancy (4), prompting us to investigate if PLCγ1 is regulated by EphA2 in these cells. Expression of wild-type EphA2 in H23 cells led to phosphorylation of PLCγ1, while kinase-dead EphA2 had no effect on p-PLCγ1 levels (Figure 3A). Corresponding experiments knocking down EphA2 by siRNA in a panel of KRAS-mutant lung cancer cell lines (H23, H2009, A549, HCC44, H2030, H358) led to a decrease of p-PLCγ1 (Figure 3B&C). Further, loss of EphA2 by shRNA or siRNA in either H23 or H2009 cells diminished p-PLCγ1 in serum-starved, stimulated, or normal growth conditions (Figures 3B&D). Stimulation with ephrin-A1-Fc, a surrogate for EphA2 canonical ligand ephrin-A1, also increased p-PLCγ1 in H23 and H2009 cells (Figure 3E). This signal was depleted when EphA2 was knocked down by shRNA (Figure 3F). Pharmacological inhibition of EphA2 kinase activity using the small molecule inhibitor ALW-II-41–27(4) (ALW) also inhibited phosphorylation of PLCγ1, with increasing doses of ALW inhibiting both p-EphA2 and p-PLCγ1 in H23 and H2009 cells (Figure 3G & Supplemental Figure 1A). Immunohistochemical analysis of EphA2 and p-PLCG1 in a human lung adenocarcinoma tumor microarray (TMA) showed a positive correlation between EphA2 and p- PLCγ1 staining (Supplemental Figure 1B&C), supporting the relevance of the EphA2-PLCG1 axis in human lung cancer.
Figure 3. PLCγ1 is activated by EphA2 in human lung cancer cell lines.

PLCγ1 activity was evaluated by its Y783 phosphorylation in human KRAS-mutant lines. A2: EphA2; P1: PLCγ1. (A) Wild-type or kinase dead (KD) EphA2 was expressed in H23 cells. Cells were serum-starved and FBS-stimulated for 10 min and whole cell lysates were analyzed by western blotting with the indicated antibodies. (B&C) EphA2 was knocked down by pooled siRNA in the indicated cell lines and whole cell lysates were analyzed by western blotting. (B) H23 cells were serum-starved and stimulated with FBS for 10 or 30 minutes. (C) Cell lines were cultured in complete growth media for 24 hours post-transfection. (D) EphA2 was knocked down by two different shRNA sequences (#1 and #2) in H23 and H2009 cell lines which were serum-starved and stimulated with FBS for 10 minutes. Whole cell lysates were analyzed by western blotting with the indicated antibodies. (E) H23 and H2009 cell lines were stimulated with IgG-Fc or Ephrin-A1-Fc for 10 or 20 min. Whole cell lysates were analyzed by western blotting with the indicated antibodies. (F) H23 shGFP control or shEphA2 (sequence #1) knockdown cells were stimulated with IgG-Fc or Ephrin-A1-Fc for 10 min. Whole cell lysates were analyzed by western blotting with the indicated antibodies. (G) H23 or H2009 cells were treated with increasing concentrations of ALW for 24 hours. Whole cell lysates were analyzed by western blotting with the indicated antibodies. (H&I) Endogenous interactions between EphA2 and PLCγ1 in H23 and H2009 cells were analyzed by Duolink proximity ligation assay (PLA) in shGFP control cells compared to either shEphA2 or shPLCG1 knockdown cells. PLA signals (dots) were quantified from 3–6 40× fields. Data are presented as mean ± SD. *, p<0.05, Student’s t-test. (J) IgG or PLCγ1 immunoprecipitates and whole cell lysates from H23 shGFP control or shEphA2 cells were assessed by western blotting with the indicated antibodies.
To verify that EphA2 phosphorylates PLCγ1 via a direct interaction between the two proteins in lung cancer cells, we performed DuoLink proximity ligation assay (PLA). We showed that loss of either EphA2 or PLCγ1 by shRNA reduced the number of EphA2-PLCγ1 interactions compared to control shGFP (Figures 3H&I). Additionally, EphA2 co-immunoprecipitated with PLCγ1 in H23 shGFP control cells, but not in shEphA2 cells, providing evidence of an endogenous EphA2-PLCγ1 interaction (Figure 3J). Together, these data show that EphA2 interacts with and phosphorylates PLCγ1 in human KRAS-mutant lung cancer cell lines.
Loss of PLCγ1 blocks human lung cancer cell growth
Despite PLCγ1’s well-known roles in regulating T-cell development and homeostasis (22) and breast cancer cell migration and invasion (23), a role for PLCγ1 in lung cancer remains unclear. We used three independent siRNAs to knockdown PLCG1 in H23 and H2009 cells (Figure 4A). In both cell lines, transient loss of PLCγ1 significantly reduced cell viability compared to control (Figure 4B). Long term effects of PLCγ1 loss on cell proliferation were assessed by stable knockdown or knockout of PLCG1 by four independent shRNAs or CRISPR-Cas9 mediated genome editing followed by MTT and colony formation assays (Figures 4C–E & Supplemental Figure 2). shPLCG1 cells showed a much slower growth rate and rarely formed colonies even after two weeks in culture compared to shGFP control. Similarly, PLCγ1 loss significantly hindered colony formation in sgPLCG1 cells compared to sgLacZ control, with the reduction in colony formation correlating with the efficiency of knockout (Figures 4F&G). Thus, we demonstrate that PLCG1 promotes the growth of human lung cancer cells in vitro.
Figure 4. PLCγ1 loss inhibits human KRAS-mutant lung cancer cell growth.

(A) Western blot of PLCγ1 levels in H23 cells upon siPLCG1 targeting. (B) Cell viability of H23 and H2009 cells upon knockdown of PLCG1 by siRNA was measured by MTT assay. Representative data are presented as mean ± SD. **, p<0.01; ***, p<0.001, Student’s t-test. (C) Western blot of PLCγ1 levels in H23 and H2009 cells upon knockdown of PLCG1 by shRNA. (D) MTT assays measuring the relative cell viability of H23 and H2009 upon targeting of PLCG1 by shRNA. Representative data are presented as mean ± SD. ***, p<0.001, Two-way ANOVA with Tukey’s post hoc correction for multiple comparisons. (E) Colony growth of shGFP or shPLCG1 H23 and H2009 cells. Quantification of colony area below. Representative data are presented as mean ± SD. ***, p<0.001, Student’s t-test. (F) Western blot of H23 cells upon targeting of PLCG1 by CRISPR-Cas9 mediated genome editing. (G) Colony growth of sgLacZ or sgPLCG1 H23 cells. Quantification of colony area below. Representative data are presented as mean ± SD. **, p<0.01; ***, p<0.001, Student’s t-test.
PLCγ1 deficiency decreases tumor growth in a mouse KPL lung tumor model
To evaluate the in vivo role of PLCγ1 in tumor growth within a competent immune environment, a mouse KPL lung tumor model was established (Figures 5A–C) based on the report from Platt et al (24). An adeno-associated virus (AAV) carrying three adjacent sgRNAs targeting Kras, p53, and Lkb1 genes (KPL), together with a Cre expression cassette and a mutant KrasG12D genomic template, was purified and delivered into the lungs of Rosa26-LSL-Cas9-EGFP knock-in recipient mice via intratracheal instillation (Figure 5A). Cre-mediated recombination allows for EGFP and Cas9 expression in target cells, which leads to mutation of the three target genes via non-homologous end joining (p53 or Lkb1) or homology-directed repair (Kras G12D). The mice developed abundant lung nodules approximately 2–3 months after viral instillation, as monitored by MRI (Figure 5B). Tumor nodules were also visible by EGFP after lung dissection (Figure 5C). EGFP-positive tumor cell populations were then isolated from the tumor mass and single cell clones were established (Figure 5C). Western blots were used to confirm KPL mutations in the clones (Figure 5D), and clone KPL-C2 was selected for use in the following experiments.
Figure 5. PLCγ1 deficiency hinders mouse KPL lung tumor growth.

(A) Schematic of AAV vector used for expression of sgKras, sgp53, sgLkb1, Cre and KrasG12D template. (B) MRI images of tumor formation in KPL mice up to 3 months after viral instillation. (C) Representative image of GFP expression in KPL lung tumors. Cells were isolated from tumors to create KPL tumor cell lines. (D) Single cell clones from KPL tumors were grown to create KPL tumor cell lines (ex. KPL-C1, clone 1). Whole cell lysates were analyzed by western blotting using the indicated antibodies. (E) KPL-C2 cells were treated with increasing doses of ALW. Cell lysates were analyzed by western blotting using the indicated antibodies. (F) Colony assay of KPL-C2 cells with increasing doses of ALW. Quantification in the bottom panel. Data are presented as mean ± SEM. **, p<0.01; ***, p<0.001, Student’s t-test. (G) Western blot showing loss of PLCγ1 upon targeting of KPL-C2 cells with CRISPR-Cas9 sgPLCG1. (H) Colony assay of KPL-C2 cells targeted with sgPLCG1. Quantification in bottom panels. Representative data are presented as mean ± SD. *, p<0.05; **, p<0.01, Student’s t-test. (I-M) sgPLCG1 KPL-C2 cells were injected via tail vein injection back into Rosa26-LSL-Cas9-GFP mice. (I) Tumor formation was visible by GFP expression. (J) Quantification of GFP density of sgLacZ or sgPLCG1 KPL-C2 tumors. Data are presented as mean ± SEM. **, p<0.01; ***, p<0.001, Student’s t-test. (K) Proliferation of sgLacZ or sgPLCG1 KPL-C2 tumors was measured by PCNA immunohistochemistry staining. (L) Quantification of PCNA staining. Data are presented as mean ± SEM. *, p<0.05, Student’s t-test. (M) Apoptosis was measured by TUNEL immunohistochemistry staining. Quantified data are presented as mean ± SEM, Student’s t-test.
In addition to the targeted KPL mutations, KPL-C2 cells had high EphA2 and p-EphA2 expression. Pharmacologic inhibition of EphA2 by ALW effectively blocked both p-EphA2 and p-PLCγ1 (Figure 5E, arrow) and colony growth of KPL cells in a dose dependent manner (Figure 5F), indicating EphA2 might modulate PLCγ1 activity to regulate KPL tumor cell growth. CRISPR-Cas9 mediated genome editing was used to generate PLCγ1 knockout KPL cells (Figure 5G). PLCγ1-deficient KPL cells showed a significant decrease in colony growth in vitro (Figure 5H). sgLacZ control and sgPLCG1 knockout cells were subsequently injected into the tail veins of immune competent mice (Rosa26-LSL-Cas9-EGFP). sgLacZ cells developed a significant number of tumors in the lungs at week three, while PLCG1-deficient cells formed a very limited number of tumors compared to the control cells (Figures 5I&J). In some mice, loss of PLCγ1 completely inhibited tumor formation. PCNA and cleaved-Caspase-3 IHC staining of the tumors showed that PLCγ1 deficiency in these KPL cells inhibited tumor cell proliferation but had little effect on apoptosis (Figures 5K–M), respectively, in agreement with our previous findings that EphA2 knockdown affected tumor cell proliferation but not apoptosis (25,26). Collectively, these data show that PLCγ1 promotes KPL lung tumor growth.
Discussion
EphA2 has emerged as a promising target in several tumor types including lung, pancreatic, breast, and glioblastoma (4,25–29), yet understanding of its proximal downstream signals is not comprehensive. In this report, we identify PLCγ as a novel downstream effector of EphA2 capable of promoting tumor progression in the context of KRAS-mutant lung cancer. In addition to PLCγ1, several other well-known signaling molecules, including S6K1-pBAD, JNK-c-JUN, mTOR, and ERK, are also known to function downstream of EphA2 in lung cancer (4,25,30,31). How cells precisely regulate timing and localization of these interactions downstream of EphA2 remains unanswered. Along with PLCγ, our Y2H screen also identified other EphA2 interactors including Src family proteins, the PTPN3 phosphatase, and PIK3R1, a regulatory subunit of PI3K (Figure 1A). While many of these hits have been implicated in lung tumorigenesis (32–36), additional studies are required to determine whether these interactors participate in EphA2 signaling during lung tumor progression.
The role of PLCγ1 in tumor cell proliferation is controversial. While PLCγ1 has been implicated in directing cell cycle progression (37,38), other reports suggest that PLCγ1 may negatively regulate cell proliferation (39). These conflicting reports suggest that PLCγ1 regulation of cell proliferation may be context dependent, perhaps varying based on the tumor type or activating growth factor. In this study, we show that loss of PLCG1 reduces cell viability of KRAS-mutant lung cancer cell lines in vitro and reduced PCNA staining of KPL lung tumors in vivo. Thus, our data suggests in the context of KRAS-mutant lung cancer, PLCγ1 facilitates tumor cell proliferation. Further, PLCγ has been implicated in AXL-mediated resistance to PI3K inhibition in neck and esophageal squamous cell carcinomas (16). Since EphA2 also plays critical roles in tumor resistance to EGFR kinase inhibitors in lung cancer (5) and B-Raf inhibitors in melanoma (40), it will be interesting to investigate whether PLCγ mediates the EphA2 signaling pathway in drug resistant cells.
In summary, our data reveal that PLCγ1 is a novel interactor of the EphA2 RTK in lung cancer cells, and our data support the idea that targeting this EphA2- PLCγ1 signaling axis could be a promising therapeutic option for treating lung cancer.
Supplementary Material
Acknowledgments
We would like to acknowledge the Vanderbilt Small Animal Image Core for assistance with live animal imaging and the Vanderbilt Translational Pathology Shared Resource for their help with immunohistochemistry staining of tumor sections. This work was supported by a VA Merit Award 5101BX000134 and a VA Research Career Scientist Award (J.C.), NIH grants R01 CA177681 (J.C., D.B.S.), R01 CA95004 (J.C.), T32 CA009592 (L.C.K.), and F31 CA2220804-01 (L.C.K.)
Footnotes
The authors declare that they have no conflict of interest.
References
- 1.Mayekar MK, Bivona TG. Current Landscape of Targeted Therapy in Lung Cancer. Clin Pharmacol Ther [Internet]. 2017. November 1 [cited 2019 Dec 16];102(5):757–64. Available from: http://doi.wiley.com/10.1002/cpt.810 [DOI] [PubMed] [Google Scholar]
- 2.Rikova K, Guo A, Zeng Q, Possemato A, Yu J, Haack H, et al. Global Survey of Phosphotyrosine Signaling Identifies Oncogenic Kinases in Lung Cancer. Cell [Internet]. 2007. December 14 [cited 2019 Dec 16];131(6):1190–203. Available from: https://www.sciencedirect.com/science/article/pii/S009286740701522X [DOI] [PubMed] [Google Scholar]
- 3.Pasquale EB. Eph receptors and ephrins in cancer: bidirectional signalling and beyond. Nat Rev Cancer [Internet]. 2010. March [cited 2019 Nov 11];10(3):165–80. Available from: http://www.nature.com/articles/nrc2806 [DOI] [PMC free article] [PubMed] [Google Scholar]
- 4.Amato KR, Wang S, Hastings AK, Youngblood VM, Santapuram PR, Chen H, et al. Genetic and pharmacologic inhibition of EPHA2 promotes apoptosis in NSCLC. J Clin Invest [Internet]. 2014. May 1 [cited 2016 Jul 5];124(5):2037–49. Available from: http://www.jci.org/articles/view/72522 [DOI] [PMC free article] [PubMed] [Google Scholar]
- 5.Amato KR, Wang S, Tan L, Hastings AK, Song W, Lovly CM, et al. EPHA2 Blockade Overcomes Acquired Resistance to EGFR Kinase Inhibitors in Lung Cancer. Cancer Res [Internet]. 2016. January 15 [cited 2016 Jul 5];76(2):305–18. Available from: http://www.ncbi.nlm.nih.gov/pubmed/26744526 [DOI] [PMC free article] [PubMed] [Google Scholar]
- 6.Barquilla A, Pasquale EB. Eph Receptors and Ephrins: Therapeutic Opportunities. Annu Rev Pharmacol Toxicol [Internet]. 2015. January 6 [cited 2019 Nov 11];55(1):465–87. Available from: http://www.annualreviews.org/doi/10.1146/annurev-pharmtox-011112-140226 [DOI] [PMC free article] [PubMed] [Google Scholar]
- 7.Suh P-G, Park J-I, Manzoli L, Cocco L, Peak JC, Katan M, et al. Multiple roles of phosphoinositide-specific phospholipase C isozymes. BMB Rep [Internet]. 2008. June 30 [cited 2019 Nov 11];41(6):415–34. Available from: http://www.ncbi.nlm.nih.gov/pubmed/18593525 [DOI] [PubMed] [Google Scholar]
- 8.Jang H-J, Suh P-G, Lee YJ, Shin KJ, Chae YC. PLCγ1: Potential arbitrator of cancer progression. Adv Biol Regul [Internet]. 2018. January 1 [cited 2019 Nov 11];67:179–89. Available from: https://www.sciencedirect.com/science/article/pii/S2212492617301677?via%3Dihub#bib2 [DOI] [PubMed] [Google Scholar]
- 9.Yang YR, Follo MY, Cocco L, Suh P-G. The physiological roles of primary phospholipase C. Adv Biol Regul [Internet]. 2013. September [cited 2019 Nov 11];53(3):232–41. Available from: http://www.ncbi.nlm.nih.gov/pubmed/24041464 [DOI] [PubMed] [Google Scholar]
- 10.Ji QS, Winnier GE, Niswender KD, Horstman D, Wisdom R, Magnuson MA, et al. Essential role of the tyrosine kinase substrate phospholipase C-gamma1 in mammalian growth and development. Proc Natl Acad Sci U S A [Internet]. 1997. April 1 [cited 2019 Dec 6];94(7):2999–3003. Available from: http://www.ncbi.nlm.nih.gov/pubmed/9096335 [DOI] [PMC free article] [PubMed] [Google Scholar]
- 11.Faccio R, Cremasco V. PLCγ2: where bone and immune cells find their common ground. Ann N Y Acad Sci [Internet]. 2010. April 1 [cited 2019 Dec 6];1192(1):124–30. Available from: http://doi.wiley.com/10.1111/j.1749-6632.2009.05217.x [DOI] [PubMed] [Google Scholar]
- 12.Sala G, Dituri F, Raimondi C, Previdi S, Maffucci T, Mazzoletti M, et al. Phospholipase Cγ1 Is Required for Metastasis Development and Progression. Cancer Res [Internet]. 2008. December 15 [cited 2019 Nov 11];68(24):10187–96. Available from: http://www.ncbi.nlm.nih.gov/pubmed/19074886 [DOI] [PubMed] [Google Scholar]
- 13.Arteaga CL, Johnson MD, Todderud G, Coffey RJ, Carpenter G, Page DL. Elevated content of the tyrosine kinase substrate phospholipase C-gamma 1 in primary human breast carcinomas. Proc Natl Acad Sci U S A [Internet]. 1991. December 1 [cited 2019 Nov 11];88(23):10435–9. Available from: http://www.ncbi.nlm.nih.gov/pubmed/1683701 [DOI] [PMC free article] [PubMed] [Google Scholar]
- 14.Lattanzio R, Iezzi M, Sala G, Tinari N, Falasca M, Alberti S, et al. PLC-gamma-1 phosphorylation status is prognostic of metastatic risk in patients with early-stage Luminal-A and -B breast cancer subtypes. BMC Cancer [Internet]. 2019. December 30 [cited 2019 Nov 11];19(1):747 Available from: https://bmccancer.biomedcentral.com/articles/10.1186/s12885-019-5949-x [DOI] [PMC free article] [PubMed] [Google Scholar]
- 15.Gouaze-Andersson V, Delmas C, Taurand M, Martinez-Gala J, Evrard S, Mazoyer S, et al. FGFR1 Induces Glioblastoma Radioresistance through the PLCγ/Hif1 Pathway. Cancer Res [Internet]. 2016. May 15 [cited 2019 Nov 11];76(10):3036–44. Available from: http://www.ncbi.nlm.nih.gov/pubmed/26896280 [DOI] [PubMed] [Google Scholar]
- 16.Elkabets M, Pazarentzos E, Juric D, Sheng Q, Pelossof RA, Brook S, et al. AXL Mediates Resistance to PI3Kα Inhibition by Activating the EGFR/PKC/mTOR Axis in Head and Neck and Esophageal Squamous Cell Carcinomas. Cancer Cell [Internet]. 2015. April 13 [cited 2019 Dec 16];27(4):533–46. Available from: http://www.ncbi.nlm.nih.gov/pubmed/25873175 [DOI] [PMC free article] [PubMed] [Google Scholar]
- 17.Liu T-M, Woyach JA, Zhong Y, Lozanski A, Lozanski G, Dong S, et al. Hypermorphic mutation of phospholipase C, γ2 acquired in ibrutinib-resistant CLL confers BTK independency upon B-cell receptor activation. Blood [Internet]. 2015. July 2 [cited 2019 Nov 11];126(1):61–8. Available from: https://ashpublications.org/blood/article/126/1/61/34349/Hypermorphic-mutation-of-phospholipase-C-γ2 [DOI] [PMC free article] [PubMed] [Google Scholar]
- 18.Hunter SG, Zhuang G, Brantley-Sieders D, Swat W, Cowan CW, Chen J. Essential Role of Vav Family Guanine Nucleotide Exchange Factors in EphA Receptor-Mediated Angiogenesis. Mol Cell Biol [Internet]. 2006. July 1 [cited 2019 Dec 6];26(13):4830–42. Available from: http://www.ncbi.nlm.nih.gov/pubmed/16782872 [DOI] [PMC free article] [PubMed] [Google Scholar]
- 19.Zhuang G, Hunter S, Hwang Y, Chen J. Regulation of EphA2 Receptor Endocytosis by SHIP2 Lipid Phosphatase via Phosphatidylinositol 3-Kinase-dependent Rac1 Activation. J Biol Chem [Internet]. 2007. January 26 [cited 2019 Dec 9];282(4):2683–94. Available from: http://www.ncbi.nlm.nih.gov/pubmed/17135240 [DOI] [PubMed] [Google Scholar]
- 20.Carpenter G, Ji Q. Phospholipase C-γ as a Signal-Transducing Element. Exp Cell Res [Internet]. 1999. November 25 [cited 2019 Dec 9];253(1):15–24. Available from: https://www.sciencedirect.com/science/article/pii/S0014482799946712?via%3Dihub [DOI] [PubMed] [Google Scholar]
- 21.Fang W Bin, Brantley-Sieders DM, Hwang Y, Ham A-JL, Chen J. Identification and Functional Analysis of Phosphorylated Tyrosine Residues within EphA2 Receptor Tyrosine Kinase. J Biol Chem [Internet]. 2008. June 6 [cited 2019 Nov 11];283(23):16017–26. Available from: http://www.ncbi.nlm.nih.gov/pubmed/18387945 [DOI] [PMC free article] [PubMed] [Google Scholar]
- 22.Koss H, Bunney TD, Behjati S, Katan M. Dysfunction of phospholipase Cγ in immune disorders and cancer. Trends Biochem Sci [Internet]. 2014. December [cited 2019 Nov 11];39(12):603–11. Available from: https://linkinghub.elsevier.com/retrieve/pii/S0968000414001704 [DOI] [PubMed] [Google Scholar]
- 23.Emmanouilidi A, Lattanzio R, Sala G, Piantelli M, Falasca M. The role of phospholipase Cγ1 in breast cancer and its clinical significance. Futur Oncol [Internet]. 2017. September 22 [cited 2019 Nov 11];13(22):1991–7. Available from: http://www.ncbi.nlm.nih.gov/pubmed/28829192 [DOI] [PubMed] [Google Scholar]
- 24.Platt RJ, Chen S, Zhou Y, Yim MJ, Swiech L, Kempton HR, et al. CRISPR-Cas9 Knockin Mice for Genome Editing and Cancer Modeling. Cell. 2014;159(2):440–55. [DOI] [PMC free article] [PubMed] [Google Scholar]
- 25.Song W, Ma Y, Wang J, Brantley-Sieders D, Chen J. JNK Signaling Mediates EPHA2-Dependent Tumor Cell Proliferation, Motility, and Cancer Stem Cell-like Properties in Non-Small Cell Lung Cancer. Cancer Res [Internet]. 2014. May 1 [cited 2019 Nov 11];74(9):2444–54. Available from: http://www.ncbi.nlm.nih.gov/pubmed/24607842 [DOI] [PMC free article] [PubMed] [Google Scholar]
- 26.Song W, Hwang Y, Youngblood VM, Cook RS, Balko JM, Chen J, et al. Targeting EphA2 impairs cell cycle progression and growth of basal-like/triple-negative breast cancers. Oncogene [Internet]. 2017. October 5 [cited 2019 Nov 11];36(40):5620–30. Available from: http://www.nature.com/articles/onc2017170 [DOI] [PMC free article] [PubMed] [Google Scholar]
- 27.Brantley-Sieders DM, Zhuang G, Hicks D, Fang W Bin, Hwang Y, Cates JMM, et al. The receptor tyrosine kinase EphA2 promotes mammary adenocarcinoma tumorigenesis and metastatic progression in mice by amplifying ErbB2 signaling. J Clin Invest [Internet]. 2008. January 2 [cited 2019 Nov 11];118(1):64–78. Available from: http://www.ncbi.nlm.nih.gov/pubmed/18079969 [DOI] [PMC free article] [PubMed] [Google Scholar]
- 28.Paraiso KHT, Das Thakur M, Fang B, Koomen JM, Fedorenko IV, John JK, et al. Ligand-independent EPHA2 signaling drives the adoption of a targeted therapy-mediated metastatic melanoma phenotype. Cancer Discov [Internet]. 2015. March 1 [cited 2019 Nov 11];5(3):264–73. Available from: http://cancerdiscovery.aacrjournals.org/cgi/doi/10.1158/2159-8290.CD-14-0293 [DOI] [PMC free article] [PubMed] [Google Scholar]
- 29.Qazi MA, Vora P, Venugopal C, Adams J, Singh M, Hu A, et al. Cotargeting Ephrin Receptor Tyrosine Kinases A2 and A3 in Cancer Stem Cells Reduces Growth of Recurrent Glioblastoma. Cancer Res [Internet]. 2018. September 1 [cited 2019 Nov 11];78(17):5023–37. Available from: http://www.ncbi.nlm.nih.gov/pubmed/29945963 [DOI] [PubMed] [Google Scholar]
- 30.Faoro L, Singleton PA, Cervantes GM, Lennon FE, Choong NW, Kanteti R, et al. EphA2 mutation in lung squamous cell carcinoma promotes increased cell survival, cell invasion, focal adhesions, and mammalian target of rapamycin activation. J Biol Chem [Internet]. 2010. June 11 [cited 2019 Nov 13];285(24):18575–85. Available from: http://www.jbc.org/lookup/doi/10.1074/jbc.M109.075085 [DOI] [PMC free article] [PubMed] [Google Scholar]
- 31.Brannan JM, Sen B, Saigal B, Prudkin L, Behrens C, Solis L, et al. EphA2 in the Early Pathogenesis and Progression of Non-Small Cell Lung Cancer. Cancer Prev Res [Internet]. 2009. December 1 [cited 2019 Nov 13];2(12):1039–49. Available from: http://www.ncbi.nlm.nih.gov/pubmed/19934338 [DOI] [PubMed] [Google Scholar]
- 32.Giaccone G, Zucali PA. Src as a potential therapeutic target in non-small-cell lung cancer. Ann Oncol [Internet]. 2008. March 19 [cited 2019 Dec 9];19(7):1219–23. Available from: https://academic.oup.com/annonc/article-lookup/doi/10.1093/annonc/mdn048 [DOI] [PubMed] [Google Scholar]
- 33.Taniguchi CM, Winnay J, Kondo T, Bronson RT, Guimaraes AR, Alemán JO, et al. The Phosphoinositide 3-Kinase Regulatory Subunit p85α Can Exert Tumor Suppressor Properties through Negative Regulation of Growth Factor Signaling. Cancer Res [Internet]. 2010. July 1 [cited 2019 Dec 9];70(13):5305–15. Available from: http://www.ncbi.nlm.nih.gov/pubmed/20530665 [DOI] [PMC free article] [PubMed] [Google Scholar]
- 34.Peng Y, Dai Y, Hitchcock C, Yang X, Kassis ES, Liu L, et al. Insulin growth factor signaling is regulated by microRNA-486, an underexpressed microRNA in lung cancer. Proc Natl Acad Sci [Internet]. 2013. September 10 [cited 2019 Dec 9];110(37):15043–8. Available from: http://www.ncbi.nlm.nih.gov/pubmed/23980150 [DOI] [PMC free article] [PubMed] [Google Scholar]
- 35.Li M-Y, Lai P-L, Chou Y-T, Chi A-P, Mi Y-Z, Khoo K-H, et al. Protein tyrosine phosphatase PTPN3 inhibits lung cancer cell proliferation and migration by promoting EGFR endocytic degradation. Oncogene [Internet]. 2015. July 29 [cited 2019 Dec 9];34(29):3791–803. Available from: http://www.ncbi.nlm.nih.gov/pubmed/25263444 [DOI] [PubMed] [Google Scholar]
- 36.Li M-Y, Peng W-H, Wu C-H, Chang Y-M, Lin Y-L, Chang G-D, et al. PTPN3 suppresses lung cancer cell invasiveness by counteracting Src-mediated DAAM1 activation and actin polymerization. Oncogene [Internet]. 2019. October 12 [cited 2019 Dec 9];38(44):7002–16. Available from: http://www.ncbi.nlm.nih.gov/pubmed/31406243 [DOI] [PubMed] [Google Scholar]
- 37.Wang Z, Glück S, Zhang L, Moran MF. Requirement for Phospholipase C-γ1 Enzymatic Activity in Growth Factor-Induced Mitogenesis. Mol Cell Biol [Internet]. 1998. January 1 [cited 2019 Dec 16];18(1):590–7. Available from: http://mcb.asm.org/lookup/doi/10.1128/MCB.18.1.590 [DOI] [PMC free article] [PubMed] [Google Scholar]
- 38.Browaeys-Poly E, Perdereau D, Lescuyer A, Burnol A-F, Cailliau K. Akt interaction with PLC(gamma) regulates the G(2)/M transition triggered by FGF receptors from MDA-MB-231 breast cancer cells. Anticancer Res [Internet]. 2009. December [cited 2019 Dec 16];29(12):4965–9. Available from: http://www.ncbi.nlm.nih.gov/pubmed/20044603 [PubMed] [Google Scholar]
- 39.Choi JH, Kim HS, Kim S-H, Yang YR, Bae YS, Chang J-S, et al. Phospholipase Cgamma1 negatively regulates growth hormone signalling by forming a ternary complex with Jak2 and protein tyrosine phosphatase-1B. Nat Cell Biol [Internet]. 2006. December 26 [cited 2019 Dec 16];8(12):1389–97. Available from: http://www.nature.com/articles/ncb1509 [DOI] [PubMed] [Google Scholar]
- 40.Miao B, Ji Z, Tan L, Taylor M, Zhang J, Choi HG, et al. EPHA2 Is a Mediator of Vemurafenib Resistance and a Novel Therapeutic Target in Melanoma. Cancer Discov [Internet]. 2015. March 1 [cited 2019 Dec 31];5(3):274–87. Available from: http://www.ncbi.nlm.nih.gov/pubmed/25542448 [DOI] [PMC free article] [PubMed] [Google Scholar]
- 41.Cheng F, Desai RJ, Handy DE, Wang R, Schneeweiss S, Barabási A-L, et al. Network-based approach to prediction and population-based validation of in silico drug repurposing. Nat Commun [Internet]. 2018. December 12 [cited 2019 Dec 6];9(1):2691 Available from: http://www.ncbi.nlm.nih.gov/pubmed/30002366 [DOI] [PMC free article] [PubMed] [Google Scholar]
- 42.Cheng F, Kovács IA, Barabási A-L. Network-based prediction of drug combinations. Nat Commun [Internet]. 2019. December 13 [cited 2019 Dec 6];10(1):1197 Available from: http://www.ncbi.nlm.nih.gov/pubmed/30867426 [DOI] [PMC free article] [PubMed] [Google Scholar]
- 43.Cheng F, Lu W, Liu C, Fang J, Hou Y, Handy DE, et al. A genome-wide positioning systems network algorithm for in silico drug repurposing. Nat Commun [Internet]. 2019. December 2 [cited 2019 Dec 6];10(1):3476 Available from: http://www.ncbi.nlm.nih.gov/pubmed/31375661 [DOI] [PMC free article] [PubMed] [Google Scholar]
- 44.Youngblood VM, Kim LC, Edwards DN, Hwang Y, Santapuram PR, Stirdivant SM, et al. The ephrin-A1/EPHA2 signaling axis regulates glutamine metabolism in HER2-positive breast cancer. Cancer Res [Internet]. 2016. February 1 [cited 2016 Feb 5];0008-5472.CAN-15-0847-. Available from: http://cancerres.aacrjournals.org/content/early/2016/01/30/0008-5472.CAN-15-0847.abstract [DOI] [PMC free article] [PubMed] [Google Scholar]
- 45.Brantley-Sieders DM, Zhuang G, Vaught D, Freeman T, Hwang Y, Hicks D, et al. Host Deficiency in Vav2/3 Guanine Nucleotide Exchange Factors Impairs Tumor Growth, Survival, and Angiogenesis In vivo. Mol Cancer Res [Internet]. 2009. May 1 [cited 2019 Dec 16];7(5):615–23. Available from: http://www.ncbi.nlm.nih.gov/pubmed/19435813 [DOI] [PMC free article] [PubMed] [Google Scholar]
- 46.Sentmanat MF, Peters ST, Florian CP, Connelly JP, Pruett-Miller SM. A Survey of Validation Strategies for CRISPR-Cas9 Editing. Sci Rep [Internet]. 2018. December 1 [cited 2020 Jun 24];8(1):1–8. Available from: https://www.nature.com/articles/s41598-018-19441-8 [DOI] [PMC free article] [PubMed] [Google Scholar]
Associated Data
This section collects any data citations, data availability statements, or supplementary materials included in this article.