Abstract
OBJECTIVES:
As the number of Hispanics with dementia continues to increase, greater use of post-acute care in nursing home settings will be required. Little is known about the quality of skilled nursing facilities (SNFs) that disproportionally serve Hispanic patients with dementia and whether the quality of SNF care varies by the concentration of MA patients with dementia admitted to these SNFs.
DESIGN:
Cross-sectional study using 2016 data from Medicare certified providers.
SETTING AND PARTICIPANTS:
Our cohort included 177,396 beneficiaries with probable dementia from 8,884 skilled nursing facilities.
METHODS:
We examined facility-level quality of care among facilities with high and low-proportion of Hispanic beneficiaries with probable dementia enrolled in MA and FFS using data from Medicare certified providers. Three facility-level measures were used to assess quality of care: (a) 30-day rehospitalization rate; (b) successful discharge from the facility to the community; and (c) Medicare five-star quality ratings.
RESULTS:
About 20% of residents were admitted to 1,615 facilities with a resident population that was more than 15% Hispanic. Facilities with a higher share of Hispanic residents had a lower proportion of 4- or 5-star facilities by an average of 14 to 15% as compared to facilities with little to no Hispanics. In addition, these facilities had a 1% higher readmission rate. There were also some differences in the quality of facilities with high (≥26.5%) and low (<26.5%) proportions of MA beneficiaries. On average, SNFs with high concentration of MA patients have lower readmission rates and higher successful discharge, but lower star ratings.
CONCLUSION AND IMPLICATIONS:
Achieving better quality of care for people with dementia may require efforts to improve the quality of care among facilities with a high concentration of Hispanic residents.
Keywords: Alzheimer’s disease and related dementias, post-acute care residents with dementia, quality of care for Hispanics with dementia, quality of skilled nursing facilities
Summary:
Medicare Advantage and fee-for-service beneficiaries with dementia going to skilled nursing facilities with high proportion of Hispanic residents are more likely to go to facilities that are characterized by poor quality.
INTRODUCTION
The number of Hispanics affected by Alzheimer’s disease and related dementias (ADRD) is expected to increase six-fold from 200,000 in 2007 to 1.3 million by 2050.1 This prediction is partly driven by the growing number of Hispanics in the US, 2 which is compounded by longer life expectancy,3 socioeconomic disadvantages,4 and high prevalence of chronic conditions that are associated with an increased risk for ADRD.5
Utilization of skilled nursing and long-term care is highest among people with ADRD, with over 50% of nursing home residents having dementia.6 Short-term nursing home residents with ADRD who are receiving post-acute care are at a high risk of rehospitalizations and long-stay nursing home placement, particularly when such residents receive poor quality, uncoordinated, and fragmented care.7,8 Rising post-acute care costs, along with disparities in quality of care and clinical outcomes by race, sites of care, and types of insurance are major challenges to the US post-acute health care system.9
The Medicare program covers 95% of nursing home residents with ADRD and generally reimburses providers with fee-for-service (FFS) payments, which incentivizes higher volume and intensity of care. This could potentially lead to longer length of nursing home stay, high rates of hospitalizations, particularly for racial and ethnic minorities and those with dual Medicaid coverage.7 Medicare has recently supported alternative payment models to improve the value of care for high-need, high-cost Medicare beneficiaries, such as those with ADRD. However, virtually all the prior research on the care and outcomes of residents with ADRD is derived from residents enrolled in the FFS program, with remarkably few studies of persons with ADRD in Medicare Advantage (MA) plans. This raises a critical gap in understanding racial and ethnic disparities among people with ADRD enrolled in MA plans.
The purpose of this paper is to evaluate the quality of facility-level nursing home that disproportionally serve newly admitted Medicare Hispanic residents with probable dementia compared to non-Hispanic whites with probable dementia. We hypothesized that disparities in the quality of care would be higher among facilities with a high Hispanic population. We included both FFS and MA beneficiaries admitted for skilled nursing post-acute care to explore whether quality of skilled nursing facility (SNF) care also varies by the concentration of MA patients in these facilities. Including MA patients in this analysis is important because enrollment in MA has more than tripled from 5.3 million in 2004 to 17.6 million in 2016.10 For Hispanics, MA plays a critical role in financing and delivering care; approximately 40% are enrolled in a MA plan, the highest participation rate of any racial or ethnic group.11 MA plans receive capitated payments for enrollees and are held accountable for quality of care. This may be effective at improving quality of care while reducing costs for populations with ADRD. Alternatively, plans could provide inadequate coverage of Medicare services and avoid complex residents.12 Prior research indicates that overall MA beneficiaries receive care in lower rated nursing homes than FFS beneficiaries.13 Therefore, we also hypothesized that quality of care would be lower among facilities with a high concentration of MA patients with ADRD.
METHODS
Our approach used data from Medicare-certified nursing homes to examine facility-level quality of care among facilities with high and low-proportion of Hispanic beneficiaries with probable dementia enrolled in MA or FFS. We used the approach by Mor and colleagues to measure segregation and quality of care in skilled nursing facilities. 14,15 Following their approach, Hispanic populations tend to be concentrated in specific regions across the US. Therefore, we focused on the US Census Metropolitan Statistical Areas with at least 5 percent of Hispanics in the total population in 2016 (this included areas all across the US). 16 In order to classify SNFs serving Hispanic older adults with ADRD, we identified post-acute care patients with probable dementia and then calculated the proportion of Hispanic beneficiaries in each SNF. The study protocol was approved by the University’s Human Research Protections Office and the Centers for Medicare & Medicaid Services Privacy Board.
Data
We linked individual-level clinical and administrative data that includes use and quality of skilled nursing facility care; assessments of health and functional status; and sociodemographic data for all Medicare enrollees. These files have all been linked to each other using unique person identifiers that allow us to create historical person-level utilization records. This “Residential History File” allows us to track individuals as they move through space and time, including between care settings (e.g. skilled nursing facility, hospital, etc.). 17 The Medicare Beneficiary Summary File contains demographics, MA or fee-for-service enrollment, dual eligibility and ZIP Code. We created two mutually exclusive categories of Hispanics and non-Hispanic whites based on the Research Triangle Institute’s race/ethnicity variable. This variable has high sensitivity, positive predictive value, and kappa for whites and Hispanics.18 The Minimum Data Set (MDS) assessment instrument includes information regarding cognitive function, disease diagnoses, health conditions, and special treatments. The assessments are reported for both traditional Medicare and MA. Reliability of the MDS scales has been previously reported.19,20 In addition, we obtained facility-level characteristics from the Certification and Survey Provider Enhanced Reports (CASPER). Finally, we used the Long-term Care Facts on Care in the United States to obtain readmission and discharge measures at the facility-level, and Nursing Home Compare for information about nursing home quality star ratings.
Sample population
We identified Medicare beneficiaries with probable dementia who initiated a new episode of post-acute nursing home care within one day of discharge following an acute care hospitalization in 2016. We defined ADRD as an active diagnosis of Alzheimer’s disease (I4200) or non-Alzheimer’s dementia (I4800) in the MDS or moderate to severe cognitive impairment according to the validated cognitive functional scale.21 We selected beneficiaries who did not have an admission to a skilled nursing facility in the prior year.
Using the facility ID, we obtained facility-level quality measures. We identified 1,066,133 beneficiaries with and without ADRD who were admitted to 12,539 skilled nursing facilities in 2016. Of those 245,645 beneficiaries had ADRD. We excluded 30,431 cases with missing information on all variables regarding facility-characteristics from CASPER (see variables section). After excluding beneficiaries that were not white or Hispanic (37,818), the final sample included 177,396 (89.12%) White and (10.88%) Hispanic beneficiaries from 8,884 skilled nursing facilities.
Variables
Outcomes
Primary outcomes
The three primary quality outcomes of interest, all generated at the level of the facility, are 1) risk-adjusted successful discharge rates to community within 100 days, 2) 30-day risk-adjusted rehospitalization measure; and 3) Percentage of facilities with high quality ratings (4 or 5 stars) from CMS Nursing Home Compare. Medicare tracks all three of these outcomes for post-acute nursing home residents enrolled in traditional Medicare.22 The successful discharge outcome is defined as a discharge from the nursing home to the community within 100 days, and the resident does not experience an unplanned hospital readmission, new nursing home admission, or death in the 30 days following discharge. Risk-adjustment models for these variables are described in the LTC focus and CMS websites.23,24
Secondary quality outcomes
Additional quality measures of interest included proportion of residents receiving antipsychotics, non-psychotic residents receiving antipsychotics, percentage of long-stay residents with ADL decline, percentage of residents with daily pain, percentage or residents with pressure ulcer, and percentage of residents who were physically restrained. These measures are used to describe SNF quality.23,25
Beneficiary and facility characteristics
Other characteristics of residents in these facilities included average acuity index in the facility (residents needing help with activities of daily living), percentage of residents with high cognitive impairment (CFS≥3), percentage of residents who were low care, and proportion of facility residents whose primary support is Medicaid.
SNF characteristics included number of admissions, whether or not facility has an Alzheimer’s disease Special Care Unit, for-profit, part of a chain. Finally, we described staff characteristics, including number of Registered nurse (RN), Licensed Practical Nurse (LPN), and Certified Nursing Assistant (CNA) hours per resident day in a facility.
Analysis
To calculate nursing home segregation and disparities in performance for Hispanic and non-Hispanic White short-term residents with probable dementia, we first calculated Hispanic segregation using ethnic composition among people with probable dementia at the facility level: 1) no Hispanic (0%); 2) some Hispanics (≤15%) and 3) more than 15% of Hispanics. These cut-off points have been used in prior literature.15 However, we performed a sensitivity analysis with alternative cut-off points that grouped facilities into terciles and quartiles according to the percentage of Hispanics in the facility (See Appendix Table 1 for results).
We compared secondary quality outcomes and beneficiary and facility characteristics according to the concentration of Hispanic beneficiaries with ADRD. Next, we calculated unadjusted and adjusted means26 for the three main quality outcomes. Adjusted linear models included SNF for-profit status, part of chain, the percentage of residents supported by Medicaid, volume of residents, certified nursing assistant hours per day per resident, licensed practical nurse per hour per resident per day, and registered nurse per hour per day per resident. Staffing measures were not included in the star rating models since CMS already uses these measures in the composite score. A separate model included ZIP code fixed effects to account for ZIP code level unobservable factors. Third, we included an interaction term for Hispanic concentration (0%; ≤15% and >15% of Hispanics) and MA concentration (low ≥26.5% and high > 26.5 based on distribution) to assess if the quality of the SNFs with different concentration of Hispanics with dementia varied by the proportion of MA beneficiaries in those SNFs. Analyses were performed using STATA, version 16.0 (StataCorp LP, College Station, TX, USA).
RESULTS
The final sample included 117,396 beneficiaries with dementia who were admitted to 8,884 SNFs. Approximately 52,888 beneficiaries (29.8%) were admitted to 5,148 facilities with no Hispanics, 88,622 (50.0%) were admitted to 2,121 facilities with some Hispanic beneficiaries, and 35,886 (20.2%) were admitted to 1,615 facilities with more than 15% of Hispanic beneficiaries (Table 1). A higher proportion of MA beneficiaries (~8.5%) were admitted to SNFs with higher proportion of Hispanics. Facilities with a high proportion of Hispanics had more residents with high probable dementia, and lower quality on different outcomes such as receiving antipsychotics, pressure ulcers, and physically restrained compared to facilities without Hispanics or with some Hispanics (p<.05).
TABLE 1:
FACILITY CHARACTERISTICS BY THE PROPORTION OF HISPANIC RESIDENTS WITH DEMENTIA WHO WERE ADMITTED TO THE SNFS
| SNFs with no Hispanics | SNFs with some Hispanics (≤15%) | SNFs with high proportion of Hispanics (>15%) | |
|---|---|---|---|
| Observations | (52,888 beneficiaries in 5,148 SNFs) | (88,622 beneficiaries in 2,121 SNFs) | (35,886 beneficiaries in 1,615 SNFs) |
| SNF and Resident Characteristics | |||
| Proportion of MA residents | 27.1 (44.4) | 27.9 (44.9) ‡ | 38.70 (48.70) *,† |
| Resident Acuity index | 12.3 (.8) | 12.5 (.8) ‡ | 12.90 (1.11) *,† |
| Proportion of residents with probable dementia | 12.3 (8.4) | 12.1 (8.3) ‡ | 14.34 (8.98) *,† |
| Overall presence of behavioral symptoms among residents | 13.4 (34.1) | 10.6 (30.8) ‡ | 9.09 (28.75) *,† |
| Residents paid by Medicaid | 54.9 (19.5) | 52.4 (18.9) ‡ | 62.22 (16.91) *,† |
| Residents classified as low care | 8.2 (6.8) | 6.8 (5.8) ‡ | 6.96 (6.75) *,† |
| Number of admissions per bed | 2.7 (1.5) | 3.6 (1.8) ‡ | 2.9 (1.7) *,† |
| Alzheimer’s SCU in Facility | 19.2 (39.4) | 17.9 (38.3) ‡ | 8.6 (2.8) *,† |
| For-profit | 68.0 (46.6) | 74.5 (43.6) ‡ | 84.5 (36.2) *,† |
| Part of a chain | 60.7 (48.8) | 58.8 (49.2) ‡ | 53.5 (49.9) *,† |
| RN HPRD | 2.4 (0.7) | 2.4 (0.6) ‡ | 2.4 (0.6) *,† |
| LPN HPRD | 0.9 (0.3) | 0.9 (0.4) ‡ | 0.9 (0.3) † |
| CNA HPRD | 0.5 (0.3) | 0.6 (0.3) ‡ | 0.5 (0.3) *,† |
| Secondary SNF Quality measures | |||
| Residents Receiving antipsychotics | 16.0 (8.7) | 14.3 (7.6) c | 17.80 (11.0) *,† |
| Non-psychotic residents receiving antipsychotics | 10.9 (5.8) | 9.5 (5.2) ‡ | 10.60 (6.7) *,† |
| Residents with ADL decline | 14.5 (7.8) | 13.7 (7.4) ‡ | 13.9 (8.0) *,† |
| Residents with Daily pain | 6.8 (6.5) | 5.3 (5.7) ‡ | 4.2 (5.1) *,† |
| Residents with Pressure ulcer | 5.4 (3.9) | 5.6 (3.9) ‡ | 6.8 (4.3) *,† |
| Residents Physically restrained | 0.7 (2.4) | 0.7 (3.8) ‡ | 0.8 (3.3) *,† |
Notes: The SNF values reported in table 1 are mean and standard deviations in parenthesis.
denotes differences between SNFs with high proportion of Hispanics and no-Hispanics;
denotes differences between SNFs with high proportion of Hispanics and SNFs with some Hispanics;.
denotes differences between SNFs with some Hispanics and no Hispanics.
These differences are significant at p < 0.05. Abbreviations: SCU, special care unit; RN HPRD, registered nurse hours per resident day; LPN HPRD, licensed practical nurse hours per resident day; CAN, certified nursing assistant hours per resident day; ADL, activities of daily living.
In Figure 1, we present results for 30-day readmission rate, successful discharge to community, and percent of facilities with a 4- or 5-star rating according to the percentage of Hispanic beneficiaries in the facility. These results are risk-adjusted for beneficiary characteristics but not facility characteristics. SNFs with no Hispanic beneficiaries with ADRD had a risk-adjusted rehospitalization rate of 16.6% (95% confidence interval [CI], 16.4 – 16.8), compared to 17.2 % (95% CI, 17.0 – 17.4) for facilities with ≤15% Hispanics, and 18.1% (95% CI, 17.8 – 18.3) among facilities with over 15% of Hispanics. The risk adjusted percentage of beneficiaries who were successfully discharged to the community for facilities with some Hispanic beneficiaries (69.1 %, 95% CI, 68.8 – 69.5) was similar to facilities with >15% Hispanics (68.5 %, 95% CI, 67.7 – 69.4). These rates were significantly higher compared to facilities with no Hispanics (66.9%, 95% CI, 66.5 – 67.3). Finally, 48.7% (95% CI, 46.4 – 51.1) of SNFs with no Hispanics with ADRD had 4- or 5-star ratings compared 55.1% (95% CI, 52.6 – 57.7) of SNFs with some Hispanics and 42.8% (95% CI, 39.1 – 46.6) of SNFs with high concentration of Hispanics. In general, these differences remained similar after adjusting for facility characteristics (See Figure 2).
FIGURE 1. UNADJUSTED QUALITY OF CARE OF SKILLED NURSING FACILITIES FOR FFS AND MA RESIDENTS WITH DEMENTIA.
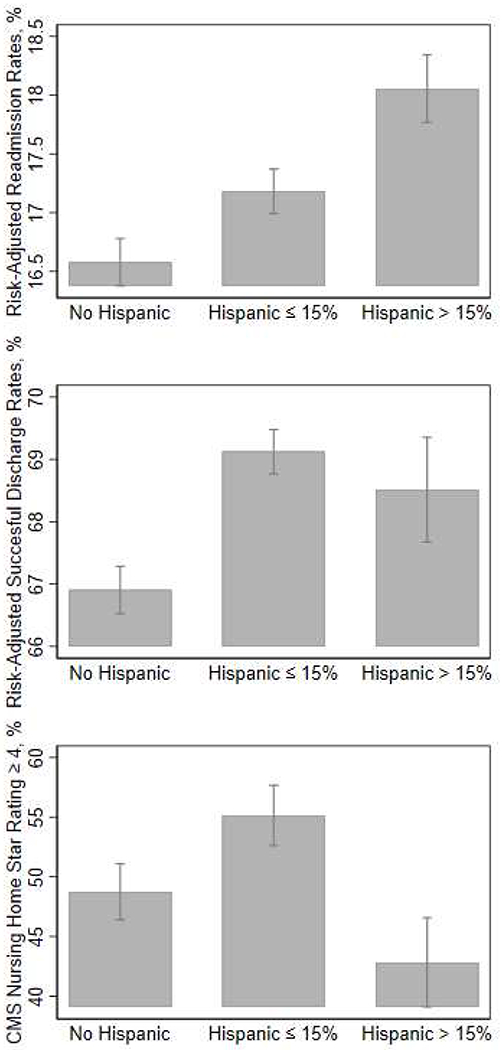
Note: These rates are unadjusted for facility characteristics
FIGURE 2. ADJUSTED MEASURES OF QUALITY OF CARE OF SKILLED NURSING FACILITIES.
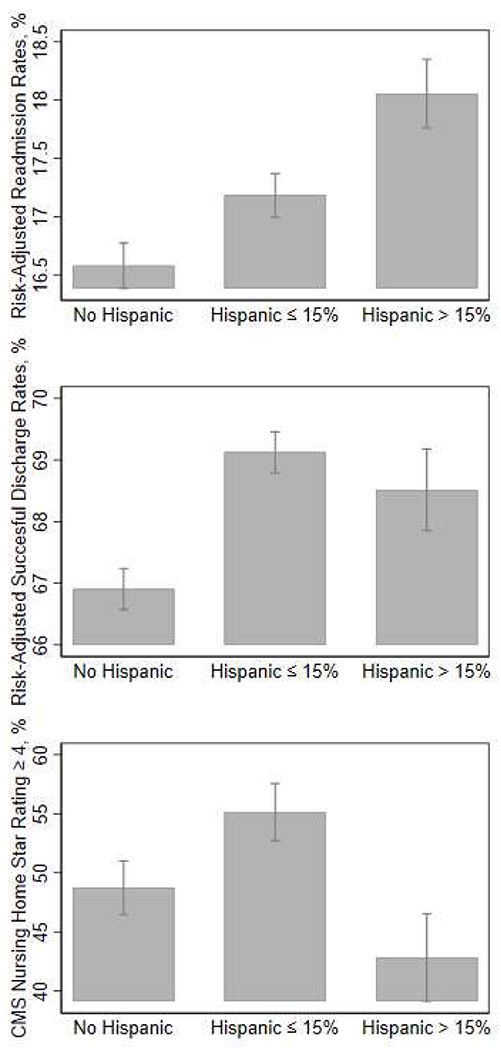
Note: Means are adjusted for facility characteristics
In Figure 3 we present the model results after adjusting for facility-characteristics and including a fixed effect for ZIP-code. Readmission rates were about one percentage point higher among facilities with high (>15%) Hispanic concentration compared to facilities with no Hispanics or some (≤15%) Hispanics (1.0% and 0.7% points difference, P < .0.05). However, there was no significant difference in readmission rates among SNFs with no Hispanics or SNFs with some Hispanics. Contrary to the results presented in Figures 1 and 2, the successful discharge rate for SNFs with >15% Hispanics was significantly lower (66.7%; 95% CI, 66.1 – 67.3) than SNFs with no Hispanics (67.5%; 95% CI, 67.1 – 67.8). SNFs with ≤15% Hispanics had a successful community discharge rate of 69.5% (95% CI, 69.2 – 69.8). The percentage of facilities with >15% Hispanic beneficiaries that were rated as four- or five-stars was about 14.2 percentage points lower (95% CI, 9.7 – 18.6) and 15.3 percentage points lower (95% CI, 11.2 – 19.3) than facilities with no Hispanics and ≤15% Hispanics, respectively.
FIGURE 3. QUALITY OF SKILLED NURSING FACILITY CARE ADJUSTING FOR FACILITY CHARACTERISTICS AND ZIP CODE.
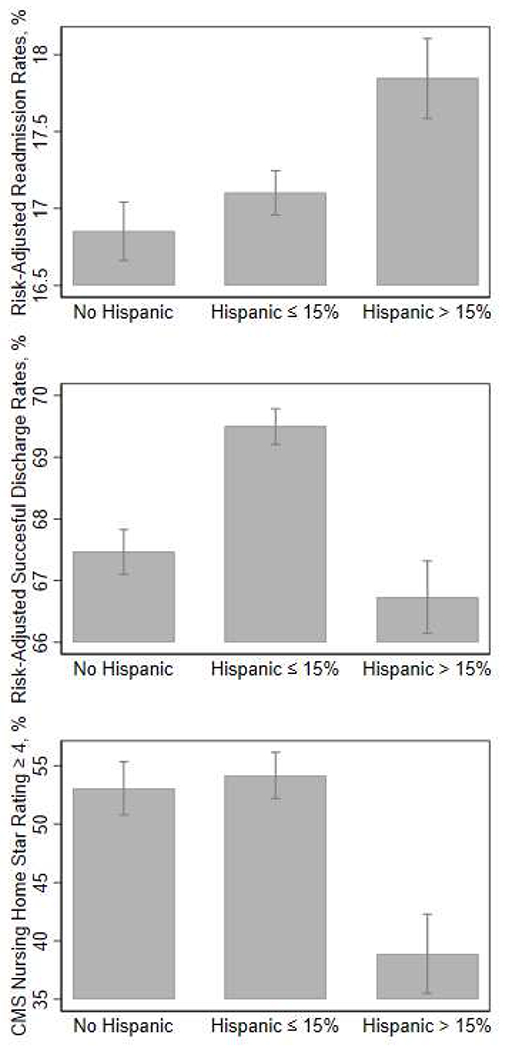
Note: Adjusted linear models included SNF for-profit status, part of chain, the percentage of residents supported by Medicaid, volume of residents, certified nursing assistant hours per day per resident, licensed practical nurse per hour per resident per day, and registered nurse per hour per day per resident and ZIP-code fixed effects. Staffing measures were not included in the star rating models since CMS already uses these measures in the composite score.
Figure 4 shows the differences in primary quality outcomes according to the proportion of Hispanic beneficiaries (no Hispanics, ≤15% Hispanics and 15% or more Hispanics) and if the SNF had a high (≥26.5%) or low (< 26.5%) proportion of MA beneficiaries. Among SNFs with no Hispanic beneficiaries, facilities with a low proportion of MA beneficiaries had about half percentage point lower readmission rates compared to the facilities with a high concentrations of MA beneficiaries (95% CI, 0.1 – 0.8). However, among SNFs with a high proportion of Hispanics with ADRD, readmissions rates for facilities with a high concentration of MA beneficiaries were lower by 0.6 percentage points compared to facilities with a low concentration of MA beneficiaries (95% CI, 0.01 – 0.1). There was no significant difference in readmission rates by the concentration of MA beneficiaries among SNFs with some Hispanics with ADRD.
FIGURE 4. QUALITY OF SKILLED NURSING FACILITY CARE BY PERCENT OF RESIDENTS WHO ARE HISPANIC AND MA CONCENTRATION.
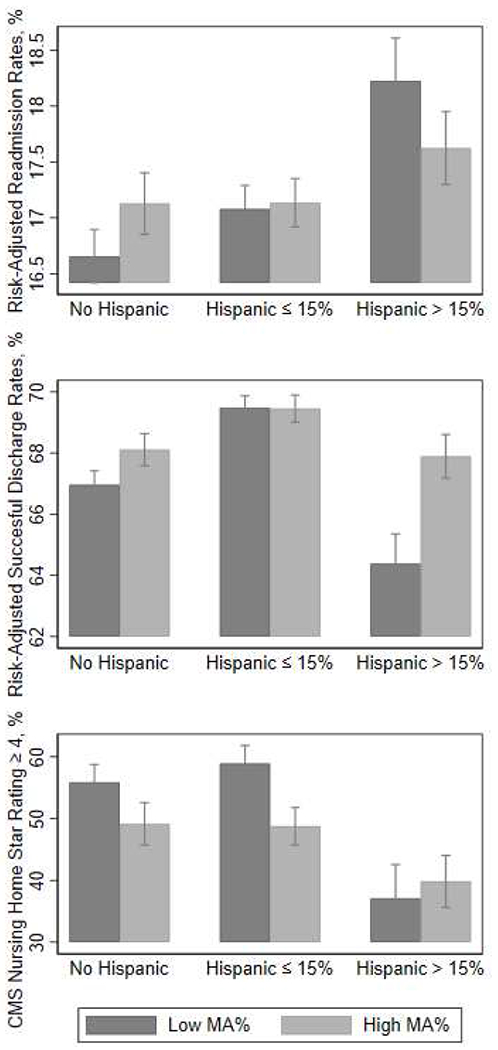
Note: Adjusted linear models included SNF for-profit status, part of chain, the percentage of residents supported by Medicaid, volume of residents, certified nursing assistant hours per day per resident, licensed practical nurse per hour per resident per day, and registered nurse per hour per day per resident and ZIP-code fixed effects. Staffing measures were not included in the star rating models since CMS already uses these measures in the composite score. MA concentration is a binary indicator, low <26.5% and =>26.5 based on distribution.
Among SNFs with >15% Hispanic beneficiaries, SNFs with a high concentration of MA beneficiaries had a slightly higher successful discharge rate than facilities with a low concentration of MA beneficiaries (64.4% vs. 67.9%, P<.05). Similarly, facilities with a high concentration of MA beneficiaries had a higher successful community discharge rate than those with a low concentration of MA beneficiaries among facilities with no Hispanic beneficiaries (67.0% vs. 68.1%, P<.05).
Overall, facilities with a high concentration of MA patients had lower star ratings compared to SNFs with a low concentration of MA patients, except among Hispanic majority facilities. For instance, SNFs with no Hispanics with ADRD and a low concentration of MA patients had 55.86% more high-quality facilities compared to 49.1% among similar SNFs with high concentration of MA patients (P<0.05). Approximately, 37.1% SNFs with high concentration of Hispanic and low concentration of MA beneficiaries had 4- or 5-star ratings compared to 39.8% of SNFs with high concentration of Hispanic beneficiaries and high concentrations of MA beneficiaries. However, this difference was not significant.
DISCUSSION
In this national study of the quality of SNFs, we found that SNFs with higher ! proportions of Hispanics with ADRD had higher readmission rates, lower rates of i successful discharge to the community, and lower star ratings. Generally, as the l· proportion of Hispanics increased, these quality outcomes decreased. An exception was ;for SNFs with some concentration of Hispanics, which had similar or slightly better i outcomes as SNFs with no Hispanics. There were also some differences among SNFs ‘ when considering their concentration of MA beneficiaries. Overall, facilities with a high concentration of MA beneficiaries had about half a percentage point lower readmission rates among SNFs with no Hispanics or high proportion of Hispanics. In addition, among facilities with no Hispanics and high proportion of Hispanics, facilities with a high concentration of MA beneficiaries had 2.5% to 3.5% higher successful discharge rates than facilities with a low concentration of MA beneficiaries. However, the percentage of facilities that were 4 or 5 starts was lower among SNFs with lower concentration of Hispanics and high proportion of MA beneficiaries.
Our results demonstrate that Medicare beneficiaries with dementia going to facilities with a high proportion of Hispanic residents are more likely to go to facilities that are characterized by poor quality as determined by risk-adjusted readmission rates and CMS star ratings. In addition, our results suggested that MA beneficiaries went to facilities with lower readmission rates and higher successful discharge rates. These results extend prior work on segregation and quality of care.7,14,15,27–32 Our findings are supported by studies suggesting that post-acute care patients with behavioral disturbances are admitted to lower quality SNFs.33 In addition, MA beneficiaries have better health care transitions and lower intensity of post-acute care.34 Two studies have also found managed care to be associated with substantial reductions in hospitalizations among long-stay nursing home residents and improved end-of-life care for persons with dementia. First, Dr. Kane’s evaluation of the EverCare program in the late 1990’s shows that integrated managed care for nursing home residents was associated with lower mortality rates, fewer preventable hospitalizations, and substantial cost savings.35 Second, among nursing home residents with advanced dementia in 22 sites in the Boston area, enrollment in managed care was associated with a 80% reduction in acute hospital transfers and a 90% increased odds in having a do-not-hospitalize order.36
Unfortunately, the data used in our analysis does not provide enough information about post-acute care referral processes to determine if Hispanic patients with ADRD are being steered to lower quality nursing homes. However, research regarding SNF selection among post-acute care patients has indicated that discharge planners may not be discussing quality of SNF care with family and patients or they may suggest SNFs within their communities even if these are lower quality.37 At the same time, nursing home administrators may be turning away “less desirable” patients with ADRD.38 Whereas some SNFs may be concerned about providing appropriate care for these patients, others may be refusing these patients as it may reflect in their overall quality ratings and reimbursement rates.38–40 Further research is needed to understand the impact of these potential mechanisms in access and quality of care among patients with ADRD, in addition to exploring individual-level outcomes to determine if receiving care in SNFs with higher ADRD concentration provides any benefits for Hispanic and non-Hispanic residents.
There are several limitations in our study. First, we are using data that is crosssectional in nature and we could not assess causal relationships between ethnic disparities in high- or lower-performing facilities. We also cannot exclude the possibility of ascertainment bias and unmeasured facility-level and individual factors. We were also unable to determine if Hispanic beneficiaries chose to go to worse quality SNFs, or if they live in areas with worse SNFs. However, our county-level analysis regarding concentration of Hispanics with ADRD (See Figure 1A and 2A in the Appendix) appears to indicate a greater inequality regarding Hispanic distribution in SNFs than in counties, as well as access to high quality SNFs. Families may be constrained by the quality of SNFs available in their communities, or may be steered to facilities with higher shares of residents of their same race. However, even after adjusting for SNF and ZIP code characteristics, Hispanic patients with ADRD are admitted to SNFs with lower quality ratings.
Another limitation is we are using facility-level indicators and our ability to account for individual-level factors or other facility-level factors that could mediate these associations is limited. However, patterns among SNFs with different concentrations of Hispanics and overall quality appear to remain similar even after accounting for SNF acuity index, proportion of residents with ADRD, and proportion of residents receiving antipsychotics (See Figure A2 in the Appendix). Individual-level outcomes and within-facility differences should be assessed in future studies to better understand disparities in quality of care among people with ADRD. Finally, the indicators used in this study are based on CASPER, LTC focus and CMS datasets, and are calculated based on all residents admitted to the SNFs. These are well-known indicators that are widely used by healthcare organizations as well as Medicare.
CONCLUSION AND IMPLICATIONS
Our work has policy implications. In 2010, dementia accounted for $157 to $215 billion in spending, figures that exceed the monetary costs of heart disease and cancer.41 The largest components of this spending are the costs of institutional nursing home care.42 The complex health care needs, poorer outcomes, and high spending of dementia populations pose serious challenges to families, providers, health care systems, and health insurers. Federal policy has driven an increasing growth in MA enrollment with limited evidence about the consequences for dementia residents. It appears that MA organizations may be selectively contracting with nursing home providers that achieve better outcomes, which may include lower readmissions and hospitalization rates for cognitively impaired older adults.43 Thus, MA may be helping beneficiaries transition better and prevent unnecessary hospitalizations. Unfortunately, there are still differences in the quality of low Hispanic and majority Hispanic facilities where MA residents with dementia are going. Furthermore, there appeared to be differences in the quality of facilities available where a higher proportion of Hispanics live. Both programs – FFS and MA – need strategies that improve quality of care to attenuate ethnic variations in care.
In the present study we found substantial segregation in the concentration of dementia patients in SNFs. SNFs with higher percentage of Hispanics have worse rates of readmissions, successful discharge and star ratings. Achieving better quality of care for people with dementia may require efforts to improve the quality of care among skilled nursing facilities with a high concentration of Hispanic residents.
Acknowledgments
Funding/Support: Research reported in this publication was supported by the National Institute on Aging of the National Institutes of Health under award numbers: R03AG05468602; K01AG05782201A1; K01AG058789, P30AG024832, P30AG059301 and by Institutional Development Award Number U54GM115677 from the National Institute of General Medical Sciences of the National Institutes of Health, which funds Advance Clinical and Translational Research (Advance-CTR). The content is solely the responsibility of the authors and does not necessarily represent the official views of the National Institutes of Health.
APPENDIX
TABLE A1:
REGRESSION MODELS WITH ALTERNATIVE CUT-OFF POINTS FOR SKILLED NURSING FACILITIES WITH HISPANIC DEMENTIA CONCENTRATION
| SNF percentage of Hispanics with Dementia | Risk-Adjusted Readmission Rates | Risk-Adjusted Successful Discharge | CMS Star Rating =>4 |
|---|---|---|---|
| Tercile 1 (0% – 1.56%) | 16.72 (16.54 – 16.90) | 68.05 (67.70 – 68.41) | 54.86 (52.60 – 57.12) |
| Tercile 2 (1.58% – 7.81%) | 16.90 (16.72 – 17.08) | 69.63 (69.28 – 69.97) | 55.64 (53.19 – 58.10) |
| Tercile 3 (7.84% – 100%) | 17.91 (17.72 – 18.10) | 67.34 (66.92 – 67.76) | 41.74 (39.13 – 44.36) |
| Quartile 1&2 (0% – 3.90%) | 16.65 (16.51 – 16.80) | 69.15 (68.85 – 69.44) | 57.22 (55.29 – 59.15) |
| Quartile 3 (3.92% – 11.48%) | 17.43 (17.24 – 17.63) | 68.42 (68.02 – 68.82) | 51.50 (48.75 – 54.24) |
| Quartile 4 (11.49% – 100%) | 17.98 (17.75 −18.21) | 66.70 (66.17 – 67.22) | 37.05 (34.07 – 40.03) |
Note: Estimates are from linear regression models with Zip code fixed-effects. In addition, the models included SNF for-profit status, part of chain, the percentage of residents supported by Medicaid, volume of residents, certified nursing assistant hours per day per resident, licensed practical nurse per hour per resident per day, and registered nurse per hour per day per resident. Staffing measures were not included in the star rating models since CMS already uses these measures in the composite score.
FIGURE A1: SKILLED NURSING FACILITY CONCENTRATION AND CHARACTERISTICS BY COUNTY HISPANIC ADRD CONCENTRATION.
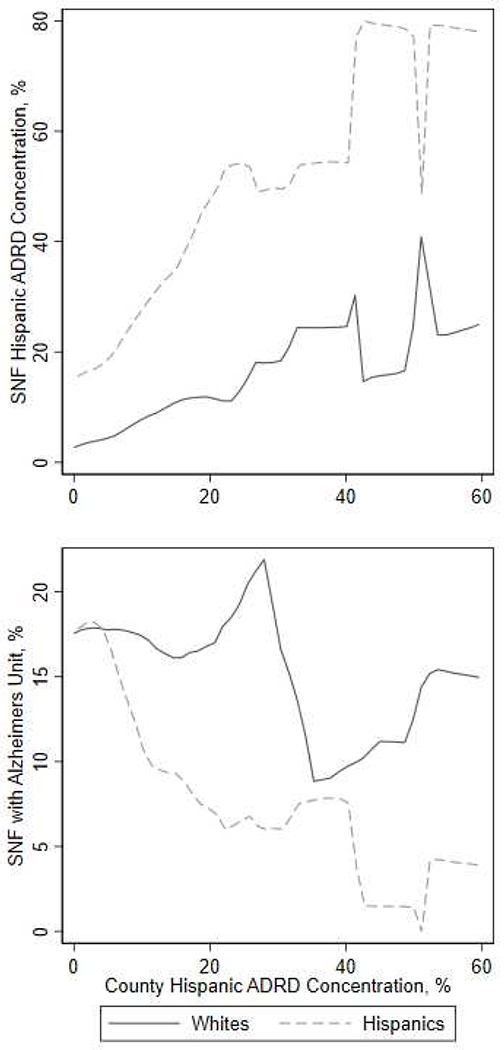
The x axis in all the three panels displays the percentage of skilled nursing facility (SNF) admissions from a given county that were for a Hispanic patient with ADRD. The top panel shows for Hispanic and patients with ADRD, the average Hispanic ADRD concentration of the SNF by the county Hispanic ADRD concentration. The bottom panel shows the proportion of SNFs with Alzheimer’s special care unit y the county Hispanic ADRD concentration.
FIGURE A2: SKILLED NURSING FACILITY QUALITY BY COUNTY HISPANIC ADRD CONCENTRATION.
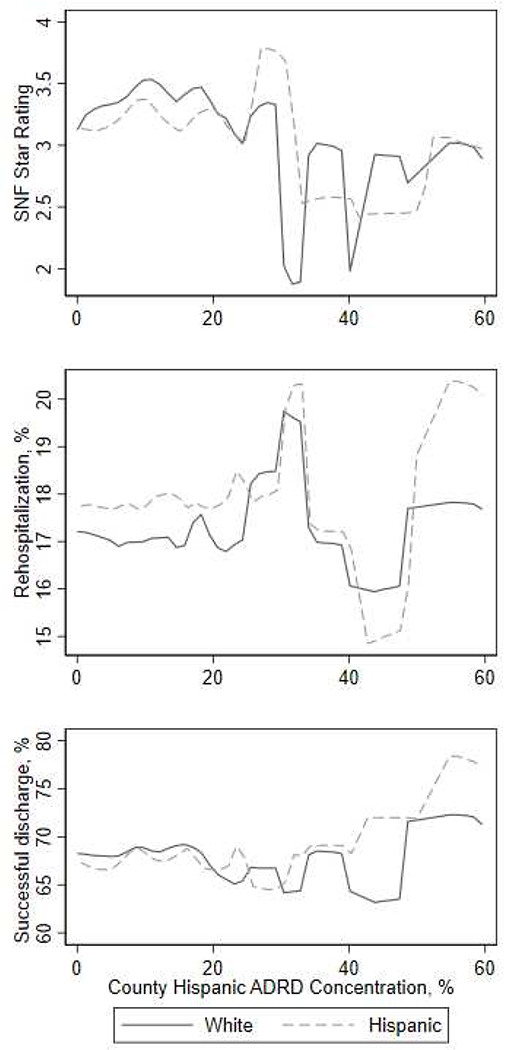
The x axis in all the three panels displays the percentage of skilled nursing facility (SNF) admissions from a given county that were for a Hispanic patient with ADRD. The top panel shows for White and Hispanic patients with ADRD, the SNF quality ratings by the county Hispanic ADRD concentration. The middle panel shows readmission rates and the bottom panel shows successful discharge rates by the county Hispanic ADRD concentration.
TABLE A2:
QUALITY OF SKILLED NURSING FACILITY CARE ADJUSTING FOR FACILITY CHARACTERISTICS AND ZIP CODE
| Model 1 | Model 2 | Model 3 | |
|---|---|---|---|
| Hispanic 0% | 53.06 (50.77–55.34) | 53.03 (50.75 – 55.32) | 52.99 (50.71 – 55.28 |
| Hispanic 0.1% to 15.0% | 54.16 (52.18 – 56.14) | 54.16 (52.18 – 56.14) | 54.22 (52.24 – 56.20) |
| Hispanic 15.1% to 100% | 38.89 (35.50 – 42.29) | 38.93 (35.50 – 42.36) | 38.84 (35.41 – 42.26) |
Notes: Model 1 adjusted for skilled nursing facility for-profit status, part of chain, the percentage of residents supported by Medicaid, volume of residents, and ZIP-code fixed effects. Model 2 adjusted for acuity index and all the variables from Model 1. Model 3 adjusted for dementia rates, inappropriate use of antipsychotics and variables from Model 2.
FIGURE A3: OVERALL SKILLED NURSING FACILITY QUALITY RATING BY RESIDENT CHARACTERISTICS.
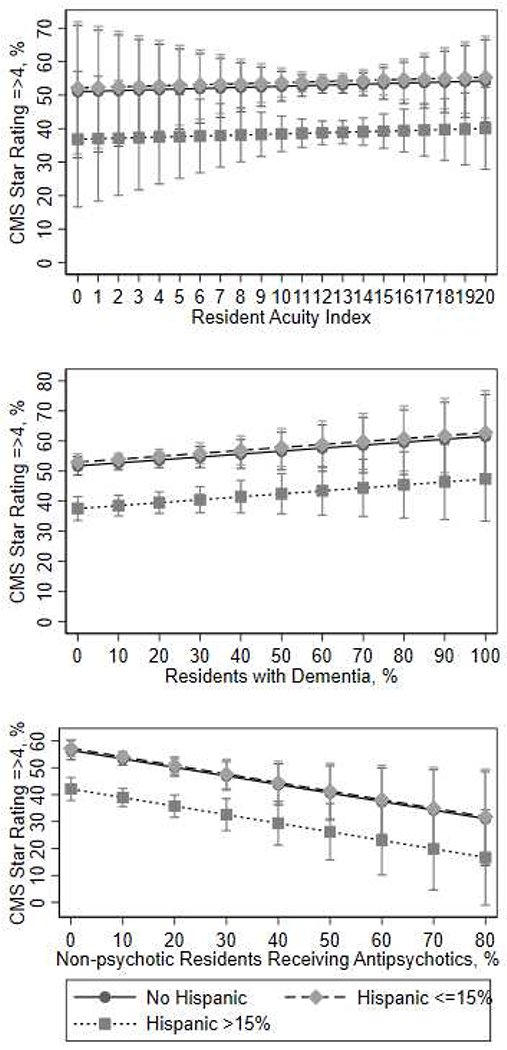
In each panel, the Y axis displays the proportion of skilled nursing facilities with ratings greater or equal than four stars. The top pane shows the proportion of high-quality facilities among facilities with different concentration of Hispanics with ADRD, arrayed by the average resident acuity index. The middle panel shows the proportion of high-quality facilities by the proportion of residents with dementia. The bottom panel shows the proportion of high-quality facilities by the proportion of residents receiving antipsychotics.
Footnotes
Publisher's Disclaimer: This is a PDF file of an unedited manuscript that has been accepted for publication. As a service to our customers we are providing this early version of the manuscript. The manuscript will undergo copyediting, typesetting, and review of the resulting proof before it is published in its final form. Please note that during the production process errors may be discovered which could affect the content, and all legal disclaimers that apply to the journal pertain.
REFERENCES
- 1.Alzheimer’s Association. Hispanics/Latinos and Alzheimer’s disease [Internet]. 2004. Available from: http://www.alz.org/national/documents/report_hispanic.pdf
- 2.US Census Bureau Public Information Office. U.S. Census Bureau Projections Show a Slower Growing, Older, More Diverse Nation a Half Century from Now [Internet]. 2012. [cited 2016 Jan 23]. Available from: https://www.census.gov/newsroom/releases/archives/population/cb12-243.html
- 3.Arias E National Vital Statistics Report [Internet]. U.S. DEPARTMENT OF HEALTH AND HUMAN SERVICES; 2014. Available from: http://www.cdc.gov/nchs/data/nvsr/nvsr63/nvsr63_07.pdf [Google Scholar]
- 4.Garcia MA, Saenz J, Downer B, Wong R. The role of education in the association between race/ethnicity/nativity, cognitive impairment, and dementia among older adults in the United States. Demogr Res. 2018. June;38:155–168. [DOI] [PMC free article] [PubMed] [Google Scholar]
- 5.Mayeda ER, Karter AJ, Huang ES, Moffet HH, Haan MN, Whitmer RA. Racial/Ethnic Differences in Dementia Risk Among Older Type 2 Diabetic Patients: The Diabetes and Aging Study. Diabetes Care. 2014. April 1;37(4):1009–1015. [DOI] [PMC free article] [PubMed] [Google Scholar]
- 6.National Center for Health Statistics. Percent of long-term care services users diagnosed with Alzheimer’s disease or other dementias [Internet]. CDC/National Center for Health Statistics; 2019. [cited 2020 Feb 10]. Available from: https://www.cdc.gov/nchs/fastats/alzheimers.htm [Google Scholar]
- 7.Mor V, Intrator O, Feng Z, Grabowski DC. The revolving door of rehospitalization from skilled nursing facilities. Health Aff Proj Hope. 2010. February;29(1):57–64. [DOI] [PMC free article] [PubMed] [Google Scholar]
- 8.Teno JM, Gozalo PL, Bynum JPW, Leland NE, Miller SC, Morden NE, Scupp T, Goodman DC, Mor V. Change in end-of-life care for Medicare beneficiaries: site of death, place of care, and health care transitions in 2000, 2005, and 2009. JAMA. 2013. February 6;309(5):470–477. PMCID: PMC3674823 [DOI] [PMC free article] [PubMed] [Google Scholar]
- 9.Institute of Medicine. Geographic Variation in Spending, Utilization and Quality: Medicare and Medicaid Beneficiaries [Internet]. 2013. Available from: https://iom.nationalacademies.org/~/media/Files/Report%20Files/2013/Geographic-Variation/Sub-Contractor/Acumen-Medicare-Medicaid.pdf
- 10.Jacobson G, Casillas G, Damico A, Gold M. Medicare Advantage 2016 Spotlight: Enrollment Market Update [Internet]. 2016. [cited 2016 Oct 27]. Available from: http://kff.org/medicare/issue-brief/medicare-advantage-2016-spotlight-enrollment-market-update/
- 11.America’s Health Insurance Plans (AHIP). Medicare Advantage Demographic Report [Internet]. 2015. Available from: https://www.ahip.org/Report/MA-Demo-2015/
- 12.Rahman M, Keohane L, Trivedi AN, Mor V. High-Cost Patients Had Substantial Rates Of Leaving Medicare Advantage And Joining Traditional Medicare. Health Aff (Millwood). 2015. October 1 ;34(10): 1675–1681. [DOI] [PMC free article] [PubMed] [Google Scholar]
- 13.Meyers DJ, Mor V, Rahman M. Medicare Advantage Enrollees More Likely To Enter Lower-Quality Nursing Homes Compared To Fee-For-Service Enrollees. Health Aff Proj Hope. 2018. January;37(1):78–85. [DOI] [PMC free article] [PubMed] [Google Scholar]
- 14.Smith DB, Feng Z, Fennell ML, Zinn JS, Mor V. Separate And Unequal: Racial Segregation And Disparities In Quality Across U.S. Nursing Homes. Health Aff (Millwood). 2007. September 1;26(5):1448–1458. [DOI] [PubMed] [Google Scholar]
- 15.Fennell ML, Feng Z, Clark MA, Mor V. Elderly Hispanics More Likely To Reside In Poor-Quality Nursing Homes. Health Aff (Millwood). 2010. January 1;29(1):65–73. [DOI] [PMC free article] [PubMed] [Google Scholar]
- 16.US Census Bureau. Metropolitan and Micropolitan [Internet]. 2018. [cited 2019 Jul 31]. Available from: https://www.census.gov/programs-surveys/metro-micro/about.html [Google Scholar]
- 17.Intrator O, Hiris J, Berg K, Miller SC, Mor V. The residential history file: studying nursing home residents’ long-term care histories(*). Health Serv Res. 2011. February;46(1 Pt 1):120–137. [DOI] [PMC free article] [PubMed] [Google Scholar]
- 18.Eicheldinger C, Bonito A. More Accurate Racial and Ethnic Codes for Medicare Administrative Data [Internet]. 2008. Available from: https://www.cms.gov/Research-Statistics-Data-and-Systems/Research/HealthCareFinancingReview/downloads/08springpg27.pdf [PMC free article] [PubMed] [Google Scholar]
- 19.Morris JN, Hawes C, Fries BE, Phillips CD, Mor V, Katz S, Murphy K, Drugovich ML, Friedlob AS. Designing the national resident assessment instrument for nursing homes. The Gerontologist. 1990. June;30(3):293–307. [DOI] [PubMed] [Google Scholar]
- 20.Phillips CD, Morris JN, Hawes C, Fries BE, Mor V, Nennstiel M, Iannacchione V. Association of the Resident Assessment Instrument (RAI) with changes in function, cognition, and psychosocial status. J Am Geriatr Soc. 1997. August;45(8):986–993. [DOI] [PubMed] [Google Scholar]
- 21.Thomas KS, Dosa D, Wysocki A, Mor V. The Minimum Data Set 3.0 Cognitive Function Scale. Med Care. 2015. March 11; [DOI] [PMC free article] [PubMed] [Google Scholar]
- 22.Centers for Medicare and Medicaid. PAC Quality Initiatives [Internet]. 2016. [cited 2017 Jun 28]. Available from: https://www.cms.gov/Medicare/Quality-Initiatives-Patient-Assessment-Instruments/Post-Acute-Care-Quality-Initiatives/PAC-Quality-Initiatives.html
- 23.LTC focus. Long-Term Care: Facts on Care in the US [Internet]. 2017. [cited 2017 Jun 28]. Available from: http://ltcfocus.org/
- 24.Centers for Medicare & Medicaid Services. Design for Nursing Home Compare Five-Star Quality Rating System: Technical Users’ Guide [Internet]. 2017. Available from: https://www.cms.gov/Medicare/Provider-Enrollment-and-Certification/CertificationandComplianc/Downloads/usersguide.pdf
- 25.Medicare C for, Baltimore MS 7500 SB, Usa M. Quality-Measures-Standards [Internet]. 2015. [cited 2016 Feb 29]. Available from: https://www.cms.gov/Medicare/Medicare-Fee-for-Service-Payment/sharedsavingsprogram/Quality_Measures_Standards.html [Google Scholar]
- 26.Hamilton LC. Statistics with STATA: Version 12. Cengage Learning; 2012. [Google Scholar]
- 27.Mor V, Zinn J, Angelelli J, Teno JM, Miller SC. Driven to Tiers: Socioeconomic and Racial Disparities in the Quality of Nursing Home Care. Milbank Q. 2004. June 1 ;82(2):227–256. [DOI] [PMC free article] [PubMed] [Google Scholar]
- 28.Cai S, Mukamel DB, Temkin-Greener H. Pressure ulcer prevalence among Black and White nursing home residents in New York State: Evidence of racial disparity? Med Care. 2010. March;48(3):233–239. [DOI] [PMC free article] [PubMed] [Google Scholar]
- 29.Grabowski D The Admission of Blacks to High-Deficiency Nursing Homes: Medical Care. Med Care. 2004;42(5):456–464. [DOI] [PubMed] [Google Scholar]
- 30.Bardenheier B, Wortley P, Ahmed F, Gravenstein S, Hogue CJR. Racial inequities in receipt of influenza vaccination among long-term care residents within and between facilities in Michigan. Med Care. 2011. April;49(4):371–377. [DOI] [PubMed] [Google Scholar]
- 31.Thomeer MB, Mudrazija S, Angel JL. How Do Race and Hispanic Ethnicity Affect Nursing Home Admission? Evidence From the Health and Retirement Study. J Gerontol B Psychol Sci Soc Sci. 2014. September 9;gbu114. [DOI] [PMC free article] [PubMed] [Google Scholar]
- 32.Li Y, Harrington C, Temkin-Greener H, Kai Y, Cai X, Cen X, Mukamel DB. Deficiencies In Care At Nursing Homes And Racial & Ethnic Disparities Across Homes Declined, 2006–11. Health Aff Proj Hope. 2015. July;34(7):1139. [DOI] [PMC free article] [PubMed] [Google Scholar]
- 33.Temkin-Greener H, Campbell L, Cai X, Hasselberg MJ, Li Y. Are Post-Acute Patients with Behavioral Health Disorders Admitted to Lower-Quality Nursing Homes? Am J Geriatr Psychiatry Off J Am Assoc Geriatr Psychiatry. 2018;26(6):643–654. [DOI] [PubMed] [Google Scholar]
- 34.Huckfeldt PJ, Escarce JJ, Rabideau B, Karaca-Mandic P, Sood N. Less Intense Postacute Care, Better Outcomes For Enrollees In Medicare Advantage Than Those In Fee-For-Service. Health Aff (Millwood). 2017. January 1;36(1):91–100. [DOI] [PMC free article] [PubMed] [Google Scholar]
- 35.Kane RL, Keckhafer G, Flood S, Bershadsky B, Siadaty MS. The effect of Evercare on hospital use. J Am Geriatr Soc. 2003. October;51(10):1427–1434. [DOI] [PubMed] [Google Scholar]
- 36.Grabowski DC. Medicare and Medicaid: conflicting incentives for long-term care. Milbank Q. 2007. December;85(4):579–610. [DOI] [PMC free article] [PubMed] [Google Scholar]
- 37.Gadbois EA, Tyler DA, Mor V. Selecting a Skilled Nursing Facility for Postacute Care: Individual and Family Perspectives. J Am Geriatr Soc. 2017. November;65(11 ):2459–2465. [DOI] [PMC free article] [PubMed] [Google Scholar]
- 38.Shield R, Winblad U, McHugh J, Gadbois E, Tyler D. Choosing the Best and Scrambling for the Rest: Hospital-Nursing Home Relationships and Admissions to Post-Acute Care. J Appl Gerontol Off J South Gerontol Soc. 2019;38(4):479–498. [DOI] [PMC free article] [PubMed] [Google Scholar]
- 39.Sewell DD. Nursing Homes Are Turning Away Patients with Mental Health Issues [Internet]. Care for Your Mind. 2016. [cited 2020 Feb 10]. Available from: http://careforyourmind.org/nursing-homes-are-turning-away-patients-with-mental-health-issues/ [Google Scholar]
- 40.Lane A, McCoy L, Ewashen C. The textual organization of placement into long-term care: issues for older adults with mental illness. Nurs Inq. 2010. March;17(1):2–14. [DOI] [PubMed] [Google Scholar]
- 41.Hurd MD, Martorell P, Delavande A, Mullen KJ, Langa KM. Monetary Costs of Dementia in the United States. N Engl J Med. 2013. April 4;368(14):1326–1334. [DOI] [PMC free article] [PubMed] [Google Scholar]
- 42.Kelley AS, McGarry K, Gorges R, Skinner JS. The Burden of Health Care Costs in the Last 5 Years of Life. Ann Intern Med. 2015. November 17;163(10):729–736. [DOI] [PMC free article] [PubMed] [Google Scholar]
- 43.Bundorf MK, Schulman KA, Stafford JA, Gaskin D, Jollis JG, Escarce JJ. Impact of Managed Care on the Treatment, Costs, and Outcomes of Fee-for-Service Medicare Patients with Acute Myocardial Infarction. Health Serv Res. 2004. February;39(1):131–152. [DOI] [PMC free article] [PubMed] [Google Scholar]


