Viral attack on cHABs may contribute to changes in community composition during blooms, as well as bloom decline, yet loss of bloom biomass does not eliminate the threat of cHAB toxicity. Rather, it may increase risks to the public by delivering a pool of dissolved toxin directly into water treatment utilities when the dominating Microcystis spp. are capable of producing microcystins. Detecting, characterizing, and quantifying the major cyanophages involved in lytic events will assist water treatment plant operators in making rapid decisions regarding the pool of microcystins entering the plant and the corresponding best practices to neutralize the toxin.
KEYWORDS: Microcystis, cyanophage, microcystins, water treatment
ABSTRACT
Western Lake Erie (Laurentian Great Lakes) is prone to annual cyanobacterial harmful algal blooms (cHABs) dominated by Microcystis spp. that often yield microcystin toxin concentrations exceeding the federal EPA recreational contact advisory of 8 μg liter−1. In August 2014, microcystin levels were detected in finished drinking water above the World Health Organization 1.0 μg liter−1 threshold for consumption, leading to a 2-day disruption in the supply of drinking water for >400,000 residents of Toledo, Ohio (USA). Subsequent metatranscriptomic analysis of the 2014 bloom event provided evidence that release of toxin into the water supply was likely caused by cyanophage lysis that transformed a portion of the intracellular microcystin pool into the dissolved fraction, rendering it more difficult to eliminate during treatment. In August 2019, a similar increase in dissolved microcystins at the Toledo water intake was coincident with a viral lytic event caused by a phage consortium different in composition from what was detected following the 2014 Toledo water crisis. The most abundant viral sequence in metagenomic data sets was a scaffold from a putative member of the Siphoviridae, distinct from the Ma-LMM01-like Myoviridae that are typically documented to occur in western Lake Erie. This study provides further evidence that viral activity in western Lake Erie plays a significant role in transformation of microcystins from the particulate to the dissolved fraction and therefore requires monitoring efforts from local water treatment plants. Additionally, identification of multiple lytic cyanophages will enable the development of a quantitative PCR toolbox to assess viral activity during cHABs.
IMPORTANCE Viral attack on cHABs may contribute to changes in community composition during blooms, as well as bloom decline, yet loss of bloom biomass does not eliminate the threat of cHAB toxicity. Rather, it may increase risks to the public by delivering a pool of dissolved toxin directly into water treatment utilities when the dominating Microcystis spp. are capable of producing microcystins. Detecting, characterizing, and quantifying the major cyanophages involved in lytic events will assist water treatment plant operators in making rapid decisions regarding the pool of microcystins entering the plant and the corresponding best practices to neutralize the toxin.
INTRODUCTION
Coincident with anthropogenic nutrient pollution and climate change, fresh waters worldwide are increasingly affected by cyanobacterial harmful algal blooms (cHABs) (1). In particular, the open waters of western Lake Erie (Laurentian Great Lakes) is plagued by toxic Microcystis spp.-dominated cHABs that have occurred annually since the mid-1990s (2, 3), driven by nonpoint nutrient pollution from agricultural runoff (4, 5). In August 2014, a cHAB encroached upon the Toledo (Ohio, USA) municipal water intake, and the presence of microcystin (MC) toxin in the finished drinking water resulted in a 2-day shutdown of the water supply for >400,000 residents (6). Metatranscriptomic analysis of the cHAB in 2014 provided evidence that the “do not drink” advisory coincided with a lysis event caused by cyanophages related to Microcystis cyanophage Ma-LMM01 (6). Bloom samples taken prior to and after the shutdown period lacked abundant phage-associated reads (6, 7). Initial processing steps at water treatment plants exploit the fact that microcystins are generally maintained inside viable cells (8) by adding chemicals like alum to induce flocculation and coagulation, removing the majority of the cell-bound MCs. Purported viral lysis of the 2014 bloom converted a portion of the microcystin pool into the dissolved phase, some of which bypassed treatment (6). Following the 2014 event, the Toledo Collins Park Water Treatment Plant (WTP) started to monitor both total and dissolved MCs. Consequently, to understand shifts in particulate versus dissolved toxins, we are interested in tracking cyanophage abundance and changes in community composition in cHABs so that similar events can be addressed with appropriate chemical water treatment methods.
Among cyanobacteria examined, Microcystis appears to be especially prone to viral attack, as evidenced by a substantial proportion of its genome allocated to phage defense genes (9) and a record of adaptive resistance signaled by incorporation of diverse CRISPR spacers in the genome (10). Additionally, Microcystis strains found endemic to the Lower Great Lakes region are shown to be genetically diverse, including having different genetic capabilities to defend themselves against foreign DNA, suggesting the capability of significant population shifts during a bloom season (11). Two Microcystis-specific cyanophage have been identified and isolated and have had their genomes sequenced (12, 13). From these, primers diagnostic for cyanophage infective for Microcystis have been developed (14–16) and applied to study viral dynamics in diverse freshwater ecosystems (17–19).
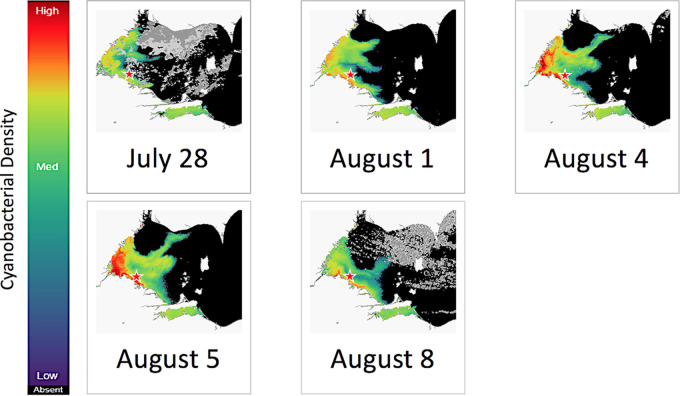
In August 2019, a cHAB enveloped much of southwestern Lake Erie, including the Toledo water intake (Fig. 1 and 2). Detection of a spike in dissolved MCs by the City of Toledo Division of Water Treatment, confirmed by independent analysis by our group, led to the detection of abundant cyanophage reads distinct from the Ma-LMM01-like phages reported previously.
FIG 1.
Satellite-derived cyanobacterial index images of the western Lake Erie cHAB 28 July to 8 August 2019. The star indicates the location of the Toledo water intake crib (41.7000436 N, −83.250217 W). Peak biomass of the bloom for the 2019 season occurred on 5 August 2019. The images were derived from Copernicus Sentinel-3 satellite data from the European Organization for the Exploitation of Meteorological Satellites (EUMETSAT) and processed to convert lake color to cHAB abundance by Richard Stumpf, NOAA, National Centers for Coastal Ocean Science.
FIG 2.
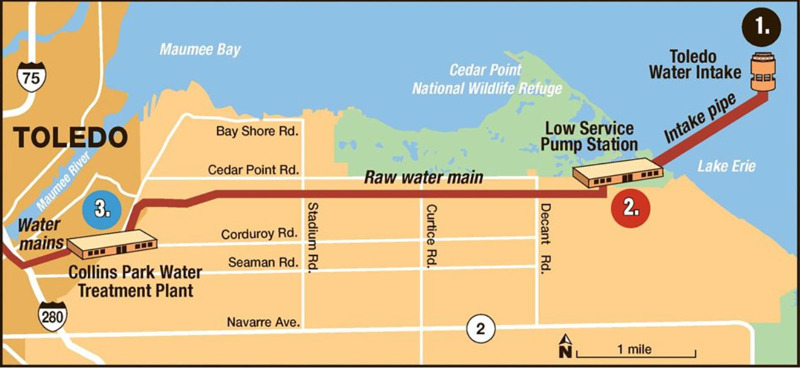
Schematic of the Toledo Collins Park Water Treatment Plant pipeline, indicating where water samples were obtained. Water samples were taken from three locations within the treatment system: the intake crib (site 1, “intake”) which carries the water from Lake Erie directly to the plant for treatment, the surge well within the low service pump station (site 2, “surge”) where the water is treated with potassium permanganate, and the raw water that enters the Collins Park WTP following activated carbon treatment (site 3, “raw”). (Adapted from reference 49 with permission.)
As part of this work, we developed a quantitative PCR-based assay to detect phage abundance in blooms so that water treatment plants (WTPs) have advance warning of these events and can respond appropriately to inactivate dissolved toxins. The State of Ohio has already approved qPCR-based detection of microcystin genes for use by WTPs (20, 21), so the technology is available and the goal achievable. Identifying the major cyanophages targeting Lake Erie Microcystis cHABs is an important first step.
RESULTS
Phytoplankton biomass analyses.
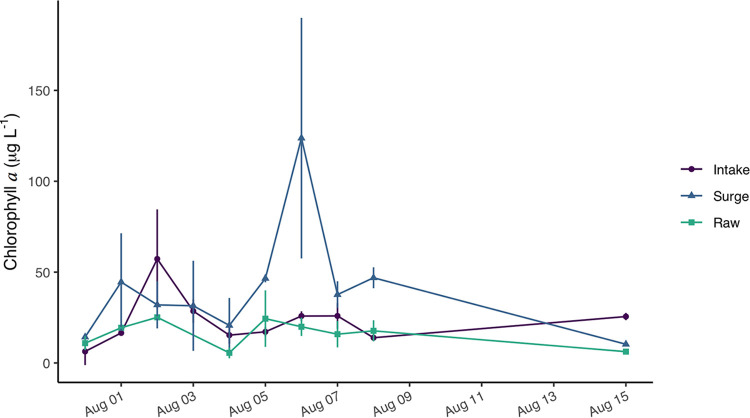
Average chlorophyll a (chl a)-estimated biomasses at the three sites (intake supply, surge well, and raw plant water) were variable during the sampling period (Fig. 3). At the intake site, daily average chl a-estimated biomass peaked at 57.3 ± 27.2 μg liter−1 on 2 August, then decreased to 13.9 ± 0.8 μg liter−1 by 8 August. During the sampling period, the surge well site exhibited two chl peaks of 44.5 ± 26.8 μg liter−1 (1 August) and 123.7 ± 66.2 μg liter−1 (6 August). Chl biomass of WTP influent water ranged between 5.6 ± 3.0 μg liter−1 and 25.1 ± 0.6 μg liter−1 throughout the sampling period. The three sampling sites exhibited high variability between duplicates at most dates, attributable to the transient formation of surface scums at the intake site yielding a heterogeneous mixture of bloom biomass.
FIG 3.
Chl a biomass in the intake, surge well, and WTP raw water. The concentrations measured at the intake valve represent the algal community that is pulled into the water treatment plant from Lake Erie. The surge well concentrations are most variable, likely owing to the retention of algal communities in the well. Concentrations are lowest in WTP raw water, as this water is posttreatment with low doses of the algaecide potassium permanganate and the addition of activated carbon.
Analysis of microcystins.
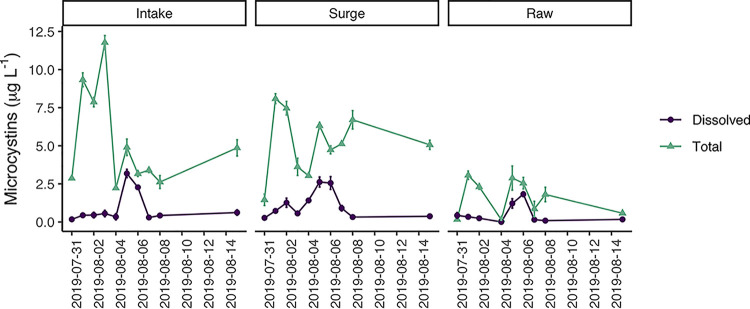
Total microcystins (MCs) were elevated during the sampling period, yielding maximum concentrations of 11.8 μg liter−1 at the intake, 8.1 μg liter−1 and the surge well, and 3.1 μg liter−1 in WTP influent. Dissolved microcystins were routinely low, near the detection limit most dates, except for a distinct peak of toxin measured from 4 August to 6 August at all three sites (Fig. 4). Coincident with the peak in dissolved microcystins was a change in the appearance of the bloom, in which the surface scum biomass yielded large amounts of foam that accumulated in Maumee Bay, Lake Erie (Fig. S1 in the supplemental material, photos dated 31 July, 2 August, and 4 August). This event also roughly coincided with a decrease in chl a at the water intake site (Fig. 3).
FIG 4.
Total and dissolved microcystin concentrations obtained during the sampling period, measured by ELISA.
Microcystis cyanophage sequences.
Metagenomic analysis of samples from the Collins Park WTP sites on 2 August, identified 7 potential Microcystis double-stranded DNA (dsDNA) cyanophage sequences found in Lake Erie cHABs. We refer to these viral contigs as Microcystis viral genomic fragments (MVGFs) according to Minimum Information about an Uncultivated Virus Genome standards (22). Additionally, the names of the viral contigs include whether it is from a single contiguous sequence (C) or if it was joined with other sequences based on contig-contig or reference joining methods (J).
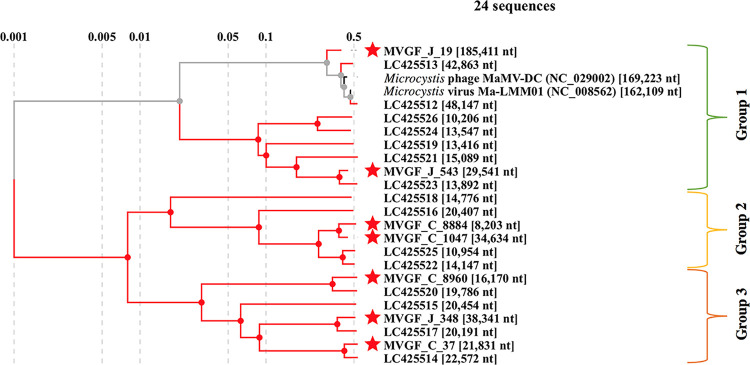
The viral sequences can be divided into three groups when placed in a proteomic tree alongside the two isolated Microcystis cyanophages (Ma-LMM01 and MaMV-DC) (13, 15) and the MVGFs described in Morimoto et al. (23) (Fig. 5), labeled here by their accession numbers. Group I is composed of the Ma-LMM01-like cyanophages (LC425512 and LC425513) and other sequences reported by Morimoto et al. (23) (LC425526, LC425524, LC425519, LC425521, and LC425523) with the addition of two Collins Park WTP sequences (MVGF_J_19 and MVGF_J_543). Group II comprises four sequences reported by Morimoto et al. (23) (LC425518, LC425516, LC425525, and LC425522) with the addition of two Collins Park WTP sequences (MVGF_C_8884 and MVGF_C_1047). Group III is also composed of four sequences reported by Morimoto et al. (23) (LC425520, LC425515, LC425517, and LC425514) with the addition of three Collins Park WTP sequences (MVGF_C_8960, MVGF_J_348, and MVGFC_37). Each of the Collins Park WTP sequences has a close relationship with one or two of the sequences reported by Morimoto et al. (23) (Fig. S2).
FIG 5.
Proteomic phylogenetic tree of isolated and nonisolated Microcystis cyanophages. The star indicates Microcystis viral genomic fragments (MVGFs) found in metagenomic sequencing of the intake and surge well sites on 2 August 2019. Black/gray lines indicate lab-isolated and sequenced Microcystis cyanophages, red lines indicate MVGFs.
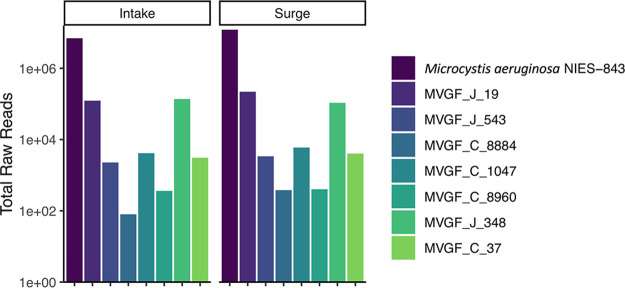
After the sequences were generated for each of the MVGFs, the raw reads were mapped back to them to provide an estimate of relative abundance (24) (Fig. 6). The host reference genome, Microcystis aeruginosa strain NIES-843, was the most abundant sequence in both data sets. MVGF_J_19 from Morimoto et al. (23) group III and MVGF_J_348 from group I were the most abundant viral sequences. The other MVGFs were present but were considered at negligible concentrations for qPCR analysis. Nonetheless, these sequences were analyzed to enable the development of a diagnostic qPCR primer set.
FIG 6.
Raw metagenomic reads that map to the host reference genome (Microcystis aeruginosa NIES-843) and to each identified Microcystis viral genomic fragment (MVGF) from 2 August 2019. Two MFGVs (J_19 and J_348) were the most abundant viral sequences at both sites, at approximately the same total read count. MVGF_J_19 is the Lake Erie variant of Ma-LMM01 and MaMV-DC, while MVGF_J_348 is a novel cyanophage.
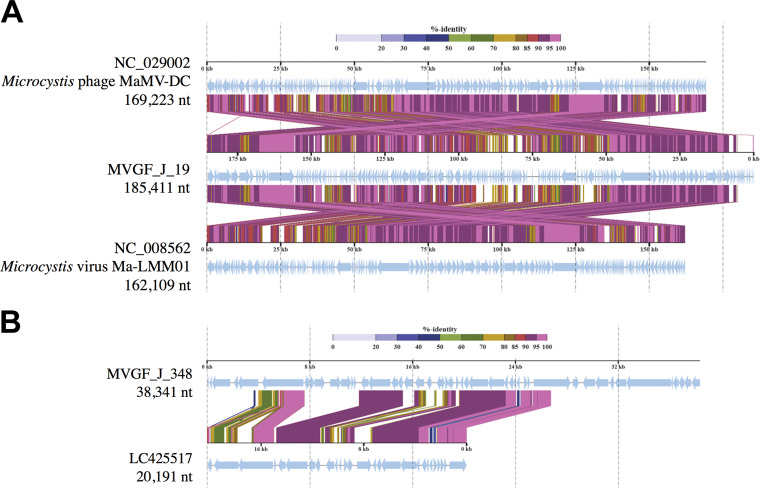
MVGF_J_19 is closely related to Ma-LMM01 and MaMV-DC and represents a Lake Erie variant of these Microcystis-specific cyanophages (Fig. 7A). The MVGF_J_19 genome is composed of 141 genes orthologous to either Ma-LMM01 or MaMV-DC (74.2% of the total genome), 23 genes from other organisms, including M. aeruginosa (12.1% of the genome), and 26 genes with no close BLAST results (13.7% of the genome) based on the GHOSTX to NCBI/nr analysis through ViPTree (Table S4). While a majority of the ORFs encode hypothetical proteins, MVGF_J_19 has diagnostic Microcystis phage genes, including a putative tail sheath protein (ORF 28), a phoH-like phosphate starvation-inducible protein (ORF 127), a prophage anti-repressor (ORF 117), and a capsid protein (ORF 33).
FIG 7.
Proteomic similarity between closely related Microcystis viral genomic fragments (MVGFs). (A) The relationship between MVGF_J_19 and two isolated and characterized Microcystis cyanophages, Ma-LMM01 and MaMV-DC. The genetic rearrangement but high protein percent identity suggest MVGF_J_19 to be a Lake Erie variant of these two isolates. (B) Sequence similarity between MVGF_J_348 and Morimoto et al. (23) siphovirus MVGF LC425517 (NODE382).
MVGF_J_348 represents a novel Microcystis viral lineage that shares similarities to the Morimoto et al. (23) MVGF LC425517 (NODE382), a genomic fragment which was more closely related to Synechococcus of the Siphoviridae than Microcystis of the Myoviridae, based on the proteomic tree (23). The similarity of the two sequences is restricted to only 40.8% of the length of the MVGF_J_348 sequence but represents 89.5% mean identity (resulting in a combined similarity score of 0.699; ViPTree) (Fig. 7B). Like most cyanophages, a majority of the BLAST results of MVGF_J_348 are to unknown or uncharacterized proteins, primarily attributed to Microcystis aeruginosa. Of the genes that align with genes of known function in a BLAST search, this sequence contains a phage major capsid protein (ORF 3), a phage portal protein (ORF 6), a putative head-tail joining protein (ORF 14), large and small phage terminase subunits (ORFs 15 and 16), and a phage cell wall peptidase (ORF 40) (Table S4). Both the phage portal protein and the putative head-tail joining protein genes are attributed to siphoviridae phages (Lambda and uncultured Mediterranean phage uvMED), and qPCR primers were developed for the phage portal protein gene (Table 1). The proteomic alignment and best BLAST hits for the remaining MVGFs isolated from the Collins Park WTP metagenomic samples can be found in the supplemental material (Fig. S2 and Table S4).
TABLE 1.
qPCR primers used to quantify host and viral copy numbers during the 2019 viral lysis event
| Target organism | Gene | Forward primer | Reverse primer | Source |
|---|---|---|---|---|
| Microcystis aeruginosa | 16S | GCCGCRAGGTGAAAMCTAA | AATCCAAARACCTTCCTCCC | (50) |
| Microcystis aeruginosa | mcyB | CCTACCGAGCGCTTGGG | GAAAATCCCCTAAAGAATCCTGATTCCTGAGT | (51) |
| Microcystis aeruginosa | mcyD | GGTTCGCCTGGTCAAAGTAA | CCTCGCTAAAGAAGGGTTGA | (36) |
| Ma-LMM01 | gp091 | ACATCAGCGTTCGTTTCGG | CAATCTGGTTAGGTAGGTCG | (14) |
| MVGF_J_19 | Phage collar | GCGGGCGTTTGCATTTATT | ATCTGCTGTAACTCACCATCAC | This study |
| MVGF_J_348 | Phage portal | CACGACTGAATCACCCGATAG | GGGCTATCCTATGCGGCTTTATC | This study |
2014 Toledo water crisis metatranscriptome comparison.
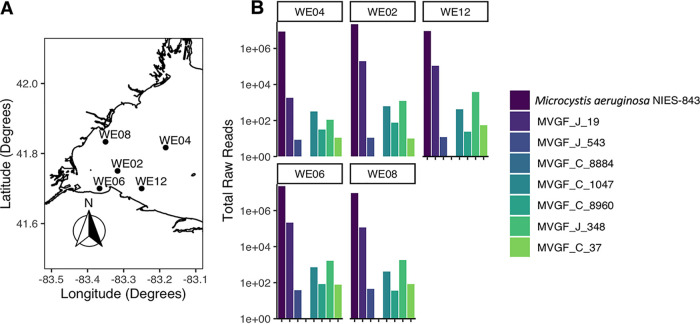
To determine if the MVGFs identified in this study were transcriptionally active during the 2014 Toledo water crisis (6), transcriptomic data from the event were mined from NCBI (Sequence Read Archive accession number SRP094616) and mapped to the generated MVGF (Fig. 8). On 4 August 2014, water samples were collected at several sites within the western Lake Erie for transcriptomic analysis (6). The 5 sites analyzed as part of this work included WE12, the site of the Toledo water intake crib, and 4 other sites in western Lake Erie (Fig. 8A). The most abundant sequence across all sites was the host reference genome, Microcystis aeruginosa NIES-843 (Figure 8B). At the Toledo water intake crib (WE12) and in the bloom regions of the western basin (WE02, WE06, and WE08), there were elevated transcript levels of the Ma-LMM01-like sequence MVGF_J_19, as was reported previously (6). Present, but at a lower abundance, was the novel MVGF_J_348, suggesting that during the 2014 bloom lysis event, this cyanophage was a minor contributor to bloom lysis. Again, at nearly negligible levels were the other MVGFs, with the exception of MVGF_C_8884, which was not present at any of the selected sites.
FIG 8.
Raw transcriptomic reads from the 2014 Toledo water crisis mapped to the host reference genome (Microcystis aeruginosa NIES-843) and the MVGFs found in the 2 August 2019 metagenomic analysis. The most abundant viral sequence responsible for the 2014 event was MVGF_J_19, the Lake Erie variant of Ma-LMM01 and MaMV-DC.
Real-time PCR quantification of Microcystis and viral sequences in the bloom.
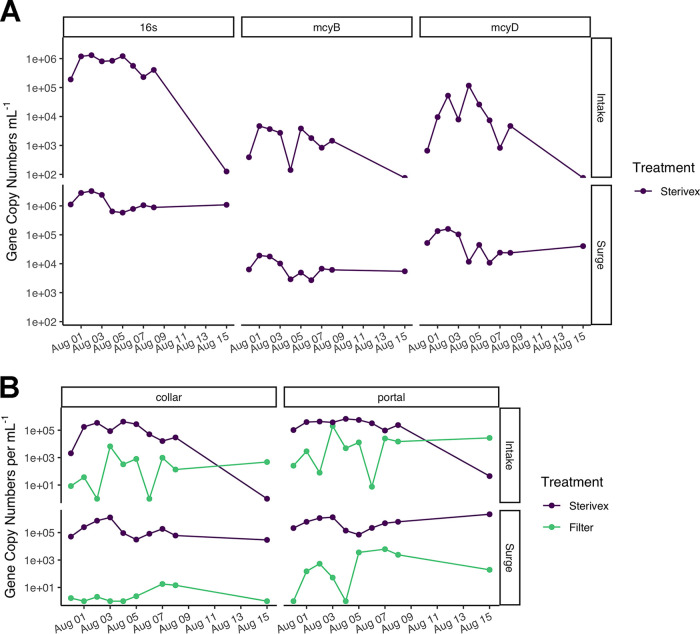
To establish an effective protocol for water treatment plants to monitor for increases in viral load, which may lead to a lysis event and the release of microcystin toxins into the water supply, we extracted daily DNA samples from two sites during water collection at the Collins Park WTP during the suspected viral lysis event. Through quantitative real-time PCR (qPCR) analysis, samples from these sites were monitored for total Microcystis (as measured via 16S gene copies ml−1) and the percentage of the total population having the potential to produce toxins (mcyB or mcyD) (Fig. 9A). During this bloom event, Microcystis was present at the Toledo water intake crib and entering the treatment plant, while the surge well was host to almost equal numbers of 16S gene copies (Fig. 9A). Based on this analysis, less than 1% of the total population contained the mcyB gene and 1 to 8% of the total population contained the mcyD gene (Fig. 9A). These percentages are low compared to the percentages from the metagenomic data set from 2 August, which reports 9.5 to 10.1% of the Microcystis population in the surge well and 3.5% of the Microcystis population at the intake contained the mcyB and/or the mcyD gene compared to the reads attributed to the 16S gene (Table S1).
FIG 9.
qPCR analysis of the 2019 lysis event sampling period for quantification of host and viral genome counts. (A) 16S analysis as an approximation for total number of host cells per ml at the intake and surge well sites, while mcyB and mcyD gene copy numbers are used as an approximation to quantify number of potential microcystin toxin producing host cells ml−1. (B) Two different viral genes used to quantity viral loads; phage tail collar protein (collar) for Ma-LMM01-like cyanophages, and phage portal protein (portal) for MVGF_J_348-like cyanophages. qPCR values are based on analysis of both particle-associated (defined as retained on a Sterivex filter) and free phage.
Viral sequences were analyzed in two fractions as follows: particle-associated (including host), which was extracted from filtered biomass, and the free virus fraction, which was purified and concentrated using a cation-coated filter protocol developed for noroviruses and enteroviruses (25). The separate analyses were conducted to determine whether viral activity could be detected through a spike in viral numbers in the free fraction in relation to a decline in particle-associated virus. qPCR was performed utilizing two different Microcystis cyanophage primers: the phage tail collar for Ma-LMM01-like cyanophages, and the phage portal protein for the novel Microcystis putative siphovirus MVGF_J_348 (Fig. 9B). qPCR with the Ma-LMM01-like primer set revealed a spike in free cyanophage on 3 August at the intake, a day before the spike in dissolved toxins at the same site (Fig. 4). At the surge well site, viral copy numbers were higher for the phage portal protein in the particle-associated fraction.
Like the other two free phage fractions at the intake site, there was an increase in copy number of the MVGF_J_348 putative siphovirus portal protein on 3 August (Fig. 9B). Notably, the free virus fraction at the surge well tracked the dissolved microcystin release at that site; there was a small peak on 2 August and a larger peak starting on 5 August.
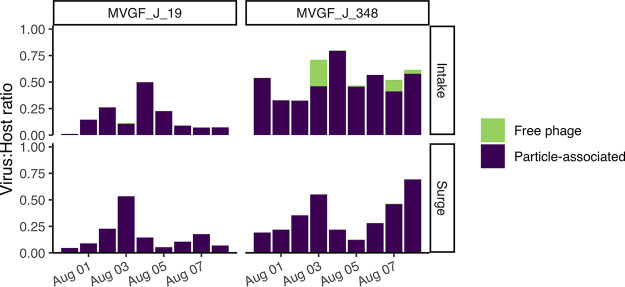
Finally, the ratio of particle-associated viral copy numbers was compared to the corrected 16S copy numbers to visualize infection rates (Fig. 10). The abundance of the phage collar protein gene for MVGF_J_19 reached 50% of the host population at the surge well on 3 August and the intake on 4 August. The phage portal protein gene for novel virus MVGF_J_348 was the most abundant viral sequence, representing 70 to 80% of the host population at the intake on 3 August and 4 August and at the surge well on 8 August. While in general the abundance of viral sequences in the free viral fraction was comparatively low, the filtrate made up 25% of the host population at the intake on 3 August. Again, this spike in free viral numbers on 3 August preceded a spike in dissolved microcystins on 4 August.
FIG 10.
Virus-to-host ratio based on qPCR analysis of both host-associated (particle-associated) and free phage. The host gene assessed was 16S. According to the ratio numbers, MVGF_J_19 (collar) peaked on 3 and 4 August, but at only 50% of the host concentration. MVGF_J_348 (portal) peaked on 3 and 4 August as well, but at 50 to 75% of the host concentration, and for a longer duration.
DISCUSSION
This study demonstrates that characterizing and documenting the activity of cyanophages in cHABs is important in assessing risks associated with toxin-producing cHABs. Prior work has shown that cyanophage lysis of a bloom yields an increase in dissolved microcystins by releasing a pool of intracellular toxins (6). Through this study, we captured another viral infection and release of dissolved microcystins via a dual infection of a Ma-LMM01-like cyanophage and a novel Microcystis cyanophage. Infective cyanophages have been isolated from Lake Erie (26) and several studies provide evidence for active infections of the Microcystis cHABs in western Lake Erie (6, 27–29). The 2014 Toledo water crisis demonstrated that viral infection of a bloom can affect toxin release into the dissolved phase with some fraction of the toxin persisting through water treatment. Prompted by that event, water treatment plants in Ohio are now mandated to conduct regular testing for microcystins.
Metagenomic analysis of the 2019 bloom lysis event revealed the presence of several Microcystis viral genomic fragments (MVGF), all of which are related to other MVGFs isolated from M. aeruginosa-dominated cyanobacterial blooms in Hirosawanoike Pond, Japan (Fig. 5) (23). MVGF_J_19 is a Ma-LMM01-like cyanophage sharing high genomic and proteomic similarities to Ma-MVDC (Fig. 7A), MVGF_NODE34 (LC425512), and MVGF_NODE47 (LC425513) (Fig. 5) (23). The 2014 lysis event was attributed to infection by an Ma-LMM01 cyanophage (6), which was the most abundant viral sequence, representing 1.17% of the total transcriptomic reads assigned to the host reference genome at the Toledo water intake site (site WE12; Fig. 8). To compare, MVGF_J_19 represented 1.76% and 1.81% of the total metagenomic reads assigned to the host reference (Microcystis aeruginosa NIES-843; AP009552) at the intake and surge well, respectively (Fig. 6). Since these values are total reads, direct comparison of abundance between different organisms is difficult because the organisms have different genome sizes. The M. aeruginosa genome is 5.84 Mb (NC_010296.1) (11), which is approximately 30 – fold larger than the 118-kb genome of MVGF_J_19 (Fig. 5). To address this difference, we also quantified the host (Fig. 9A) and viral concentrations (Fig. 9B) over the 2019 lysis event and calculated the ratio of virus to host (Fig. 10). Interestingly, the trend of free phage released at the intake site for both MVGF_J_19 and MVGF_J_348 (Fig. 9B) displays a covariation that may suggest that either these two phages are attacking the same community or they were triggered by the same stimuli to induce active infections. The qPCR for MVGF_J_19 estimates the viral load to be about half the host population at the surge well on 3 August and at the intake on 4 August (Fig. 10). These viral loads are lower than the viral loads estimated to be responsible for the 2014 water crisis, which quantified the virus at a transcriptomic ratio of 1:1 using gp091 and rpoB from M. aeruginosa (6).
Metagenomic analysis of the 2019 lytic event also provided genetic information on the novel cyanophage MVGF_J_348 (Fig. 6). MVGF_J_348 resembles a member of Siphoviridae based on proteomic analysis (Fig. 7B), aligning with MVGF_NODE382 (LC425517) (23). These cyanophages are thought to be a completely new lineage of abundant, narrow-host-range viruses (23). To confirm that these viruses might represent Microcystis-specific cyanophages, MVGF_J_348 contains sequence homologs for M. aeruginosa uncharacterized proteins (68.1% of the viral genes) (Table S4). While present during the 2014 water crisis, MVGF_J_348 was not abundant, representing only 0.04% of the host total transcriptomic read counts at site WE12 (Fig. 8). However, MVGF_J_348 was a prominent member of the 2019 phage population, representing 71% and 80% of the host abundance on 3 August and 4 August at the intake, based on qPCR analysis (Fig. 10).
While this study managed to capture a lysis event during the first week of August 2019, the overall duration of the bloom was no different than other years, instead possibly facilitating a change in the community composition of Microcystis phenotype/oligotype dominance (16, 17, 30). Enumeration of Microcystis through 16S copy numbers did not show a steep decline over the viral infection period (Fig. 9A), and the bloom in the western basin of Lake Erie continued to persist until late September (31). On 5 August, directly after the measured spike in dissolved toxins, the bloom reached its maximum biomass for the season (32). Coincident with the detection of dissolved microcystins and increased cyanophage activity was a change in the appearance of the bloom. Large amounts of foam were detected on the water surface, which may also be linked to viral lysis (Fig. S1). Indeed, foam production is typically a consequence of phage lysis in laboratory cultures (e.g., 33, 34). Overall, our results indicate that the viral activity was directed to a subset of Microcystis spp. present in the bloom, which is expected given that the Microcystis cHAB is typically a mixture of toxigenic and nontoxigenic genotypes (11, 35). Indeed, this lends further support to the idea that multiple rounds of viral lysis are likely a very common event over the duration of the bloom season (7, 27, 36), thus reinforcing the case for developing an approach for water treatment plant operators to track infections.
Whereas the bloom was not different based on the methods of measurement employed here, viral infections in cHAB communities can alter community composition (37–39). Additionally, this work shows that viral community composition can vary from year to year, as the viral community differed between the 2019 event and the 2014 event, but both occurred during the first week of August. With the discovery of novel cyanophages in Microcystis blooms (23, 40, this study), development of molecular tools to track viral activity can lead to near real-time detection of toxin releases that threaten water quality for consumers. Advances in molecular tools in conjunction with increasingly user-friendly microcystin-detection methods will allow for more frequent sampling to better inform both researchers and WTP operators on the state and health of local toxin-producing cHABs.
MATERIALS AND METHODS
Sample collection.
Sampling occurred daily from 31 July to 8 August, and again on 15 August 2019 as part of regular cyanotoxin monitoring efforts by the City of Toledo Division of Water Treatment. The bloom surrounded the Toledo municipal water intake crib during this period (Fig. 1). Water samples were taken from three locations within the treatment system as follows: (i) the intake crib (Fig. 2, site 1), which carries the water from Lake Erie directly to the low service pump station for initial treatment; (ii) the surge well within the low service pump station (Fig. 2, site 2), where water from the intake crib is diverted and treated with potassium permanganate (used for dreissenid mussel control); and (iii) the raw water that enters the Collins Park WTP following activated carbon treatment (Fig. 2, site 3). Samples for dissolved microcystins were obtained by passage of whole water through 0.22-μm Sterivex cartridge filters (EMD Millipore, Billerica, MA) immediately upon collection, and the filtrate was frozen upon return to the lab (typically within 1 to 2 h after collection). The Sterivex cartridges were immediately frozen upon collection on dry ice prior to storage at −80°C and were subsequently used to extract DNA for qPCR and metagenomic analysis. Whole water was collected for total microcystins and these samples were frozen at −20°C until analysis. An additional 2 liters of unfiltered water was collected for viral filtration and concentration and stored at 4°C for no more than 24 h after collection (41). Samples for the determination of chlorophyll (chl) a biomass concentration were collected on 0.2-μm polycarbonate membrane filters (Sterilitech, Kent, WA) and frozen at −20°C until analysis. Chl a was measured by fluorometry following dimethyl sulfoxide (DMSO) extraction of the polycarbonate filters (42).
Total and dissolved MCs were extracted from samples following three freeze/thaw cycles and measured by the Ohio EPA-approved Abraxis Microcystins-ADDA enzyme-linked immunosorbent assay (ELISA) (Abraxis LLC, Warminster, PA; EPA method 546) following the protocols of Fischer et al. (43). The Ohio EPA kit has the addition of a low calibration range check (LCRC) for further kit quality control. The LCRC is a provided control at the low end of the concentration curve (≥0.30 μg liter−1 and ≤0.50 μg liter−1), used to ensure the acceptability of the curve at the low end. The assay is congener-independent, as it detects the invariant ADDA moiety of MCs. The assay detection limit was 0.04 μg liter−1.
Viral filtration and concentration.
One liter of unfiltered water was used in the filtration protocol to collect extracellular phage particles as detailed by Haramoto et al. (25). Briefly, the whole/unfiltered water was split into two 500-ml duplicate portions for each date and prefiltered through a Whatman 4 filter (GE Healthcare Bio-Sciences, Pittsburgh, PA) to remove large particles. A 0.45-μm pore size S-Pak membrane filter (MilliporeSigma, Burlington, MA) was charged with 250 mM AlCl3 and placed on a vacuum filtration apparatus. The filtrate from the first step was passed through the charged S-Pak membrane filter, with the aluminum promoting retention of the cyanophage present in the sample. The filter was washed with 0.5 mM H2SO4 to remove remaining aluminum ions prior to phage elution with 10 mM NaOH, followed by 100× TE buffer (1 M Tris-HCl, 100 mM EDTA [pH 8.0]). The eluate was further concentrated to a volume of ∼2 ml by a Centriprep YM-50 ultrafiltration unit (MilliporeSigma). Viral concentrates were stored at −80°C.
DNA extraction.
The xanthogenate-SDS extraction method used for viral filtrate DNA extractions was outlined by Tillett and Neilan (44) to extract the DNA from environmental samples containing cyanobacteria, and was later modified by Yoshida et al. (12) for use on Microcystis cyanophages. Concentrated viral filtrate (200 μl) was added to 750 μl of XS buffer (1% potassium ethyl xanthogenate, 100 mM Tris-HCl [pH 7.4], 20 mM EDTA [pH 8], 1% sodium dodecyl sulfate, 800 mM ammonium acetate) and incubated at 70°C for 30 min, vortexing every 10 min. After incubation for 30 min on ice, isopropanol was added to each tube to 50% (vol/vol). The tubes were incubated at room temperature for a minimum of 10 min followed by centrifugation to pellet the DNA at 12,000 × g for 10 min. DNA was washed with 70% ethanol and then air dried for 24 h before resuspension in TE buffer (10 mM Tris‐HCl, 1 mM EDTA [pH 8]). Once the DNA was extracted, it was stored at −80°C for later use. DNA was extracted from Sterivex cartridge filters with the DNeasy PowerWater Sterivex DNA isolation kit (Qiagen, Germantown, MD) following the manufacturer's instructions.
Metagenomic analysis.
DNA isolated from the Toledo water intake and the low service pump station surge well (Fig. 2) were sequenced at the University of Michigan Advanced Genomics Core (Ann Arbor, MI). DNA samples from the Collins Park WTP (raw) were not included in this data set. Core staff performed sample QC, library generation, and ran samples on a NovaSeq 6000 sequencing system (Illumina, San Diego, CA).
FASTA files were imported into CLC Genomics Workbench v.12.0.2 software (Qiagen, Redwood City, CA) with the default quality settings following Steffen et al. (6). Failed reads were discarded during import. Paired-end reads for both samples were trimmed for quality prior to being combined for assembly into contigs (minimum length of 2,000 bp) using the CLC Genomics Workbench de novo assembly function that also mapped reads back to the generated contigs. Generated contigs were exported as FASTA files for the detection of virus-associated sequences using VirSorter 1.0.3, with the “virome” option (45). Suspected prophages were excluded from further analysis. FASTA files of suspected viral sequences (category 1 [“pretty sure”] and category 2 [“quite sure”]) were reimported into the CLC Genomics Workbench and analyzed by BLAST against Microcystis phages Ma-LMM01 (NC_008562) and MaMV-DC (NC_029002), as well as the Microcystis viral genomic fragments (MVGFs) as described by Morimoto et al. (23), accessed at NCBI under accession numbers LC425512 to LC425526. Additionally, these suspected viral contigs were elongated using the Join Contigs tool under the Genome Finishing Module of the CLC Genomics Workbench with the selections for “align contigs to self and align contigs to references” using the same reference sequences as the BLAST function. The resulting contigs were checked against the NCBI database to confirm viral status. The proteomic tree, gene annotations, and genomic alignment views for viral contigs were constructed using the ViPTree server (46).
Reads were mapped back to the new viral sequences, as well as the reference sequences, to obtain relative abundance of each viral contig in relation to the abundance of Microcystis aeruginosa NIES-843 (AP009552) and expressed as the total number of reads per kilobase of genome per million mapped reads (RPKM). Open reading frames (ORFs) for the viral contigs were predicted using the Find Prokaryotic Genes tool under the Functional Analysis: Microbial Genomics Module of the CLC Genomics Workbench and annotated using the Best BLAST Hit (Swiss-Prot database), Best Diamond Hit (UniProt Reference Clusters; 2019_03), and Pfam Domains (Pfam A v32) tools.
Comparison of viral sequences to the 2014 Toledo water crisis transcriptome.
In order to compare the viral communities between the 2014 and 2019 viral events, raw transcriptomic sequences from the 2014 Toledo water crisis Microcystis bloom were obtained from the NCBI read archive under project number SRP094616 (6). FASTA files were imported into CLC Genomics Workbench v.12.0.2 as described above. The tool RNA-Seq Analysis within the Transcriptomics module was used for mapping both the reads to Microcystis aeruginosa NIES-843 and the viral sequences generated from the metagenomic analysis. Expression values from the 2014 data set were calculated as the total number of reads per kilobase of genome per million mapped reads (RPKM).
Real-time PCR quantification of viral sequences during lysis event.
As an independent assessment of both host and virus abundances during this bloom event, a real-time quantitative PCR (qPCR) assay was performed using a combination of previously published primer sets and primer sets designed from phage portal or tail genes of the viral contigs (Table 1). Primer sets for 16S, mycB, and mcyD were used to amplify total and potential microcystin-producing populations of Microcystis aeruginosa, respectively (Table 1). Note that the host reference genome, Microcystis aeruginosa NIES-843 contains two copies of 16S (47), which was confirmed for Lake Erie Microcystis aeruginosa through metagenomic mapping (Table S1), therefore the raw values for qPCR 16S were halved for comparisons. While primer sets for tail sheath gene gp091 and for a phage collar protein gene have been used to amplify Ma-LMM01-like cyanophages (including MVGF_J_19), sequence variability among gp091 sequences from Ma-LMM01 and related phage contigs in this study resulted in our designing new primers to target the phage collar protein gene for qPCR. Primer sets for a phage tail portal protein gene were used to amplify MVGF_J_348-like cyanophages (Table 1).
Novel primer sets were designed using recognizable viral proteins such as the phage tail collar protein and the phage sheath protein. The primer sets were designed by adding the viral protein sequences from the metagenomic data set to the Integrated DNA Technologies (Coralville, IA) primer designer web application (OligoPerfect Primer Designer; Thermo Fisher Scientific, Waltham, MA). Selected primer sets were then analyzed by BLAST against the metagenomic data set to assess possible cross-reactivity. Once tested, the region of each gene inclusive of the primer sets and extra base pairs in either direction was extracted from the metagenome data set to create external standards. External standards were used to determine copy numbers of each gene by creating 10-fold dilution series of G-block gene fragments (Table S2) purchased from Integrated DNA Technologies (Integrated DNA Technologies, Coralville, IA), specific for each gene of interest. G-blocks were diluted to 10 ng μl−1 stocks, and the total copy number of G-block fragments was calculated using the formula: number of copies (molecules) = (X ng × 6.0221 × 10²³ molecules/mole)/([N × 660 g/mole] × 1 × 10⁹ ng/g), where X is the amount of amplicon in ng, N is the length of the dsDNA amplicon, and 660 g/mole is the average mass of 1 bp of dsDNA (48). The limit of detection is 1 copy per reaction unless there are detections in blanks (Table S3).
Real-time PCR was performed using 5 μl of each extracted DNA with the PowerUp SYBR green master mix (Thermo Fisher Scientific, Waltham, MA) and 400 nM of each primer. Each sample was run under the same conditions multiple times using the different primer sets, as each reaction was a singleplex run. After an initial activation step at 50°C for 2 min and a denaturing step at 95°C for 2 min, 40 cycles were performed as follows: 15 s at 95°C, 30 s at 55°C, and 60 s at 72°C. A melt curve was also performed to ensure a single qPCR product was formed, going from 50°C to 95°C with an increase of 0.5°C per cycle. The program was run on a 4-channel Q real-time PCR thermocycler (Quantabio, Beverly, MA) along with the Q-qPCR v1.0.1 software analysis program (Quantabio, Beverly, MA), which was used to determine the sample concentrations compared to a standard curve.
Data availability.
The Microcystis viral contigs assembled from the metagenome reads were deposited in the National Center for Biotechnology Information (NCBI) GenBank Database under accession numbers MT840185 to MT840191. The raw metagenome data were deposited in the NCBI Sequence Read Archive (SRA) under BioProject accession number PRJNA638034.
Supplementary Material
ACKNOWLEDGMENTS
This work was partially supported by funding from the Harmful Algal Bloom Research Initiative (HABRI) of the Ohio Board of Higher Education and NIH (1P01ES028939-01) and NSF (OCE-1840715) awards to the Bowling Green State University Great Lakes Center for Fresh Waters and Human Health.
We also thank the Bullerjahn, McKay, and Davis lab members who helped with sampling during this bloom event: Emily N. Beers, Thijs Frenken, Daniel H. Peck, and Callie Nauman. The authors also thank the staff at the Collins Park Water Treatment Plant for their help in sampling and communication with respect to the water treatment process.
Footnotes
Supplemental material is available online only.
REFERENCES
- 1.Ho JC, Michalak AM, Pahlevan N. 2019. Widespread global increase in intense lake phytoplankton blooms since the 1980s. Nature 574:667–670. doi: 10.1038/s41586-019-1648-7. [DOI] [PubMed] [Google Scholar]
- 2.Steffen MM, Belisle BS, Watson SB, Boyer GL, Wilhelm SW. 2014. Status, causes and controls of cyanobacterial blooms in Lake Erie. J Great Lakes Res 40:215–225. doi: 10.1016/j.jglr.2013.12.012. [DOI] [Google Scholar]
- 3.Davis TW, Stumpf R, Bullerjahn GS, McKay RM, Chaffin JD, Bridgeman TB, Winslow C. 2019. Science meets policy: a framework for determining impairment designation criteria for large waterbodies affected by cyanobacterial harmful algal blooms. Harmful Algae 81:59–64. doi: 10.1016/j.hal.2018.11.016. [DOI] [PubMed] [Google Scholar]
- 4.Michalak AM, Anderson EJ, Beletsky D, Boland S, Bosch NS, Bridgeman TB, Chaffin JD, Cho K, Confesor R, Daloglu I, Depinto JV, Evans MA, Fahnenstiel GL, He L, Ho JC, Jenkins L, Johengen TH, Kuo KC, Laporte E, Liu X, McWilliams MR, Moore MR, Posselt DJ, Richards RP, Scavia D, Steiner AL, Verhamme E, Wright DM, Zagorski M. a. 2013. Record-setting algal bloom in Lake Erie caused by agricultural and meteorological trends consistent with expected future conditions. Proc Natl Acad Sci U S A 110:6448–6452. doi: 10.1073/pnas.1216006110. [DOI] [PMC free article] [PubMed] [Google Scholar]
- 5.Bullerjahn GS, McKay RM, Davis TW, Baker DB, Boyer GL, D'Anglada LV, Doucette GJ, Ho JC, Irwin EG, Kling CL, Kudela RM, Kurmayer R, Michalak AM, Ortiz JD, Otten TG, Paerl HW, Qin B, Sohngen BL, Stumpf RP, Visser PM, Wilhelm SW. 2016. Global solutions to regional problems: collecting global expertise to address the problem of harmful cyanobacterial blooms. A Lake Erie case study. Harmful Algae 54:223–238. doi: 10.1016/j.hal.2016.01.003. [DOI] [PMC free article] [PubMed] [Google Scholar]
- 6.Steffen MM, Davis TW, McKay RML, Bullerjahn GS, Krausfeldt LE, Stough JMA, Neitzey ML, Gilbert NE, Boyer GL, Johengen TH, Gossiaux DC, Burtner AM, Palladino D, Rowe MD, Dick GJ, Meyer KA, Levy S, Boone BE, Stumpf RP, Wynne TT, Zimba PV, Gutierrez D, Wilhelm SW. 2017. Ecophysiological examination of the Lake Erie Microcystis bloom in 2014: linkages between biology and the water supply shutdown of Toledo, OH. Environ Sci Technol 51:6745–6755. doi: 10.1021/acs.est.7b00856. [DOI] [PubMed] [Google Scholar]
- 7.Davenport EJ, Neudeck MJ, Matson PG, Bullerjahn GS, Davis TW, Wilhelm SW, Denney MK, Krausfeldt LE, Stough JMA, Meyer KA, Dick GJ, Johengen TH, Lindquist E, Tringe SG, McKay RML. 2019. Metatranscriptomic analyses of diel metabolic functions during a Microcystis bloom in Western Lake Erie (United States). Front Microbiol 10:2081. doi: 10.3389/fmicb.2019.02081. [DOI] [PMC free article] [PubMed] [Google Scholar]
- 8.Young FM, Morrison LF, James J, Codd GA. 2008. Quantification and localization of microcystins in colonies of a laboratory strain of Microcystis (Cyanobacteria) using immunological methods. Eur J Phycol 43:217–225. doi: 10.1080/09670260701880460. [DOI] [Google Scholar]
- 9.Makarova KS, Wolf YI, Snir S, Koonin EV. 2011. Defense islands in bacterial and archaeal genomes and prediction of novel defense systems. J Bacteriol 193:6039–6056. doi: 10.1128/JB.05535-11. [DOI] [PMC free article] [PubMed] [Google Scholar]
- 10.Kuno S, Yoshida T, Kaneko T, Sako Y. 2012. Intricate interactions between the bloom-forming cyanobacterium Microcystis aeruginosa and foreign genetic elements, revealed by diversified clustered regularly interspaces short palindromic repeat (CRISPR) signatures. Appl Environ Microbiol 78:5353–5360. doi: 10.1128/AEM.00626-12. [DOI] [PMC free article] [PubMed] [Google Scholar]
- 11.Meyer K, Davis TW, Watson SA, Berry MA, Denef VJ, Dick GJ. 2017. Genome sequences of lower Great Lakes Microcystis strains reveal strain-specific genes that are present and expressed during western Lake Erie blooms. PLoS One 12:e0183859. doi: 10.1371/journal.pone.0183859. [DOI] [PMC free article] [PubMed] [Google Scholar]
- 12.Yoshida T, Takashima Y, Tomaru Y, Shirai Y, Takao Y, Hiroishi S, Nagasaki K. 2006. Isolation and characterization of a cyanophage infecting the toxic cyanobacterium Microcystis aeruginosa. Appl Environ Microbiol 72:1239–1247. doi: 10.1128/AEM.72.2.1239-1247.2006. [DOI] [PMC free article] [PubMed] [Google Scholar]
- 13.Ou T, Li S, Liao X, Zhang Q. 2013. Cultivation and characterization of the MaMV-DC cyanophage that infects bloom-forming cyanobacterium Microcystis aeruginosa. Virol Sin 28:266–271. doi: 10.1007/s12250-013-3340-7. [DOI] [PMC free article] [PubMed] [Google Scholar]
- 14.Takashima Y, Yoshida T, Yoshida M, Shirai Y, Tomaru Y, Takao Y, Hiroishi S, Nagasaki K. 2007. Development and application of quantitative detection of cyanophages phylogenetically related to cyanophage Ma-LMM01 infection Microcystis aeruginosa in fresh water. Microb Environ 22:207–213. doi: 10.1264/jsme2.22.207. [DOI] [Google Scholar]
- 15.Yoshida T, Nagasaki K, Takashima Y, Shirai Y, Tomaru Y, Takao Y, Sakamoto S, Hiroishi S, Ogata H. 2008. Ma-LMM01 infecting toxic Microcystis aeruginosa illuminates diverse cyanophage genome strategies. J Bacteriol 190:1762–1772. doi: 10.1128/JB.01534-07. [DOI] [PMC free article] [PubMed] [Google Scholar]
- 16.Kimura-Sakai S, Sako Y, Yoshida T. 2015. Development of a real-time PCR assay for the quantification of Ma-LMM01-type Microcystis cyanophages in a natural pond. Lett Appl Microbiol 60:400–408. doi: 10.1111/lam.12387. [DOI] [PubMed] [Google Scholar]
- 17.Kimura S, Yoshida T, Hosoda N, Honda T, Kuno S, Kamiji R, Hashimoto R, Sako Y. 2012. Diurnal infection patterns and impact of Microcystis cyanophages in a Japanese pond. Appl Environ Microbiol 78:5805–5811. doi: 10.1128/AEM.00571-12. [DOI] [PMC free article] [PubMed] [Google Scholar]
- 18.Xia H, Wang M, Ge X, Wu Y, Yang X, Zhang Y, Li T, Shi Z. 2013. Study of the dynamics of Microcystis aeruginosa and its cyanophage in East Lake using quantitative PCR. Virol Sin 28:309–311. doi: 10.1007/s12250-013-3368-8. [DOI] [PMC free article] [PubMed] [Google Scholar]
- 19.Mankiewicz-Boczek J, Jaskulska A, Pawełczyk J, Gągała I, Serwecińska L, Dziadek J. 2016. Cyanophages infection of Microcystis bloom in lowland dam reservoir of Sulejów, Poland. Microb Ecol 71:315–325. doi: 10.1007/s00248-015-0677-5. [DOI] [PubMed] [Google Scholar]
- 20.McKay RM, Tuttle T, Reitz LA, Bullerjahn GB, Cody WR, McDowell AJ, Davis TW. 2018. Early onset of a microcystin-producing cyanobacterial bloom in an agriculturally-influenced Great Lakes tributary. J Ocean Limnol 36:1112–1125. doi: 10.1007/s00343-018-7164-z. [DOI] [Google Scholar]
- 21.Ohio Environmental Protection Agency. 2018. Ohio EPA quantitative polymerase chain reaction (qPCR) multi-plex molecular assay for determination of cyanobacteria and cyanotoxin-producing genes, analytical methodology, Ohio EPA DES method 705.0. https://epa.ohio.gov/Portals/28/documents/habs/705.0-qPCR.pdf.
- 22.Roux S, Adriaenssens EM, Dutilh BE, Koonin EV, Kropinski AM, Krupovic M, Kuhn JH, Lavigne R, Brister JR, Varsani A, Amid C, Aziz RK, Bordenstein SR, Bork P, Breitbart M, Cochrane GR, Daly RA, Desnues C, Duhaime MB, Emerson JB, Enault F, Fuhrman JA, Hingamp P, Hugenholtz P, Hurwitz BL, Ivanova NN, Labonté JM, Lee KB, Malmstrom RR, Martinez-Garcia M, Mizrachi IK, Ogata H, Páez-Espino D, Petit MA, Putonti C, Rattei T, Reyes A, Rodriguez-Valera F, Rosario K, Schriml L, Schulz F, Steward GF, Sullivan MB, Sunagawa S, Suttle CA, Temperton B, Tringe SG, Thurber RV, Webster NS, Whiteson KL, Wilhelm SW, Wommack KE, Woyke T, Wrighton KC, et al. 2019. Minimum information about an uncultivated virus genome (MIUVIG). Nat Biotechnol 37:29–37. doi: 10.1038/nbt.4306. [DOI] [PMC free article] [PubMed] [Google Scholar]
- 23.Morimoto D, Tominaga K, Nishimura Y, Yoshida N, Kimura S, Sako Y, Yoshida T. 2019. Cooccurrence of broad- and narrow-host-range viruses infection the bloom-forming toxic cyanobacterium Microcystis aeruginosa. Appl Environ Microbiol 85:1–17. doi: 10.1128/AEM.01170-19. [DOI] [PMC free article] [PubMed] [Google Scholar]
- 24.Giner CR, Forn I, Romac S, Logares R, de Vargas C, Massan R. 2016. Environmental sequencing provides reasonable estimates of the relative abundance of specific picoeukaryotes. Appl Environ Microbiol 82:4757–4766. doi: 10.1128/AEM.00560-16. [DOI] [PMC free article] [PubMed] [Google Scholar]
- 25.Haramoto E, Katayama H, Oguma K, Ohgaki S. 2005. Application of cation-coated filter method to detection of noroviruses, enteroviruses, adenoviruses, and torque teno viruses in the Tamagawa River in Japan. Appl Environ Microbiol 71:2403–2411. doi: 10.1128/AEM.71.5.2403-2411.2005. [DOI] [PMC free article] [PubMed] [Google Scholar]
- 26.Wilhelm SW, Carberry MJ, Eldridge ML, Poorvin L, Saxton MA, Doblin MA. 2006. Marine and freshwater cyanophages in a Laurentian Great Lake: evidence from infectivity assays and molecular analyses of g20 genes. Appl Environ Microbiol 72:4957–4963. doi: 10.1128/AEM.00349-06. [DOI] [PMC free article] [PubMed] [Google Scholar]
- 27.Steffen MM, Belisle BS, Watson SB, Boyer GL, Bourbonniere RA, Wilhelm SW. 2015. Metatranscriptomic evidence for co-occurring top-down and bottom-up controls on toxic cyanobacterial communities. Appl Environ Microbiol 81:3268–3276. doi: 10.1128/AEM.04101-14. [DOI] [PMC free article] [PubMed] [Google Scholar]
- 28.Harke MJ, Davis TW, Watson SB, Gobler CJ. 2016. Nutrient-controlled niche differentiation of western Lake Erie cyanobacterial populations revealed via metatranscriptomic surveys. Environ Sci Technol 50:604–615. doi: 10.1021/acs.est.5b03931. [DOI] [PubMed] [Google Scholar]
- 29.Jiang X, Ha C, Lee S, Kwon J, Cho H, Gorham T, Lee J. 2019. Characterization of cyanophages in Lake Erie: interaction mechanisms and structural damage of toxic cyanobacteria. Toxins 11:444–412. doi: 10.3390/toxins11080444. [DOI] [PMC free article] [PubMed] [Google Scholar]
- 30.Berry MA, White JD, Davis TW, Jain S, Johengen TH, Dick GJ, Sarnelle O, Denef VJ. 2017. Are oligotypes meaningful ecological and phylogenetic units? A case study of Microcystis in freshwater lakes. Front Microbiol 8:365. doi: 10.3389/fmicb.2017.00365. [DOI] [PMC free article] [PubMed] [Google Scholar]
- 31.National Oceanic and Atmospheric Administration. 2019. Lake Erie harmful algal bloom bulletin: 01 August, 2019. https://www.glerl.noaa.gov/res/HABs_and_Hypoxia/lakeErieHABArchive/.
- 32.National Oceanic and Atmospheric Administration. 2019. Experimental Lake Erie harmful algal bloom bulletin: 31 October, 2019. https://www.glerl.noaa.gov/res/HABs_and_Hypoxia/lakeErieHABArchive/.
- 33.Fraser D. 1951. An apparatus for the growth of aerobic bacteria and the preparation of bacteriophage. J Bacteriol 61:115–119. doi: 10.1128/JB.61.2.115-119.1951. [DOI] [PMC free article] [PubMed] [Google Scholar]
- 34.Sargeant K, Yeo RG. 1966. The production of bacteriophage μ2. Biotechnol Bioeng 8:195–215. doi: 10.1002/bit.260080203. [DOI] [Google Scholar]
- 35.Matson P, Boyer G, Bridgeman T, Bullerjahn GS, Kane DD, McKay RM, McKindles K, Raymond H, Snyder B, Stumpf R, Davis TW. 2020. Physical drivers facilitating a toxigenic cyanobacterial bloom in a major Great Lakes tributary. Limnol Oceanogr 65. doi: 10.1002/lno.11558. [DOI] [PMC free article] [PubMed] [Google Scholar]
- 36.Bertasi B, Bignotti E, Ferrando L, D'Abrosca F, Scaratti L, Pomati F. 2003. The standardization of a molecular biology method to verify the presence of Microcystis aeruginosa. Vet Res Commun 27:277–279. doi: 10.1023/B:VERC.0000014159.85554.17. [DOI] [PubMed] [Google Scholar]
- 37.Suttle CA. 2002. Cyanophages and their role in the ecology of cyanobacteria, p 563–589. In Whitton BA, Potts M. (ed), The ecology of cyanobacteria. Springer, Dordrecht, The Netherlands. [Google Scholar]
- 38.Muhling M, Fuller NJ, Millard A, Somerfield PJ, Marie D, Wilson WH, Scanlan DJ, Post AF, Joint I, Mann NH. 2005. Genetic diversity of marine Synechococcus and co-occurring cyanophage communities: evidence for viral control of phytoplankton. Environ Microbiol 7:499–508. doi: 10.1111/j.1462-2920.2005.00713.x. [DOI] [PubMed] [Google Scholar]
- 39.Mann NH, Clokie MR. 2012. Cyanophages, p 535–557. In Whitton BA. (ed), Ecology of cyanobacteria II. Springer, Dordrecht, The Netherlands. [Google Scholar]
- 40.Yang F, Jin H, Wang X-Q, Li Q, Zhang J-T, Cui N, Jiang Y-L, Chen Y, Wu Q-F, Zhou C-Z, Li W-F. 2020. Genomic analysis of Mic1 reveals a novel freshwater long-tailed cyanophage. Front Microbiol 11:484. doi: 10.3389/fmicb.2020.00484. [DOI] [PMC free article] [PubMed] [Google Scholar]
- 41.Centers for Disease Control and Prevention. 2003. General principles: microbiologic sampling of the environment, in “Guidelines for environmental infection control in health-care facilities.” https://www.cdc.gov/infectioncontrol/guidelines/environmental/background/sampling.html.
- 42.Golnick PC, Chaffin JD, Bridgeman TB, Zellner BC, Simons VE. 2016. A comparison of water sampling and analytical methods in western Lake Erie. J Great Lakes Res 42:965–971. doi: 10.1016/j.jglr.2016.07.031. [DOI] [Google Scholar]
- 43.Fischer WJ, Garthwaite I, Miles CO, Ross KM, Aggen JB, Chamberlin AR, Towers NR, Dietrich DR. 2001. Congener-independent immunoassay for microcystins and nodularins. Environ Sci Technol 35:4849–4856. doi: 10.1021/es011182f. [DOI] [PubMed] [Google Scholar]
- 44.Tillett D, Neilan BA. 2000. Xanthogenate nucleic acid isolation from cultured and environmental cyanobacteria. J Phycol 36:251–258. doi: 10.1046/j.1529-8817.2000.99079.x. [DOI] [Google Scholar]
- 45.Roux S, Enault F, Hurwitz BL, Sullivan MB. 2015. VirSorter: mining viral signal from microbial genomic data. PeerJ 3:e395. doi: 10.7717/peerj.985. [DOI] [PMC free article] [PubMed] [Google Scholar]
- 46.Nishimura Y, Yoshida T, Kuronishi M, Uehara H, Ogata H, Goto S. 2017. ViPTree: the viral proteomic tree server. Bioinformatics 33:2379–2380. doi: 10.1093/bioinformatics/btx157. [DOI] [PubMed] [Google Scholar]
- 47.Kaneko T, Nakajima N, Okamoto S, Suzuki I, Tanabe Y, Tamaoki M, Nakamura Y, Kasai F, Watanabe A, Kawashima K, Kishida Y, Ono A, Shimizu Y, Takahashi C, Minami C, Fujishiro T, Kohara M, Katoh M, Nakazaki N, Nakayama S, Yamada M, Tabata S, Watanabe MM. 2007. Complete genomic structure of the bloom-forming toxic cyanobacterium Microcystis aeruginosa NIES-843. DNA Res 14:247–256. doi: 10.1093/dnares/dsm026. [DOI] [PMC free article] [PubMed] [Google Scholar]
- 48.Prediger E. 2013. Calculations: converting from nanograms to copy number. Integrated DNA Technologies; https://www.idtdna.com/pages/education/decoded/article/calculations-converting-from-nanograms-to-copy-number. [Google Scholar]
- 49.Henry T. 2015. Explaining Toledo’s water treatment process. Toledo Blade, Toledo, OH, USA: https://www.toledoblade.com/a-e/2015/08/23/Explaining-Toledo-s-water-treatment-process/stories/20150823143. [Google Scholar]
- 50.Neilan BA, Jacobs D, Del Dot T, Blackall LL, Hawkins PR, Cox PT, Goodman AE. 1997. rRNA sequences and evolutionary relationships among toxic and nontoxic cyanobacteria of the genus Microcystis. Int J Syst Bacteriol 47:693–697. doi: 10.1099/00207713-47-3-693. [DOI] [PubMed] [Google Scholar]
- 51.Kurmayer R, Kutzenberger T. 2003. Application of real-time PCR for quantification of microcystin genotypes in a population of the toxic cyanobacterium Microcystis sp. Appl Environ Microbiol 69:6723–6730. doi: 10.1128/aem.69.11.6723-6730.2003. [DOI] [PMC free article] [PubMed] [Google Scholar]
Associated Data
This section collects any data citations, data availability statements, or supplementary materials included in this article.
Supplementary Materials
Data Availability Statement
The Microcystis viral contigs assembled from the metagenome reads were deposited in the National Center for Biotechnology Information (NCBI) GenBank Database under accession numbers MT840185 to MT840191. The raw metagenome data were deposited in the NCBI Sequence Read Archive (SRA) under BioProject accession number PRJNA638034.


