

Abstract
Non-small cell lung cancer (NSCLC) is characterized by genomic alterations, yet a targetable mutation has not been discovered in nearly half of all patients. Recent studies have identified amplification of RICTOR, an mTORC2-specific cofactor, as a novel actionable target in NSCLC. mTORC2 is one of two distinct mTOR complexes to sense environmental cues and regulate a variety of cellular processes including cell growth, proliferation, and metabolism, all of which promote tumorigenesis when aberrantly regulated. Interestingly, other components of mTORC2 are not co-amplified with RICTOR in human lung cancer, raising the question as to whether RICTOR amplification-induced changes are dependent on mTORC2 function. To model RICTOR amplification, we overexpressed Rictor using the Cas9 Synergistic Activator system. Overexpression of Rictor increased mTORC2 integrity and signaling, but at the expense of mTORC1, suggesting that overexpressed Rictor recruits common components away from mTORC1. Additionally, Rictor overexpression increases proliferation and growth of NSCLC 3D cultures and tumors in vivo. Conversely, knockout of RICTOR leads to decreased mTORC2 formation and activity, but increased mTORC1 function. Because Rictor has mTOR-dependent and independent functions, we also knocked out mLST8, a shared mTOR co-factor but is specifically required for mTORC2 function. Inducible loss of mLST8 in RICTOR-amplified NSCLC cells inhibited mTORC2 integrity and signaling, tumor cell proliferation, and tumor growth. Collectively, these data identify a mechanism for Rictor-driven tumor progression and provide further rationale for development of an mTORC2-specific inhibitor.
Keywords: Rictor, mTORC2, Lung Cancer
Introduction
Lung cancer is the leading cause of cancer-related deaths worldwide, despite significant advances in therapeutic options for these patients. Lung cancer is divided into two subtypes, non-small cell lung cancer (NSCLC) and small cell lung cancer (SCLC) which account for approximately 85% and 15% of cases, respectively. NSCLC is a disease typically characterized by its genomic alterations, although nearly half of all patients lack a known targetable alteration (1). Recent advances in tumor sequencing technologies have identified amplification of mTORC2-specific component RICTOR as potential targetable alteration in several types of cancer including non-small cell lung cancer (NSCLC), small cell lung cancer (SCLC), breast cancer, and gastric cancer (2–5).
The mechanistic target of Rapamycin (mTOR) is a serine/threonine kinase that acts in two distinct complexes, rapamycin-sensitive mTORC1 and rapamycin-insensitive mTORC2. Both complexes share the mTOR kinase and scaffolding protein mLST8, while mTORC1 contains scaffolding protein Raptor and mTORC2 contains Raptor-analogous scaffolding protein Rictor and regulatory component Sin1 (6, 7). Growth factors, amino acids, and cellular energy activate mTORC1 which has well-characterized functions including regulation of cell growth, protein translation, metabolism, and autophagy (6, 7). Although less well-understood, mTORC2 is activated by growth factors and the PI3K pathway, primarily through binding of PIP3 in the plasma membrane via the PH domain of co-factor Sin1 (8). Once localized to the membrane, mTORC2 can phosphorylate (S473) and activate its downstream effector AKT (9), also situated at the membrane. In addition to AKT, mTORC2 targets include PKCα and SGK (10, 11). mTORC2 and its downstream effectors act together to regulate cell proliferation, metabolism, and cytoskeletal organization (6, 7).
Aberrant signaling of both mTOR complexes has been implicated in many types of cancer, although most studies have focused on mTORC1. mTORC2’s role in cancer has also been reported- for example, mTORC2 is required for tumor formation in PTEN-null prostate cancer (12, 13) and drives tumor progression and resistance in HER2-positive breast cancer (3, 14). Additionally, the recent identification of RICTOR amplification as a potential actionable target in several cancer types suggests an additional subtype of cancer may rely on mTORC2 signaling for tumorigenesis (2–5). However, the mechanism by which amplification of a single scaffolding component within mTORC2 drives its oncogenic function remains unknown.
In this report, we investigate the roles of RICTOR amplification as a driver of mTORC2 formation and promoter of NSCLC tumor growth. Using the Cas9 synergistic activation mediator (SAM) system (15) to increase expression of Rictor or the CRISPR-Cas9 system to knock out Rictor, we show that alterations in Rictor lead to corresponding changes in not only mTORC2 formation, but also mTORC1. Further, overexpression of Rictor in NSCLC cells leads to increased growth of 3D cultures and in vivo tumor xenografts. We also found that RICTOR-amplified NSCLC is sensitive to loss of mLST8, an mTOR co-factor specifically required for mTORC2 function (13), both in vitro and in vivo. Collectively, these data show that Rictor promotes NSCLC through mTORC2 formation and could potentially be targeted with an mTORC2-specific inhibitor.
Materials and Methods
Cell lines and cell culture
H1975, H358, H23, and H1703 cells were obtained from ATCC and maintained in RPMI-1640 media containing 10 % fetal bovine serum (FBS) and 1% Penicillin/Streptomycin. BEAS-2B and H460 cells were obtained from the Vanderbilt-Ingram Cancer Center Core Facility and maintained in the same conditions. 293T cells were obtained from ATCC and maintained in DMEM containing 10% FBS. All cells were cultured in a humidified incubator with 5% CO2 at 37 °C. Cell lines were used between passages 1 and 50 after thaw. Cell lines from ATCC were authenticated using short tandem repeat profiling. Mycoplasma testing was performed every 6 months, most recently in November 2019, using the PlasmoTest kit (Invitrogen).
Plasmids and sgRNA sequences
CRISPR-Cas9 backbone vectors were obtained from Addgene and guide RNA sequences were cloned into the vector according to depositor’s instructions. Plasmids and guide RNA primers are listed in Table S1.
Lentivirus production and transduction
CRISPR SAM, knockout, and inducible Cas9 cell lines were established using the lentiviral delivery system. Briefly, lentiviruses were packaged in HEK293T cells by transfecting cells with CRISPR or expression plasmids together with psPAX2 (lentiviral packaging) and pCMV-VSV-G (envelope) plasmids at a 1:1:1 molar ratio using the Lipofectamine 2000 Reagent. Media was changed after 16hrs of transfection and virus was collected after 24–48hrs. Indicated cells were transduced with 1:1 virus and complete growth media with polybrene (8 μg/mL) for 24hr and selected with puromycin (1–2 μg/mL), blasticidin (10 μg/mL), or hygromycin (40–50 μg/ml) for at least 48hrs to establish stable cell lines before being used for experiments.
Xenograft Assay
2.5 × 10⁶ cells suspended in 100 uL of Matrigel and PBS (1:1) were injected into the hind flanks of 6-week old athymic nude (Foxn1nu; Envigo) or Rag1−/− C57BL/6J mice. For xenograft experiments using an inducible Cas9, doxycycline feed (Envigo #TD.00426) was given for 10 days. Tumor measurements were started 10 days after injection and measured for 30–60 days post injection. Tumors were measured every 2–3 days with digital calipers and tumor volume calculated according to the formula (V=4/3π(l/2)(h/2)(w/2)). Data are presented as mean ± SEM. Two-way ANOVA with Bonferroni’s Correction was used for statistical analysis. Experiments with mice were pre-approved by the Vanderbilt Institutional Animal Care and Use Committee and followed all state and federal rules and regulations.
Western Blot and Co-immunoprecipitation (Co-IP)
Cell lysates for western blotting only were collected in RIPA buffer. Tumor lysates were collected in Triton-X lysis buffer (1% Triton X-100, 0.5mM EDTA, 50mM Tris-Cl). All lysis buffers were supplemented with protease inhibitors and phosphatase inhibitors (Complete Mini and PhosStop inhibitor cocktail, Roche). Protein concentration was determined by Pierce BCA Protein Assay kit and equal amounts of protein extracts were mixed with 4x Laemmli sample buffer and separated by electrophoresis on an SDS-PAGE gel, and then transferred onto nitrocellulose membranes. Membranes were blocked with 5% milk in TBST buffer and incubated with corresponding primary antibodies and IRdye-conjugated or HRP-conjugated secondary antibodies. Immunoreactivity was detected using the Odyssey scanner (Li-cor Biosciences) or enhanced chemiluminescence. To perform immunoprecipitation, equal amounts of input lysates (500 ug) collected in CHAPS buffer (40 mM Tris, pH 7.5, 120 mM NaCl, 1 mM EDTA, 0.3% CHAPS), were incubated with the primary antibodies (1–2 μg) for 2 hrs to overnight at 4°C. Protein G Dynabeads (Thermo Fisher Scientific #10–003-D) were added and lysates were incubated for 1 hr and washed four times with CHAPS lysis buffer. Immunoprecipitate and whole cell lysates were then subjected to western blot analysis. All antibodies are listed in Table S2. Quantification of western blots was performed using ImageJ software.
Proximity Ligation Assay
Cells cultured on glass coverslips were fixed with 4% PFA, permeabilized with 1% Triton-X 100 in PBS, and stained with the Duolink (Sigma-Aldrich #92102) proximity ligation assay according to the manufacturer’s protocol using antibodies listed in Table S2 and counterstained and mounted with DAPI (Thermo Scientific #P36941). PLA puncta and DAPI-stained nuclei were enumerated using ImageJ software.
Cell Growth Assays
Cell growth was measured by MTT, colony formation, and BrdU assays. For MTT assays, 2000 cells were plated into each well of a 96-well plate in 100uL of complete growth medium. Cell viability was measured by incubating cells with 20uL of 5ug/mL Tetrazolium salt 3-(4,5-dimethylthiazol-2-yL)-2,5-diphenyltetrazolium bromide (MTT, Sigma-Aldrich) and quantified by reading absorbance at 590nm after resuspending in MTT solvent. For colony formation assay, 500 cells were plated in complete growth medium in each well of a 12-well plate. Cells were grown for 10–14 days and the media was changed every 3 days. Colonies were stained with 0.5% crystal violet in methanol and colony area was quantified. For the BrdU assay, cells were grown on glass coverslips for 24 hrs, then incubated with BrdU (10 ng/ml) for 30 min. Cells were fixed in 4% paraformaldehyde for 15 min, then permeabilized with 1% Triton X-100 in PBS for 5 min. DNA was denatured by incubation with 2N HCl for 30 min at 37 deg C, followed by rinsing in PBS. Cells were blocked for 1 hr using 2.5% goat serum in PBS, then probed with Alexa 647-conjugated anti-BrdU antibody (1:50, Invitrogen) overnight at 4 deg C. Coverslips were mounted onto slides using ProLong Gold antifade reagent with DAPI (Thermo Scientific #P36941). 40x images were quantified by counting BrdU-positive nuclei/total nuclei using ImageJ software.
3D Cultures
60uL of Matrigel (Corning #354230) was added to each well of an 8-well chamber slide (Thermo Scientific) and incubated at 37°C to solidify. 5000 cells were suspended in 400μL of complete media with 2.5% Matrigel and 5ng/mL of EGF, then added to the chamber slides. Cultures were monitored for 20 days and media was replaced every 4 days. Area of cultures was quantified using ImageJ software.
Immunohistochemistry Staining
Xenograft tumor sections were paraffin embedded and sectioned. Rehydrated paraffin sections were subjected to antigen retrieval (Retrievagen A, BD Pharmingen) and endogenous peroxidases were blocked by 3% H202 for 30min. Sections were blocked in 2.5% goat serum in PBS and stained with primary antibody and biotinylated secondary antibody, followed by avidin-peroxidase reagent and DAB. Antibodies are listed in Table S2. Sections were then counterstained with hematoxylin and mounted with Cytoseal-XYL (Thermo Scientific Richard-Allan Scientific).
TCGA Data Analysis
Alteration frequency and copy number segmentation plots and analysis were generated using the online platform cbioportal.org. Proportion of copy number gain/loss was analyzed using the GenVisR package(16).
Results
RICTOR is amplified and overexpressed in non-small cell lung cancer
Amplification of RICTOR has been identified in several different types of cancer including breast, gastric, small cell lung cancer, and non-small cell lung cancer (NSCLC) (2–5). Analysis of the TCGA PanCancer Atlas identified RICTOR amplification in 12% of total NSCLC cases, and 15% of squamous cell carcinoma and 11% of adenocarcinoma cases, with amplification being the most frequent alteration of RICTOR (Figure 1A). RICTOR is located on the 5p chromosome, a site of frequent copy number gain in NSCLC (17). In addition to the overall 5p gain, copy number segment and GISTIC analysis reveals a focal amplification of the chromosomal locus surrounding the RICTOR gene (Supplemental Figure 1A&B). Interestingly, no other components of the mTOR complexes were co-altered with RICTOR amplification (Figure 1B). Further analysis of adenocarcinoma cases, which accounts for the majority of NSCLC cases, showed a positive correlation between copy-number and mRNA expression of RICTOR, suggesting amplification does indeed lead to an increase in Rictor expression in NSCLC cases (Figure 1C).
Figure 1. CRISPR Synergistic Activation Mediator (SAM) system can be used to model RICTOR amplification in NSCLC.
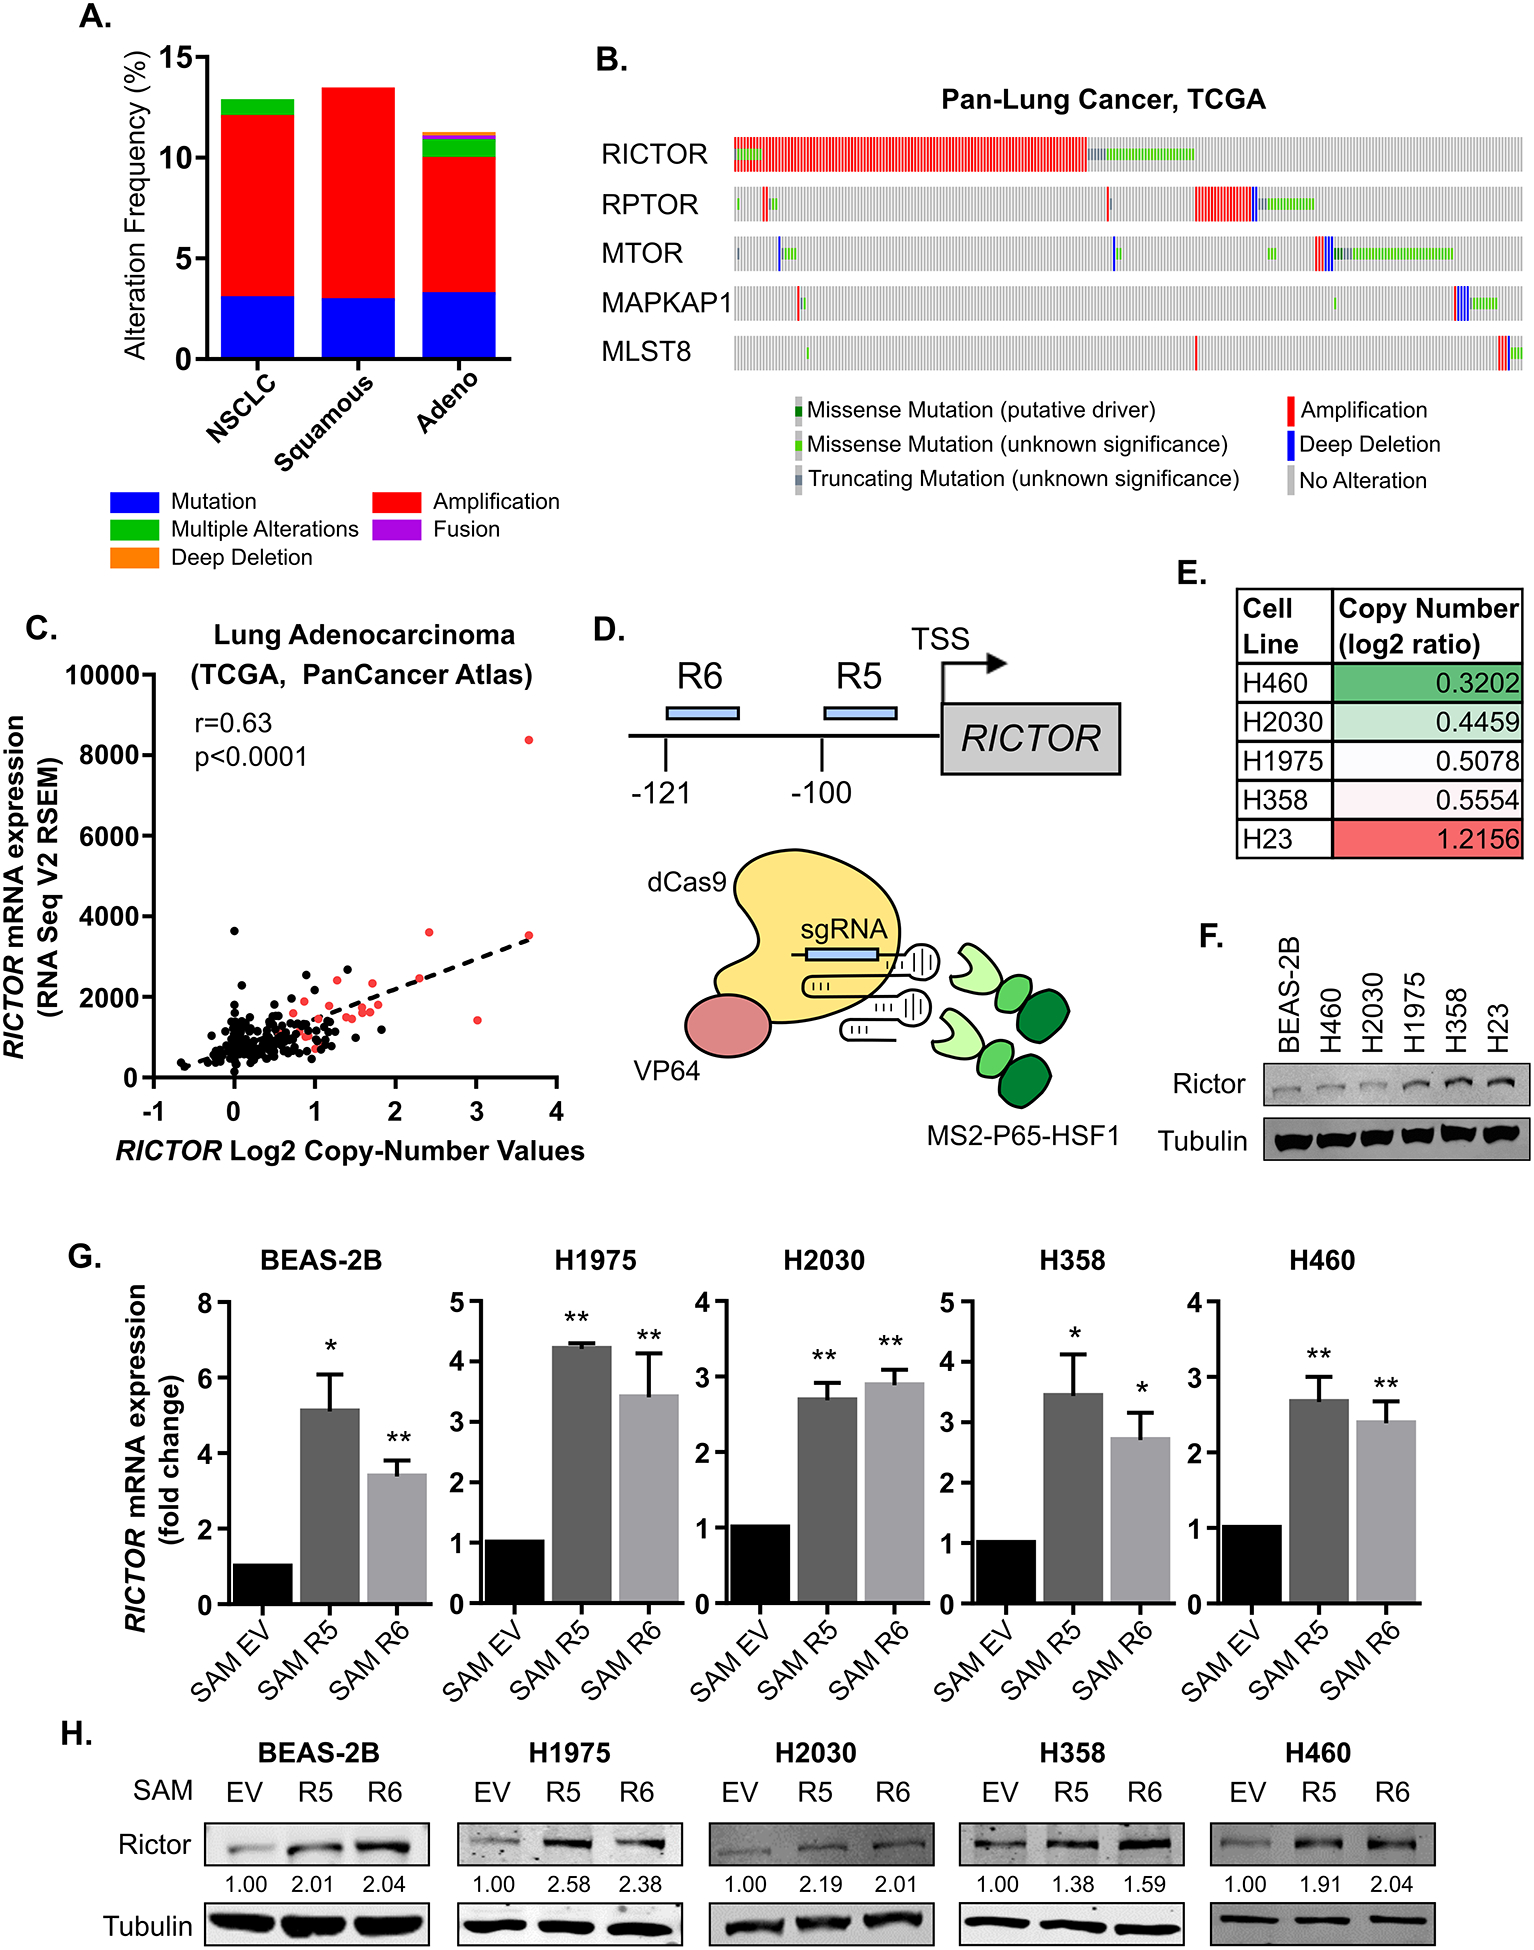
(A-C) Patient data from the TCGA Pan-Lung Cancer Atlas were analyzed using the online platform at cbioportal.org. (A) Alteration frequencies of RICTOR in non-small cell lung cancer, squamous cell carcinoma, and adenocarcinoma. (B) Alterations in mTOR complex components in patient-matched samples. (C) Correlation of RICTOR mRNA levels with copy number values in Lung Adenocarcinoma. Red, amplified samples based on GISTIC scoring. (D-H) CRISPR SAM (15) was used to target the promoter region of Rictor 100 bp (R5) and 121 bp (R6) upstream of the transcription start site (TSS). (D) in a panel of immortalized lung epithelium and NSCLC cell lines. (E) RICTOR copy number values of utilized cell lines according to CCLE database. (F) Western blot analysis of Rictor protein levels in parental cell lines. mRNA relative to Actin (G) and protein levels of Rictor (H) were measured by qRT-PCR or Western blotting, respectively. Quantification of Rictor expression normalized to tubulin is indicated in numbers below the blots. EV: empty vector
In order to examine how amplification of a single mTOR complex component might drive tumorigenesis, we used the Cas9 Synergistic Activation Mediator Complex system (SAM) to upregulate expression of RICTOR (15). This system utilizes an enzymatically inactive Cas9 (dCas9) fused to VP64, co-expressed with MS2-P65-HSF1 activation helper proteins. A small guide RNA (sgRNA) with two MS2 aptamers targeting the promoter region of the gene of interest is also expressed, such that all components of the system co-localize and activate transcription of the targeted gene. Multiple sgRNAs targeting the promoter region of RICTOR (Figure 1D) were tested in a panel of non-tumorigenic, immortalized lung epithelial (BEAS-2B) and NSCLC (H1975, H358, H460, H2030) cell lines, all of which have lower copy number values compared to the H23 cell line (Figure 1E), a NSCLC cell with a verified amplification of RICTOR (2). Western blot analysis of these cell lines at baseline demonstrated Rictor protein levels that largely correlate with copy number values (Figure 1F). In all lines, SAM Rictor cells exhibited increased mRNA (Figure 1G) and protein (Figure 1H) levels of Rictor compared to SAM empty vector (EV) control cells. Across all cell lines analyzed, RICTOR mRNA was upregulated approximately 2 to 4-fold with the CRISPR SAM system (Figure 1G). Analysis of mRNA expression in RICTOR-amplified samples compared to diploid samples of TCGA Lung Adenocarcinoma samples (Figure 1C) showed an approximately ~2.25-fold increase in Rictor expression. This correlates well with the expression changes in Rictor when using the CRISPR SAM system in Figure 1G, suggesting that SAM-induced Rictor expression is comparable to endogenous Rictor levels in human lung cancer patients.
Alterations in Rictor expression lead to corresponding changes in mTORC2 and mTORC1
We hypothesized that amplification of RICTOR could promote tumorigenesis by driving formation of mTORC2. To test this hypothesis, we used the proximity ligation assay (PLA) to quantitate the interactions between mTOR and either Rictor (mTORC2) or Raptor (mTORC1). The same rabbit antibody against mTOR was used in all PLA experiments, while mouse anti-Rictor or anti-Raptor were used to differentiate between the two complexes (Table S2). Compared to SAM EV cells, SAM Rictor cells exhibited increased fluorescent foci indicating an increase in mTOR-Rictor interactions (Figure 2A), thereby suggesting an increase in the formation of mTORC2. In contrast, mTOR-Raptor interactions were decreased in Rictor-overexpressing cells, consistent with a previous report showing an increase in mTOR-Rictor precipitation when mTORC1 was inhibited (18). To complement the PLA studies, we also immunoprecipitated for mTOR and found that Rictor and Sin1 binding to mTOR was increased in SAM Rictor cells compared to control, while binding of Raptor to mTOR was reduced (Figure 2B). Furthermore, this Rictor-driven increase in mTORC2 formation increased downstream phosphorylation of AKT (S473) in Rictor overexpressing cells compared to control (Figure 2C), suggesting the increased mTORC2 was indeed functional.
Figure 2. Rictor alterations promote corresponding changes in mTORC2 and mTORC1.

(A) Proximity Ligation Assays (PLA) were used to assess mTOR-Rictor or mTOR-Raptor interactions in SAM Rictor or EV H1975 cells. Data presented as Mean ± S.D. (B) Interactions among components of mTOR complexes were measured by co-immunoprecipitation followed by western blot analysis in SAM Rictor overexpressing or EV control H1975 cells with the indicated antibodies. Densitometry quantifications of the co-IP relative to mTOR pulldown are displayed below as a fold change compared to SAM EV cells (n=3). (C&D) SAM Rictor or SAM EV control H1975 or H358 whole cell lysates were assessed by western blot analysis using the indicated antibodies. Quantification of phospho/total AKT or S6K1 normalized to tubulin is plotted below. (C) Cells were serum starved overnight then stimulated with serum for 15 minutes. (D) Cells were starved of glutamine overnight followed by stimulation with 4mM glutamine for 3 hrs. (E) PLAs were used to assess mTOR-Rictor or mTOR-Raptor interactions in sgLacZ control or sgRictor knockout H23 cells. Data presented as Mean ± S.D. (F) Interactions among components of mTOR complexes were measured by co-immunoprecipitation followed by western blot analysis in H23 sgRictor knockout or sgLacZ control cells with the indicated antibodies. Densitometry quantifications of the co-IP relative to mTOR pulldown are displayed below as a fold change compared to SAM EV cells (n=2). (G&H) sgLacZ control or sgRictor knockout H23 whole cell lysates were assessed by western blot analysis using the indicated antibodies. Quantification of phospho/total AKT or S6RP normalized to tubulin is plotted below. (G) Cells were serum starved overnight followed by stimulation with serum for 15 minutes. (H) Cells were starved of glutamine overnight followed by stimulated with 4mM glutamine for 3 hrs. * = p<0.05; **** = p<0.0001
In order to assess the effect of Rictor overexpression on mTORC1 activity while excluding the effects of crosstalk between the mTOR complexes, we stimulated SAM Rictor or EV cells with glutamine, a known activator of mTORC1, but not mTORC2 (19). SAM Rictor cells showed a reduction in phosphorylation of S6K1, a direct substrate of mTORC1, compared to SAM EV cells in response to glutamine stimulation (Figure 2D), confirming a reduction in mTORC1 activity caused by a loss of mTORC1 upon Rictor overexpression. These data suggest amplification of Rictor in NSCLC promotes formation and activity of mTORC2 at the expense of mTORC1.
To complement overexpression experiments, we used CRISPR-Cas9 mediated genome editing (20–22) to target RICTOR for loss-of-function in H23 cells, a cell line with verified RICTOR amplification (Figure 1E) (2). Rictor-deficient H23 cells showed a reduction in mTOR-Rictor interactions and an increase in mTOR-Raptor interactions compared to sgLacZ control cells when assessed by PLA (Figure 2E). Additionally, immunoprecipitation of mTOR in sgRictor cells showed a loss of Rictor and Sin1 binding to mTOR while Raptor binding was increased (Figure 2F). As expected with a loss of mTORC2, phosphorylation of AKT (S473) was reduced in H23 sgRictor compared to sgLacZ control cells in response to serum stimulation (Figure 2G). Glutamine stimulation, however, increased the levels of p-S6RP (S235/236) in Rictor deficient cells (Figure 2H), suggesting mTORC1 activity was increased. Together, these results demonstrate that changes in cellular Rictor alter the amount of mTORC2, consequently increasing or decreasing the amount of mTORC1 in the opposite direction.
Rictor promotes proliferation of NSCLC cells
mTORC2 is a known regulator of cell proliferation and promoter of tumorigenesis (6, 7). However, we found that Rictor overexpression did not alter cell number when grown in 2D (data not shown). To determine if Rictor-driven mTORC2 provides a growth advantage to NSCLC cells, control or Rictor overexpressing H1975 or H358 cells were grown as Matrigel-embedded 3D cultures for 20 days. Imaging of cultures on the final day showed the area of SAM Rictor cultures was significantly larger than SAM EV cultures (Figure 3A), suggesting that Rictor overexpression promotes growth of NSCLC.
Figure 3. Rictor promotes NSCLC proliferation and tumor growth.

(A) SAM Rictor or EV H1975 or H358 cells were grown as Matrigel-embedded 3D cultures supplemented with 5ng/mL of EGF. Representative images of cultures after 20 days are shown. Each point indicates an individual colony, with mean and SD denoted. (B) Relative number of viable sgLacZ control and sgRictor H23 knockout cells was assessed by MTT assay. (C) Proliferation of sgLacZ control and sgRictor knockout H23 cells was measured by BrdU uptake. Representative images are shown. Data presented as mean ± S.D. (D-G) 2.5×10⁶ SAM Rictor #5 or EV control H1975 cells were injected subcutaneously into the hind flanks of Rag1-null immunodeficient mice. Tumor volume (D) and tumor mass (E) were measured. Data presented as mean ± SEM (n=9/group). (F) Tumor lysates from 3 individual tumors per group were analyzed by western blotting using the indicated antibodies. (G) Proliferation of tumors was assessed by immunohistochemical staining of Ki-67. Representative images are shown, and quantification is presented as mean ± SEM. *, p<0.05; **, p<0.01; ****, p<0.0001
Conversely, loss of Rictor in H23 RICTOR-amplified cells significantly reduced the number of viable cells compared to control when measured by MTT assay (Figure 3B). The reduction in cell number of Rictor-deficient cells was due to an inhibition of cell proliferation, as judged by BrdU incorporation (Figure 3C). These results are consistent with the possibility that Rictor-driven mTORC2 formation promotes cell proliferation of NSCLC tumor cells.
Increased Rictor expression promotes NSCLC tumor growth in vivo
Next, we investigated whether the growth advantage conferred by Rictor overexpression would result in faster growing tumors in vivo. SAM Rictor #5 or EV control H1975 cells were injected into the hind flanks of Rag1-null immunodeficient mice and tumor growth was monitored for approximately 1 month. Rictor overexpression significantly increased tumor volume compared to control in the xenograft model (Figure 3D). Tumors were harvested and weighed upon removal. The mass of SAM Rictor tumors was significantly larger than control tumors (Figure 3E). Western blot analysis of tumor lysates showed that SAM R5 tumors retained the increased expression of Rictor throughout the course of tumor development and exhibited increased levels of p-AKT, a readout of mTORC2 activity (Figure 3F). Furthermore, SAM RICTOR tumors had an increase in Ki-67 staining (Figure 3G), consistent with studies showing mTORC2 activity drives cell proliferation.
Targeting mTORC2 for loss-of-function inhibits tumor growth of RICTOR-amplified NSCLC
Increased proliferation of Rictor overexpressing tumors suggested that mTORC2 inhibition might be beneficial for treatment of RICTOR-amplified tumors. However, an mTORC2 specific small molecule is not currently available. A previous study from our lab identified mLST8, a co-factor associated with both complexes, to be selectively required for mTORC2 integrity and function, but not mTORC1 (13), thus targeting of mLST8 could be used to specifically inhibit mTORC2. As shown in Figure 4A, CRISPR-Cas9 mediated targeting of mLST8 in H23 cells inhibited co-immunoprecipitation of mTORC2 specific components Rictor and Sin1 with the mTOR kinase, while Raptor co-immunoprecipitation increased (Figure 4A). Western blot analysis of downstream signaling also confirmed that p-AKT was decreased upon mLST8 knockout (Figure 4A). Consistent with Rictor knockout in Figure 3, mLST8 knockout also reduced the relative number of viable cells and inhibited cell proliferation as measured by MTT assays and BrdU uptake assays, respectively (Figure 4B&C).
Figure 4. mLST8 loss-of-function inhibits growth of RICTOR-amplified tumors in vivo.

(A-C) sgControl or sgMLST8 knockout H23 cells were generated by CRISPR-mediated gene editing. (A) Interactions among components of mTOR complexes were measured by co-immunoprecipitation followed by western blot analysis with the indicated antibodies. WCL, whole cell lysate. (B) Relative number of viable cells was measured by MTT assay. (C) Proliferation was measured by BrdU uptake assay. Representative images are shown. Data presented as mean ± SEM. (D-I) H23 cells were generated to express a doxycycline-inducible Cas9 and either sgLacZ or sgMLST8 #2. (D) Western blot analysis of cells treated with doxycycline (1μg/mL). Number of dox treatments over 10 days is indicated. (E) Colony formation assay of 2000 cells treated with doxycycline for 72 hours, then cultured for 2 weeks. Data presented as mean ± SEM. (F-I) 5×10⁶cells were implanted in the hind flanks of athymic nude mice that were fed doxycycline food for 10 days. (F) Tumor volume was monitored 3 times a week. Data presented as mean ± SEM. (G) Tumor mass was measured after tumors were removed 5 weeks after implantation. Data presented as mean ± SEM. (H) Western blot analysis of mLST8 expression in 3 pairs of tumor lysates (M1-M3). M1, mouse #1. (I) Tumor sections were analyzed by immunohistochemistry for proliferation by Ki-67. *, p<0.05 **, p<0.01
To achieve equal cell numbers between WT and mLST8 cells for implantation in vivo, we utilized a doxycycline inducible Cas9 system co-expressed with a sgRNA targeting mLST8 (23). In vitro experiments showed that a single dose of doxycycline was enough to induce Cas9-mediated LOF of mLST8, although continuous treatment was required for sustained expression of Cas9 (Figure 4D). Inducible knockout of mLST8 in H23 resulted in a reduction in colony formation after a single dose of doxycycline in sgMLST8 cells compared to sgLacZ (Figure 4E).
For xenograft studies, H23 cells expressing a doxycycline inducible Cas9 and either sgLacZ control or sgMLST8 were injected into the hind flanks of athymic nude mice. Doxycycline was given for 10 days to induce Cas9 expression and mLST8 LOF and tumor growth was measured every 2–4 days for 2 months. At the end of the study, tumors were removed, weighed, and subjected to further analysis by immunohistochemistry. Tumor volume and weight of sgMLST8 tumors were significantly reduced compared to sgLacZ (Figure 4F&G). Western blot analysis of tumor lysates showed sustained reduction of mLST8 to varying degrees in tumors expressing sgMLST8 (Figure 4H). Additionally, immunohistochemistry staining of Ki-67 was reduced in sgMLST8 tumors compared to sgLacZ tumors (Figure 4I), recapitulating the in vitro results of loss of cell proliferation caused by inhibition of mTORC2 activity.
Discussion
Amplification of RICTOR has been identified as an actionable target in NSCLC, yet no other mTORC2 component is co-amplified with RICTOR in human lung cancer datasets (Figure 1). Because Rictor was shown to have mTOR-independent functions (24), the mechanism by which amplification of RICTOR could drive oncogenesis has not been clearly defined. We hypothesized that overexpression of Rictor would suppress Raptor-mTOR interactions and increase Rictor-mTOR interactions, driving activity of mTORC2, a known activator of AKT and cell proliferation. Here we show that overexpression of Rictor in NSCLC increases the amount of mTORC2 at the expense of mTORC1, thereby increasing mTORC2 downstream signaling and facilitating tumor cell proliferation.
Aberrant mTORC2 signaling has been identified as an important mediator of tumorigenesis in the context of other cancer-causing mutations such as loss of PTEN or activation of PI3K (12, 25). Amplification of RICTOR in NSCLC also co-occurs with common oncogenic driver mutations including KRAS and EGFR (26). In this study, we performed all experiments with both KRAS (H358 and H23) and EGFR (H1975) mutant cell lines. In H358 or H1975 cells harboring these mutations, overexpression of Rictor increased 3D culture growth, yet 3D cultures of immortalized, non-tumorigenic lung epithelial cells (BEAS2B) were unchanged in response to overexpression of Rictor (data not shown). Conversely, in H23 RICTOR-amplified and KRAS mutant NSCLC, loss of mTORC2 inhibited tumor growth, suggesting that mTORC2 activity can promote tumor cell proliferation but may not be sufficient to cause cellular transformation on its own. In addition to proliferation, mTORC2 has known roles in regulation of metabolism and cytoskeletal organization. Additional studies focused on understanding the impact of RICTOR amplification on these other aspects of tumor biology are warranted.
Our study shows that increased mTORC2 formation occurs at the expense of mTORC1 formation, a finding that seems counter to the large body of work demonstrating the importance of mTORC1 in promoting tumor growth. It is important to note that the increased proliferative effect of Rictor overexpression was observed in 3D culture experiments, a condition that more closely mimics the nutrient gradients present in the in vivo tumor microenvironment. A recent study has suggested mTORC1 may inhibit tumor growth in nutrient starved conditions, offering a potential explanation to how reduced mTORC1 could still promote tumor growth (27). Thus, further investigation of nutrient availability in 3D or in vivo tumor settings is required to better understand how mTORC2 upregulation impacts tumor cell proliferation.
RICTOR is located on the p arm of chromosome 5 (5p13.1), a common site of copy number gain in lung cancer and other diseases (17). Recent studies, including our own analysis, show that in addition to this overall copy number gain, the loci surrounding the RICTOR gene is a site of focal amplification [Supplemental Figure 1, (26)]. Amplification of RICTOR often co-occurs with amplification or copy number gain of several other genes along the 5p chromosome, including SKP2 and GOLPH3, both of which have been implicated in cancer progression and modulating the PI3K-mTOR-AKT signaling axis (28–30). Other co-amplified genes with known tumorigenic properties include OSMR and LIFR, also located at the 5p13.1 cytoband (31–33). While we were able to show that overexpression of Rictor alone was able to increase the proliferative capacity of lung cancer cell lines, further studies exploring the interaction between RICTOR and its co-altered genes in cancer are necessary to fully understand the oncogenic effects of amplification occurring at the 5p chromosome.
The identification of Rictor overexpression as a driver of mTORC2 formation and tumor progression suggests that specific inhibition of mTORC2 would be a logical therapeutic strategy for patients with RICTOR-amplified cancers. However, only mTORC1-specific inhibitors (rapamycin analogs) or mTOR kinase inhibitors that block the activity of both complexes are available (34). Our data suggests that increased mTORC2 formation can reduce the levels of mTORC1, thus inhibition of both mTOR complexes may not be necessary for treatment of RICTOR-amplified cancers. Additionally, inhibition of mTORC1 releases a negative feedback loop on PI3K/AKT signaling (35, 36), which could potentially lead to an unwanted upregulation of mTORC2 signaling. In our study, we target mLST8 to specifically inhibit mTORC2 and show that tumor growth of RICTOR-amplified H23 NSCLC cells is reduced, suggesting inhibition of the mTOR-mLST8 interaction (13) may be an efficacious way to specifically inhibit mTORC2 and treat RICTOR-amplified NSCLC.
Supplementary Material
Implications:
RICTOR amplification drives NSCLC proliferation through formation of mTORC2, suggesting mTORC2-specific inhibition could be a beneficial therapeutic option.
Acknowledgements
We would like to acknowledge the Vanderbilt University Medical Center Translational Pathology Share Resource for their help with immunohistochemistry experiments. This work was supported by a VA Merit Award 5101BX000134 and a VA Research Career Scientist Award (J.C.), NIH grants R01 CA177681 (J.C.), R01 CA95004 (J.C.), T32 CA009592 (L.C.K.), and F31 CA2220804-01 (L.C.K.)
Footnotes
The authors declare that they have no conflicts of interest with the contents of this article.
References
- 1.Pao W, and Girard N (2011) New driver mutations in non-small-cell lung cancer. Lancet Oncol. 12, 175–80 [DOI] [PubMed] [Google Scholar]
- 2.Cheng H, Zou Y, Ross JS, Wang K, Liu X, Halmos B, Ali SM, Liu H, Verma A, Montagna C, Chachoua A, Goel S, Schwartz EL, Zhu C, Shan J, Yu Y, Gritsman K, Yelensky R, Lipson D, Otto G, Hawryluk M, Stephens PJ, Miller VA, Piperdi B, and Perez-Soler R (2015) RICTOR Amplification Defines a Novel Subset of Patients with Lung Cancer Who May Benefit from Treatment with mTORC1/2 Inhibitors. Cancer Discov. 5, 1262–70 [DOI] [PMC free article] [PubMed] [Google Scholar]
- 3.Morrison-Joly M, Hicks DJ, Jones B, Sanchez V, Estrada MV, Young C, Williams M, Rexer BN, Sarbassov DD, Muller WJ, Brantley-Sieders D, Cook RS, Joly MM, Hicks DJ, Jones B, Sanchez V, Estrada MV, Young C, Williams M, Rexer BN, Sarbassov DD, Muller WJ, Brantley-Sieders D, and Cook RS (2016) Rictor/mTORC2 drives progression and therapeutic resistance of HER2-amplified breast cancers. Cancer Res. 76, 0008–5472.CAN-15–3393- [DOI] [PMC free article] [PubMed] [Google Scholar]
- 4.Sakre N, Wildey G, Behtaj M, Kresak A, Yang M, Fu P, and Dowlati A (2017) RICTOR amplification identifies a subgroup in small cell lung cancer and predicts response to drugs targeting mTOR. Oncotarget. 8, 5992–6002 [DOI] [PMC free article] [PubMed] [Google Scholar]
- 5.Kim ST, Kim SY, Klempner SJ, Yoon J, Kim N, Ahn S, Bang H, Kim K-M, Park W, Park SH, Park JO, Park YS, Lim HY, Lee SH, Park K, Kang WK, and Lee J (2016) Rapamycin-insensitive companion of mTOR (RICTOR) Amplification Defines a Subset of Advanced Gastric Cancer and is Sensitive to AZD2014-mediated mTORC1/2 Inhibition. Ann. Oncol 28, mdw669. [DOI] [PubMed] [Google Scholar]
- 6.Kim LC, Cook RS, and Chen J (2017) MTORC1 and mTORC2 in cancer and the tumor microenvironment. Oncogene. 36, 2191–2201 [DOI] [PMC free article] [PubMed] [Google Scholar]
- 7.Saxton RA, and Sabatini DM (2017) mTOR Signaling in Growth, Metabolism, and Disease. Cell. 168, 960–976 [DOI] [PMC free article] [PubMed] [Google Scholar]
- 8.Liu P, Gan W, Chin YR, Ogura K, Guo J, Zhang J, Wang B, Blenis J, Cantley LC, Toker A, Su B, and Wei W (2015) PtdIns(3,4,5)P3-Dependent Activation of the mTORC2 Kinase Complex. Cancer Discov. 10.1158/2159–8290.CD-15–0460 [DOI] [PMC free article] [PubMed] [Google Scholar]
- 9.Sarbassov DD, Guertin DA, Ali SM, and Sabatini DM (2005) Phosphorylation and regulation of Akt/PKB by the rictor-mTOR complex. Science. 307, 1098–101 [DOI] [PubMed] [Google Scholar]
- 10.Jacinto E, Loewith R, Schmidt A, Lin S, Rüegg MA, Hall A, and Hall MN (2004) Mammalian TOR complex 2 controls the actin cytoskeleton and is rapamycin insensitive. Nat. Cell Biol 6, 1122–8 [DOI] [PubMed] [Google Scholar]
- 11.García-Martínez JM, and Alessi DR (2008) mTOR complex 2 (mTORC2) controls hydrophobic motif phosphorylation and activation of serum- and glucocorticoid-induced protein kinase 1 (SGK1). Biochem. J 416, 375–85 [DOI] [PubMed] [Google Scholar]
- 12.Guertin DA, Stevens DM, Saitoh M, Kinkel S, Crosby K, Sheen J-H, Mullholland DJ, Magnuson MA, Wu H, and Sabatini DM (2009) mTOR complex 2 is required for the development of prostate cancer induced by Pten loss in mice. Cancer Cell. 15, 148–59 [DOI] [PMC free article] [PubMed] [Google Scholar]
- 13.Hwang Y, Kim LC, Song W, Edwards DN, Cook RS, and Chen J (2019) Disruption of the Scaffolding Function of mLST8 Selectively Inhibits mTORC2 Assembly and Function and Suppresses mTORC2-Dependent Tumor Growth In Vivo. Cancer Res. 79, 3178–3184 [DOI] [PMC free article] [PubMed] [Google Scholar]
- 14.Werfel TA, Wang S, Jackson MA, Kavanaugh TE, Joly MM, Lee LH, Hicks DJ, Sanchez V, Ericsson PG, Kilchrist KV, Dimobi SC, Sarett SM, Brantley-Sieders DM, Cook RS, and Duvall CL (2018) Selective mTORC2 Inhibitor Therapeutically Blocks Breast Cancer Cell Growth and Survival. Cancer Res. 78, 1845–1858 [DOI] [PMC free article] [PubMed] [Google Scholar]
- 15.Konermann S, Brigham MD, Trevino AE, Joung J, Abudayyeh OO, Barcena C, Hsu PD, Habib N, Gootenberg JS, Nishimasu H, Nureki O, and Zhang F (2015) Genome-scale transcriptional activation by an engineered CRISPR-Cas9 complex. Nature. 517, 583–588 [DOI] [PMC free article] [PubMed] [Google Scholar]
- 16.Skidmore ZL, Wagner AH, Lesurf R, Campbell KM, Kunisaki J, Griffith OL, and Griffith M (2016) GenVisR: Genomic Visualizations in R. Bioinformatics. 32, 3012–3014 [DOI] [PMC free article] [PubMed] [Google Scholar]
- 17.Garnis C, Davies JJ, Buys TPH, Tsao M-S, MacAulay C, Lam S, and Lam WL (2005) Chromosome 5p aberrations are early events in lung cancer: implication of glial cell line-derived neurotrophic factor in disease progression. Oncogene. 24, 4806–4812 [DOI] [PubMed] [Google Scholar]
- 18.Sarbassov DD, Ali SM, Kim D-H, Guertin DA, Latek RR, Erdjument-Bromage H, Tempst P, Sabatini DM, Dos D Sarbassov, Ali SM, Kim D-H, Guertin DA, Latek RR, Erdjument-Bromage H, Tempst P, and Sabatini DM (2004) Rictor, a novel binding partner of mTOR, defines a rapamycin-insensitive and raptor-independent pathway that regulates the cytoskeleton. Curr. Biol 14, 1296–302 [DOI] [PubMed] [Google Scholar]
- 19.Tan HWS, Sim AYL, and Long YC (2017) Glutamine metabolism regulates autophagy-dependent mTORC1 reactivation during amino acid starvation. Nat. Commun 8, 338. [DOI] [PMC free article] [PubMed] [Google Scholar]
- 20.Platt RJ, Chen S, Zhou Y, Yim MJ, Swiech L, Kempton HR, Dahlman JE, Parnas O, Eisenhaure TM, Jovanovic M, Graham DB, Jhunjhunwala S, Heidenreich M, Xavier RJ, Langer R, Anderson DG, Hacohen N, Regev A, Feng G, Sharp PA, and Zhang F (2014) CRISPR-Cas9 Knockin Mice for Genome Editing and Cancer Modeling. Cell. 159, 440–455 [DOI] [PMC free article] [PubMed] [Google Scholar]
- 21.Sanjana NE, Shalem O, and Zhang F (2014) Improved vectors and genome-wide libraries for CRISPR screening. Nat. Methods 11, 783–784 [DOI] [PMC free article] [PubMed] [Google Scholar]
- 22.Joung J, Konermann S, Gootenberg JS, Abudayyeh OO, Platt RJ, Brigham MD, Sanjana NE, and Zhang F (2017) Genome-scale CRISPR-Cas9 knockout and transcriptional activation screening. Nat. Protoc 12, 828–863 [DOI] [PMC free article] [PubMed] [Google Scholar]
- 23.Barger C, Branick C, Chee L, and Karpf A (2019) Pan-Cancer Analyses Reveal Genomic Features of FOXM1 Overexpression in Cancer. Cancers (Basel). 11, 251. [DOI] [PMC free article] [PubMed] [Google Scholar]
- 24.McDonald PC, Oloumi A, Mills J, Dobreva I, Maidan M, Gray V, Wederell ED, Bally MB, Foster LJ, and Dedhar S (2008) Rictor and Integrin-Linked Kinase Interact and Regulate Akt Phosphorylation and Cancer Cell Survival. Cancer Res. 68, 1618–1624 [DOI] [PubMed] [Google Scholar]
- 25.Janku F, Yap TA, and Meric-Bernstam F (2018) Targeting the PI3K pathway in cancer: are we making headway? Nat. Rev. Clin. Oncol 15, 273–291 [DOI] [PubMed] [Google Scholar]
- 26.Cheng H, Zou Y, Ross JS, Wang K, Liu X, Halmos B, Ali SM, Liu H, Verma A, Montagna C, Chachoua A, Goel S, Schwartz EL, Zhu C, Shan J, Yu Y, Gritsman K, Yelensky R, Lipson D, Otto G, Hawryluk M, Stephens PJ, Miller VA, Piperdi B, and Perez-Soler R (2015) RICTOR amplification defines a novel subset of lung cancer patients who may benefit from treatment with mTOR1/2 inhibitors. Cancer Discov. 10.1158/2159–8290.CD-14–0971 [DOI] [PMC free article] [PubMed] [Google Scholar]
- 27.Palm W, Park Y, Wright K, Pavlova NN, Tuveson DA, and Thompson CB (2015) The Utilization of Extracellular Proteins as Nutrients Is Suppressed by mTORC1. Cell. 162, 259–70 [DOI] [PMC free article] [PubMed] [Google Scholar]
- 28.Yokoi S, Yasui K, Mori M, Iizasa T, Fujisawa T, and Inazawa J (2004) Amplification and Overexpression of SKP2 Are Associated with Metastasis of Non-Small-Cell Lung Cancers to Lymph Nodes. Am. J. Pathol 165, 175–180 [DOI] [PMC free article] [PubMed] [Google Scholar]
- 29.Clement E, Inuzuka H, Nihira NT, Wei W, and Toker A (2018) Skp2-dependent reactivation of AKT drives resistance to PI3K inhibitors. Sci. Signal 11, eaao3810. [DOI] [PMC free article] [PubMed] [Google Scholar]
- 30.Scott KL, Kabbarah O, Liang M-C, Ivanova E, Anagnostou V, Wu J, Dhakal S, Wu M, Chen S, Feinberg T, Huang J, Saci A, Widlund HR, Fisher DE, Xiao Y, Rimm DL, Protopopov A, Wong K-K, and Chin L (2009) GOLPH3 modulates mTOR signalling and rapamycin sensitivity in cancer. Nature. 459, 1085–1090 [DOI] [PMC free article] [PubMed] [Google Scholar]
- 31.Chen DR, Chu CY, Chen CY, Yang HC, Chiang YY, Lin TY, Chiang IP, Chuang DY, Yu CC, and Chow KC (2008) Expression of short-form oncostatin M receptor as a decoy receptor in lung adenocarcinomas. J. Pathol 215, 290–299 [DOI] [PubMed] [Google Scholar]
- 32.Kucia-Tran JA, Tulkki V, Smith S, Scarpini CG, Hughes K, Araujo AM, Yan KYM, Botthof J, Pérez-Gómez E, Quintanilla M, Cuschieri K, Caffarel MM, and Coleman N (2016) Overexpression of the oncostatin-M receptor in cervical squamous cell carcinoma is associated with epithelial-mesenchymal transition and poor overall survival. Br. J. Cancer 115, 212–222 [DOI] [PMC free article] [PubMed] [Google Scholar]
- 33.Shien K, Papadimitrakopoulou VA, Ruder D, Behrens C, Shen L, Kalhor N, Song J, Lee JJ, Wang J, Tang X, Herbst RS, Toyooka S, Girard L, Minna JD, Kurie JM, Wistuba II, and Izzo JG (2017) JAK1/STAT3 activation through a proinflammatory cytokine pathway leads to resistance to molecularly targeted therapy in non–small cell lung cancer. Mol. Cancer Ther 16, 2234–2245 [DOI] [PMC free article] [PubMed] [Google Scholar]
- 34.Xie J, Wang X, and Proud CG (2016) mTOR inhibitors in cancer therapy. F1000Research. 10.12688/f1000research.9207.1 [DOI] [PMC free article] [PubMed] [Google Scholar]
- 35.Sun S-Y, Rosenberg LM, Wang X, Zhou Z, Yue P, Fu H, and Khuri FR (2005) Activation of Akt and eIF4E survival pathways by rapamycin-mediated mammalian target of rapamycin inhibition. Cancer Res. 65, 7052–8 [DOI] [PubMed] [Google Scholar]
- 36.O’Reilly KE, Rojo F, She Q-B, Solit D, Mills GB, Smith D, Lane H, Hofmann F, Hicklin DJ, Ludwig DL, Baselga J, and Rosen N (2006) mTOR inhibition induces upstream receptor tyrosine kinase signaling and activates Akt. Cancer Res. 66, 1500–8 [DOI] [PMC free article] [PubMed] [Google Scholar]
Associated Data
This section collects any data citations, data availability statements, or supplementary materials included in this article.