Abstract
Aberrant epithelial reprogramming can induce metaplastic differentiation at sites of tissue injury, culminating in transformed barriers composed of scar and metaplastic epithelium. While the plasticity of epithelial stem cells is well-characterized, the identity and role of the niche has not been delineated in metaplasia. Here we show that Gli1+ mesenchymal stromal cells (MSCs), previously shown to contribute to myofibroblasts during scarring, promote metaplastic differentiation of airway progenitors into KRT5+ basal cells. During fibrotic repair, Gli1+ MSCs integrate hedgehog activation to upregulate BMP antagonism in the progenitor niche that promotes metaplasia. Restoring the balance towards BMP activation attenuated metaplastic KRT5+ differentiation while promoting adaptive alveolar differentiation into SFTPC+ epithelium. Finally, fibrotic human lungs demonstrate altered BMP activation in the metaplastic epithelium. These findings show that Gli1+ MSCs integrate hedgehog signaling as a rheostat to control BMP activation in the progenitor niche to determine regenerative outcome in fibrosis.
Main
A canonical feature of wound repair is the formation of scar tissue, composed of inflammatory cells and resident mesenchymal subsets that dynamically remodel the wound to close any barrier gaps. Scars are sometimes accompanied by epithelial metaplasia, defined as interconversion of one mature cell type into another that is not typically present at the site of injury1. One of the cardinal features of idiopathic pulmonary fibrosis (IPF), the most prevalent and deadly subtype of progressive fibrotic lung diseases, is the appearance of “bronchiolization” on histology2. This pathological feature denotes the ectopic appearance of proximal bronchus/airway epithelium within the distal lung, characterized by metaplastic KRT5+ basal cells lining cystic airspaces in the alveoli alongside patches of fibroblastic scars3,4. While the functional relationship between metaplasia and scarring is unclear in IPF, the appearance of metaplastic KRT5+ cells is correlated with worsening disease severity and survival5. This suggests that epithelial metaplasia is a clinically relevant feature of organ fibrosis and a potential therapeutic target.
The lung is populated by unique resident epithelial stem/progenitor cells along the proximal-distal axis. KRT5+ basal cells reside in the trachea and large airways in the murine lung, and SFTPC+ Type 2 cells reside in the distal alveolar sacs to generate functional alveolar epithelium6. In recent years, numerous studies have shown that KRT5-negative progenitors from the airway can migrate and reconstitute epithelium in the alveoli in response to severe damage7–10. While the heterogeneity within this airway progenitor population (EpCAM+ cells expressing combinations of Sox2, tp63, Scgb1a1, and Itgb4) has not been fully resolved, genetic lineage tracing and transplant experiments clearly demonstrate that KRT5-negative airway progenitors can replete the damaged alveolar surface with endogenous (SFTPC+) or metaplastic (KRT5+) epithelium with significant functional consequences depending on the regenerative outcome.
Gli1, a transcriptional readout of hedgehog (Hh) activation, labels mesenchymal cells adjacent to the airway epithelium11. Gli1+ cells have been demonstrated to exhibit properties of mesenchymal stromal cells (MSCs) ex vivo12–14, and contribute to fibrotic scarring in the lung and other organs through differentiation into myofibroblasts and secretion of collagen14. We have previously demonstrated that ectopic activation of hedgehog in the alveolar mesenchyme disrupts SFTPC+ alveolar progenitor renewal during homeostasis15. In this study, we set out to define the functional interactions between the Gli1+ niche cells and metaplastic differentiation of airway epithelial progenitors in the fibrotic lung.
Results
Gli1+ mesenchymal cells promote metaplastic KRT5 differentiation from the airway
SOX2+ progenitors are normally restricted to the airway epithelium during homeostasis, but they migrate into the alveoli during severe alveolar damage from influenza7,16. To determine whether SOX2+ progenitors have similar migratory capacity in a fibrotic model, we adapted a repetitive bleomycin model of lung fibrosis that better captured features of IPF compared to the single dose model, including the appearance of cystic airspaces and metaplastic basal cells in the alveoli (Extended Data Fig. 1a,b)17,18. Our genetic lineage tracing confirms that Sox2 lineage traced (Sox2 Lin+) airway progenitors expand and differentiate into metaplastic KRT5+/SOX2+ or endogenous SFTPC+/SOX2-epithelium in the alveoli in this model of severe fibrotic injury (Fig. 1a,b, ED Fig. 1c,d). Fidelity of the Sox2creERT2 driver was validated by SOX2 antibody staining of tamoxifen and corn oil controls (ED Fig. 1e–g). Interestingly, p63 Lin+ airway progenitors, previously found to contribute to KRT5+ basal cells after influenza infection9, did not contribute significantly to alveolar KRT5+ basal cells after bleomycin (ED. Fig 2a–d). In contrast, Scgb1a1 Lin+ airway progenitors which co-express Sox27, contributes to a significant proportion of alveolar basal cells after bleomycin (ED Fig. 2e,f).
Figure 1. Gli1+ mesenchymal cells promote metaplastic KRT5 differentiation in vivo.
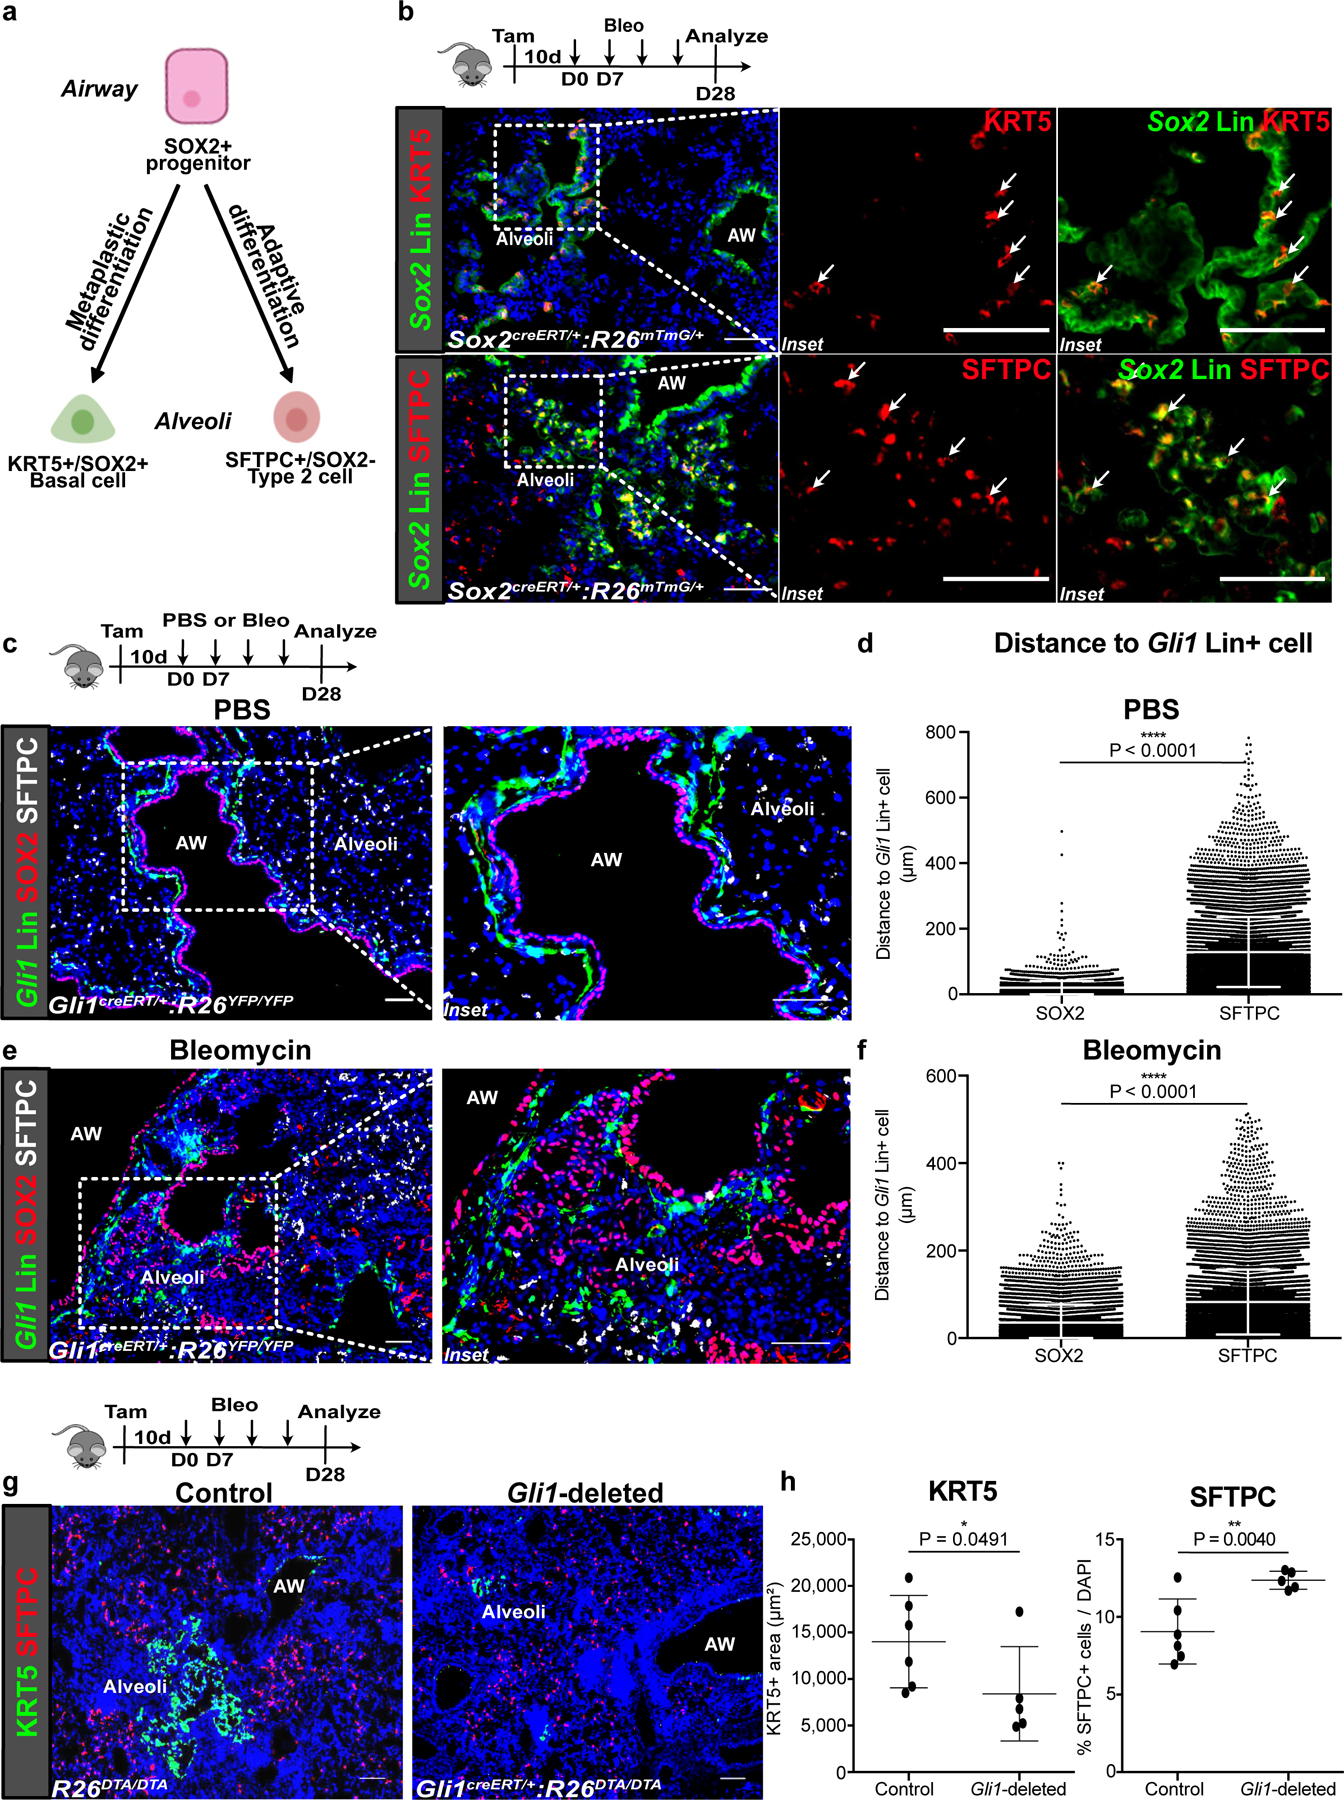
(a,b) Current model of airway progenitors migrating into the alveoli to form endogenous SFTPC+ Type 2 cells or metaplastic KRT5+ basal cells after severe injury, as demonstrated by lineage tracing of Sox2 (Sox2 Lin+) airway progenitors after repetitive bleomycin fibrotic injury. This experiment was repeated four times independently with similar results.
(c,d) Histology of proximally-located Gli1-lineage traced (Gli1 Lin+) mesenchymal cells and SOX2+ airway progenitors during homeostasis (PBS treated) with cell-to-cell distance showing proximity of SOX2+ progenitors and SFTPC+ alveolar progenitors respectively to Gli1 Lin+ cells during homeostasis (n = 4,207 SOX2 cells, n = 11,945 SFTPC cells; each datapoint represents an individual distance measurement with all distance measurements for 3 animals plotted; one-tailed unpaired Student’s t-test). Data are expressed as mean ± SD.
(e,f) Histology and average cell-to-cell distance of Gli1 Lin+ mesenchymal cells in the alveoli relative to alveolar SOX2+ progenitors during fibrotic repair (n = 7,285 SOX2 cells, n = 11,710 SFTPC cells; each datapoint represents an individual distance measurement with all distance measurements for 3 animals plotted; one-tailed unpaired Student’s t-test). Data are expressed as mean ± SD.
(g,h) Histology quantification of areas of KRT5+ pods and percentage of SFTPC+ cells after genetic deletion of Gli1+ cells with bleomycin injury (n = 6 for control, n = 5 for Gli1-deleted; each data point represents one animal; one-tailed unpaired Student’s t-test). Data are expressed as mean ± SD. AW = airway. Scale bars, 100 µm.
Immunofluorescence of Gli1 lineage-labeled cells (Gli1 Lin+) demonstrates that they are localized right beneath the basement membrane in close proximity to SOX2+ airway epithelium (Fig. 1c,d) during normal homeostasis. Gli1 Lin+ mesenchymal cells also respond to fibrotic injury by migrating into the alveolar compartment (Fig. 1e, ED Fig. 3d). Fidelity of Gli1creERT2 driver was validated by corn oil controls and comparable Gli1 reporter (ED Fig. 3a–c). Cell-to-cell distance quantification shows that the ectopic SOX2+ cells in the alveoli maintain a close distance to Gli1 Lin+ cells that migrated into the alveoli (Fig.1f), suggesting a functional interaction between migratory Gli1 Lin+ mesenchyme and SOX2+ progenitors as niche partners during repair.
To determine whether Gli1+ mesenchymal cells are required for metaplastic KRT5 differentiation in the alveoli, we genetically deleted Gli1+ cells by inducible expression of diphtheria toxin A (DTA) within Gli1-expressing cells and evaluated airway progenitor differentiation as previously described8,15,16. Tamoxifen induction of Gli1creERT/+:R26DTA/DTA (Gli1-deleted) animals alone without injury did not change the composition of the airway epithelium (ED Fig. 3f,g). Tamoxifen induction of Gli1-deleted animals followed by repetitive bleomycin resulted in significantly reduced areas of metaplastic KRT5+ pods on histology compared to control R26DTA/DTA animals, and a higher proportion of alveolar epithelium marked by the Type 2 cell marker, SFTPC (Fig. 1g,h), along with a trend toward decrease in fibrotic markers (ED Fig. 3j). This suggests that activated Gli1+ mesenchymal cells form a pathological niche to promote metaplastic differentiation after fibrotic injury.
To determine the ability of Gli1+ mesenchymal cells to modify airway progenitors in vitro, we co-cultured airway progenitors isolated from the lung (separated from the trachea) with or without Gli1+ mesenchymal cells in a heterotypic 3D organoid assay15 (Fig. 2a, ED Fig. 4c). Cytospin confirmed that ITGB4-sorted lung epithelium largely overlaps with SOX2, with minimal KRT5 or SFTPC-expressing cells (ED Fig. 4a,b). ITGB4+ progenitors cultured without mesenchyme failed to form organoids, but co-culture of ITGB4+ airway progenitors with Gli1+ mesenchyme resulted in significant growth in the 3D matrigel (Fig. 2b,c). Histologic analysis of the organoids co-cultured with Gli1+ cells demonstrated heterogeneous lineage differentiation that included organoids containing either KRT5+ or SFTPC+ cells, but never both in the same organoid (Fig. 2d). To ensure that the newly formed KRT5+ or SFTPC+ cells did not arise from pre-existing KRT5+ or SFTPC+ cells in the ITGB4 sort, we isolated ITGB4+ progenitors from lungs of Krt5 or Sftpc lineage-traced lungs for co-culture with Gli1+ mesenchyme, and immunophenotyping showed that <5% of the KRT5+ or SFTPC+ cells in the organoids were Krt5 or Sftpc Lin+ respectively (ED Fig. 4d–j). We next isolated Gli1 Lin+ or Lin- mesenchyme from PBS or bleomycin-treated lungs for co-culture with healthy ITGB4+ airway progenitors (Fig. 2e), which demonstrated that Gli1 Lin+ mesenchyme increased the colony forming efficiency (CFE) of airway progenitors in both uninjured and injured lungs compared to Gli1 Lin- mesenchyme (Fig. 2f,g). Lastly, immunophenotyping of the organoids containing Gli1 Lin+ mesenchyme shows that bleomycin injury in the mesenchyme significantly increases the proportion of KRT5+ basal cell organoids with a trend towards reduction in SFTPC+ organoids when compared to PBS-treated Gli1 Lin+ mesenchyme (Fig. 2h). This demonstrates that Gli1+ mesenchyme forms a niche to support airway progenitor expansion and differentiation in vitro.
Figure 2. Gli1+ mesenchymal cells provide a specialized niche for airway progenitor proliferation and metaplastic differentiation in vitro.
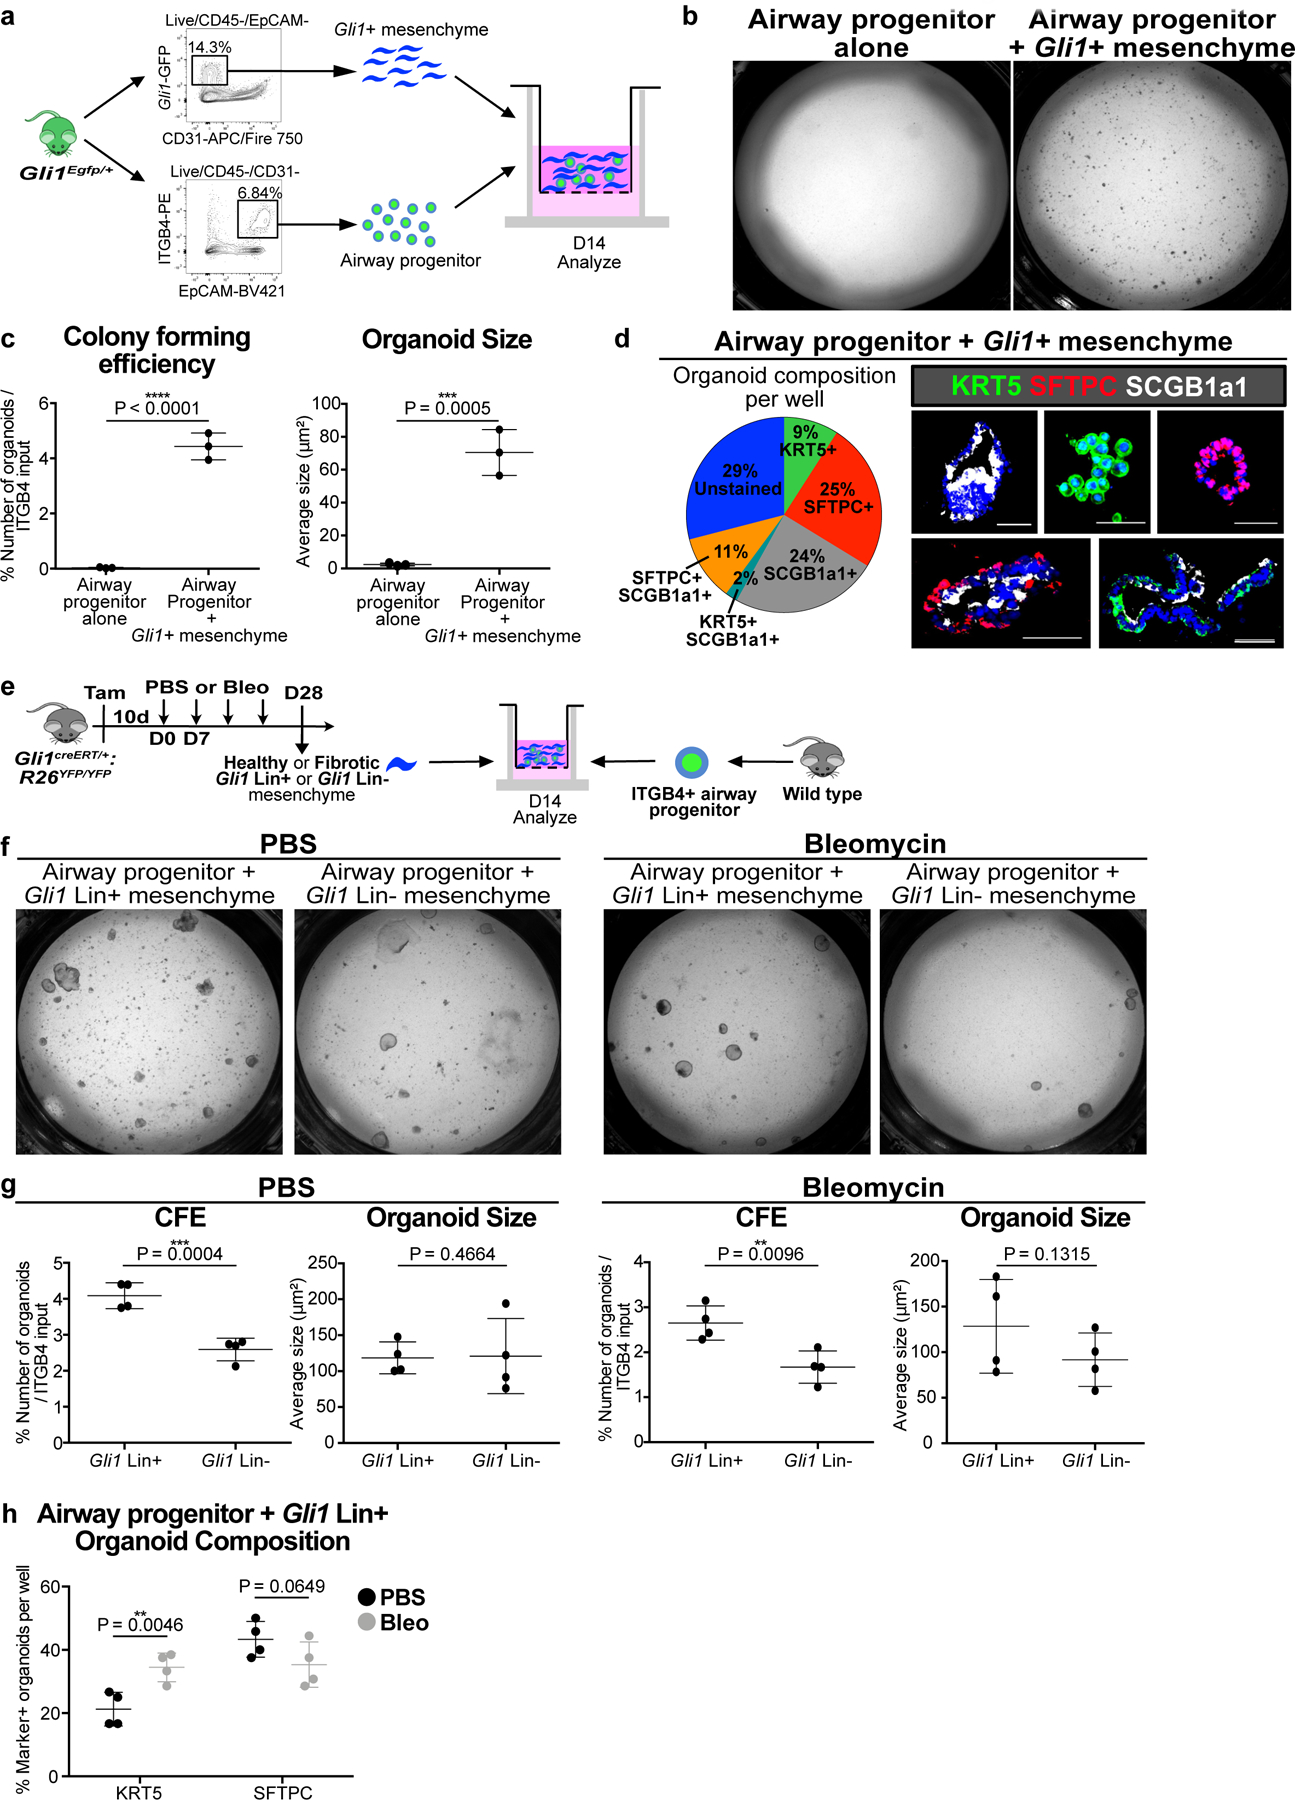
(a) Model of 3D organoid assay of airway progenitor differentiation by co-culturing sorted Gli1+ cells and ITGB4+ airway progenitors in Matrigel.
(b,c) Gli1+ mesenchyme’s effect on airway progenitor growth as demonstrated by colony forming efficiency (CFE) and organoid size of airway progenitor organoids cultured alone or with Gli1+ mesenchyme (n = 3 per group; each datapoint represents one well; one-tailed unpaired Student’s t-test). Data are expressed as mean ± SD.
(d) Cellular composition of individual airway progenitor-derived organoids.
(e-g) CFE of airway progenitors co-cultured with Gli1 Lin+ or Lin- (CD45-/CD31-/EpCAM-/YFP-) mesenchyme from PBS or bleomycin treated lung (n = 4 per group; each datapoint represents one well; one-tailed unpaired Student’s t-test). Data are expressed as mean ± SD.
(h) Proportion of airway progenitor-derived organoids with KRT5+ basal cells or SFTPC+ type 2 cells co-cultured with Gli1 Lin+ mesenchyme from bleomycin injured lungs compared to Gli1 Lin+ mesenchyme from PBS-treated lungs (n = 4 per group; each datapoint represents one well; one-tailed unpaired Student’s t-test). Data are expressed as mean ± SD. CFE = colony forming efficiency. Scale bars, 100 µm.
Mesenchymal Hh activation promotes metaplastic KRT5 differentiation
Gli1+ mesenchyme integrates extracellular cues during normal homeostasis and repair, including the availability of the SHH ligand that modulates the level of Hh activation in the tissue microenvironment11. Analysis of Shh expression during bleomycin injury shows expression in the ectopic SOX2+ airway progenitors that migrate into the alveoli (ED Fig. 5a). To determine the role of mesenchymal Hh activation as a niche signal modulating airway progenitor differentiation, we inducibly expressed a constitutively active form of the Hh effector, Smo (SmoM2), in Gli1+ cells19. Over-activation of Hh in Gli1+ mesenchyme through tamoxifen induction of Gli1creERT/+:R26SmoM2/YFP (referred to as Hh-activated) animals did not induce metaplastic differentiation in the uninjured lung (ED Fig. 5b,c). However, when Hh over-activation is followed by fibrotic injury with bleomycin, Hh-activated animals demonstrated a significant increase in areas of the lung with metaplastic KRT5+ basal cells along with a significantly reduced proportion of functional SFTPC+ alveolar epithelium compared to controls (Fig. 3a,b). We then performed genetic deletion of Smo using Gli1creERT/+:Smofl/fl animals treated with either corn oil (control) or tamoxifen (Hh-inactivated) followed by injury. Hh-inactivation in Gli1+ mesenchyme attenuated KRT5+ metaplasia and increased SFTPC+ cells in the alveoli, along with an improvement in gas exchange as shown by oximetry (Fig. 3c–e). Surprisingly, Hh activation in Gli1 Lin+ cells followed by fibrosis did not increase the number of Gli1 Lin+ cells in the alveoli, with a trend towards an increase in myofibroblastic differentiation (ED Fig. 5d–f). This data shows that Hh activation within Gli1+ mesenchyme, in conjunction with a fibrotic stimulus, acts in trans to promote the metaplastic differentiation in the airway progenitor niche.
Figure 3. Mesenchymal Hh activation promotes metaplastic KRT5 differentiation while suppressing SFTPC differentiation from airway.
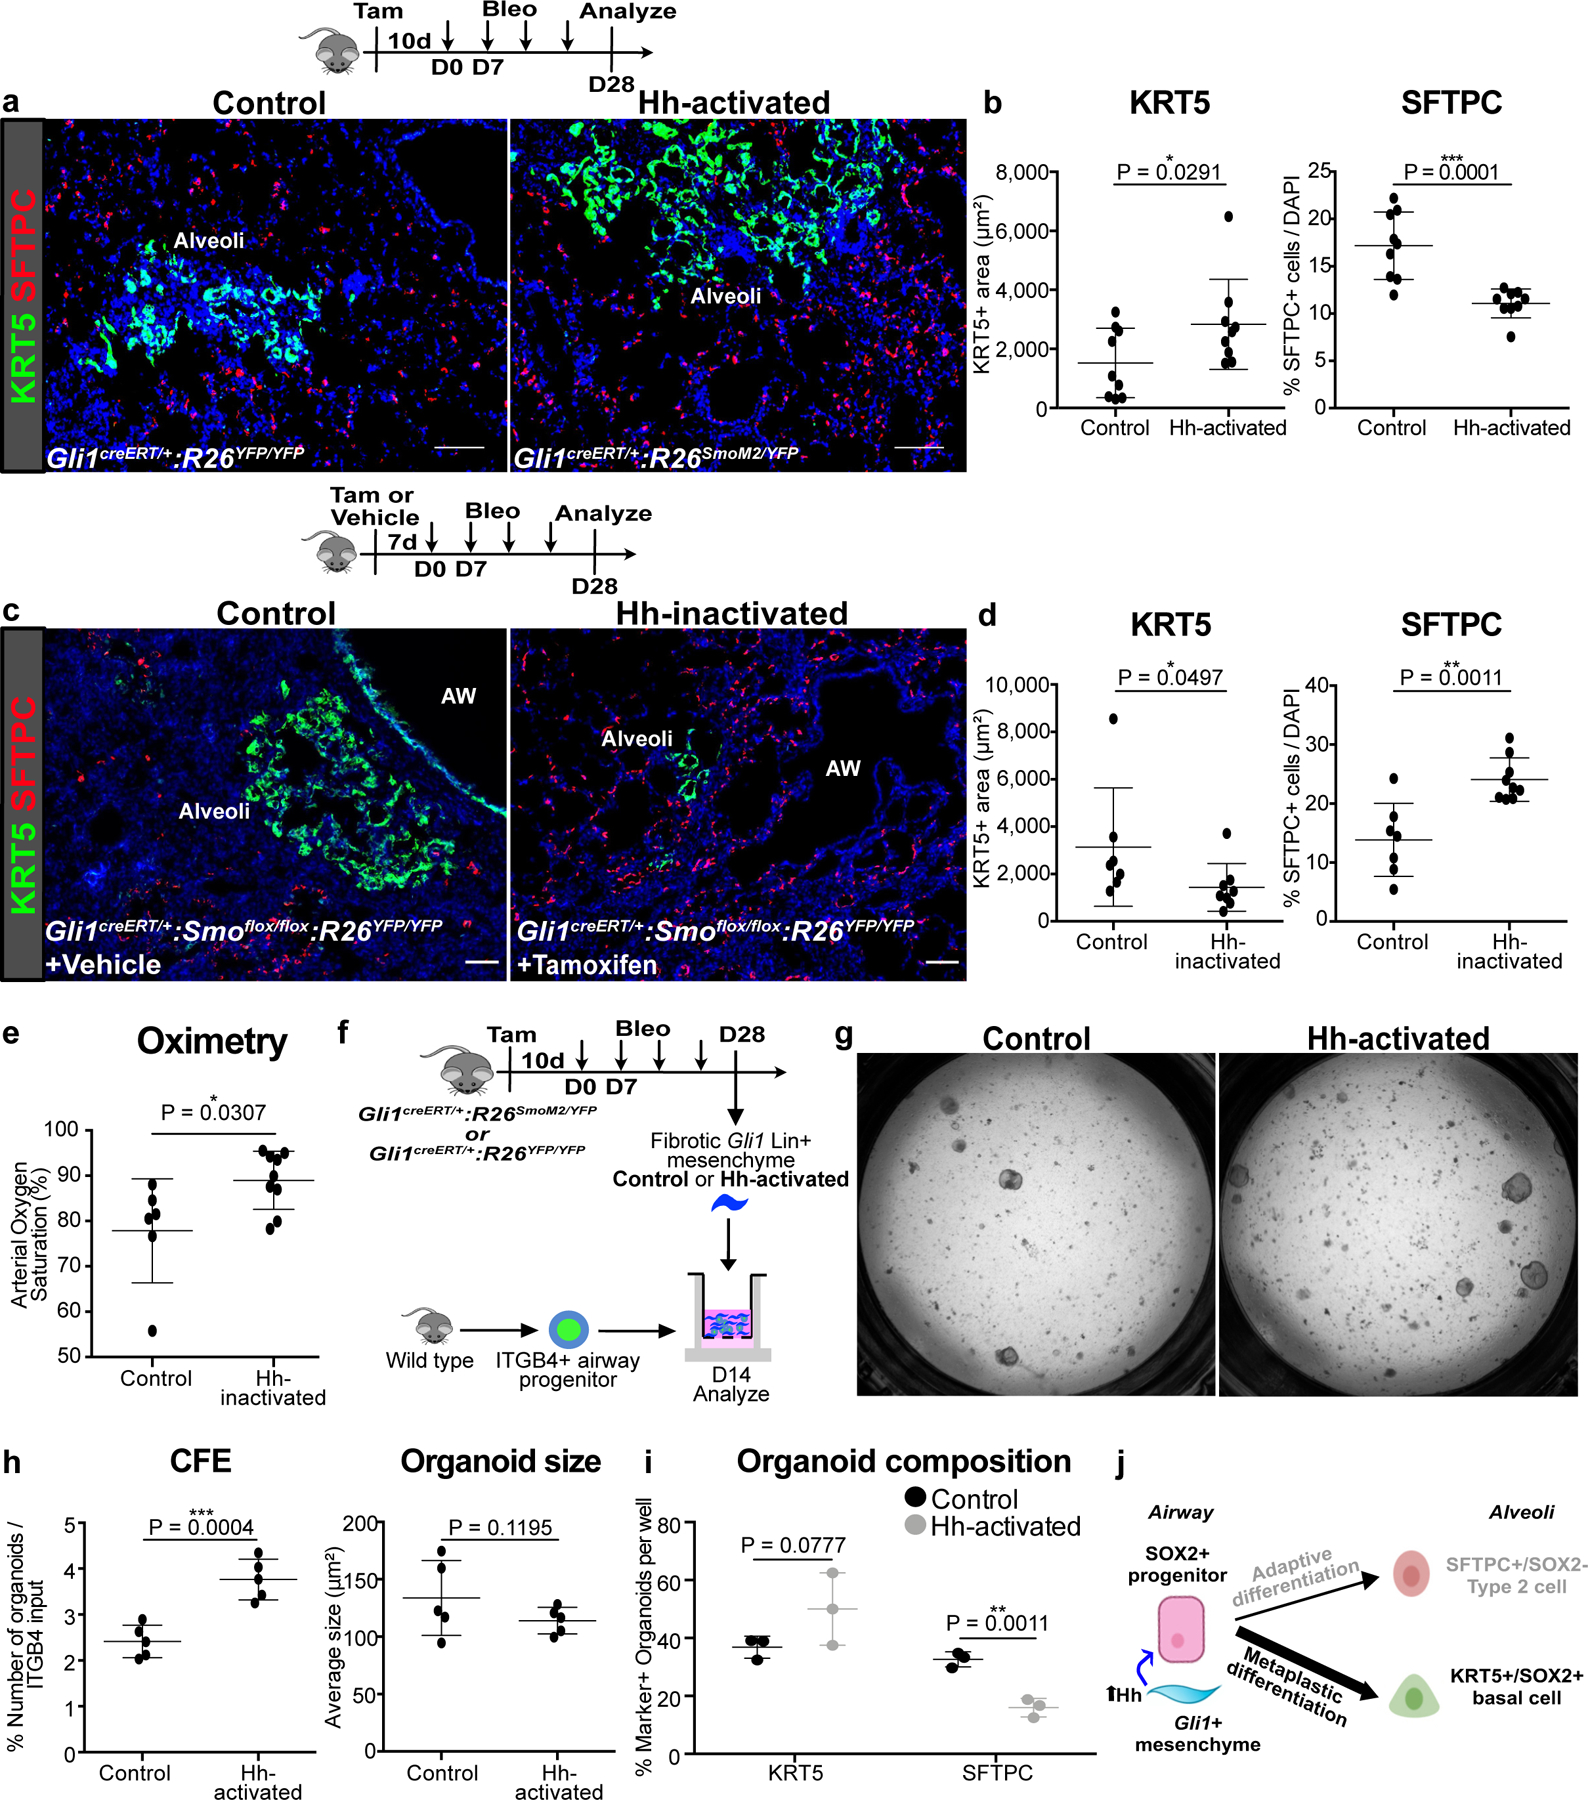
(a,b) Histology quantification of areas of KRT5+ pods and percentage of SFTPC+ cells after constitutive Hh activation (activation with SmoM2) in Gli1+ cells followed by bleomycin injury (n = 9 per group; each data point represents one animal; one-tailed unpaired Student’s t-test). Data are expressed as mean ± SD.
(c-e) Histology quantification of areas of KRT5+ pods and percentage of SFTPC+ cells and oximetry after Hh inactivation (deletion of Smo) in Gli1+ cells followed by bleomycin injury (n = 7 for control, n = 9 for Hh-inactivated; each data point represents one animal; one-tailed unpaired Student’s t-test for (d,e)). Data are expressed as mean ± SD.
(f-i) CFE, organoid size, and composition of airway progenitors co-cultured with Gli1 Lin+ mesenchyme isolated from Hh-activated fibrotic lungs compared to Gli1 Lin+ mesenchyme from control fibrotic lung (n = 5 per group for (h), n = 3 per group for (i); each data point represents one well; one-tailed unpaired Student’s t-test for (h,i)). Data are expressed as mean ± SD.
(j) Model of Hh activation in the Gli1+ mesenchyme acting in trans to promote SOX2+ progenitor differentiation into metaplastic KRT5+ basal cells. Data are expressed as mean ± SD. Hh = hedgehog. Scale bars, 100 µm.
To determine whether mesenchymal Hh activation in vivo promotes the differentiation of isolated airway progenitors in vitro, we isolated injured control or Hh-activated Gli1 Lin+ lung mesenchyme with healthy ITGB4+ airway progenitors in our organoid assay (Fig. 3f). Hh-activated Gli1 Lin+ mesenchyme increased the CFE of airway progenitors and increased KRT5+ basal cell organoids at the expense of SFTPC+ organoids compared to control mesenchyme (Fig. 3g–i). To activate Hh in the lung mesenchyme in vitro, we first generated a transgenic animal (UbccreERT2/+:R26SmoM2/+) where constitutively active SmoM2 could be induced in isolated lung mesenchymal cells in vitro utilizing a creERT2 allele driven by a ubiquitously expressing promoter as previously described11,15. We activated Hh in isolated lung mesenchyme by addition of 4-hydroxytamoxifen (4OHT), followed by co-culture with wild type ITGB4+ progenitors in our 3D organoid assay. Activation of Hh in the mesenchyme in vitro resulted in appropriate induction of Gli1 in the separated mesenchyme (ED Fig 5h). Hh activation in the mesenchyme significantly increased the expression of Krt5 in the epithelial organoids and decreased the expression of Sftpc along with similar trends in immunophenotyping of KRT5+ and SFTPC+ organoids (ED Fig. 5i–l). These results demonstrate that Hh activation of mesenchyme promotes the metaplastic differentiation of airway progenitors into basal cells during fibrotic repair, likely through the alteration of niche factors secreted by Gli1+ mesenchyme (Fig. 3j).
Single cell transcriptome analysis of Gli1+ mesenchyme reveals upregulated BMP antagonism in the fibrotic niche
To determine transcriptome alterations that could modify Gli1+ cells’ ability to alter airway progenitor behavior, we performed single cell RNA-sequencing (scRNA-seq) on sorted Gli1 Lin+ mesenchymal cells before and after fibrotic injury (Fig. 4a). 17,620 cells were captured from lineage labeled Gli1 Lin+ cells from Gli1creERT/+:R26YFP/YFP lungs treated with PBS or bleomycin. PBS and bleo-treated datasets were merged and projection of transcriptomic variations of individual cells by Uniform Manifold Approximation and Projection (UMAP)20 shows three main clusters, defined by their anatomic localization and differentiation (Fig. 4b). Based on our prior study showing that mesenchyme surrounding the airway exhibits distinct identity from those in the alveoli15, Cluster 1 and Cluster 2 represent the airway and alveolar subsets respectively, whereas Cluster 3 represents a de novo population expressing myofibroblast markers that appears only during fibrotic injury in the alveoli (Fig. 4c). Bleomycin-injured Gli1 Lin+ cells demonstrate an increase in proportion of cells in the alveolar subset (Fig. 4d), and gave rise to the entire myofibroblast subset that generates scarring in the alveoli along with portions of the alveolar subset (Fig. 4d, green box). RNA velocity analysis21 on Gli1 Lin+ mesenchymal cells treated with bleomycin predicted two distinct trajectories where airway mesenchymal cells gives rise to either alveolar mesenchymal cells or myofibroblasts during fibrotic repair (Fig. 4e), which is supported by multi-color clonal analysis using the R26Confetti reporter coupled with Gli1 lineage tracing after bleomycin injury (ED Fig. 6a)
Figure 4. Single cell transcriptome analysis of Gli1 Lin+ mesenchyme reveals upregulated BMP antagonism in the fibrotic niche.
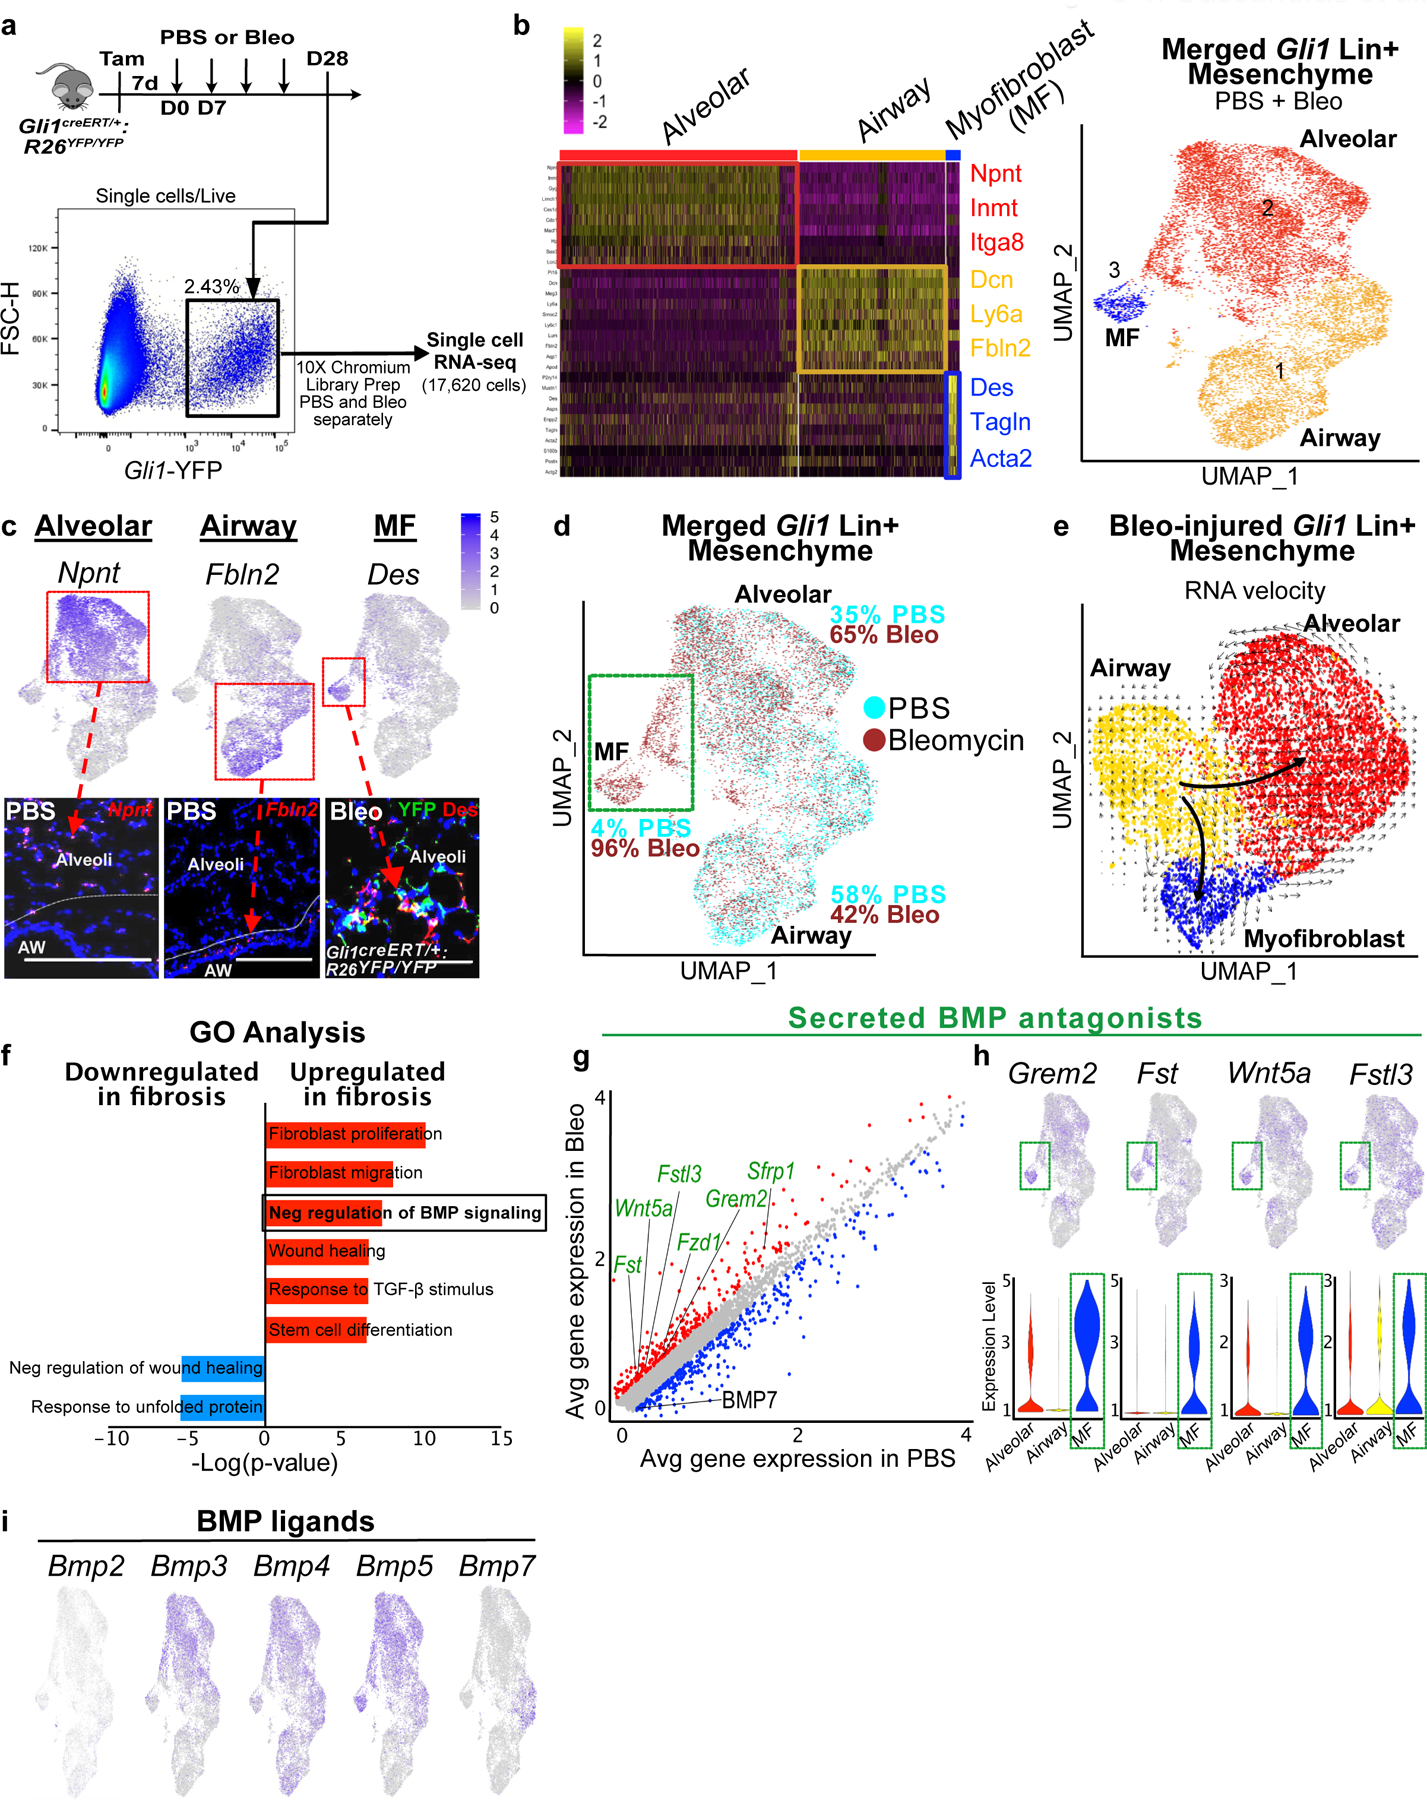
(a) Workflow to isolate Gli1 Lin+ cells during homeostasis (PBS) and fibrosis (bleomycin) for single cell analysis (one animal per treatment).
(b) Left: Heatmap of merged Gli1 Lin+ cells (PBS and bleomycin) segregates into 3 distinct clusters based on transcriptome, with highest expressing cluster-defining genes to the right. Right: UMAP plot of the three distinct clusters that appears segregated based on anatomic location.
(c) in situ (RNAscope) and immunofluorescent analysis shows spatial distribution of signature genes for alveolar, airway, and myofibroblast clusters. This experiment was repeated twice independently with similar results.
(d) UMAP plot with cells of origin based on treatment shows an increase in proportion of cells in the alveolar and myofibroblast cluster after fibrotic injury. Portion of the alveolar cluster and the entire myofibroblast cluster is derived from bleo-injured cells (green box).
(e) RNA velocity analysis predicting the transcriptional trajectory of Gli1 Lin+ cellular clusters.
(f) GO term analysis of differentially-expressed genes between PBS and bleo-treated Gli1 Lin+ cells reveals enrichment for genes involved in negative regulation of BMP signaling during fibrotic repair (P-adj = 2.26E-02; MAST test).
(g) Gene correlation plot with each dot representing a gene, with genes significantly upregulated in fibrotic Gli1 Lin+ cells in red (P-adj. < 0.1, logfc >0.15) and downregulated (P-adj. < 0.1, logfc <−0.15) in blue. Secreted BMP antagonists (GO term: negative regulation of BMP signaling) are labeled in green (Grem2 P-adjusted = 1.32E-21; Fst P-adj = 2.97E-122; Wnt5a P-adj = 2.18E-51; Sfrp1 P-adj = 2.99E-72; Fstl3 P-adj = 1.78E-77; Fzd1 P-adj = 2.36E-69; Bmp7 P-adj = 8.77E-51; MAST test).
(h) Gene feature plots and violin plots of secreted BMP antagonists show enrichment in myofibroblast and part of distal cluster (green box). The violin bodies represent distribution of the cells (n = 11,925 cells).
(i) Gene feature plots of BMP ligand expression in Gli1 Lin+ mesenchyme. MF = myofibroblast, UMAP = Uniform Manifold Approximation and Projection, GO = Gene Ontology, BMP = Bone morphogenetic protein
Scale bars, 100 µm.
Differential gene expression analysis between Gli1 Lin+ cells treated with PBS vs. bleomycin showed that Gli1 Lin+ cells retained Gli1 expression after injury even as they migrate into the alveoli (ED Fig. 6b). Fibrotic Gli1 Lin+ mesenchyme upregulated genes classified as “TGF-β signaling components” and “negative regulation of BMP signaling” according to Gene Ontology (GO) analysis (Fig. 4f,g). The upregulation of secreted BMP antagonists, particularly Grem2 and Fst, is most pronounced in the Gli1 Lin+ cells that appear de novo in bleomycin, including the myofibroblast cluster (Fig. 4h). Secreted BMP antagonists are almost exclusively expressed in the mesenchyme of the lung in a publicly available murine lung cellular atlas (Tabula muris)22. Additionally, numerous BMP ligands are also expressed in the Gli1+ mesenchyme, including Bmp3, 4, 5, and 7 (Fig. 4i), with Bmp7 significantly downregulated in bleomycin treatment. Our single cell analysis suggests that Gli1 Lin+ mesenchyme upregulates local BMP antagonism during fibrotic repair through the secretion of soluble BMP antagonists in the fibrotic niche.
Hh activation upregulates BMP antagonism in the fibrotic lung
During organ morphogenesis, Hh and BMP signaling are often mutually antagonistic, forming antiparallel gradients of activation within the same tissue to define segmental cell fate23. Activation of the BMP receptor leads to intracellular phosphorylation of SMAD1, 5, and 8, which serves as a readout for BMP activation24. Quantification of phosphorylated-SMAD1/5/8 (pSMAD1/5/8) staining in the Sox2 Lin+ cells in the alveoli after injury shows that the majority of BMP-activated Sox2 Lin+ cells were SCGB1A1+ or SFTPC+, but rarely KRT5+ (ED Fig. 7a,b). To determine the effect of Hh activation on BMP activation, we quantified the pSMAD1/5/8+ areas in the bleomycin-injured lungs, which showed a reduction of alveolar areas stained by pSMAD1/5/8 in the Hh-activated lungs compared to controls (Fig. 5a,b), suggesting that Hh activation antagonizes BMP activation in fibrotic repair.
Figure 5. Hh activation upregulates BMP antagonism in the fibrotic lung.
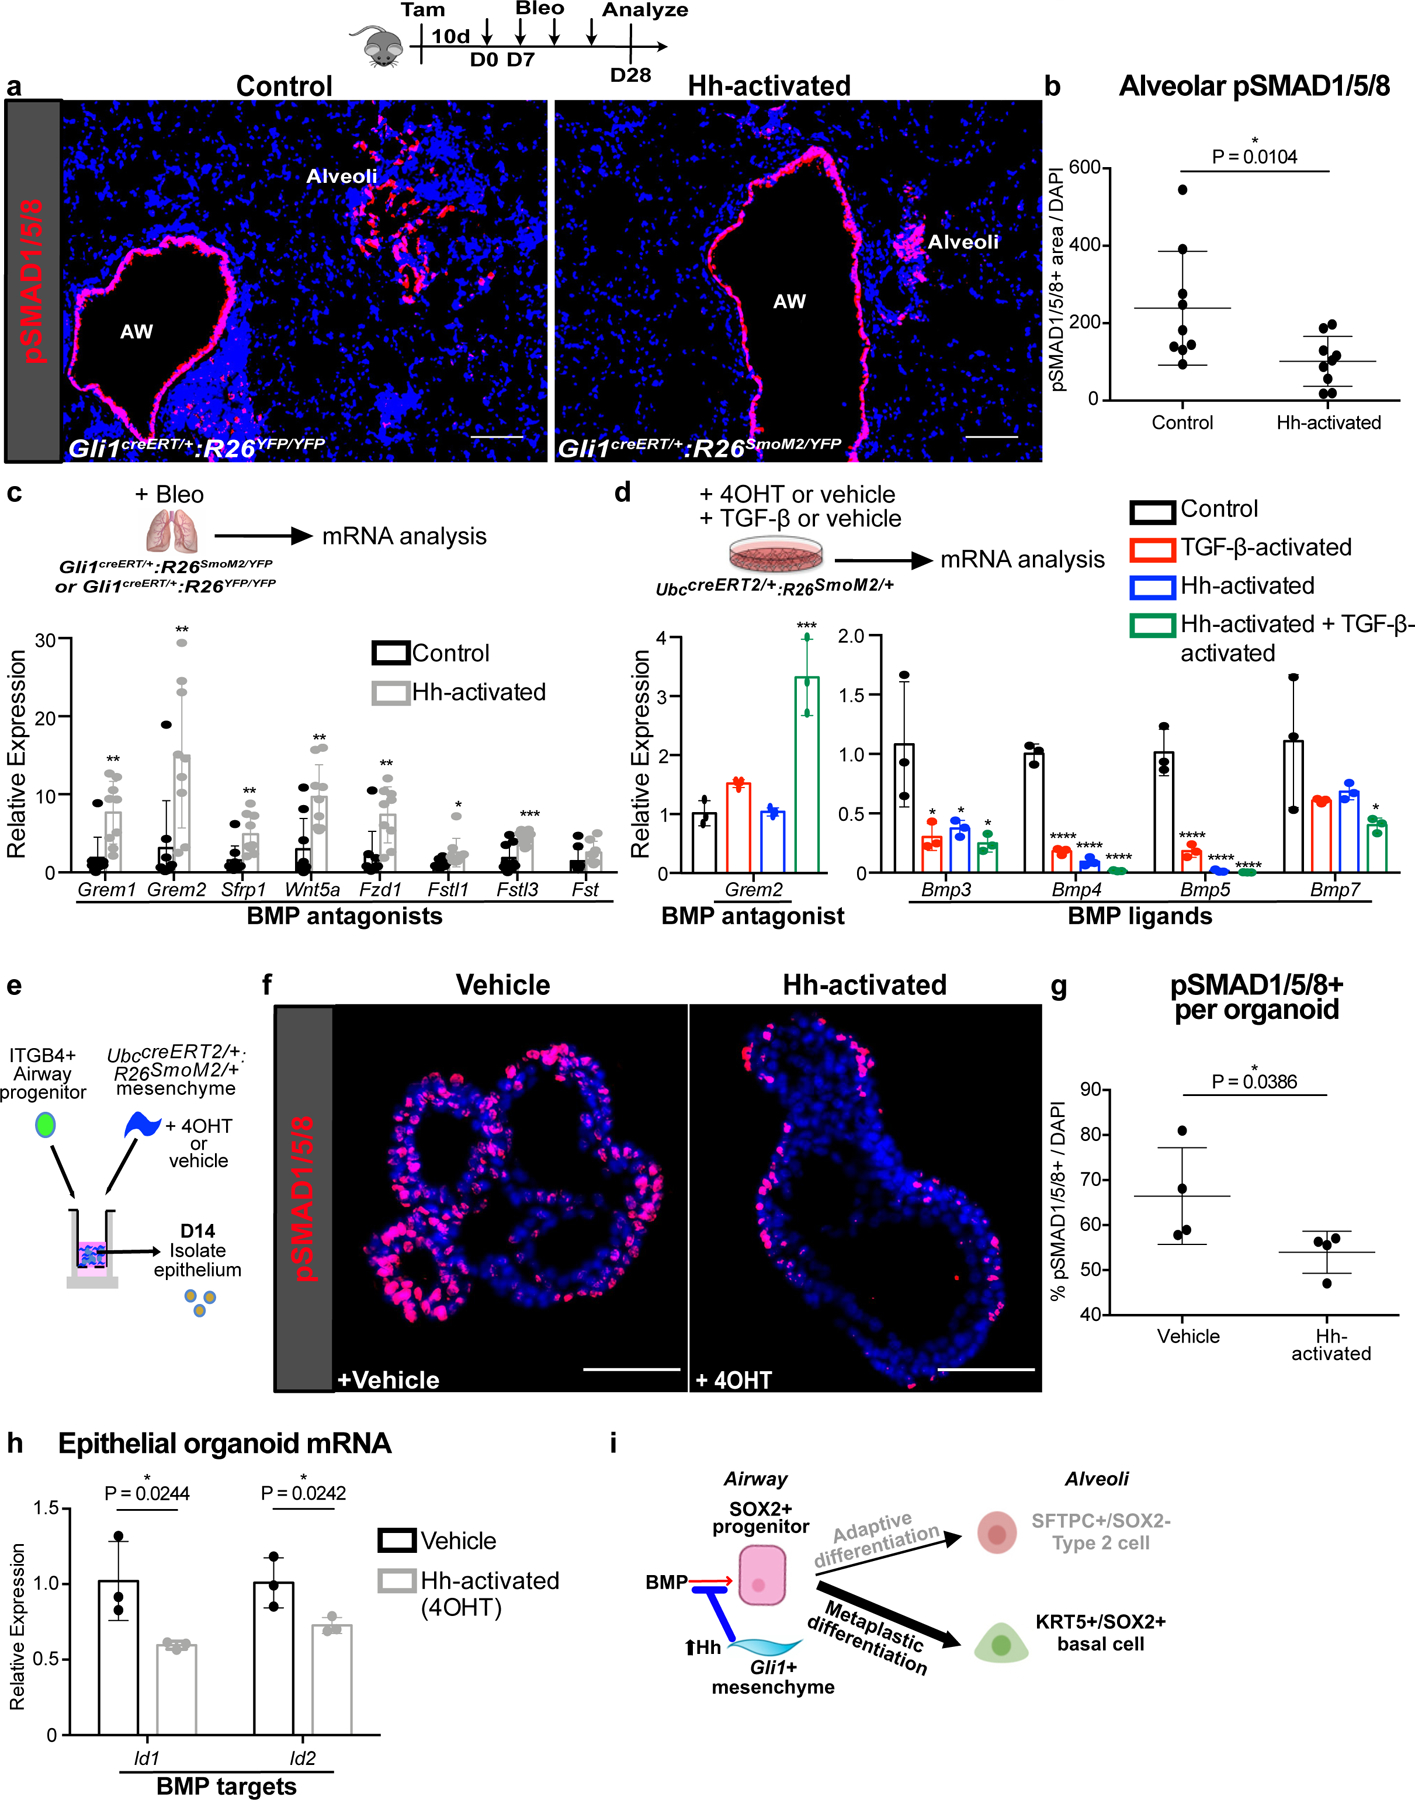
(a,b) Histology quantification of alveolar pSMAD1/5/8 staining in Hh-activated lungs compared to controls in bleomycin treated animals (n = 9 per group; each data point represents one animal; one-tailed unpaired Student’s t-test). Data are expressed as mean ± SD.
(c) Expression of secreted BMP antagonists in Hh-activated lungs compared to controls during fibrotic repair (n = 9 per group; each data point represents one animal; Grem1 P = 0.0011; Grem2 P = 0.0027; Sfrp1 P = 0.0027; Wnt5a P = 0.0014; Fzd1 P = 0.0021; Fstl1 P = 0.0185; Fstl3 P = 0.0008; Fst P = 0.0686; one-tailed unpaired Student’s t-test). Data are expressed as mean ± SD.
(d) qPCR of BMP antagonist Grem2 and various BMP ligands in Hh-inducible cultured mesenchyme with or without TGF-β activation (n = 3; each data point represents one biological replicate). Grem2: Control v TGF-β P = 0.2431, Control v Hh-activated P = 0.9995, Control v TGF-β + Hh-activated P = 0.0001; Bmp3: Control v TGF-β P = 0.0206, Control v Hh-activated P = 0.0330, Control v TGF-β + Hh-activated P = 0.0147; Bmp4: Control v TGF-β P < 0.0001, Control v Hh-activated P < 0.0001, Control v TGF-β + Hh-activated P < 0.0001; Bmp5: Control v TGF-β P < 0.0001, Control v Hh-activated P < 0.0001, Control v TGF-β + Hh-activated P < 0.0001; Bmp7: Control v TGF-β P = 0.1446, Control v Hh-activated P = 0.2303, Control v TGF-β + Hh-activated P = 0.0386; ordinary one-way ANOVA test. Data are expressed as mean ± SD.
(e-g) pSMAD1/5/8+ cell number in progenitor-derived organoids with Hh-activated mesenchyme. (n = 4; each data point represents one well; one-tailed unpaired Student’s t-test). Data are expressed as mean ± SD.
(h) BMP target gene expression in epithelial organoids isolated after co-culture with Hh-inducible mesenchyme (n = 3; each datapoint represents one well; one-tailed unpaired Student’s t-test). Data are expressed as mean ± SD.
(i) Hh upregulation of BMP antagonism in the fibrotic progenitor niche drives metaplastic KRT5 differentiation. Scale bars, 100 µm.
Next, we examined the expression of secreted BMP antagonists in the Hh-activated and control lungs treated with bleomycin. Genes encoding soluble BMP antagonists were upregulated in the fibrotic Hh-activated lungs compared to controls by whole lung qPCR analysis (Fig. 5c). These data suggest that Hh activation antagonizes BMP activation during fibrotic repair by upregulating secreted antagonists of BMP signaling in the Gli1 Lin+ mesenchyme.
To determine whether Hh activation directly upregulates BMP antagonists in vitro, we collected Hh-inducible mesenchyme from the UbccreERT2/+:R26SmoM2/+ lungs and induced Hh activation with 4OHT (Fig. 4d, ED Fig. 7c). Surprisingly, Hh-activated mesenchyme showed minimal induction of the BMP antagonist, Grem2. Recombinant TGF-β1, a fibrotic stimulus upregulated in the fibrotic Gli1 Lin+ mesenchyme, also had minimal effect on Grem2 expression when added alone to control lung mesenchyme. However, TGF-β1 activation in conjunction with Hh activation in vitro significantly increased the expression of Grem2 (Fig. 5d), which was the most upregulated BMP antagonists in the Hh-activated lungs in vivo (Fig. 5c). This suggests a synergistic interaction between TGF-β and Hh in upregulating BMP antagonism in the fibrotic niche. Conversely, both Hh and TGF-β activation can independently suppress the expression of Bmp3, Bmp4, Bmp5, and Bmp7 from the mesenchyme, with the most profound effect on Bmp4 and Bmp5 when both Hh and TGF-β are activated (Fig. 5d). Hh-activation in the mesenchyme reduced pSMAD1/5/8 staining in the epithelial organoids, along with expression of BMP-target genes Id1 and Id2 in the epithelium (Fig. 5e–h). These results demonstrate that Hh activation suppresses BMP activation by simultaneously upregulating soluble BMP antagonists in the mesenchyme and downregulating BMP ligands in the fibrotic niche (Fig. 5i).
BMP activation attenuates metaplastic airway progenitor differentiation
To test whether BMP activation can modify metaplastic KRT5 differentiation in vivo, we directly dosed recombinant BMP into the lung undergoing bleomycin treatment. Histologically, injured wild type animals treated with recombinant human BMP4 (rhBMP4) demonstrated a significant reduction in the areas of lung occupied by KRT5+ cystic airspace concurrent with an increase in the proportion of SFTPC+ cells compared to vehicle, along with an improvement in oximetry and fibrotic markers (Fig. 6a–c, ED Fig. 8a–c). One possible side effect of rhBMP4 is the induction of chondrogenic markers in the lung as seen on qPCR (ED Fig. 8e). To determine the lineage origin of the SFTPC+ cells seen in rhBMP4 treated lungs, we repeated the same experiment with Sox2 lineage traced animals. Quantification of Sox2 Lin+ cells in the alveoli showed that rhBMP4 increased the proportion of SFTPC+/Sox2 Lin+ cells with a concurrent reduction in KRT5+/Sox2 Lin+ cells (Fig. 6d,e), with no difference in the total number of Sox2 Lin+ cells that migrated into the alveoli (ED Fig. 8f).
Figure 6. BMP activation attenuates metaplastic airway progenitor differentiation.
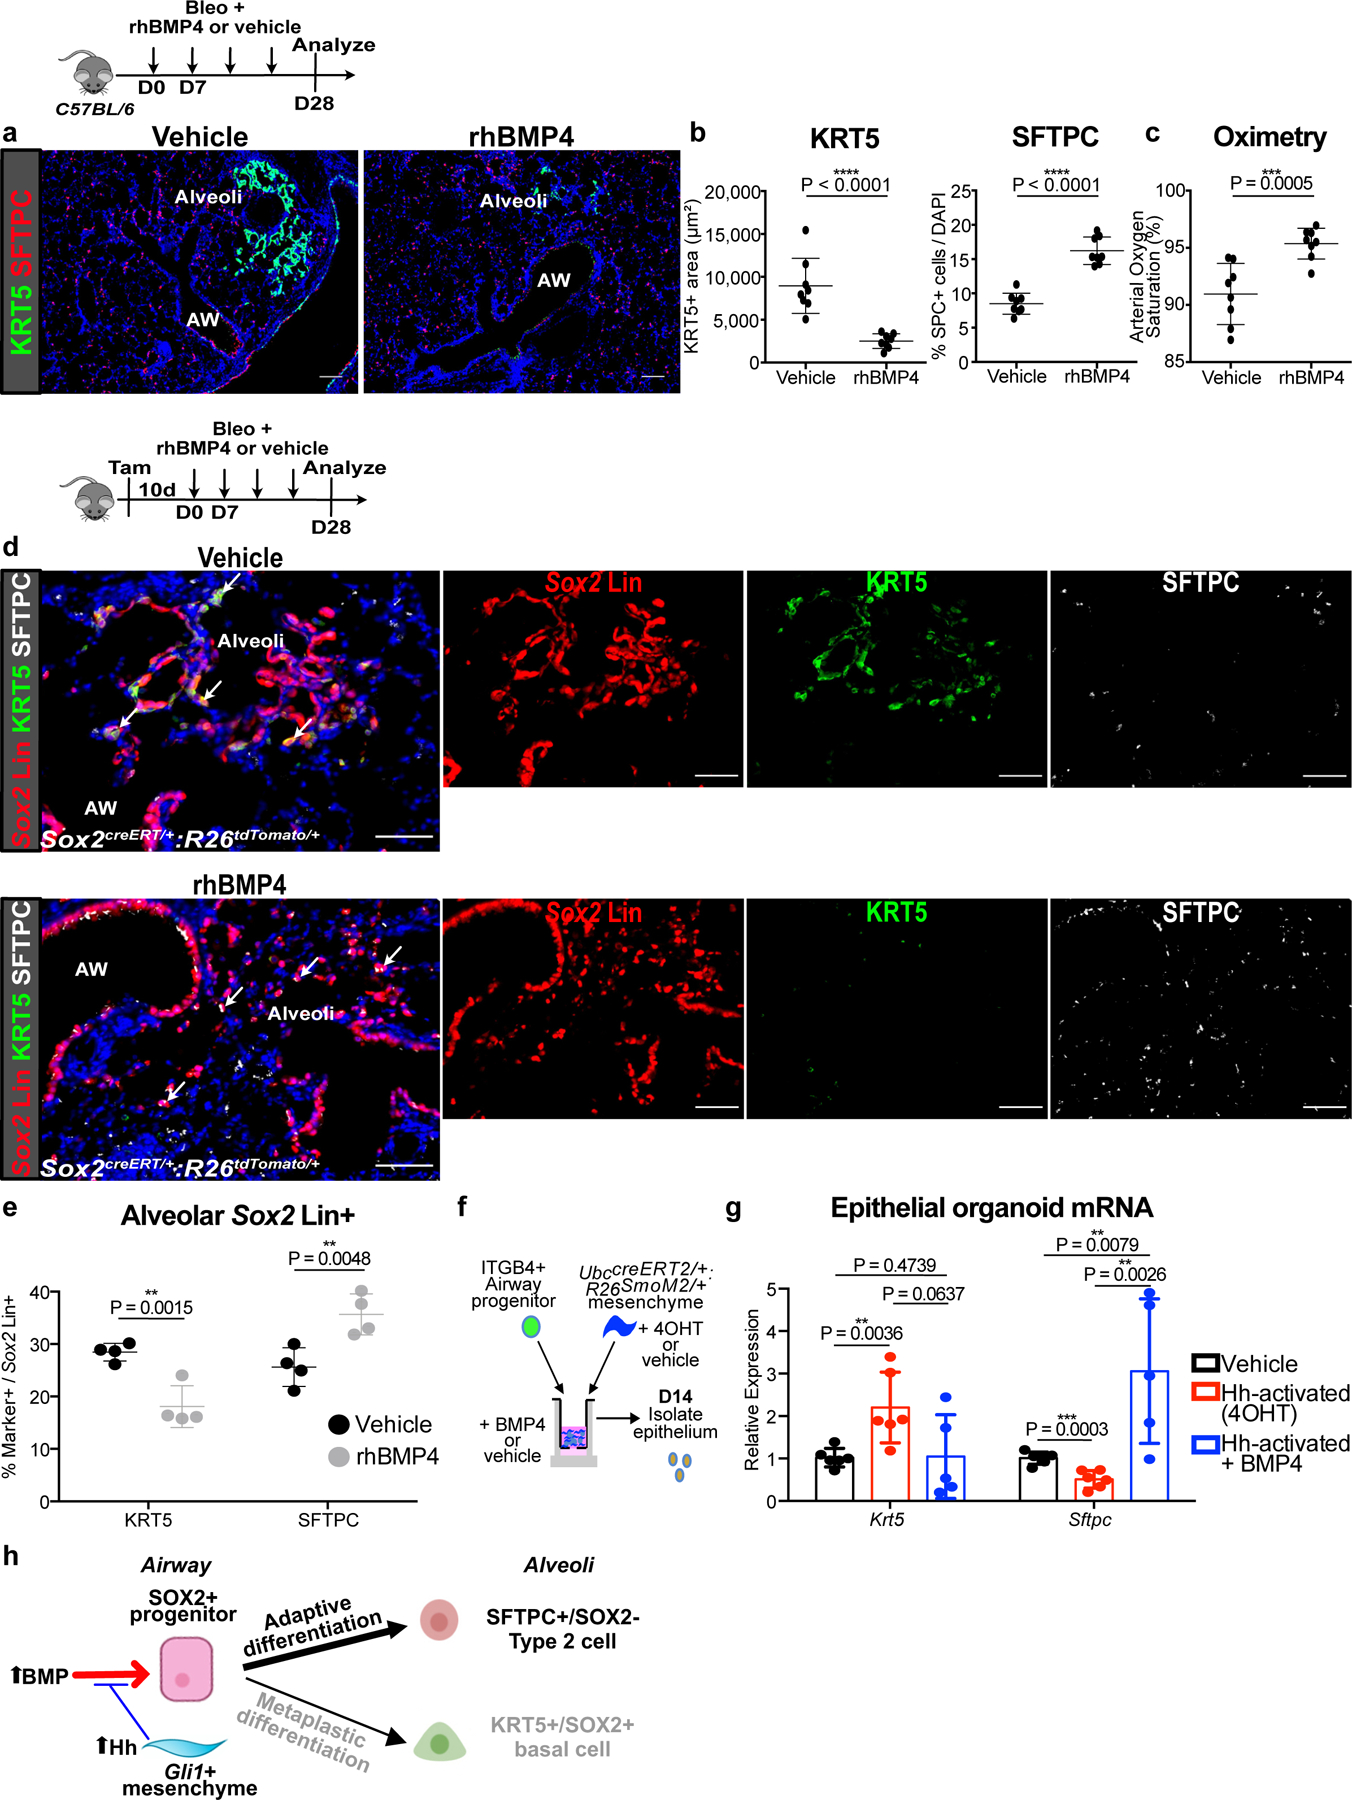
(a-c) Histology quantification of areas of KRT5+ pods and percentage of SFTPC+ cells and oximetry after addition of rhBMP4 during bleomycin injury (n = 8 per group; each data point represents one animal; one-tailed unpaired Student’s t-test for (b,c)). Data are expressed as mean ± SD.
(d,e) Histologic quantification of alveolar Sox2 Lin+ cells followed by bleomycin injury and rhBMP4 administration (n = 4 per group; each data point represents one animal; one-tailed unpaired Student’s t-test). Data are expressed as mean ± SD.
(f,g) qPCR of epithelial organoids co-cultured with Hh-activated mesenchyme and rhBMP4. (n = 6 for vehicle, n = 6 for Hh-activated, and n = 5 for Hh-activated + BMP4; each data point represents one well; ordinary one-way ANOVA test). Data are expressed as mean ± SD.
(h) Model of BMP activation promoting airway progenitor differentiation into adaptive SFTPC+ Type 2 cells.
AW = airway, Scale bars, 100 µm.
To test the effect of BMP modulation in the airway progenitor in vitro, we co-cultured ITGB4+ airway progenitors and Gli1+ mesenchyme with recombinant BMP4 or BMP antagonist, GREMLIN2, in our 3D organoid assay (ED Fig. 8g). Addition of BMP4 increased the expression of Sftpc in the epithelial organoid and reduced the expression of Krt5, and GREMLIN2 had the opposite effects (ED Fig. 8i). Furthermore, addition of BMP4 to airway progenitors co-cultured with Hh-activated mesenchyme attenuated KRT5 metaplasia in the organoids (Fig. 6f,g), further supporting that BMP antagonism occurs downstream of Hh-activation to drive KRT5 differentiation. These data demonstrate that BMP activation promotes the differentiation of mobilized airway progenitors into adaptive SFTPC+ alveolar epithelium (Fig. 6h), and the prevention of epithelial metaplasia is physiologically significant for improving gas exchange.
IPF lungs display altered BMP activation in the epithelium
To determine whether fibrotic human lung mesenchyme undergoes similar transcriptomic alterations as seen in the murine Gli1+ mesenchyme, we analyzed single cell RNA-sequencing (scRNA-seq) of human lungs from IPF and normal controls (n = 3 per group). The diseased lungs were collected from patients with an established diagnosis of IPF undergoing lung transplantation, and controls were from sex and age-matched cadaveric donor lungs without prior history of lung disease. Mesenchymal cells were segregated based on presence of Pdgfra as a mesenchymal marker, with Pdgfra+ cells from each lung merged for comparison (Fig. 7a,b, ED Fig. 9a). UMAP analysis shows emergence of cellular subsets in the fibrotic lung that are distinct from Pdgfra+ cells from healthy controls (ED Fig. 7b, ED Fig. 9a), with cluster 3 derived almost entirely from IPF lungs and enriched for scar components such as genes associated with myofibroblast differentiation (ACTA2 and ASPN) and matrix deposition (COL1A1) (Fig. 7c,d). Differential gene expression of the scRNA-seq dataset with GO analysis shows a significant enrichment of BMP antagonists in the fibrotic human lung mesenchyme compared to normal controls (Fig. 7e,f). Furthermore, the upregulated BMP antagonists demonstrate particular enrichment in the scar-forming fibroblasts (Cluster 3) (Fig. 7g).
Figure 7. IPF lungs display altered BMP activation in the epithelium.
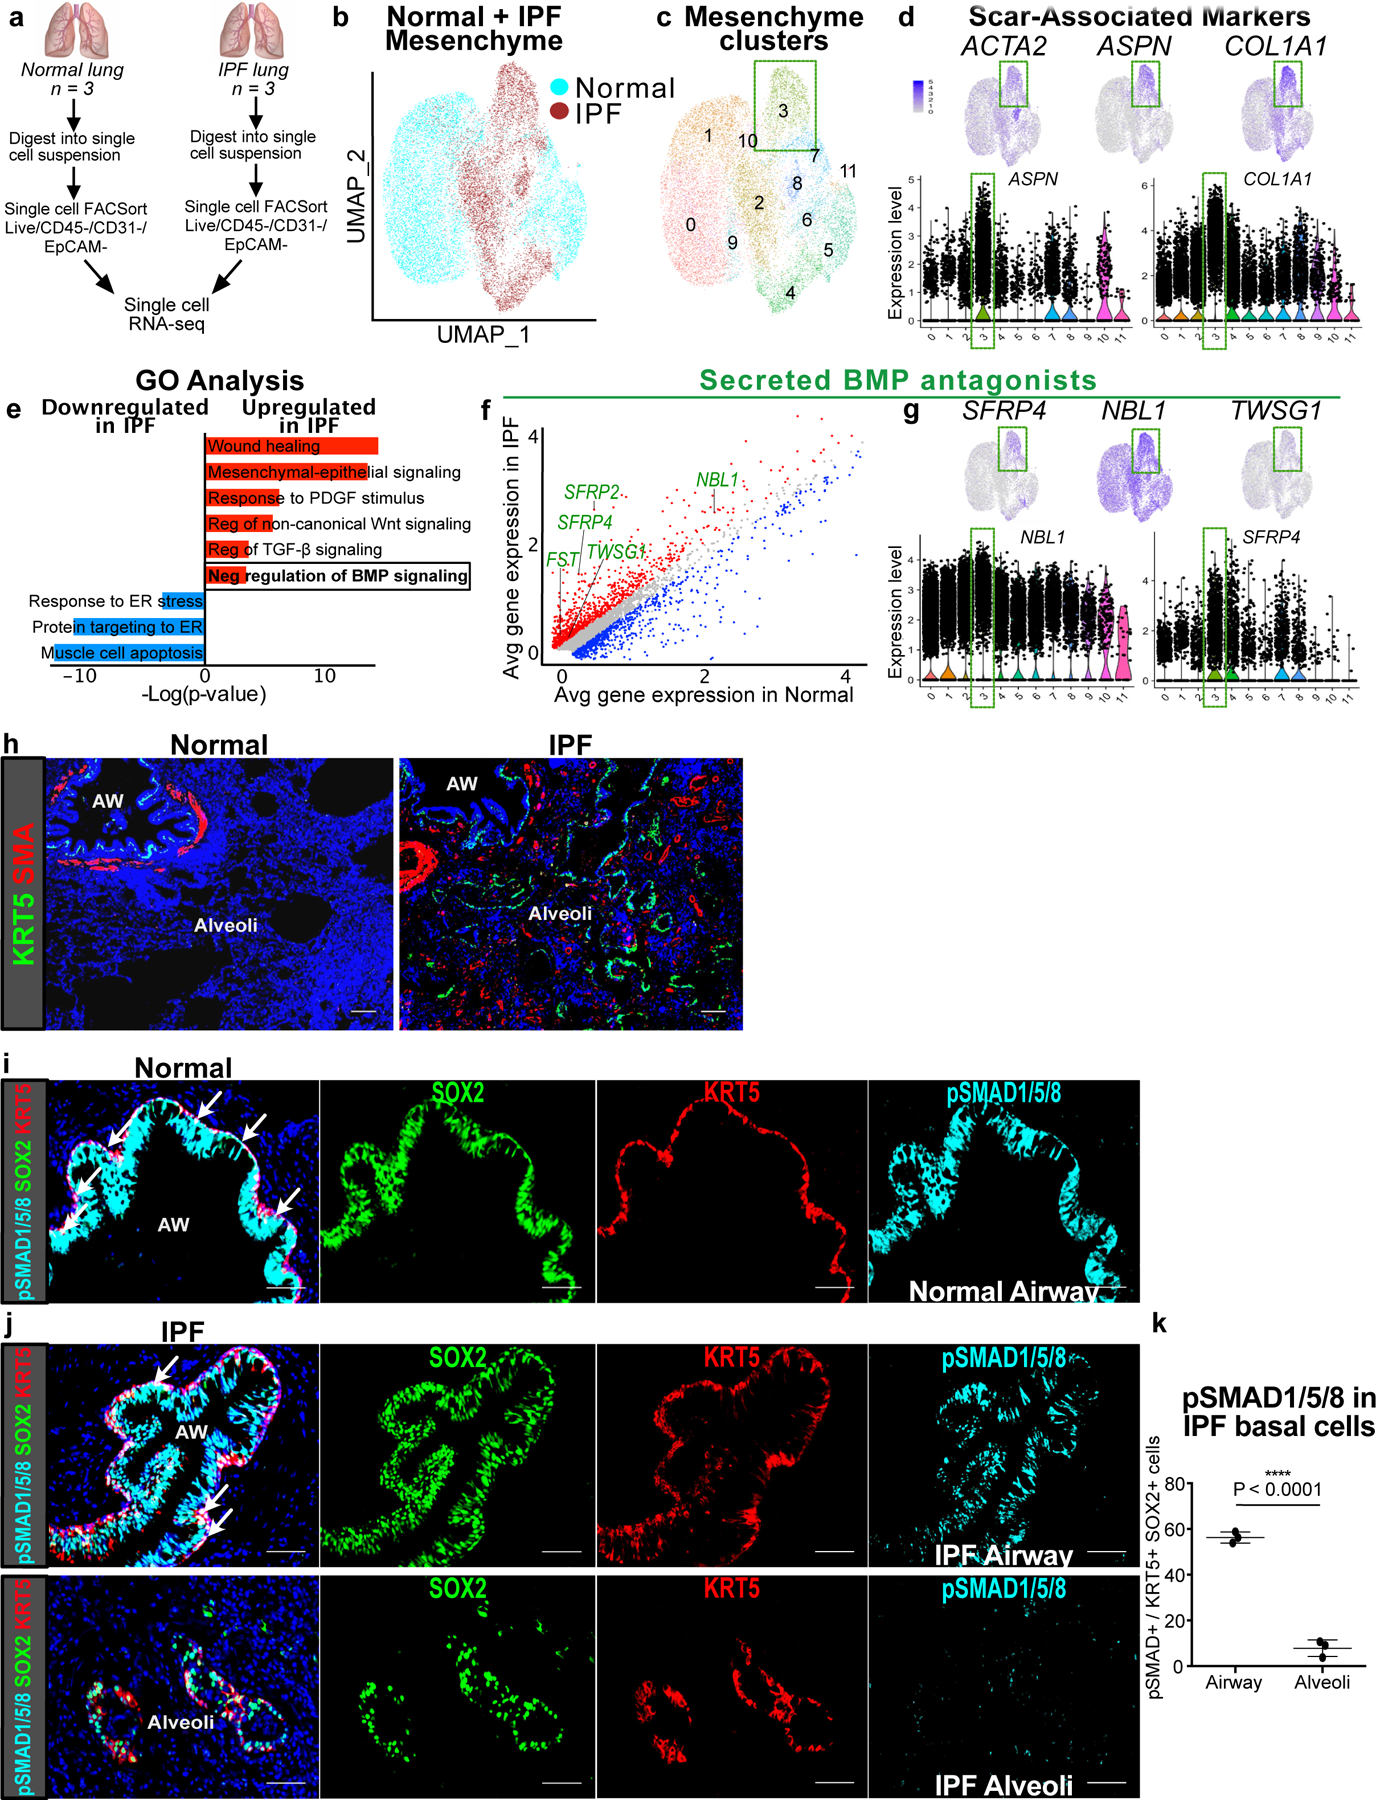
(a) Workflow to isolate mesenchymal cells from explanted IPF lungs and normal donor lungs for single cell RNA-seq analysis (n = 3 per group).
(b) UMAP plot with cells of origin based on disease state (IPF vs. normal) shows distinct cellular populations that emerge in the fibrotic state.
(c,d) UMAP, gene feature, and violin plots of cluster 3 and scar-associated genes such as myofibroblast differentiation markers, ACTA2 and ASPN, and scar matrix component, COL1A1. Each black dot represents one cell. The violin bodies represent distribution of the cells (n = 17,602 cells).
(e) GO term analysis of differentially-expressed genes between IPF and normal lung mesenchyme shows enrichment for genes involved in negative regulation of BMP signaling (P-adj = 2.04E-02; MAST test).
(f) Gene correlation plot with genes significantly upregulated in IPF in red (P-adj < 0.1, logfc >0.15; MAST test) and downregulated in blue (P-adj < 0.1, logfc <−0.15; MAST test). Secreted BMP antagonists (GO term: negative regulation of BMP signaling) are labeled in green.
(g) Expression of BMP antagonists in scar-associated cluster 3.
(h) Histology of normal and IPF lungs shows the metaplastic presence of KRT5+ pods and SMA+ fibroblastic foci in the alveoli in IPF. This experiment was repeated independently twice with similar results.
(i) pSMAD1/5/8 staining of normal distal airway shows uniform co-localization with SOX2 and KRT5 at the base of the pseudostratified epithelium. This experiment was repeated independently twice with similar results.
(j) Top: pSMAD1/5/8 staining of distal airway from IPF lung shows co-localization with SOX2. Bottom: pSMAD1/5/8 staining in the metaplastic SOX2+/KRT5+ basal cells in the alveoli. This experiment was repeated three times independently with similar results.
(k) pSMAD1/5/8 staining in the alveolar SOX2+/KRT5+ basal cells relative to their airway counterpart in IPF lungs (n = 3 samples; same sample was analyzed in the airway and alveolar region; one-tailed unpaired Student’s t-test). Data are expressed as mean ± SD.
Scale bars, 100 µm.
Histological analysis of IPF lungs demonstrates areas of intense scarring in the alveoli, marked by the presence of SMA+ fibroblastic foci, which are often localized adjacent to metaplastic KRT5+ cells, neither of which are present in the normal alveoli (Fig. 7h). Similar to mouse, metaplastic KRT5+ basal cells in the alveoli of IPF lungs co-label with SOX2, along with KRT14, NGFR, and p63 (ED Fig. 9b), which are normally markers of airway differentiation in the human lung as well25. Cell-to-cell distance quantification of metaplastic SOX2+/KRT5+ cells in the alveoli demonstrates that they are equally proximate to the SMA+ fibroblastic foci when compared to the endogenous SFTPC+ epithelium (ED Fig. 9c,d).
Unlike the mouse lung, KRT5+ basal cells extend more distally in the normal human airway, lining the basal side of the pseudostratified epithelium of the distal airways6. Analysis of pSMAD1/5/8 shows intense staining in the airway epithelium of normal lungs, including uniform expression in the KRT5+ basal cells (Fig. 7i). However, in the IPF lungs, the airway epithelium appears dysplastic, with overgrowth of the SOX2+ epithelium and non-uniform distribution of pSMAD1/5/8 staining within the disorganized KRT5+ basal cell layer (Fig. 7j). Furthermore, metaplastic SOX2+/KRT5+ basal cells in the alveoli demonstrates a significant reduction in pSMAD1/5/8 staining compared to their airway counterparts (Fig. 7j,k), similar to what we observed in the mouse (ED Fig. 7a,b). Finally, unsorted epithelial organoids were cultured from dissociated IPF lungs and treated with BMP4, which significantly attenuated the growth of KRT5+ organoids (ED Fig. 9e,f). This suggests that BMP activation can either attenuate KRT5+ basal cell proliferation, or reduce differentiation into KRT5+ basal cells from a precursor population not yet identified in human lung. This data shows that the fibroblastic scars in IPF upregulate BMP antagonism in the local environment, concurrent with a downregulation of BMP activation in metaplastic KRT5+ cells that appears to be a conserved feature of epithelial metaplasia in lung fibrosis.
Discussion
The ectopic appearance of mature epithelial cell types under pathological settings (i.e. metaplasia) is a feature of chronic wounds that often appears at tissue transition zones1. Our study demonstrates how a putative MSC population (Gli1+ mesenchymal cells) that contributes to scarring can form a pathological niche to promote epithelial metaplasia, providing a functional link between two commonly observed pathological phenomena in organ fibrosis. Utilizing temporally and spatially-precise in vivo manipulation and ex vivo cellular modeling, we show that Gli1+ mesenchyme integrates Hh activation to modify the extracellular BMP environment, which in turn regulates the metaplastic fate of adjacent airway progenitors in fibrotic repair (ED Fig. 10).
Hh and BMP are key developmental morphogens that often form activation gradients in an antiparallel orientation to generate asymmetric patterning. Cells in the developing foregut and neural tube sense the local balance between Hh and BMP activation that specifies ventral (Hh predominant) vs. dorsal (BMP predominant) fate23. While mutual antagonism between Hh and BMP is crucial for morphogenesis, questions remain as to whether and how the two pathways continue to interact in adult tissues during maintenance and repair. In the respiratory system, it has been reported that BMP antagonists are upregulated after injury to the tracheal epithelium, and inhibition of BMP drives basal cell proliferation26,27. Our single cell data shows that Gli1+ mesenchyme is the key source of numerous soluble BMP antagonists, along with BMP ligands that are expressed in the mesenchyme and other cell types. This suggests a cellular microenvironment in the adult lung where the balance between BMP ligands and soluble antagonists is tightly regulated, and Hh controls the secretion of BMP antagonists in Gli1+ mesenchymal cells to modulate the state of local BMP activation. We have previously shown that Hh maintains airway mesenchymal cell identity15, but what is surprising about our new data is that Hh also appears to promote airway epithelial cell fate in trans by driving BMP antagonism in the fibrotic progenitor niche. This suggests a mechanism where Hh and BMP continue to compete in adult tissues to segregate compartmental identity during regeneration, by acting through a mesenchymal effector that modifies epithelial cell fate.
Over-activation of Hh has been reported in patients with IPF28–30, but pharmacologic inhibition of the pathway has produced mixed results in experimental models of lung fibrosis31,32. The overwhelming endpoints of these experimental fibrotic studies have been the reduction of scarring, as measured by collagen content in the lungs as a therapeutic endpoint. However, our study demonstrates that epithelial metaplasia is an equally important endpoint in lung fibrosis. We found that administration of rhBMP4 is able to promote the repletion of the alveolar epithelium with endogenous SFTPC+ type 2 cells, which also improved gas exchange as seen in the improved oximetry. While the cellular origin of the ectopic KRT5+ basal cells in human IPF remains unclear, the downregulation of BMP activation in the ectopic alveolar KRT5+ basal cells compared to airway KRT5+ basal cells suggests that BMP could regulate the “bronchiolization” of alveoli, supported by previous studies demonstrating an upregulation of BMP antagonists in lung fibrosis33–35. Our study highlights the need for other physiologically-relevant endpoints in experimental fibrosis studies, and suggest that epithelial metaplasia presents both an attractive therapeutic target as well as a clinical endpoint for tissue fibrosis.
Methods
Animal Studies
All animals were housed and treated in compliance with the Institutional Animal Care and Use Committee (IACUC) protocol approved at the University of California, San Francisco. Mice were housed under pathogen-free conditions at room temperature, maintained under standard 12 hour light/dark cycle, and monitored daily by caretakers or researchers. Cage, bedding, and food was changed biweekly. C57BL/6 mice were obtained from Charles River Laboratories. Generation and genotyping of the Gli1EGFP, Gli1creERT, UbccreERT2, Sox2creERT, Scgb1a1creERT, p63creERT, SFTPCcreERT, KRT5creERT, Smoflox, Gli1LacZ, R26SmoM2, R26EYFP, R26tdTomato, R26mTmG, R26Confetti, and R26DTA lines were performed as previously described by The Jackson Laboratory. For all animal experiments, 6–12 week old littermate male and female mice were gender balanced and randomly assigned to experimental groups. Mice used in experiments were not involved in previous procedures.
Animal Treatment
For lineage tracing studies, tamoxifen (Cat#T5648; Sigma-Aldrich) was dissolved in corn oil and administered intraperitoneally at 200 mg/kg body weight per day for five consecutive days, followed by at least 7 days before bleomycin was administered. For bleomycin injury, mice were given pharmaceutical grade bleomycin (Hospira) dissolved in PBS via intranasal installation once a week for four weeks. Mixed background mice were given a dose of 1 U/kg and C57BL/6 background mice were given 0.75 U/kg per dose. Mice were sacrificed seven days after the final treatment. For BMP4 treatment, mice were treated with 5 µg/mL of human recombinant BMP4 protein in 50µL (Cat#314-BP-010; R&D Systems) via intranasal installation twice a week for four weeks, concurrently with bleomycin injury. Mice were sacrificed seven days after the final bleomycin treatment and two days after the final BMP4 treatment.
Human Lung Tissue
Studies involving human tissue were approved and performed in compliance with the UCSF Institutional Review Board. IPF lungs were obtained from patients independently diagnosed with interstitial pneumonia or scleroderma at the time of lung transplant. Sex and age matched healthy human lungs were provided by the Northern California Donor Network from brain-dead donors in which the lung was independently rejected for transplantation. All subjects provided written informed consent. Samples were collected from all ethnic groups, both male and female patients, and all samples were from patients over 50 years old. Investigators were blind to patient information besides relevant history of lung disease. No patient recruitment was performed for this study.
Histology and Immunofluorescence
The right ventricle of the mice were perfused with 1–3 mL PBS and the lungs were inflated with 1–3 mL 4% paraformaldehyde (PFA) in PBS, and then fixed in 4% PFA overnight at 4 ºC. After fixation, the lungs were washed with cold PBS 4 times for 30 minutes each at 4 ºC, and then dehydrated in a series of increasing ethanol concentration washes (30%, 50%, 70%, 95% and 100%) for a minimum of 2 hours per wash. The dehydrated lungs were incubated with xylene for 1 hr at RT and then with paraffin at 65 ºC for 90 minutes twice, and then embedded in paraffin. The lungs were sectioned at 8 µm on a microtome.
For histologic analysis of organoid assays, transwells were fixed in 4% PFA overnight at 4 ºC, then washed in PBS overnight at least three times. Transwells were cut and embedded in OCT, then 8 µm sections were cut on a cryostat.
For immunofluorescent staining, paraffin sections were incubated in xylene for 10 minutes twice, then rehydrated in ethanol washes (100% twice, 95%, 70%, 50% ethanol) for 5 minutes each. OCT embedded slides were fixed in 4% PFA at RT for 10 minutes, then washed three times with PBS. For both paraffin and OCT embedded slides, antigen retrieval (Cat#DV2004MX; Biocare Medical; Cat#322000; Advanced Cell Diagnostics) was performed for 30 minutes at 95 ºC. Slides were washed with 0.1% Tween 20 in PBS (PBST) 3 times for 5 minutes. Slides were then incubated in blocking buffer (3% donkey serum in PBST) for at least 1 hour, then incubated overnight in primary antibodies in 1% donkey serum in PBST at 4 ºC. The following primary antibodies were used for mouse tissue: chicken anti-GFP (Cat#GFP-1020; Aves Labs; used 1:250), goat anti-GFP (Cat#ab6673, Abcam; used 1:250), rabbit anti-SMA (Cat#ab5694; Abcam; used 1:200), rabbit anti-DES (Cat#ab15200; Abcam; used 1:200), goat anti-SCGB1a1 (Cat#sc-9772; Santa Cruz; used 1:500), mouse anti-SCGB1a1 (Cat#sc-390313; Santa Cruz; used 1:200), rabbit anti-SFTPC (Cat#AB3786; Millipore Sigma; used 1:2000), goat anti-SFTPC (Cat#sc-7706; Santa Cruz; used at 1:200), chicken anti-KRT5 (Cat#905901; BioLegend; used at 1:500), goat anti-SOX2 (Cat#GT15098; Neuromics; used 1:200), rat anti-RAGE (Cat#MAB1179; R&D Systems; used at 1:200), chicken anti-RFP (Cat#600–901-379S; Rockland; used 1:200), rabbit anti-RFP (Cat#600–401-379; Rockland; used 1:100), mouse anti-TubIV (Cat#ab11315; Abcam; used 1:200), rabbit anti-p63 (Cat#13109T; Cell Signaling Technology; used 1:200), rabbit anti-NGFR (Cat#ab8875; Abcam; used 1:200), mouse anti-KRT14 (Cat#CBL197; Sigma; used 1:100), and rabbit anti-p-SMAD1/5/8 (Cat#AB3848-I; Millipore Sigma; used 1:100). The following primary antibodies were used for human tissue: rabbit anti-SMA (Cat#ab5694; Abcam; used 1:200), rabbit anti-p-SMAD1/5/8 (Cat#AB3848-I; Millipore Sigma; used 1:100), chicken anti-KRT5 (Cat#905901; BioLegend; used at 1:500), goat anti-SOX2 (Cat#GT15098; Neuromics; used 1:200), goat anti-SFTPC (Cat#sc-7705; Santa Cruz; used at 1:200), rabbit anti-p63 (Cat#13109T; Cell Signaling Technology; used 1:200), rabbit anti-NGFR (Cat#ab8875; Abcam; used 1:200), and mouse anti-KRT14 (Cat#CBL197; Sigma; used 1:100). Slides were washed with PBST and then incubated for 1 hour at RT in secondary antibodies diluted in PBST. The following secondary antibodies were used at 1:250: Donkey anti-Chicken IgG (H+L) Alexa Flour 488 (Cat#703–545-155; Jackson ImmunoResearch), Donkey anti-Rabbit IgG Alexa Flour 555 (Cat# A-31572; Thermo Fisher), Donkey anti-Goat Alexa Flour 647 (Cat# A-21447; Thermo Fisher), Donkey anti-Rat DyLight 488 (Cat#SA5–10026; Thermo Fisher), and Donkey anti-Mouse IgG Alexa Flour 555 (Cat# A-31570; Thermo Fisher). DAPI (0.2 µg/mL) (Cat#1738176; Thermo Fisher) was added for 5 minutes, and slides were then mounted with TrueBlack to reduce background and Fluorosave to maintain fluorescence.
Lung digestion and Fluorescence Activated Cell Sorting (FACS)
For mouse, whole lung was dissected from adult animals and tracheally perfused with a digestion cocktail of Collagenase Type I (Cat#17100017; Thermo Fisher; used 225 U/mL), Dispase II (Cat#17105041; Thermo fisher; used 15 U/mL) and Dnase I (Cat#DN25; Sigma-Aldrich; used 50 U/mL) and removed from the chest. The lung was further diced with a razor blade and incubated in digestion cocktail for 45 mins at 37 ºC with continuous shaking. The mixture was then washed with sorting buffer (2% FBS and 1% Penicillin-Streptomycin in DMEM (Cat#31053028; Thermo Fisher)). The mixture was passed through a 70 µm cell strainer and resuspended in RBC lysis buffer (Cat#NC9067514; Thermo Fisher), then passed through a 40 µm cell strainer. Cell suspensions were incubated with the appropriate conjugated antibodies in sorting buffer for 30 min at 4 ºC and washed with sorting buffer. FACS sorting was performed on a BD FACSAria II using FACSDiva software. Doublets and dead cells were excluded based on forward and side scatter and DRAQ7 (Cat#7406S; Cell Signaling Technologies) fluorescence, respectively. Immune and endothelial cells were excluded using CD45 (Alexa Flour 700; Cat#560510; BD; used 1:200; clone 30-F11) and CD31 (APC/Fire750; Cat#102528; BioLegend; used 1:200; clone MEC13.3), respectively. For Gli1EGFP and Gli1creERT2/+:R26YFP/YFP sorting, epithelial cells were also excluded using CD326 (BV421; Cat#563214; BD; used 1:200; clone G8.8), then Gli1 cells were sorted using endogenous GFP fluorescence. For ITGB4 sorting, cells were selected for CD326 and then CD104 (PE; Cat#123610; BioLegend; used 1:100 or Alexa Flour 647; Cat#123608; BioLegend; used 1:75; clone 346–11A). Cells were sorted into sorting buffer. Analysis was performed using FlowJo v10 software.
For human, multiple pieces were collected from whole lungs and separated into smaller pieces for a total of approximately 1 gram. Tissue was cut with scissors and resuspended in a digestion cocktail of 0.25% Collagenase A (Cat#SCR136; Millipore Sigma), Dispase II (Cat#17105041; Thermo fisher; used 15 U/mL) and Dnase I (Cat#DN25; Sigma-Aldrich; used 50 U/mL) in RPMI (Cat#R7388; Millipore Sigma). The tissue was digested at 37 ºC for 1 hour with intermittent resuspension. Cells were passed through a 100 µm cell strainer, washed with PBS, and resuspended in 0.5% BSA in PBS. Single cells were selected and mesenchymal cells were sorted using the following gating strategy: DAPI-, CD31- (PE/Cy7; Cat#303118; BioLegend; used 1:200; clone WM59), CD45- (APC; Cat#304037; BioLegend; used 1:200; clone HI30), CD326- (FITC; Cat#324204; BioLegend; used 1:200; clone 9C4), and CD235a- (APC/Cy7; Cat#349116; BioLegend; used 1:200; clone HI264).
Single Cell Capture and Sequencing
For mouse scRNA-seq, all live Gli1 Lin+ cells were sorted from two Gli1creERT/+:R26YFP/YFP adult lungs. Gli1 Lin+ cells were isolated based on forward and side scatter, DAPI exclusion, and GFP fluorescence. One mouse was challenged with repetitive bleomycin and one was treated with PBS at the same timepoints as a control. The sorted Gli1 Lin+ cells from each animal were separately resuspended in 50 µL PBS with 0.04% BSA at 1,000 cells/µL. For human scRNA-seq, sorted (live, CD31-, CD45-, CD326-, CD235a-) healthy and IPF mesenchymal cells were resuspended in 0.05% BSA in PBS. Cells were loaded onto a single lane per sample into the Chromium™ Controller to produce gel bead-in emulsions (GEMs). GEMs underwent reverse transcription for RNA barcoding and cDNA amplification, with the library prepped using the Chromium Single Cell 3’ Reagent Version 2 kit. Each sample was sequenced in 1 lane of the HiSeq2500 (Illumina) in Rapid Run Mode.
Cell Culture
For UbccreERT2/+:R26SmoM2/+ mesenchymal cells, lung was digested as above and then cultured on gelatin-treated tissue culture plates in DMEM/F-12 (Cat#11330032; Thermo Fisher) with 10% FBS and 1% Penicillin-Streptomycin. Media was refreshed every other day and primary lung mesenchymal cells were maintained for no more than five passages. The UbccreERT2/+:R26SmoM2/+ mesenchymal cells were treated with vehicle or 1 µg/ml 4-OH-tamoxifen (4OHT) (Cat#579002; Millipore Sigma) for 72 hrs. When used for organoid assays, 4OHT treatment occurred for 72 hours immediately prior to co-culture with epithelium. Where applicable, cells were treated with vehicle or 4 ng/mL TGF-β1 (Cat#100–21; PeproTech) for 72 hours.
Organoid Assay
Adult mouse lungs were FACS sorted for ITGB4+ epithelial progenitor cells and Gli1+ or Gli1 Lin+ mesenchymal cells. The trachea was dissected and removed from the lung prior to lung digestion and FACS sorting. ITGB4+ epithelial cells and Gli1 mesenchymal cells were co-cultured (1.5x10⁴ epithelial cells : 5x10⁴ mesenchymal cells/well) in a modified MTEC media diluted 1:1 in growth factor reduced matrigel (Cat#CB-40230A; Thermo Fisher). Modified MTEC culture media (Cat#CC-3118; Lonza) is comprised of small airway basal media (SABM) with selected components from SAGM bullet kit including Insulin, Transferrin, Bovine Pituitary Extract, Retinoic Acid, and human Epidermal Growth Factor. 0.1 µg/mL cholera toxin (Cat#C8052; Sigma Aldrich), 5% FBS, and 1% Penicillin-Streptomycin were also added to the media. Cell suspension-matrigel mixture was placed in a transwell and incubated in growth media with 10 µM ROCK inhibitor (Cat#72252; STEMCELL Technologies) in a 24 well plate for 48 hours, after which the media was replenished every other day (lacking ROCK inhibitor). Each experimental condition was performed in triplicates. Where applicable, recombinant BMP4 (Cat#314-BP-010; R&D Systems; used 50 ng/mL) and GREM2 (Cat#2069-PR-050; R&D Systems; used 1.5 µg/mL) were added to the media after 48 hours and replenished in every media change. Colonies were assayed after 12–14 days.
To extract RNA from the organoid assays, cell suspension-matrigel mixtures in the transwells were washed with PBS and incubated in a digestion cocktail of Collagenase Type I (Cat#17100017; Thermo Fisher; used 225 U/mL), Dispase II (Cat#17105041; Thermo fisher; used 15 U/mL) and Dnase I (Cat#DN25; Sigma-Aldrich; used 50 U/mL) for 1 hour at 37 ºC with intermittent resuspension. The mixture was removed from the transwell and resuspended in TrypLE (Cat#12563011; Thermo Fisher) and shaken at 37 ºC for 20 minutes. Cells were resuspended in sorting buffer (2% FBS and 1% Penicillin-Streptomycin in DMEM) and blocked with rat serum (Cat#19860; STEMCELL Technologies; used 1:50) for 10 minutes at 4 ºC. Cells were then stained with biotin anti-mouse CD326 (Cat#118204; BioLegend; clone G8.8; used 1:250) for 30 minutes at 4 ºC. Streptavidin beads (Cat#19860; STEMCELL Technologies; used 1:50) were added to isolate the epithelial cells.
Quantitative RT-PCR
Total RNA was obtained from cells isolated from organoid assays or cultured primary lung fibroblasts using the PicoPure RNA Isolation Kit (Cat#KIT0204; Applied Biosystems) or the RNeasy Kit (Cat#74004; QIAGEN), following the manufacturers’ protocols. RNA from mouse lung tissue was obtained by removing the entire left lobe, homogenizing in trizol (Cat#15596018; Thermo Fisher), and extracting RNA using the E.Z.N.A Total RNA Kit (Cat#R6834–01; Omega Bio-Tek) following manufacturer instructions. cDNA was synthesized from total RNA using the SuperScript Strand Synthesis System (Cat#18080044, Cat#100000840; Thermo Fisher). Quantitative PCR was performed using the SYBR Green system (Cat#F415L; Thermo Fisher). Primers are listed in Supplementary Table 1. Relative gene expression levels after qRT-PCR were defined using the ∆∆Ct method and normalizing to GAPDH.
RNAscope In Situ Hybridization
Paraffin-embedded lung sections were processed for RNA in situ detection of Fbln2 (Cat#447931; Advanced Cell Diagnostics), Npnt (Cat#316771; Advanced Cell Diagnostics), and Shh (Cat#600951; Advanced Cell Diagnostics) using the RNAscope Multiplex Fluorescent Reagent Kit v2 (Cat#323100; Advanced Cell Diagnostics) according to the manufacturer’s instructions.
Pulse Oximetry
The MouseOx Pulse Oximeter system (STARR Life Sciences) was used to measure arterial oxygen saturation from awake mice on the day of sacrifice. Mice were shaven prior to measurement. Mice were measured at 5 measurements per second for at least 5 minutes and at least 10 successful readings. All successful measurements (error code = 0) were averaged for each mouse.
Immunofluorescence Image Quantification
Sections were imaged for quantification on a Zeiss Lumar V12 microscope. At least three samples per genotype/condition were used, and at least 4 randomly selected regions were analyzed for each sample. Cell counts for SFTPC cells were performed on Fiji using the “Cell Counter” plug-in. Five high magnification images of randomly selected alveolar regions were counted per sample. SFTPC quantification is presented as a percentage of total DAPI+ cells as previously described15. Cell counts for DAPI were performed automatically by Fiji software using the “Analyze Particles” tool. Four low magnification images of randomly selected areas were analyzed per sample. Similar anatomic locations were taken for each sample. KRT5 area was calculated automatically in Fiji, and the units presented for KRT5 quantification are µm2. For quantification by area, the image was first converted to 8 bit and the “Measure” function was used with a consistent threshold set to a minimum of 20 µm2 and maximum of infinity. pSMAD1/5/8 quantification was similarly quantified by area and presented as a percentage of DAPI+ cells. Distance quantification was performed using Imaris 8.3.1 software. Surfaces were created for each marker of interest, and distance between two surfaces was calculated using the “Big Sortomato” tool in Imaris. Every distance measurement is presented as an individual datapoint, and the units of measurement are µm. For immunofluorescent quantification of organoids, all individual organoids from at least four non-consecutive sections (four Z positions of 3D culture) of each well were analyzed. Each organoid was classified based on expression of KRT5 and SFTPC. For each well, the number of KRT5+ and SFTPC+ organoids were expressed as a percentage of total organoids analyzed. For all analyses, performer was blinded to the specimen genotype/condition during data collection and analysis. Results were averaged between each specimen and standard deviations were calculated per genotype/condition.
Single Cell RNA-Seq Analysis
To build transcript profiles of individual cells the CellRanger version 2.1.1 software with default settings was used for de-multiplexing, aligning reads with STAR software to GRCm38 for mouse genome and Hg19 for human, and counting unique molecular identifiers (UMIs). We used the Seurat R package along with a gene-barcode matrix provided by CellRanger for downstream analysis36. In total, we filtered the data in 2 different steps. We first filtered the dataset by only accepting cells that expressed a minimum of 200 genes and genes that were expressed in at least 3 cells. Our second filter was set to accept cells with less than 6000 unique gene counts and 5% mitochondrial counts. After removing unwanted cells, we used “LogNormalize” to normalize the gene expression measurements for each cell. We calculated 2,000 features that exhibit high cell-to-cell variation, which were used in principle component analysis (PCA) after scaling the data. We used the JackStrawPlot function in the Seurat package to create Scree plots and compare p-value (significance) for each principle component. We selected 10 different PCA’s for clustering of both mouse and human cells. Clustering results were visualized using the Uniform Manifold Approximation and Projection (UMAP) algorithm in the Seurat package. For mouse datasets, we further integrated the PDGFRA+ clusters from both PBS and bleo samples to compare the datasets37. Differentially expressed genes between PBS and bleo datasets were identified using a MAST test in the DEseq package in R38. RNA velocity was calculated on the integrated object using Velocyto package and RNA velocity in SeuratWrappers package in R21. For human scRNA-seq analysis, we similarly integrated the PDGFRA+ clusters from both 3 healthy controls and 3 patients with IPF, and the differentially expressed genes were identified with a MAST test. For cluster visualization and individual gene visualization on all clusters we used the UMAP function. Gene ontology enrichment analysis was performed using the PANTHER Overrepresentation test36 and entering the top differentially expressed genes with adj. p <0.1 and logfc >0.15 or <−0.15.
Statistics and Reproducibility
All statistical analyses were performed in GraphPad Prism 6.0 using unpaired one-tailed Student’s t-tests to determine the P-value. Specific P values are labeled in the plots or figure legends, where significant values are P < 0.05. Ordinary one-way ANOVA was used for multiple comparison to a control group. All data in graphs are presented as mean ± SD. No data was excluded from the analyses presented in this study. All animal studies were independently performed twice with successful replication, except for the single cell RNA-sequencing. All in vitro experiments were performed at least three times with successful replication. Three or more biological replicates were used for every study and specific n values are listed in the figure legends.
Reporting Summary
Further information is available in the Reporting Summary.
Extended Data
Extended Data Fig. 1. Epithelial progenitors expand distally in fibrotic repair.
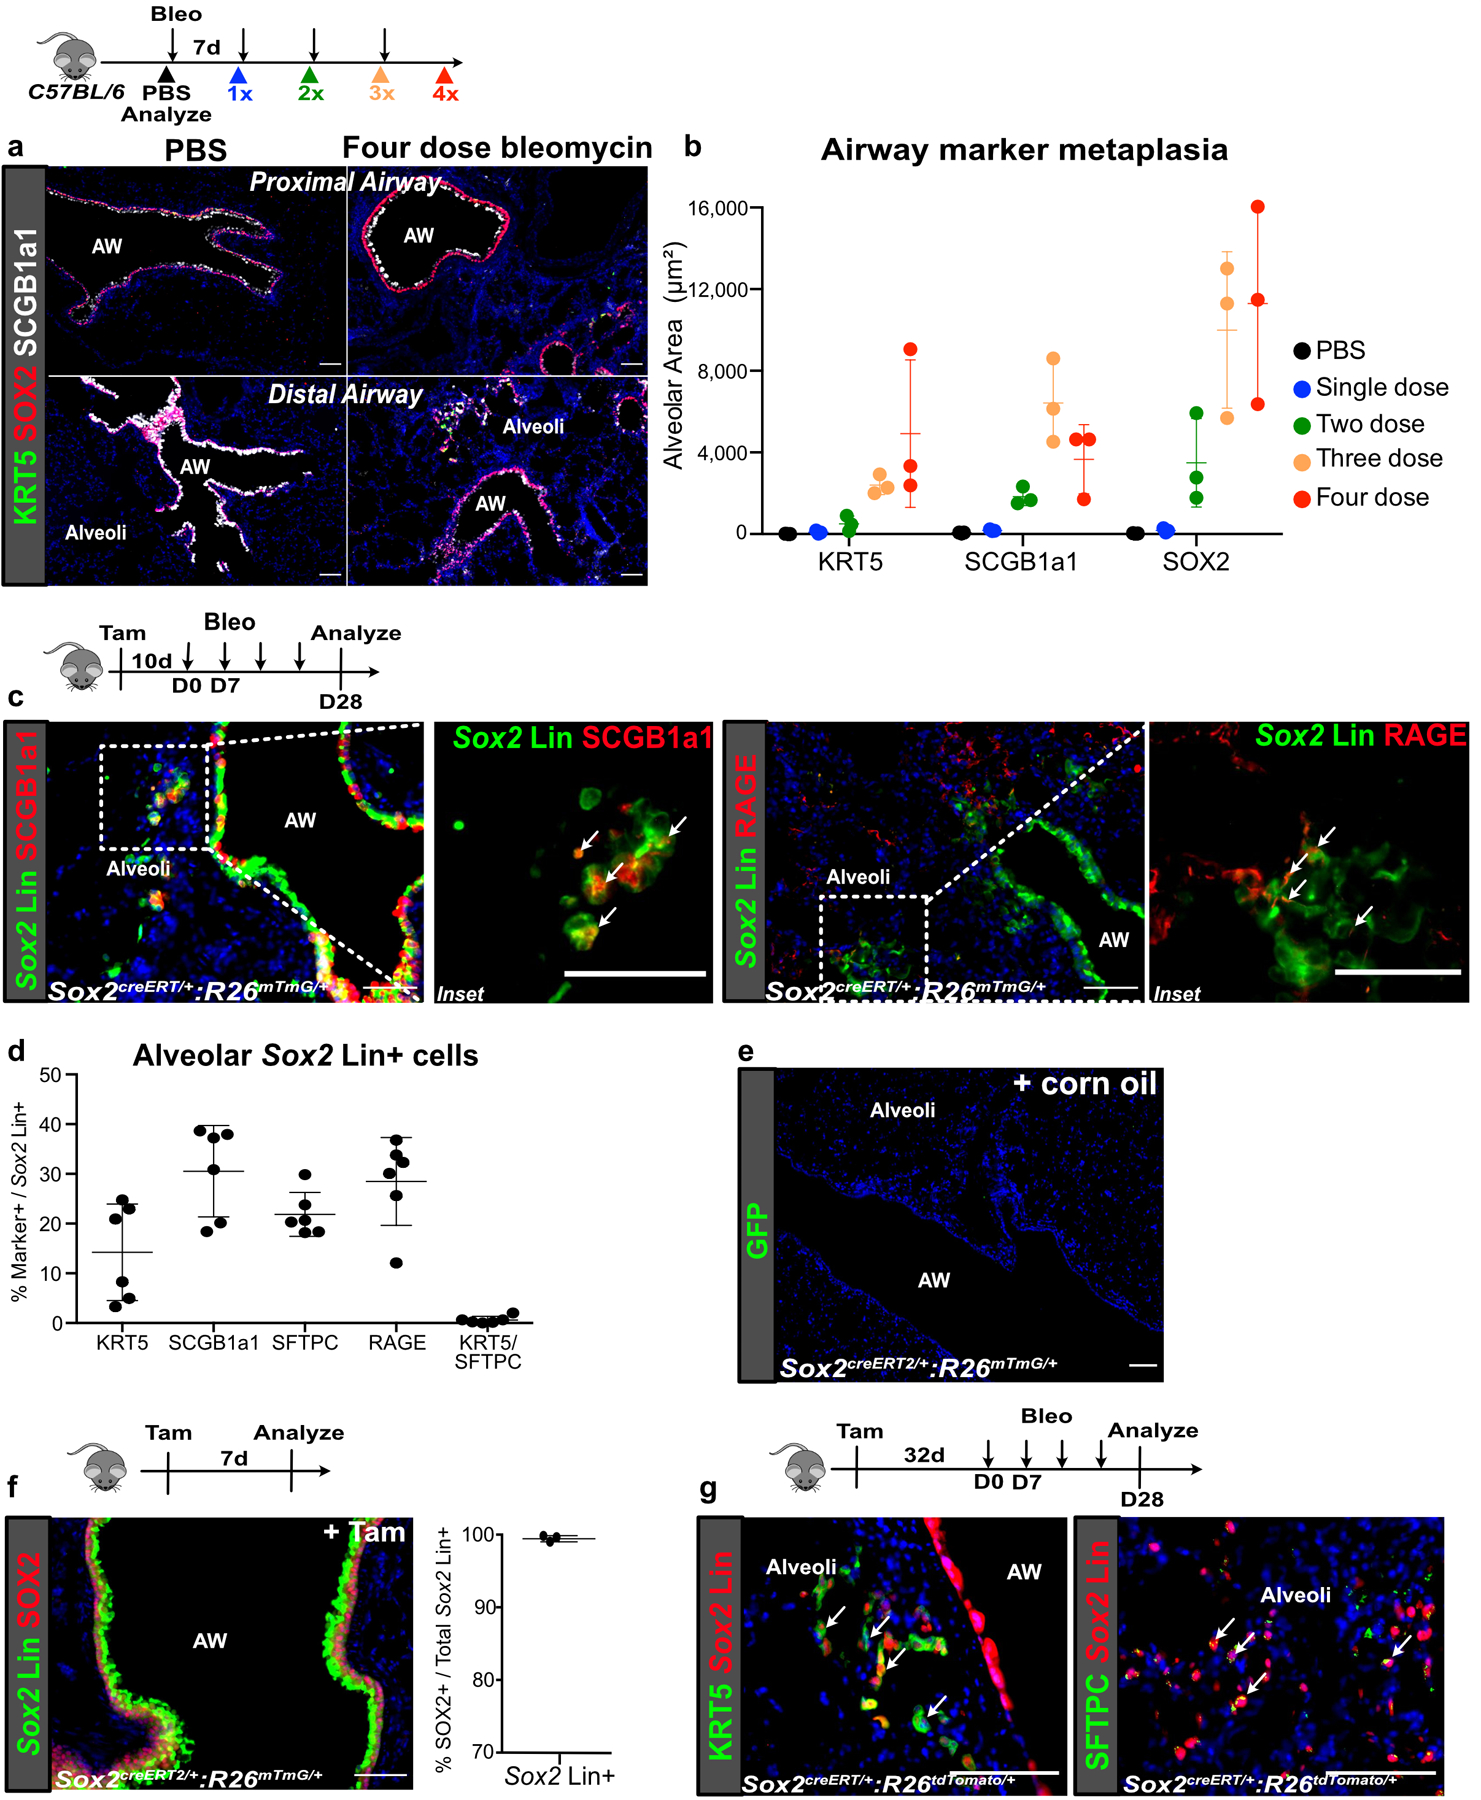
(a,b) Time course showing appearance of metaplastic airway epithelium in the alveoli after 1, 2, 3 or 4 doses of weekly bleomycin injury. (n = 3 per group; each data point represents one animal). Data are expressed as mean ± SD.
(c,d) Contribution of Sox2 Lin+ cells to the various epithelial lineages in the alveoli after bleomycin injury. (n = 6 per group; each data point represents one animal; one-tailed unpaired Student’s t-test). Data are expressed as mean ± SD.
(e) Lack of Sox2 Lin+ cells in corn oil-treated SoxcreERT2:R26mTmG lung. (2 animals)
(f) Co-localization of Sox2 Lin+ cells and SOX2 staining. (n = 3 animals). Data are expressed as mean ± SD.
(g) Extended washout after tamoxifen (>4wks) followed by bleomycin demonstrates similar expansion of Sox2 Lin+ cells into the alveoli (3 animals).
AW = airway. Scale bars, 100 µm.
Extended Data Fig. 2. Lineage tracing of diverse airway progenitors after bleomycin injury.
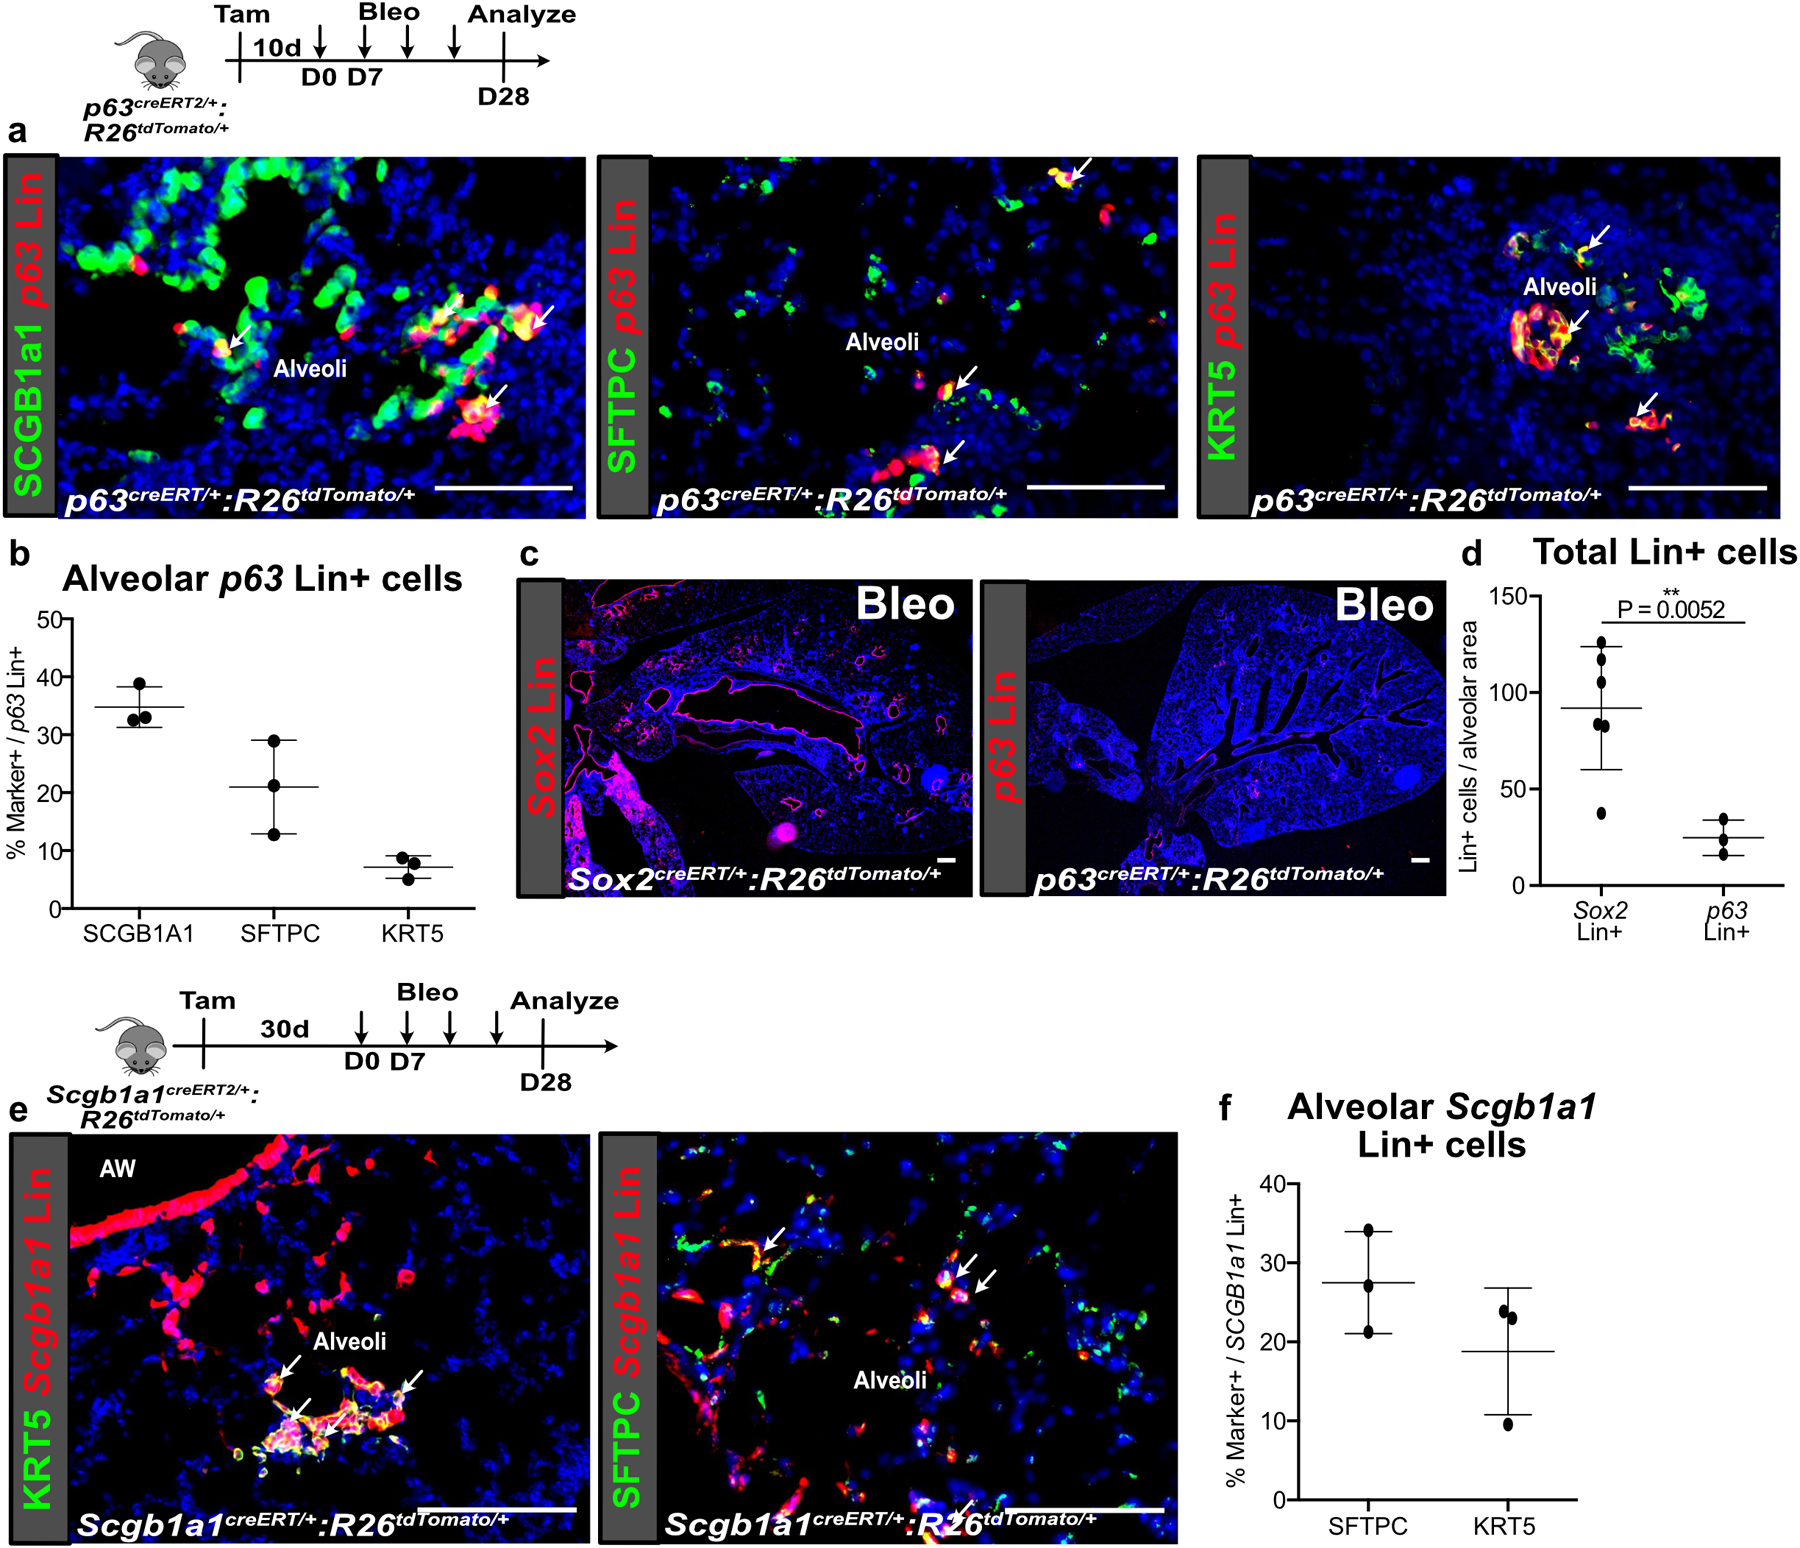
(a,b) p63 Lin+ cells also expanded into the alveoli after bleomycin but did not contribute significantly to KRT5+ basal cells in the alveoli. (n = 3 animals). Data are expressed as mean ± SD.
(c,d) Comparison of p63 Lin+ and Sox2 Lin+ cells that expand into the alveoli after bleomycin injury. (n = 3 for p63 Lin, n = 6 for Sox2 Lin; each data point represents one animal; one-tailed unpaired Student’s t-test). Data are expressed as mean ± SD.
(e,f) Contribution of Scgb1a1 Lin+ cells to the various epithelial lineages in the alveoli after bleomycin injury. (n = 3 per group; each data point represents one animal). Data are expressed as mean ± SD.
AW = airway. Scale bars, 100 µm.
Extended Data Fig. 3. Gli1 Lin+ mesenchyme expands distally in fibrotic repair.
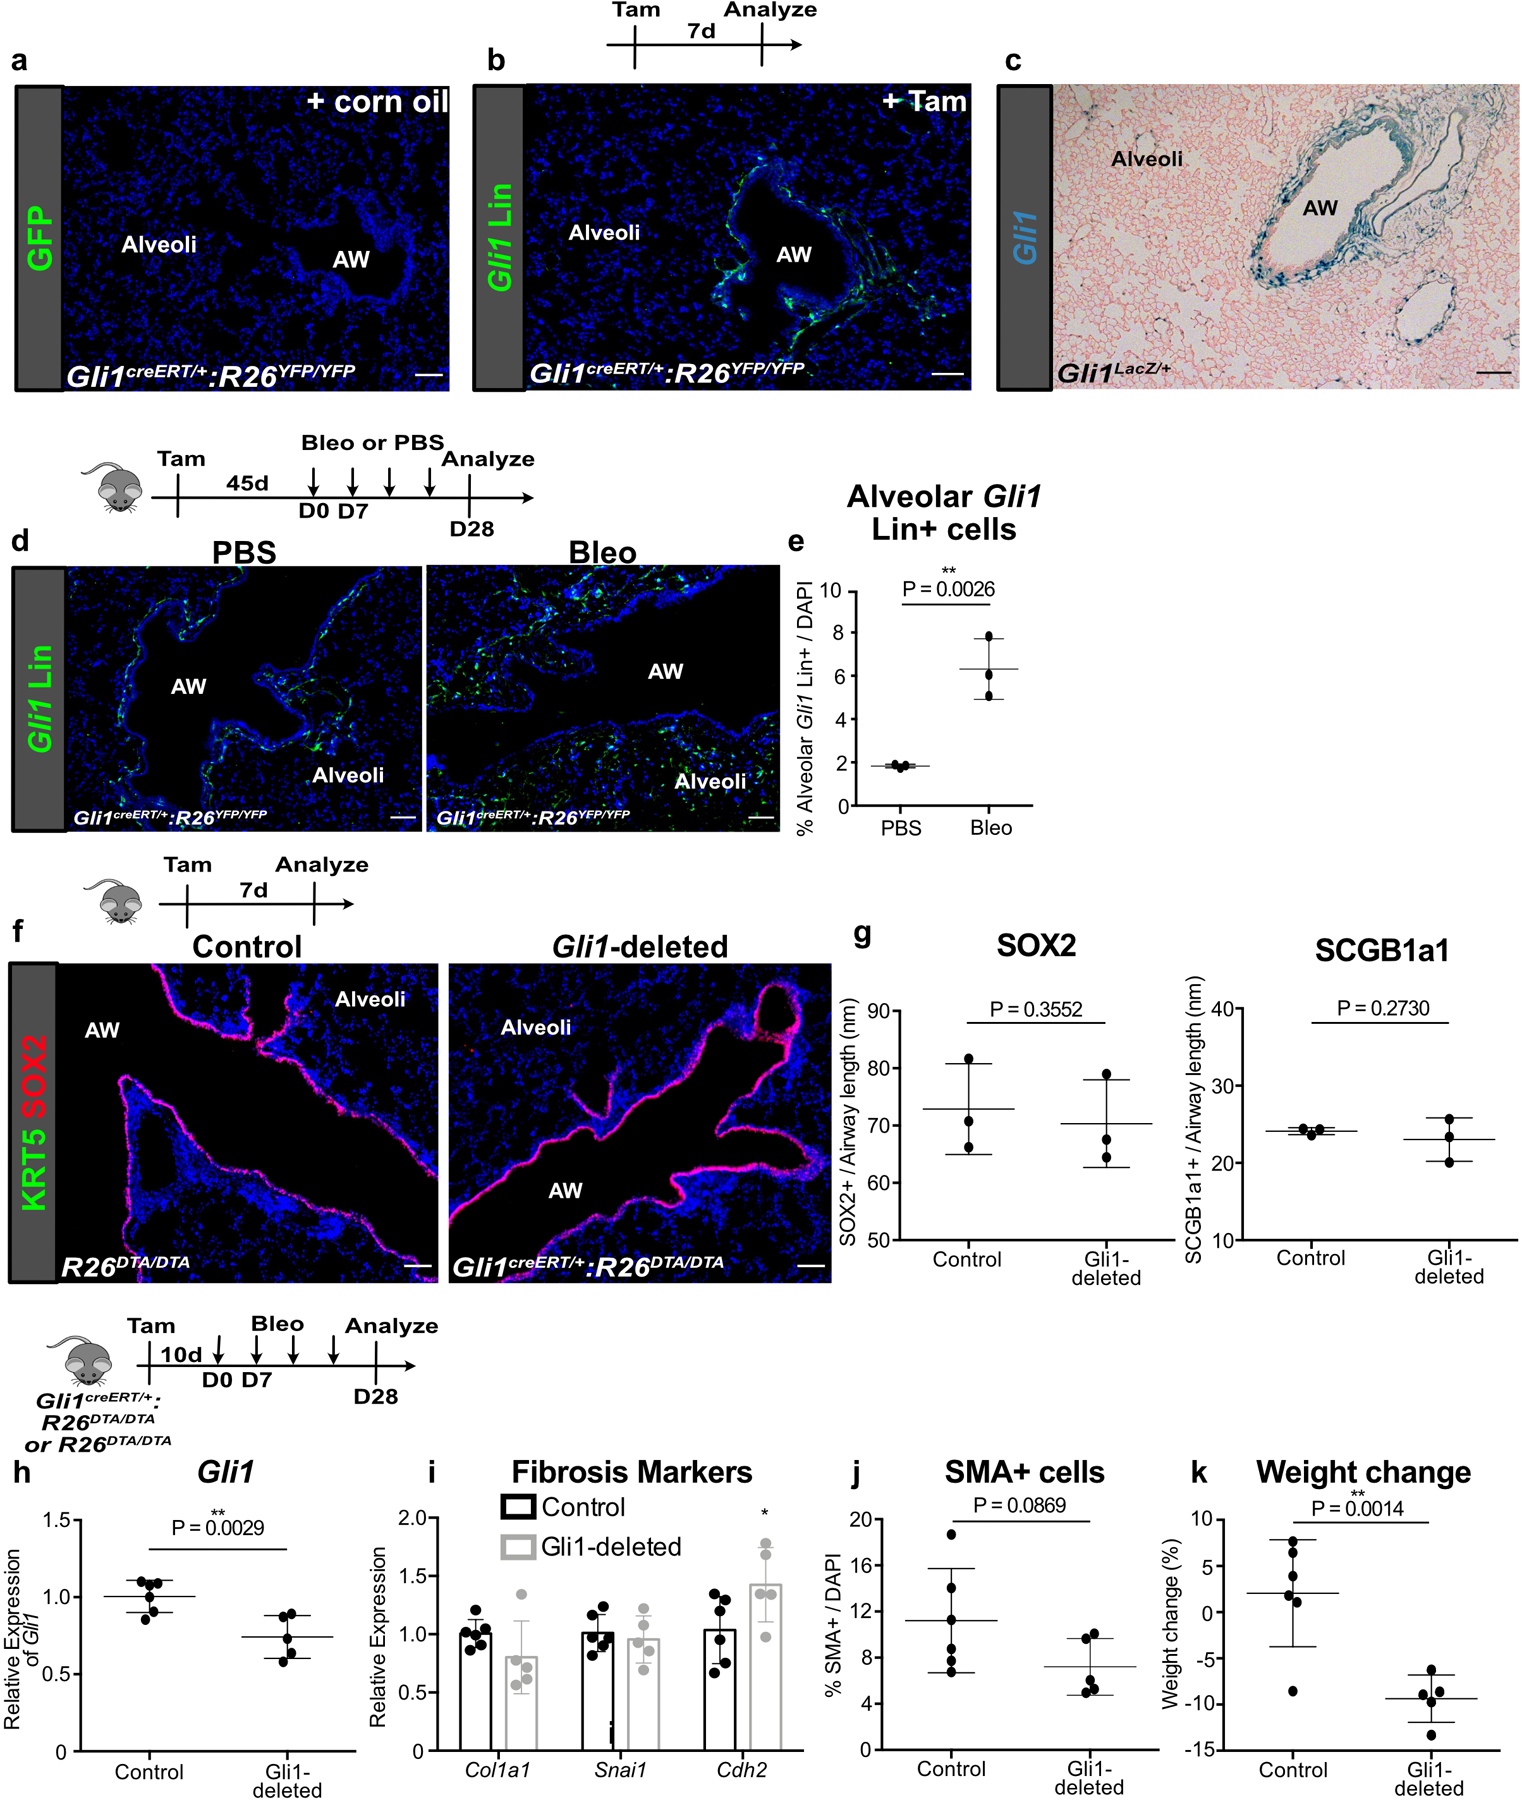
(a) Lack of Gli1 Lin+ cells in corn oil-treated Gli1creERT2:R26YFP lung (2 animals).
(b,c) Comparison of Gli1 Lin+ cell localization with Gli1+ cells in Gli1LacZ/+ lung. These experiments were each repeated three times independently with similar results.
(d,e) Extended washout after tamoxifen (>4wks) followed by bleomycin demonstrates similar expansion of Gli1 Lin+ cells into the alveoli. (n = 3 per group; each data point represents one animal; one-tailed unpaired Student’s t-test). Data are expressed as mean ± SD.
(f,g) Deletion of Gli1+ cells does not alter airway epithelial composition during normal homeostasis. (n = 3 per group; each data point represents one animal; one-tailed unpaired Student’s t-test). Data are expressed as mean ± SD.
(h-j) Gli1-deleted lungs treated with bleomycin demonstrate reduced expression of Gli1 along with changes in fibrotic markers (n = 6 for control, n = 5 for Gli1-deleted; each data point represents one animal; for (i), Col1a1 P = 0.0862; Snai1 P = 0.3126; Cdh2 P = 0.0310; one-tailed unpaired Student’s t-test for (h-j)). Data are expressed as mean ± SD.
(k) Weight loss after bleomycin injury in control and Gli1-deleted animals (n = 6 for control, n = 5 for Gli1-deleted; each data point represents one animal; one-tailed unpaired Student’s t-test). Data are expressed as mean ± SD.
AW = airway. Scale bars, 100 µm.
Extended Data Fig. 4. ITGB4+ airway progenitors give rise to KRT5+ and SFTPC+ cells that are not from pre-existing Krt5+ and Sftpc+ cells.
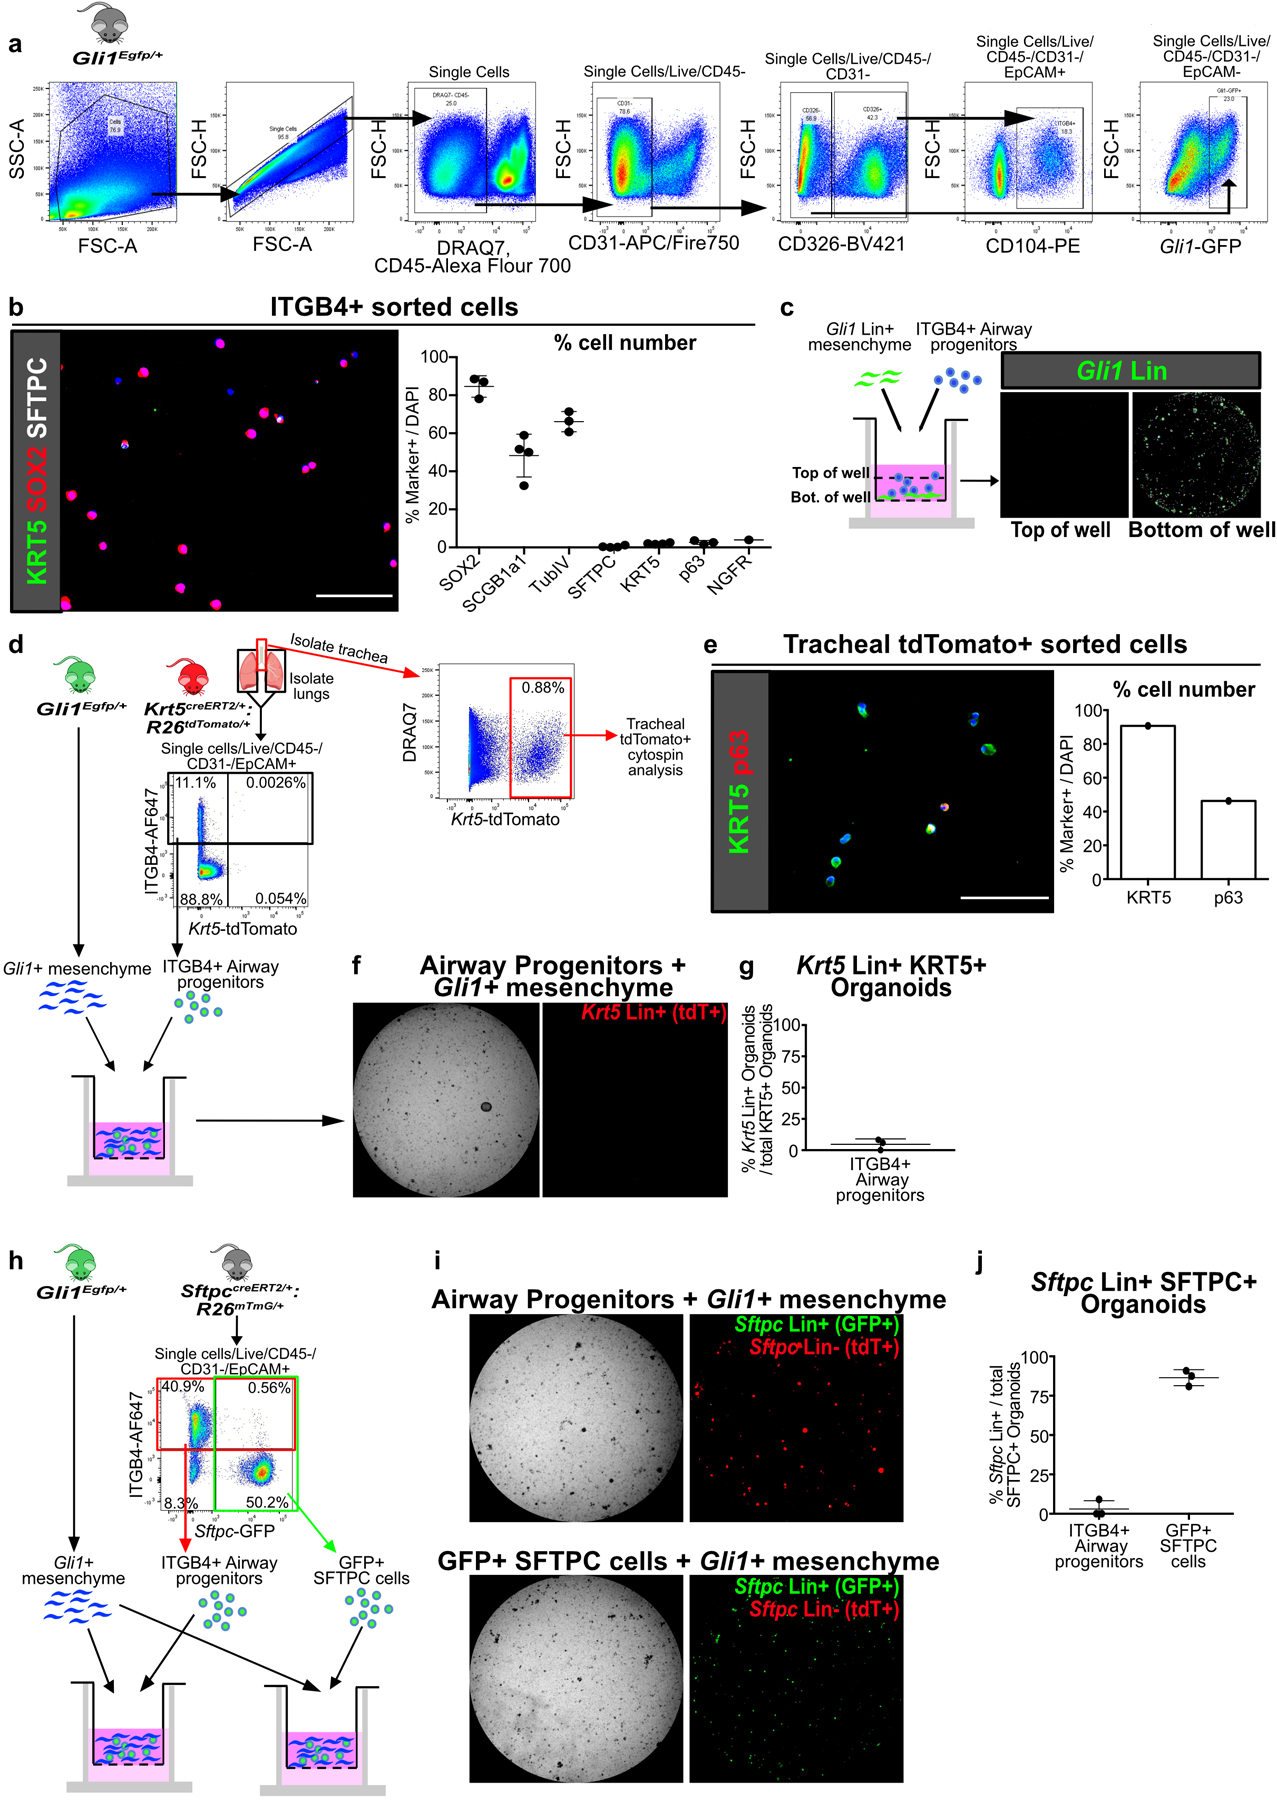
(a) Gating strategy for isolation of ITGB4+ airway progenitors and Gli1+ mesenchymal cells by FACS, presented in figures 2a,e; 3f; 5e; 6f and extended data figures 4d,h; 5h; 8g.
(b) Cytospin of freshly sorted ITGB4+ confirms that majority of cells are SOX2+, SCGB1A1+, and TubIV+, with cells rarely positive for SFTPC, KRT5, p63, or NGFR (n = 1 for NGFR, n = 3 for rest; each data point represents one biological replicate). Data are expressed as mean ± SD.
(c) Z-axis scan shows that Gli1 Lin+ mesenchyme settle to bottom of the Matrigel well.
(d-g) Lineage trace of pre-existing Krt5 Lin+ (tdTomato+) cells followed by isolation of lung for ITGB4+ airway progenitor organoid culture with Gli1+ cells. Tracheal Krt5 Lin+ cells demonstrate expression of basal cell markers KRT5 and p63 (e), while few Krt5 Lin+ cells appear in ITGB4+ cell-derived organoid isolated from the lung of the same animal (f,g). The overwhelming majority of KRT5+ cells in the ITGB4-derived organoids are Krt5 Lin-negative. (n = 3 wells for (f,g); n = 1 sample for (e)). Data are expressed as mean ± SD.
(h-j) Lineage trace of pre-existing Sftpc Lin+ (membrane GFP+) cells followed by isolation of the lung epithelium for organoid culture with Gli1+ cells. ITGB4+ (red box) or Sftpc Lin+ (green box) cells were sorted from the same lung. The overwhelming majority of SFTPC+ organoids in the ITGB4-derived organoids are Sftpc Lin-negative, while most SFTPC+ cells in the Sftpc Lin+ derived organoids are Lin+ (n = 3; each data point represents one well). Data are expressed as mean ± SD. Scale bars, 100 µm.
Extended Data Fig. 5. Characterization of Hh-activation during homeostasis and in fibrotic repair.
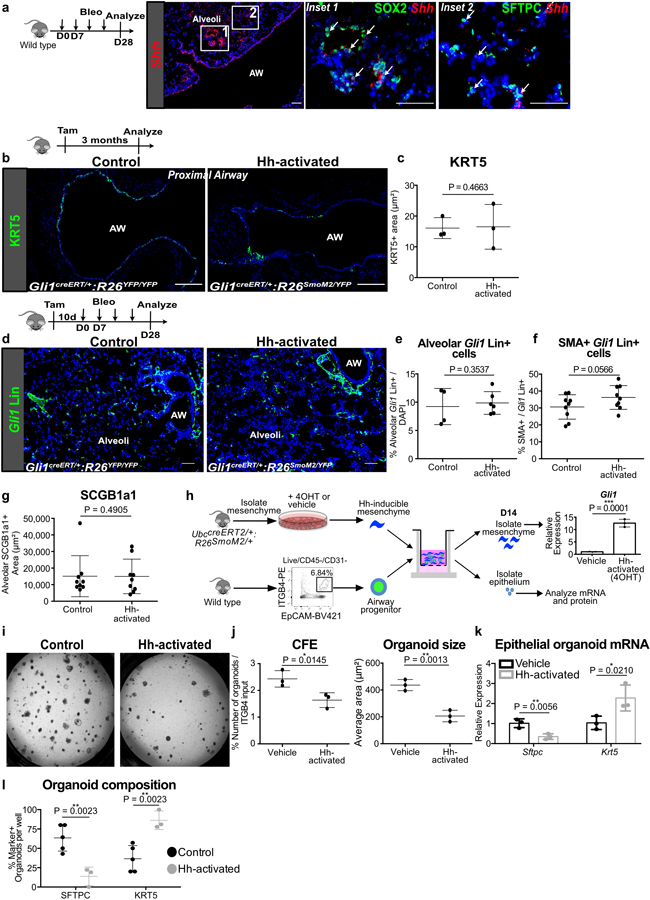
(a) RNAScope in situ of Shh shows expression in ectopic SOX2+ cells in the alveoli after bleomycin injury. This experiment was repeated independently twice with similar results.
(b,c) Histology quantification shows no evidence of KRT5+ metaplasia in Hh-activated animals without injury when compared to controls (n = 3 per group; each data point represents one animal; one-tailed unpaired Student’s t-test). Data are expressed as mean ± SD.
(d-g) After bleomycin injury, Hh-activated lungs show similar expansion of Gli1+ cells in distal alveoli compared to controls, a trend towards increased myofibroblasts (SMA+) differentiation of the Gli1 Lin+ cells in the alveoli, and no difference in ectopic SCGB1A1+ cells in the alveoli (for (e), n = 4 for control, n = 6 for Hh-activated; for (f,g), n = 9 per group; each data point represents one animal; one-tailed unpaired Student’s t-test for (e-g)). Data are expressed as mean ± SD.
(h) Model of 3D airway organoid assay using Hh-inducible mesenchyme whereby pretreatment of 4-hydroxytamoxifen (4OHT) induces Hh activation in the mesenchyme as shown by upregulation of Gli1 transcript compared to vehicle (ethanol) (n = 3 per group; each data point represents one biological replicate; one-tailed unpaired Student’s t-test).
(i-l) Mesenchymal Hh activation in vitro reduces CFE and organoid size, but increases the expression of Krt5 and number of KRT5+ organoids while reducing Sftpc expression and number of SFTPC+ organoids ((i-k) n = 3 per group; (l) n = 3 for Hh-activated, n = 5 for control; each data point represents one well; one-tailed unpaired Student’s t-test for (j-l)). Data are expressed as mean ± SD. Hh = hedgehog, 4OHT= 4-hydroxytamoxifen, AW = airway. Scale bars, 100 µm.
Extended Data Fig. 6. Expansion of Gli1 Lin+ mesenchyme into the alveoli.
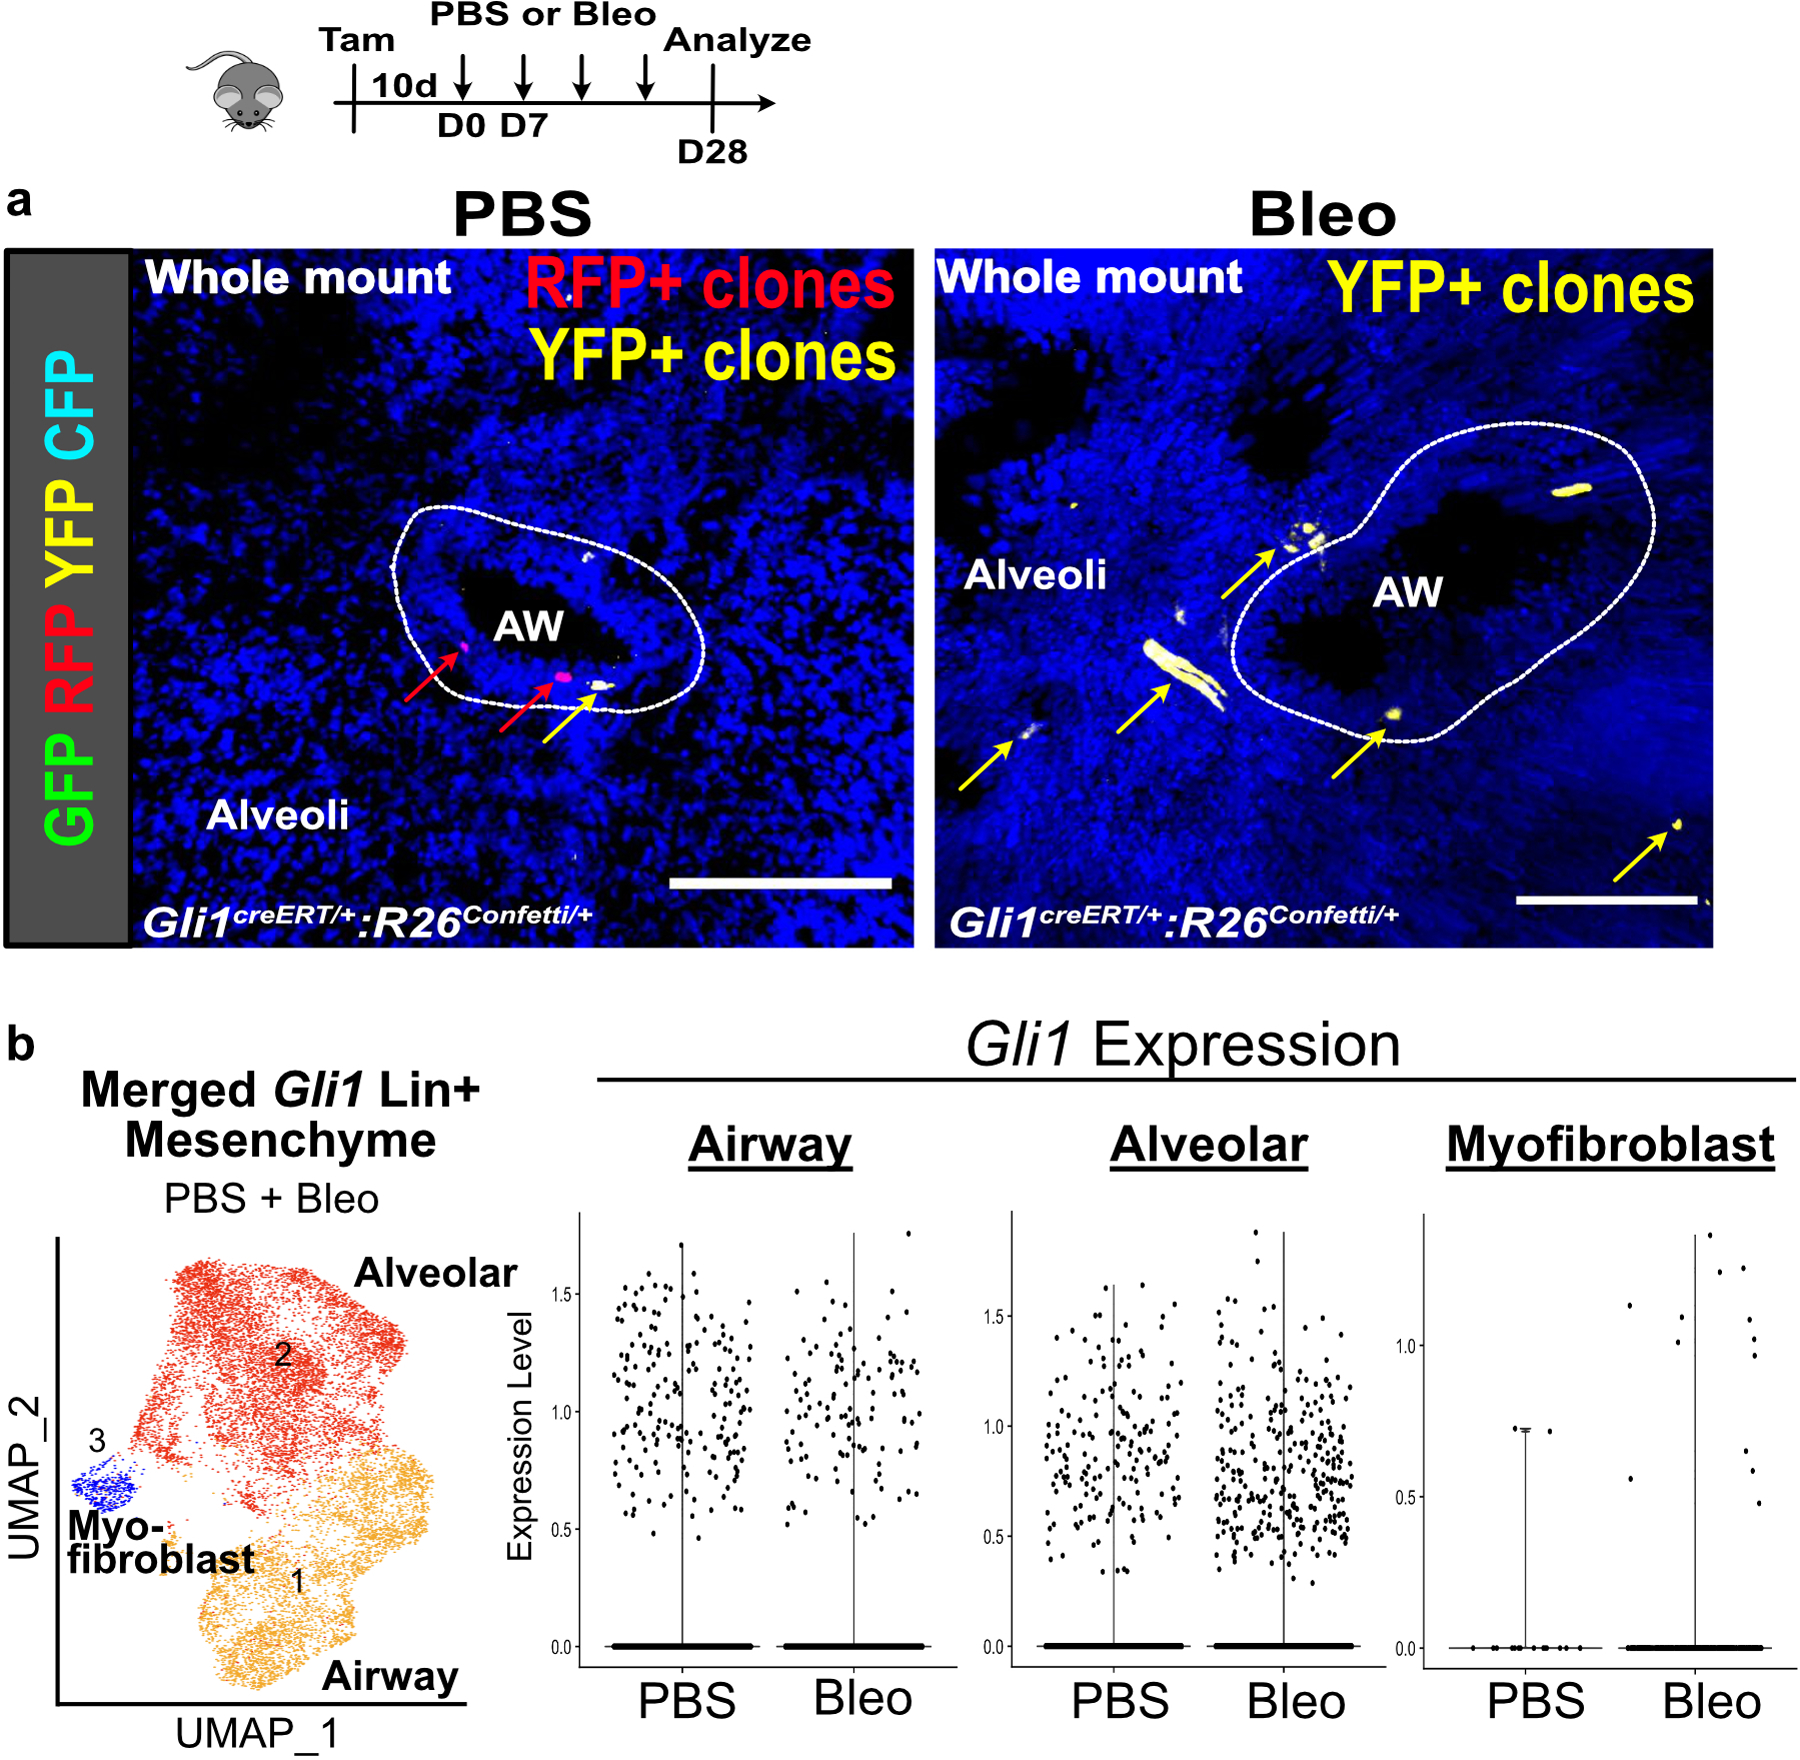
(a) Multi-color stochastic recombination of Gli1 Lin+ cells tagged with one of four possible fluorescent proteins (GFP, YFP, RFP, or CFP) shows clones of single color clustering around the airway in PBS treated lungs, and clones of single color spanning the airway and alveoli following bleomycin injury (4 animals per group)
(b) Violin plots showing retention of Gli1 expression in Gli1 Lin+ cells following bleomycin injury as they migrate into the alveoli. Each black dot represents one cell (n values listed in source data for Figure 4d).
AW = airway. Scale bars, 100 µm.
Extended Data Fig. 7. Spatial regulation of BMP activation.
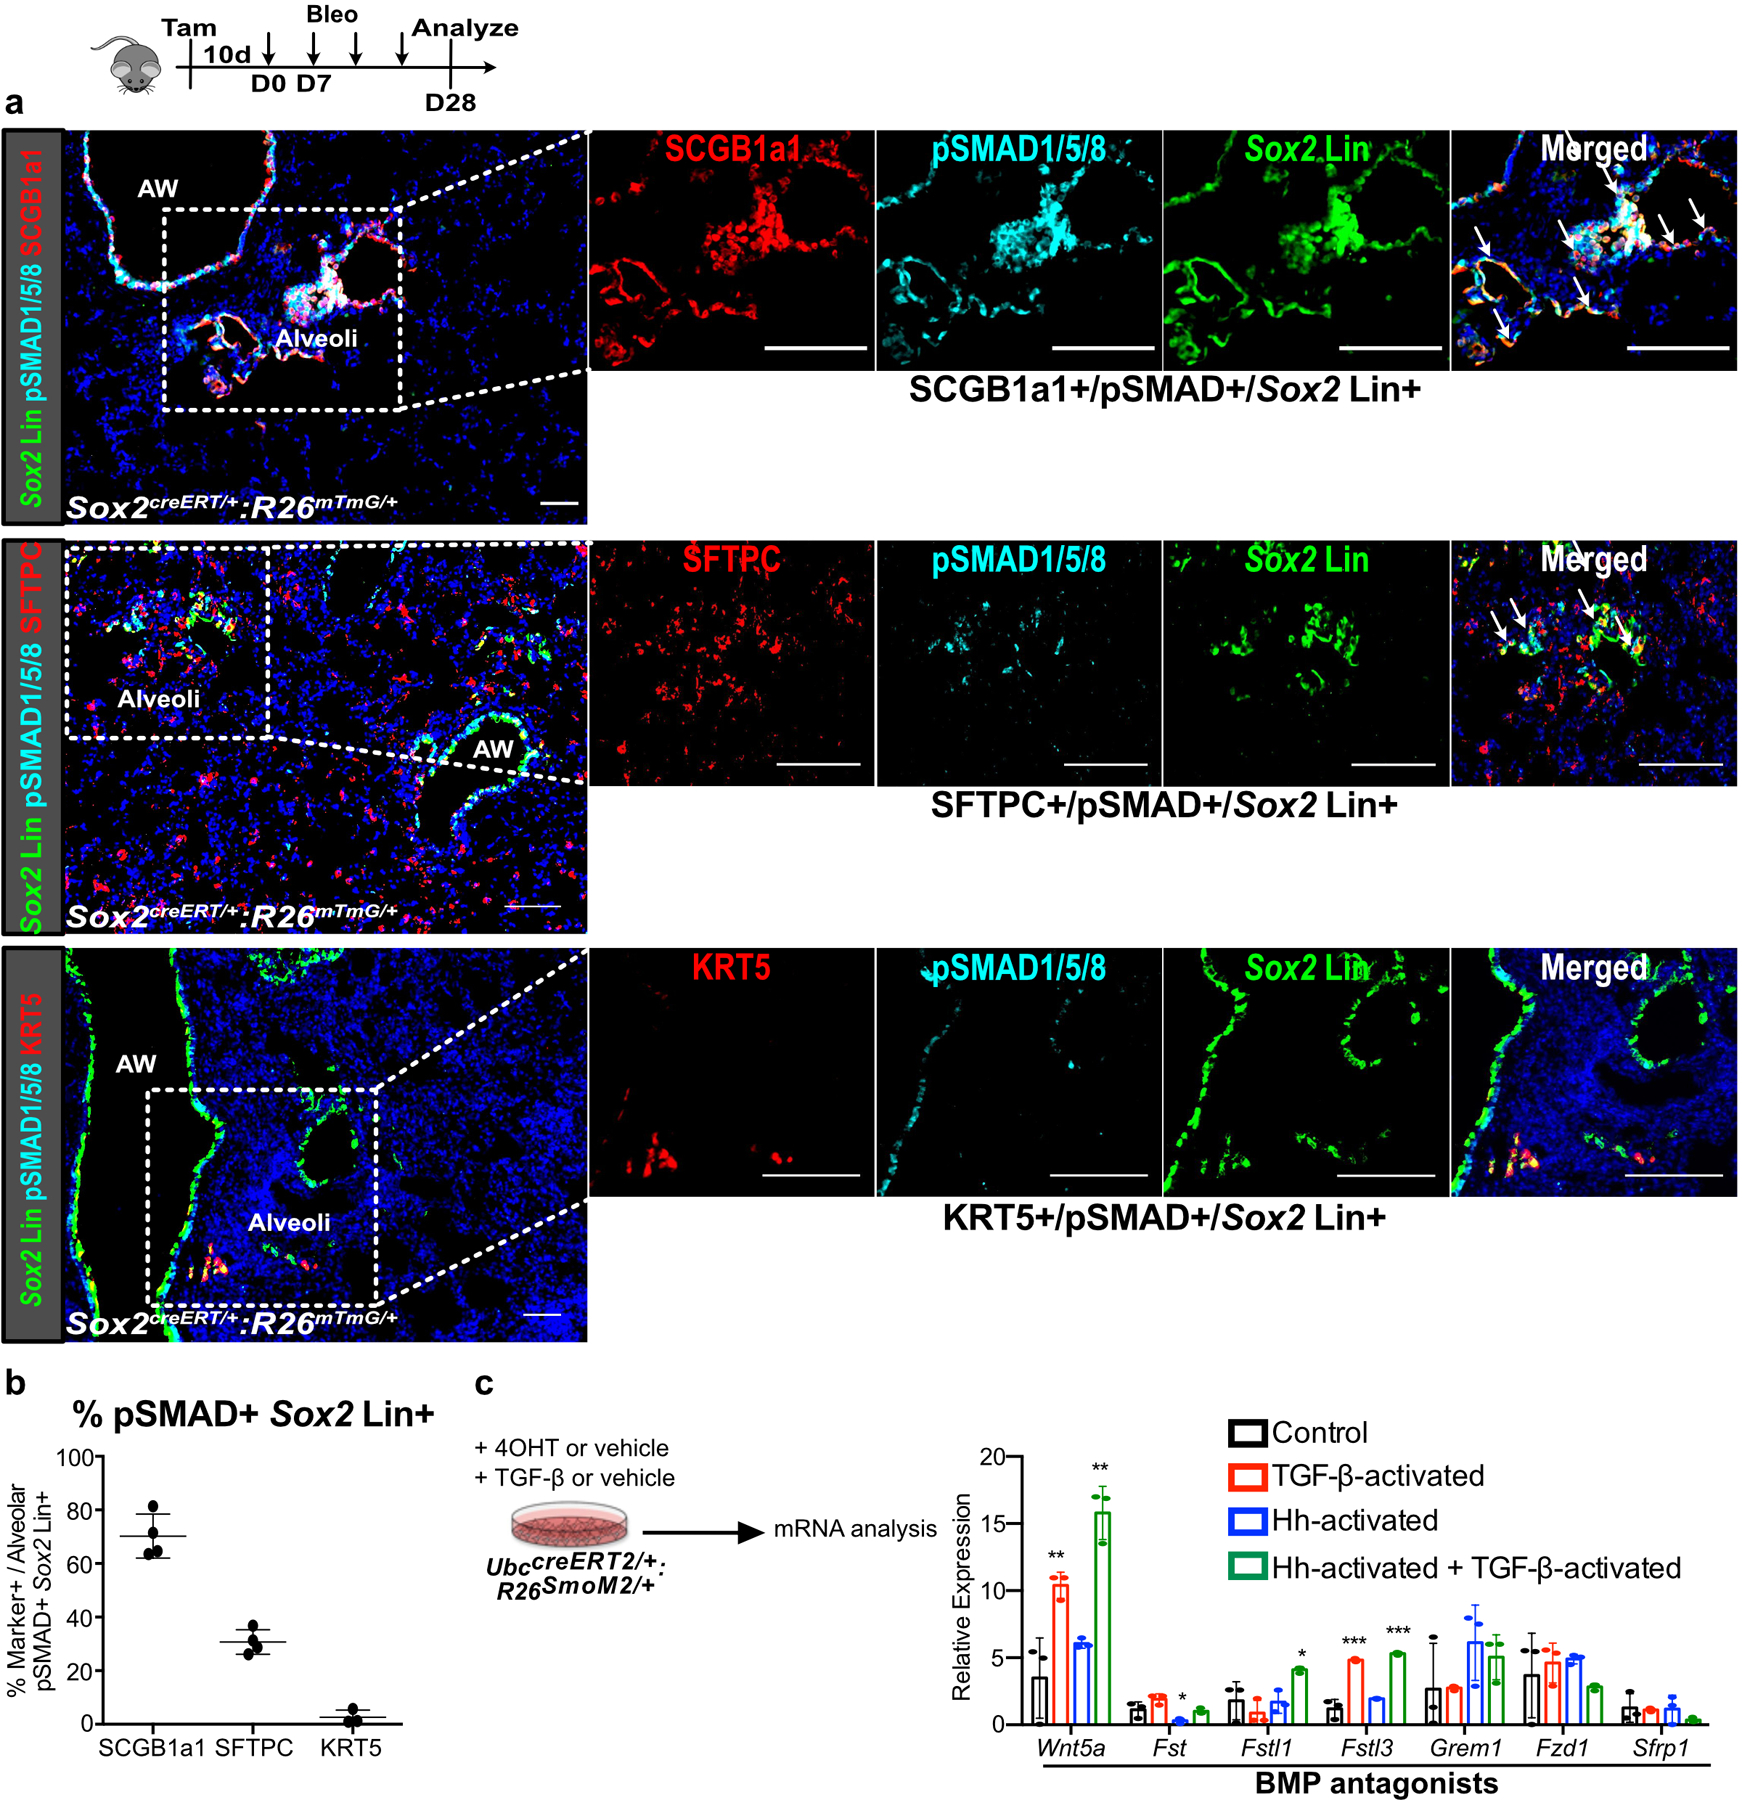
(a,b) pSMAD1/5/8 staining of Sox2 Lin+ cells in the alveoli after bleomycin injury demonstrates that the majority of pSMAD1/5/8+/Sox2 Lin+ cells are SCGB1A1+ or SFTPC+, and rarely KRT5+ (n = 3 for KRT5 quantification, n = 4 for SCGB1a1 and SFTPC quantification; each data point represents one animal). Data are expressed as mean ± SD.
(c) qPCR of Hh-inducible cultured mesenchyme isolated from UbccreERT2/+:R26SmoM2/+ lungs treated with 4OHT +/- TGF-β, showing effect on various BMP antagonists expression (n = 3; each data point represents one biological replicate). Wnt5a: Control v TGF-β P = 0.0094, Control v Hh-activated P = 0.1066, Control v TGF-β + Hh-activated P = 0.002; Fst: Control v TGF-β P = 0.0598, Control v Hh-activated P = 0.0389, Control v TGF-β + Hh-activated P = 0.3833; Fstl1: Control v TGF-β P = 0.2051, Control v Hh-activated P = 0.4620, Control v TGF-β + Hh-activated P = 0.028; Fstl3: Control v TGF-β P = 0.0005, Control v Hh-activated P = 0.0704, Control v TGF-β + Hh-activated P = 0.0003; Grem1: Control v TGF-β P = 0.4845, Control v Hh-activated P = 0.2422, Control v TGF-β + Hh-activated P = 0.1417; Fzd1: Control v TGF-β P = 0.3341, Control v Hh-activated P = 0.2689, Control v TGF-β + Hh-activated P = 0.3320; Sfrp1: Control v TGF-β P = 0.4103, Control v Hh-activated P = 0.4614, Control v TGF-β + Hh-activated P = 0.1093; ordinary one-way ANOVA test. Data are expressed as mean ± SD. Scale bars, 100 µm.
Extended Data Fig. 8. Effect of rhBMP4 in vivo and in vitro.
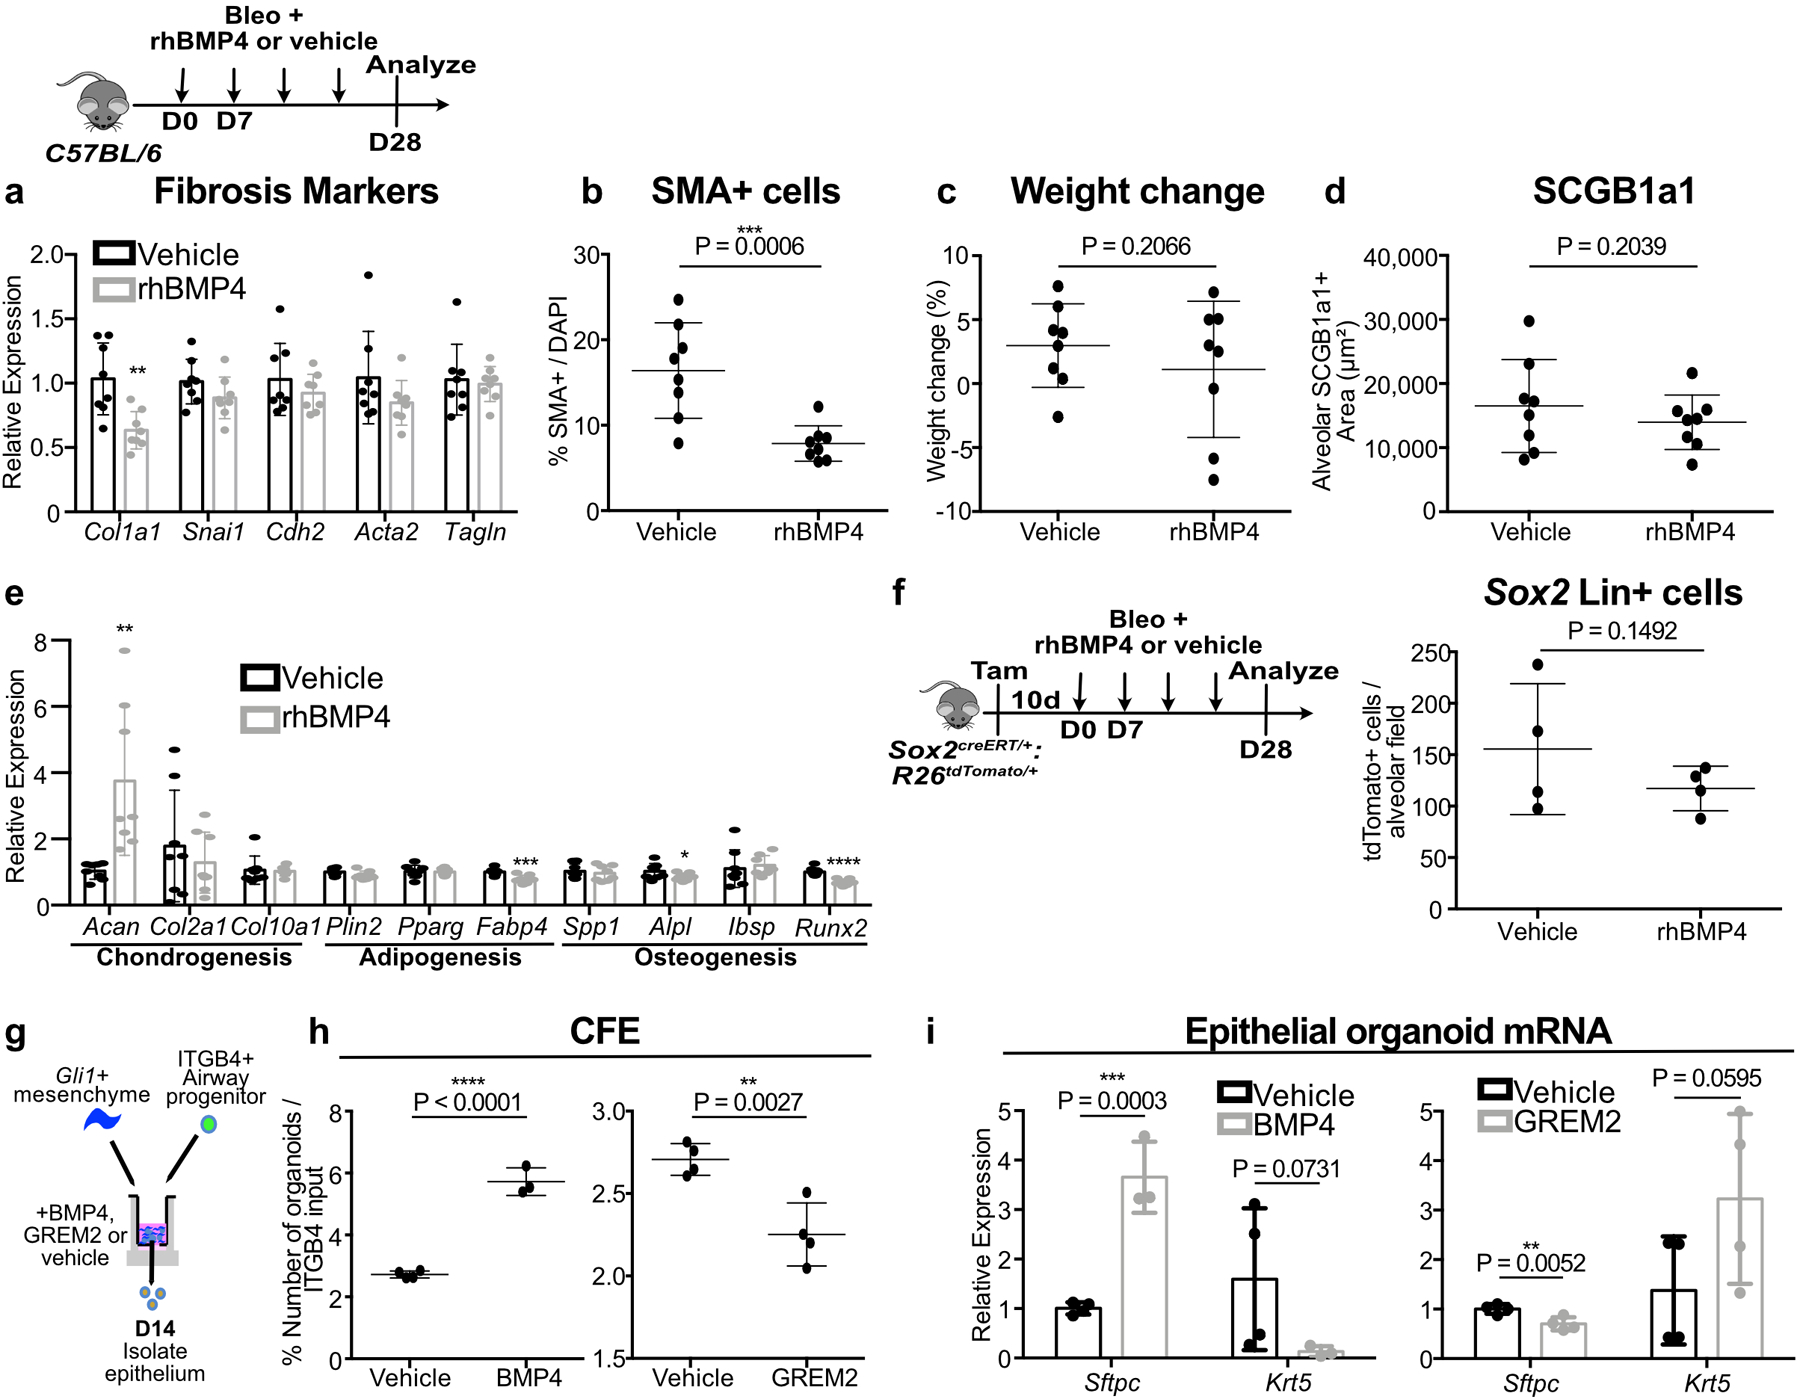
(a-d) Effect of rhBMP4 treatment on fibrotic marker expression, myofibroblasts in the alveoli, weight change, and presence of ectopic SCGB1A1+ cells, in bleomycin injured C57BL/6 animals (n = 8 per group; each data point represents one animal). For (a), Col1a1 P = 0.0015; Snai1 P = 0.0769; Cdh2 P = 0.1771; Acta2 P = 0.0934; Tagln P = 0.3782.; one-tailed unpaired Student’s t-test for (a-d). Data are expressed as mean ± SD.
(e) Effect of rhBMP4 on the expression of markers of chondrogenesis, adipogenesis, and osteogenesis in the lung (n = 8 per group; each data point represents one animal). Acan P = 0.0021; Col2a1 P = 0.2363; Col10a1 P = 0.4201; Plin2 P = 0.0578; Pparg P = 0.4343; Fabp4 P = 0.0006; Spp1 P = 0.3117; Alpl P = 0.0474; Ibsp P = 0.3371; Runx2 P < 0.0001; one-tailed unpaired Student’s t-test. Data are expressed as mean ± SD.
(f) Effect of rhBMP4 on the total number of Sox2 Lin+ cells in the alveoli after bleomycin injury (n = 4 per group; each data point represents one animal; one-tailed unpaired Student’s t-test). Data are expressed as mean ± SD.
(g-i) Airway progenitor organoid co-cultured with Gli1+ mesenchyme treated with BMP4 demonstrates increased CFE and enhanced Sftpc expression with reduced Krt5 (n = 4 for solvent, n = 3 for BMP4; each data point represents one well; one-tailed unpaired Student’s t-test for (h,i)). Conversely, the BMP antagonist GREM2 acts to suppress CFE and Sftpc expression while enhancing Krt5 (n = 4 per group; each datapoint represents one well; one-tailed unpaired Student’s t-test for (h,i)). Data are expressed as mean ± SD.
Extended Data Fig. 9. Metaplastic KRT5+ basal cells and SMA+ fibroblastic foci in the alveoli of IPF lungs.
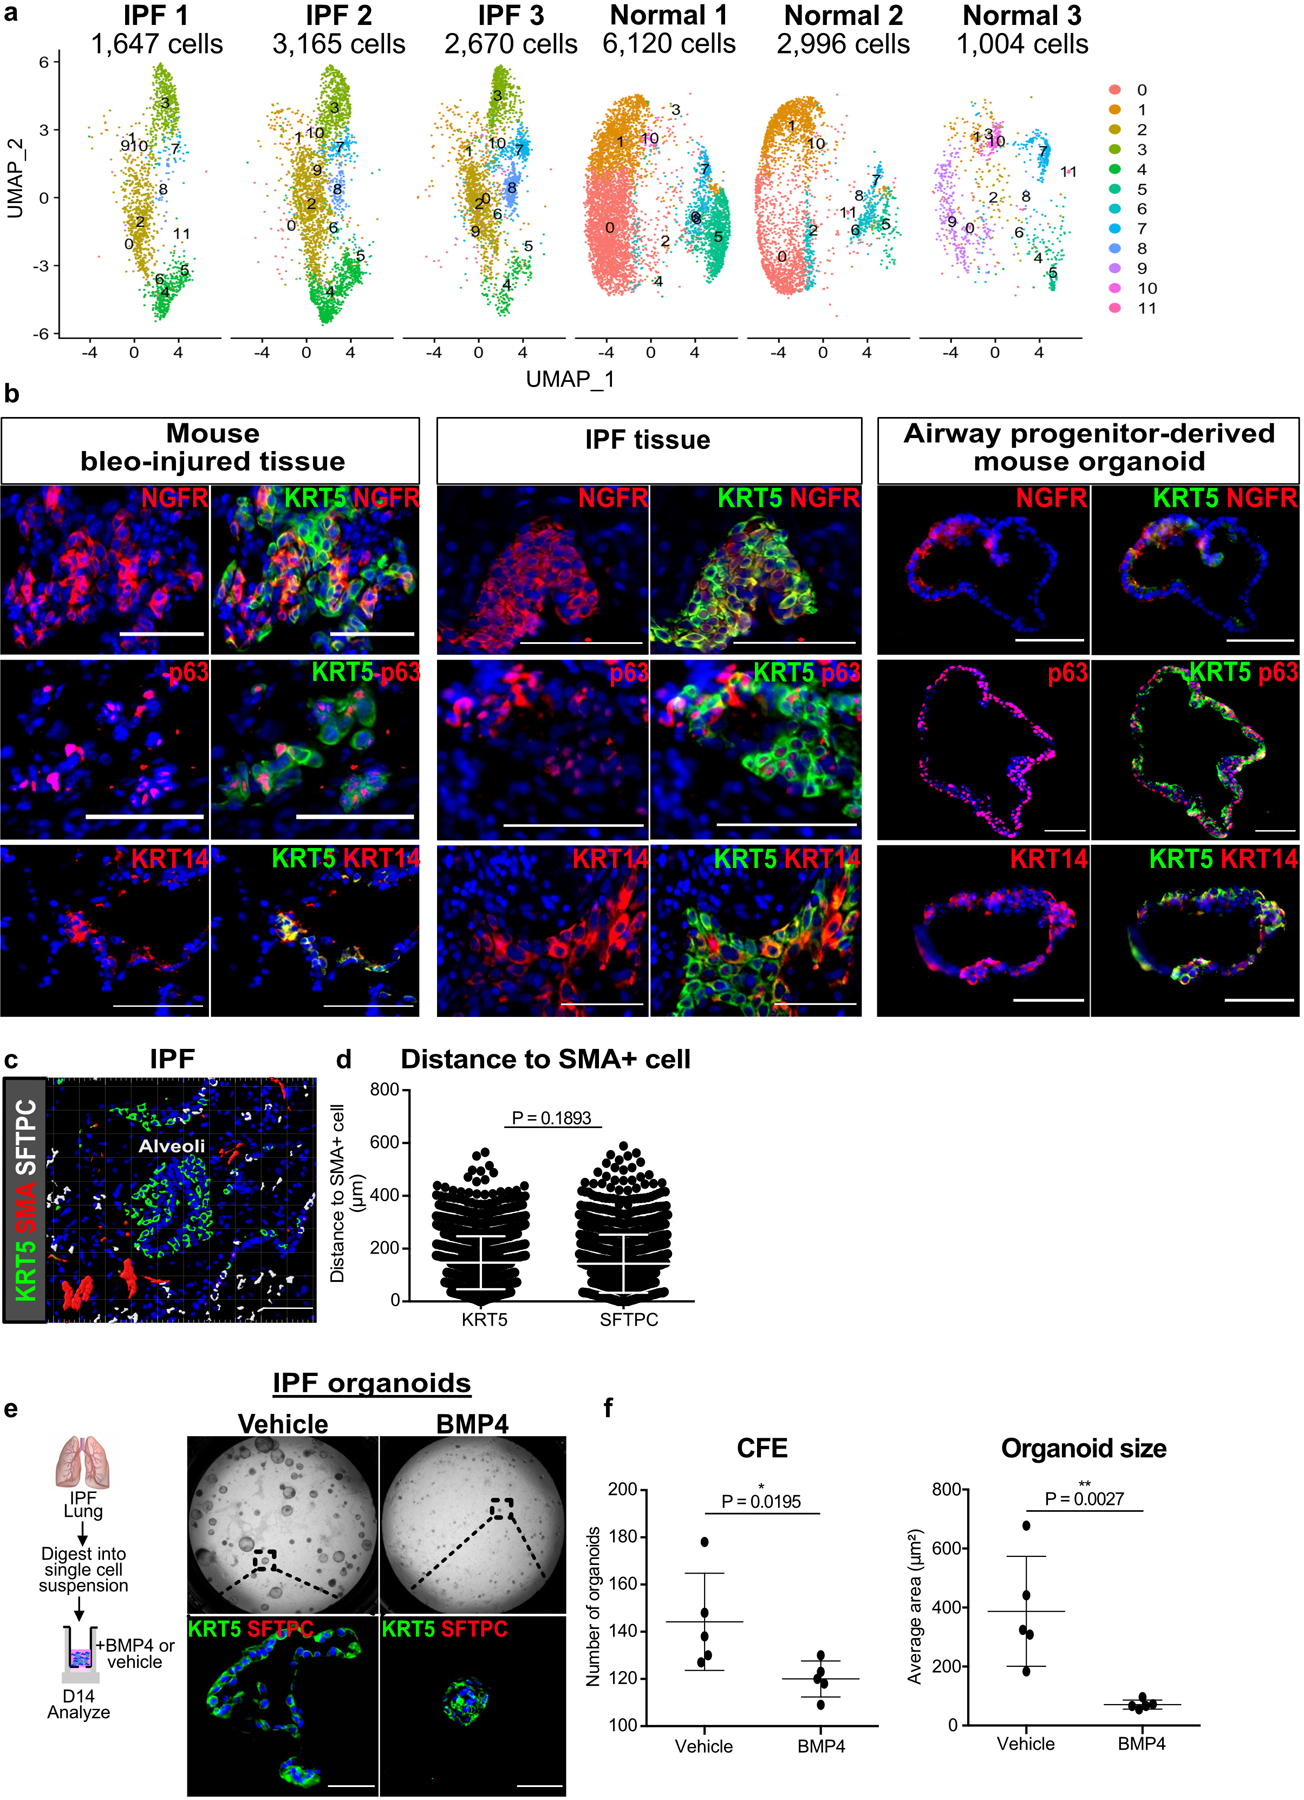
(a) UMAP projection of mesenchyme from each individual donor that was used in single cell RNA-seq analysis with contributing cell number.
(b) Expression of basal cell markers NGFR, p63, and KRT14, in KRT5+ basal cells in human IPF, along with mouse bleomycin injured lungs and murine airway progenitor-derived organoids. This experiment was repeated three times independently with similar results.
(c) Ectopic expression of KRT5 and SMA in the alveoli of IPF lungs form honeycomb cysts and fibroblast foci, respectively. This experiment was repeated independently twice with similar results.
(d) Average cell-to-cell distance shows equivalent proximity of metaplastic KRT5 and endogenous SFTPC cells to SMA+ fibroblastic foci (n = 3,280 KRT5 cells, n = 2,215 SFTPC cells; each datapoint represents an individual distance measurement with all measurements plotted for 3 samples; one-tailed unpaired Student’s t-test).
(e,f) Unsorted epithelial organoids derived from dissociated IPF lungs grew KRT5+ organoids, and BMP4 attenuated the number and size of IPF-derived organoids. (n = 5; each data point represents one well; one-tailed unpaired Student’s t-test) Data are expressed as mean ± SD. Scale bars, 100 µm.
Extended Data Fig. 10. Gli1+ mesenchyme modulates SOX2+ progenitor fate.
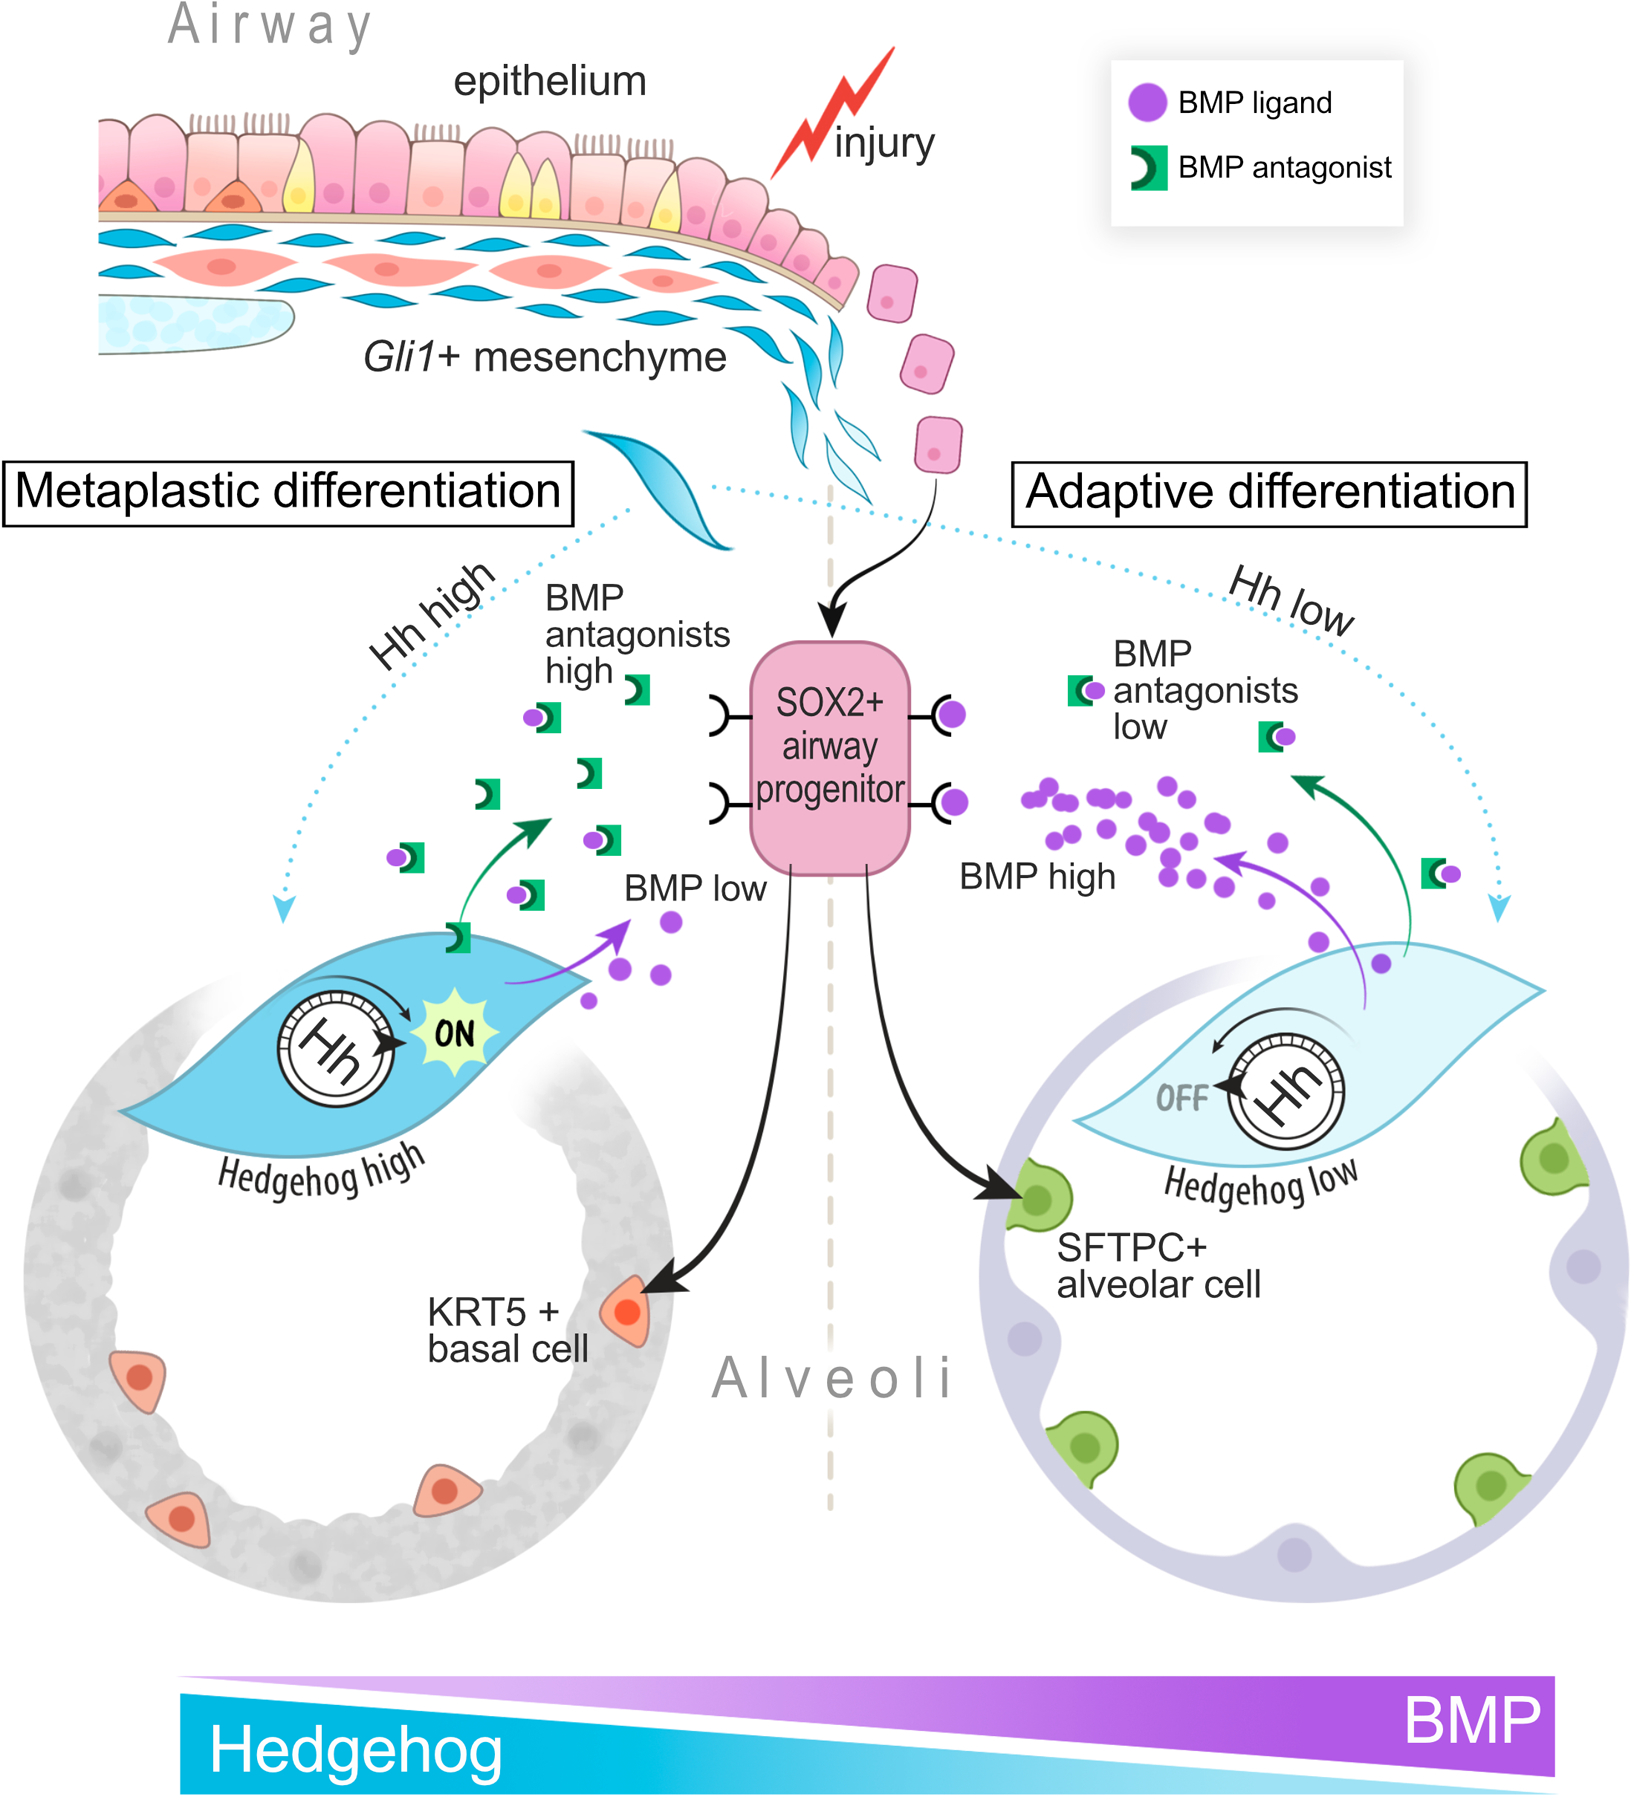
Model of Gli1+ mesenchyme integrating Hh activation as a rheostat that controls local BMP activation to determine SOX2+ airway epithelial progenitor fate.
Supplementary Material
Acknowledgements
We thank Ka Neng Cheong, Alexis Brumwell, Alisha Baldwin, and Nabora Reyes de Mochel for providing technical assistance; Chris Gralapp for assistance with model illustration; Mark Looney for critical review of manuscript; the Parnassus Flow Cytometry Core for assistance with cell sorting for bulk and single cell RNA analysis (P30DK063720); Biological Imaging Development Core members (P30 DK063720); Eunice Wan and the Institute for Human Genetics Core for processing of single cell RNA samples and high-throughput sequencing. GEO accession number for raw RNA sequencing data is listed in Materials and Methods. This work is supported by NIH grants DP2AG056034, K08HL121146, R01HL142552 to T.P., along with Tobacco Related Disease Research Program New Investigator Award and Pulmonary Hypertension Association award to T.P. and Nina Ireland Program Award to M.M. for human lung collection.
Footnotes
Code Availability
This study does not include any custom code.
Competing Interests
The authors declare no competing interests.
Data Availability
The mouse RNA-seq data reported in this paper (Figure 4) is deposited in NCBI Gene Expression Omnibus (GEO) under the accession number GSE140032. The human RNA-seq data reported in this paper (Figure 7) is deposited in NCBI Gene Expression Omnibus (GEO) under the accession number GSE132771.
Previously published sequencing data from the Tabula muris cellular database was referenced here and is publicly available at https://tabula-muris.ds.czbiohub.org/.
There are no restrictions on data availability. All other data supporting the findings of this study are available from the corresponding author on reasonable request.
References
- 1.Giroux V & Rustgi AK Metaplasia: tissue injury adaptation and a precursor to the dysplasia-cancer sequence. Nat Rev Cancer 17, 594–604, doi: 10.1038/nrc.2017.68 (2017). [DOI] [PMC free article] [PubMed] [Google Scholar]
- 2.Chilosi M et al. Abnormal re-epithelialization and lung remodeling in idiopathic pulmonary fibrosis: the role of deltaN-p63. Lab Invest 82, 1335–1345 (2002). [DOI] [PubMed] [Google Scholar]
- 3.Seibold MA et al. The idiopathic pulmonary fibrosis honeycomb cyst contains a mucocilary pseudostratified epithelium. PLoS One 8, e58658, doi: 10.1371/journal.pone.0058658 (2013). [DOI] [PMC free article] [PubMed] [Google Scholar]
- 4.Xu Y et al. Single-cell RNA sequencing identifies diverse roles of epithelial cells in idiopathic pulmonary fibrosis. JCI Insight 1, e90558, doi: 10.1172/jci.insight.90558 (2016). [DOI] [PMC free article] [PubMed] [Google Scholar]
- 5.Prasse A et al. BAL Cell Gene Expression Is Indicative of Outcome and Airway Basal Cell Involvement in Idiopathic Pulmonary Fibrosis. Am J Respir Crit Care Med 199, 622–630, doi: 10.1164/rccm.201712-2551OC (2019). [DOI] [PMC free article] [PubMed] [Google Scholar]
- 6.Hogan BL et al. Repair and regeneration of the respiratory system: complexity, plasticity, and mechanisms of lung stem cell function. Cell Stem Cell 15, 123–138, doi: 10.1016/j.stem.2014.07.012 (2014). [DOI] [PMC free article] [PubMed] [Google Scholar]
- 7.Ray S et al. Rare SOX2(+) Airway Progenitor Cells Generate KRT5(+) Cells that Repopulate Damaged Alveolar Parenchyma following Influenza Virus Infection. Stem Cell Reports 7, 817–825, doi: 10.1016/j.stemcr.2016.09.010 (2016). [DOI] [PMC free article] [PubMed] [Google Scholar]
- 8.Vaughan AE et al. Lineage-negative progenitors mobilize to regenerate lung epithelium after major injury. Nature 517, 621–625, doi: 10.1038/nature14112 (2015). [DOI] [PMC free article] [PubMed] [Google Scholar]
- 9.Yang Y et al. Spatial-Temporal Lineage Restrictions of Embryonic p63(+) Progenitors Establish Distinct Stem Cell Pools in Adult Airways. Dev Cell 44, 752–761 e754, doi: 10.1016/j.devcel.2018.03.001 (2018). [DOI] [PMC free article] [PubMed] [Google Scholar]
- 10.Yee M et al. Alternative Progenitor Lineages Regenerate the Adult Lung Depleted of Alveolar Epithelial Type 2 Cells. Am J Respir Cell Mol Biol 56, 453–464, doi: 10.1165/rcmb.2016-0150OC (2017). [DOI] [PMC free article] [PubMed] [Google Scholar]
- 11.Peng T et al. Hedgehog actively maintains adult lung quiescence and regulates repair and regeneration. Nature 526, 578–582, doi: 10.1038/nature14984 (2015). [DOI] [PMC free article] [PubMed] [Google Scholar]
- 12.Zhao H et al. The suture provides a niche for mesenchymal stem cells of craniofacial bones. Nat Cell Biol 17, 386–396, doi: 10.1038/ncb3139 (2015). [DOI] [PMC free article] [PubMed] [Google Scholar]
- 13.Zhao H et al. Secretion of shh by a neurovascular bundle niche supports mesenchymal stem cell homeostasis in the adult mouse incisor. Cell Stem Cell 14, 160–173, doi: 10.1016/j.stem.2013.12.013 (2014). [DOI] [PMC free article] [PubMed] [Google Scholar]
- 14.Kramann R et al. Perivascular Gli1+ progenitors are key contributors to injury-induced organ fibrosis. Cell Stem Cell 16, 51–66, doi: 10.1016/j.stem.2014.11.004 (2015). [DOI] [PMC free article] [PubMed] [Google Scholar]
- 15.Wang C et al. Expansion of hedgehog disrupts mesenchymal identity and induces emphysema phenotype. J Clin Invest 128, 4343–4358, doi: 10.1172/JCI99435 (2018). [DOI] [PMC free article] [PubMed] [Google Scholar]
- 16.Xi Y et al. Local lung hypoxia determines epithelial fate decisions during alveolar regeneration. Nat Cell Biol 19, 904–914, doi: 10.1038/ncb3580 (2017). [DOI] [PMC free article] [PubMed] [Google Scholar]
- 17.Degryse AL et al. Repetitive intratracheal bleomycin models several features of idiopathic pulmonary fibrosis. Am J Physiol Lung Cell Mol Physiol 299, L442–452, doi: 10.1152/ajplung.00026.2010 (2010). [DOI] [PMC free article] [PubMed] [Google Scholar]
- 18.Kurche JS et al. Muc5b Enhances Murine Honeycomb-like Cyst Formation. Am J Respir Cell Mol Biol 61, 544–546, doi: 10.1165/rcmb.2019-0138LE (2019). [DOI] [PMC free article] [PubMed] [Google Scholar]
- 19.Jeong J, Mao J, Tenzen T, Kottmann AH & McMahon AP Hedgehog signaling in the neural crest cells regulates the patterning and growth of facial primordia. Genes Dev 18, 937–951, doi: 10.1101/gad.1190304 (2004). [DOI] [PMC free article] [PubMed] [Google Scholar]
- 20.Becht E et al. Dimensionality reduction for visualizing single-cell data using UMAP. Nat Biotechnol, doi: 10.1038/nbt.4314 (2018). [DOI] [PubMed] [Google Scholar]
- 21.La Manno G et al. RNA velocity of single cells. Nature 560, 494–498, doi: 10.1038/s41586-018-0414-6 (2018). [DOI] [PMC free article] [PubMed] [Google Scholar]
- 22.Tabula Muris C et al. Single-cell transcriptomics of 20 mouse organs creates a Tabula Muris. Nature 562, 367–372, doi: 10.1038/s41586-018-0590-4 (2018). [DOI] [PMC free article] [PubMed] [Google Scholar]
- 23.Zagorski M et al. Decoding of position in the developing neural tube from antiparallel morphogen gradients. Science 356, 1379–1383, doi: 10.1126/science.aam5887 (2017). [DOI] [PMC free article] [PubMed] [Google Scholar]
- 24.Massague J, Seoane J & Wotton D Smad transcription factors. Genes Dev 19, 2783–2810, doi: 10.1101/gad.1350705 (2005). [DOI] [PubMed] [Google Scholar]
- 25.Plantier L et al. Ectopic respiratory epithelial cell differentiation in bronchiolised distal airspaces in idiopathic pulmonary fibrosis. Thorax 66, 651–657, doi: 10.1136/thx.2010.151555 (2011). [DOI] [PubMed] [Google Scholar]
- 26.Tadokoro T, Gao X, Hong CC, Hotten D & Hogan BL BMP signaling and cellular dynamics during regeneration of airway epithelium from basal progenitors. Development 143, 764–773, doi: 10.1242/dev.126656 (2016). [DOI] [PMC free article] [PubMed] [Google Scholar]
- 27.Mou H et al. Dual SMAD Signaling Inhibition Enables Long-Term Expansion of Diverse Epithelial Basal Cells. Cell Stem Cell 19, 217–231, doi: 10.1016/j.stem.2016.05.012 (2016). [DOI] [PMC free article] [PubMed] [Google Scholar]
- 28.Bolanos AL et al. Role of Sonic Hedgehog in idiopathic pulmonary fibrosis. Am J Physiol Lung Cell Mol Physiol 303, L978–990, doi: 10.1152/ajplung.00184.2012 (2012). [DOI] [PubMed] [Google Scholar]
- 29.Jia G et al. CXCL14 is a candidate biomarker for Hedgehog signalling in idiopathic pulmonary fibrosis. Thorax 72, 780–787, doi: 10.1136/thoraxjnl-2015-207682 (2017). [DOI] [PubMed] [Google Scholar]
- 30.Lee J et al. Increased Primary Cilia in Idiopathic Pulmonary Fibrosis. Mol Cells 41, 224–233, doi: 10.14348/molcells.2018.2307 (2018). [DOI] [PMC free article] [PubMed] [Google Scholar]
- 31.Liu L et al. Hedgehog signaling in neonatal and adult lung. Am J Respir Cell Mol Biol 48, 703–710, doi: 10.1165/rcmb.2012-0347OC (2013). [DOI] [PMC free article] [PubMed] [Google Scholar]
- 32.Moshai EF et al. Targeting the hedgehog-glioma-associated oncogene homolog pathway inhibits bleomycin-induced lung fibrosis in mice. Am J Respir Cell Mol Biol 51, 11–25, doi: 10.1165/rcmb.2013-0154OC (2014). [DOI] [PubMed] [Google Scholar]
- 33.Koli K et al. Bone morphogenetic protein-4 inhibitor gremlin is overexpressed in idiopathic pulmonary fibrosis. Am J Pathol 169, 61–71, doi: 10.2353/ajpath.2006.051263 (2006). [DOI] [PMC free article] [PubMed] [Google Scholar]
- 34.Myllarniemi M et al. Gremlin-mediated decrease in bone morphogenetic protein signaling promotes pulmonary fibrosis. Am J Respir Crit Care Med 177, 321–329, doi: 10.1164/rccm.200706-945OC (2008). [DOI] [PMC free article] [PubMed] [Google Scholar]
- 35.Dong Y et al. Blocking follistatin-like 1 attenuates bleomycin-induced pulmonary fibrosis in mice. J Exp Med 212, 235–252, doi: 10.1084/jem.20121878 (2015). [DOI] [PMC free article] [PubMed] [Google Scholar]
References
- 36.Butler A et al. Integrating single-cell transcriptomic data across different conditions, technologies, and species. Nat Biotechnol 36, 411–420, doi: 10.1038/nbt.4096 (2018). [DOI] [PMC free article] [PubMed] [Google Scholar]
- 37.Stuart T, et al. Comprehensive Integration of Single-Cell Data. Cell 177, 1888–1902, doi: 10.1016/j.cell.2019.05.031 (2019). [DOI] [PMC free article] [PubMed] [Google Scholar]
- 38.Finak G, et al. MAST: a flexible statistical framework for assessing transcriptional changes and characterizing heterogeneity in single-cell RNA sequencing data. Genome Biology 16, 278, doi: 10.1186/s13059-015-0844-5 (2015). [DOI] [PMC free article] [PubMed] [Google Scholar]
Associated Data
This section collects any data citations, data availability statements, or supplementary materials included in this article.
Supplementary Materials
Data Availability Statement
The mouse RNA-seq data reported in this paper (Figure 4) is deposited in NCBI Gene Expression Omnibus (GEO) under the accession number GSE140032. The human RNA-seq data reported in this paper (Figure 7) is deposited in NCBI Gene Expression Omnibus (GEO) under the accession number GSE132771.
Previously published sequencing data from the Tabula muris cellular database was referenced here and is publicly available at https://tabula-muris.ds.czbiohub.org/.
There are no restrictions on data availability. All other data supporting the findings of this study are available from the corresponding author on reasonable request.


