

Abstract
The precise molecular mechanism of hepatocellular carcinoma (HCC) remains ambiguous. Isocitrate dehydrogenase 3A (IDH3A) is known as a subunit of the IDH3 heterotetramer. To the best of our knowledge, the biological effect of IDH3A in malignant tumors is unclear. Here, we report that IDH3A is significantly upregulated in HCC tissues; moreover, high expression of IDH3A is strongly associated with tumor size and the clinicopathologic stage of HCC. RNA-seq revealed that depletion of IDH3A affects the expression of metastasis associated 1 (MTA1), an oncogene which is related to the progression of numerous cancer types to the metastasis stage. Cell transfection was used to upregulate and downregulate the expression of IDH3A in HCC cells. The migration activity of HCC cells was assessed using wound healing assays. While transwell assays were carried out to detect the invasion of HCC cells. RNA-seq, RT-qPCR and western blot were used to validate MTA1 as a potential target gene. The present study suggested that IDH3A can upregulate MTA1 expression and promote epithelial-mesenchymal transition (EMT) in HCC by inducing MTA1 expression, thereby facilitating cell migration and invasion of HCC cells. Here, we demonstrated the importance of IDH3A in HCC progression. The identification of the IDH3A axis provides novel insight into the pathogenesis of HCC, and the IDH3A axis might represent a novel target for the treatment of HCC.
Keywords: IDH3A, MTA1, EMT, migration, invasion
Introduction
Hepatocellular carcinoma (HCC) has become the fifth most common malignant tumor and the third leading cause of cancer death worldwide [1,2]. The occurrence of HCC is associated with several factors, such as diabetes, metabolic liver diseases, non-alcoholic fatty liver disease, viral infections and drugs [3]. Although multiple advances have been achieved in the diagnosis and treatment of HCC, critical factors including the lack of effective therapeutic options for the advanced stages of the disease, the aggressive and heterogeneous nature, tumor metastasis are still responsible for the high mortality of HCC [4-6], and contribute to the poor prognosis of HCC patients. Moreover, increasing evidence indicates that altered metabolic pathways are hallmarks of cancer that at as widespread as other cancer-associated features [7]. Therefore, it is urgent to explore the detailed molecular mechanisms of HCC metastasis and investigate novel therapeutic strategies.
Epithelial mesenchymal transition (EMT) is a highly conserved cellular trans-differentiation program, the main characteristics of EMT are epithelial cells lose their polarized organization and acquire migratory and invasive capabilities [8]. More and more evidence has proved that EMT contribute to tumor cell invasion and malignant progression [9]. Loss of Epithelial marker E-cadherin and gain of mesenchymal marker N-cadherinare, key features of the EMT process and have been implicated in tumor metastasis [10]. Multiple powerful evidences have supported that EMT plays a pivotal role in HCC metastasis [11-13].
Isocitrate dehydrogenases (IDHs) are a group of enzymes that catalyze the oxidative decarboxylation of isocitrate to α-ketoglutarate (α-KG), and localize to different subcellular compartments, with the cooperation of different cofactors, different IDHs show diverse holoenzyme organization and enzymatic characteristics [14]. For example, IDH1 and IDH2 can reversibly convert isocitrate to α-KG in a reaction that is dependent on nicotinamide adenine dinucleotide phosphate (NADP+), while IDH3 irreversibly catalyzes the conversion of isocitrate to α-KG in a reaction that is dependent on nicotinamide adenine dinucleotide (NAD+).
Oncogenic mutations in IDH1 and IDH2 have been identified in glioma and acute myelogenous leukemia, point-mutated IDH1 and IDH2 can catalyze α-KG to 2-hydroxyglutarate (2-HG) [15]. 2-HG suppresses α-KG-dependent dioxygenase function, such as Jumonji C domain-containing histone lysine residue demethylases, leading to a global hypermethylation phenotype, increased tumor malignancy [16]. IDH3 is a rate-limiting step of the TCA cycle which catalyzes an irreversible enzyme reaction [17]. In support of IDH3A protumorigenic effect, aberrant IDH3A expression is associated with poor postoperative overall survival of breast and lung cancer patients, indicating that IDH3A might be a putative cancer therapeutic target [18].
Metastasis-associated gene 1 (MTA1), the first identified member of the MTA family, plays a key role in tumor growth, invasion, and metastasis. Previous studies have indicated that MTA1 is a critical regulator of carcinogenesis and metastasis in several human cancers, such as breast cancer [19], prostate cancer [20] and HCC [21]. The mechanism of MTA1-induced EMT in cancer cell dissemination is well established [22,23].
In the current study, we found that IDH3A was obviously upregulated in HCC, and high expression of IDH3A was closely correlated with tumor size and clinicopathologic stages of HCC. We showed that IDH3A regulated the expression of MTA1. Moreover, our work suggested that IDH3A facilitated EMT through regulation of MTA1. In addition, IDH3A also promoted cell migration and invasion of HCC cells. Our work proposes that IDH3A might be a potential therapeutic target of HCC.
Materials and methods
Immunohistochemical analysis
An HCC immunohistochemical microarray, containing 41 HCC tissues and 41 adjacent normal tissues, was purchased from OUTDO BIOTECH Co., Ltd (Shanghai, China). Ethics approval was approved by the Peking University Third Hospital Medical Science Research Ethics Committee (S2019012). Antigen retrieval was performed by incubating the samples in 0.01 M sodium citrate buffer at high pressure. After antigen retrieval, the samples were blocked with 10% normal goat serum in PBS and then incubated with anti-IDH3A (1:500, Cat. #ab58641, Abcam), anti-MTA1 (1:200, Cat. #ab40084, Abcam) antibodies overnight at 4°C, respectively. Then, the sections were incubated with HRP-labeled antirabbit secondary antibodies for 30 minutes at 37°C, and developed with DAB kit (Solarbio, Cat. DA1010). All tumor slides were examined randomly by three independent pathologists. The intensity of immunopositivity was classified as follows: 0, negative; 1, weak; 2, moderate; and 3, strong. The staining percentage was scored as follows: 0, < 5%; 1, 5%-24%; 2, 25%-49%; 3, 50%-74%; and 4, > 75%. The final score was determined by multiplying the intensity scores and the extent scores, which yielded a range from 0 to 12. Tumors with a final score ≥ 4 were considered as tumors with specific protein overexpression.
Cell culture and transfection
The HepG2 and Hep3B cell line were obtained from the American Type Culture Collection (ATCC) and MHCC-97H cells were obtained from the Shanghai Institute of Cell Biology in the Chinese Academy of Sciences. HepG2 and Hep3B cells were maintained in DMEM supplemented with 10% FBS (HyClone), streptomycin (100 mg/mL), and penicillin (100 U/mL) in a humidified incubator equilibrated with 5% CO2 at 37°C. MHCC-97H cells were cultured in RPMI-1640 medium supplemented with 10% FBS (HyClone), streptomycin (100 mg/mL), and penicillin (100 U/mL) in a humidified incubator equilibrated with 5% CO2 at 37°C. Human hepatocytes were purchased from Lonza and cultured as recommended for 96 h prior to protein and RNA extraction. Cells were transfected with 2.5 μg plasmid or 40 nM siRNAs using Lipofectamine 2000 or Lipofectamine RNAiMAX (Invitrogen) according to the manufacturer’s instructions, respectively. After transfection for 48 h, cells were collected. siRNAs were synthesized by Shanghai GenePharma Co., Ltd. The sequences are as follows: control siRNA, 5’-UUCUCCGAACGUGUCACGU-3’; IDH3A siRNA-1, 5’-AAGUGUCUACCUGGUAAAUTT-3’; IDH3A-2, 5’-TTAAGTGTCTACCTGGTAAAT-3’; Sp1 siRNA-1, 5’-GCTGGTGGTGATGGAATACAT-3’, Sp1 siRNA-2, 5’-CCACTCCTTCAGCCCTTATTA-3’ and MTA1 siRNA, 5’-CCATACCTGATCCGGAGAATC-3’.
Cell infection
The retroviral plasmid vector, pBABE-MTA1 together with pGag-Pol and pVSV-G were co-transfected into the packaging 293T cells. Viral supernatants were collected 48 h later, clarified by filtration, and concentrated by ultracentrifugation. Lentiviruses carrying control shRNA (shControl) and IDH3A shRNA (shIDH3A) were purchased from Genepharma Inc. The virus was used to infect 4×10⁵ cells (30%-40% confluent) in a 6 cm dish with 10 μg/ml polybrene. Infected cells were selected by 5 μg/ml puromycin (Merck). The sequences of shRNAs were: shIDH3A: 5’-CCGGGCTCAGACTTCACAGAGGAAACTCGAGTTTCCTCTGTGAAGTCTGAGCTTTTT-3’ and shControl: 5’-CCGGGAATCGTCGTATGCAGTGAAACTCGAGTTTCACTGCATACGACGATTCTTTTTG-3’.
RT-qPCR
Total RNA was isolated from HepG2 or MHCC-97H cells using TRIzol reagent (Thermo Fisher). A total of 2 μg RNA was reverse-transcribed using EasyScript ® First-Strand cDNA Synthesis SuperMix (TransGen). Quantitative real-time PCR was performed using SYBR Green Master (Roche) in an ABI 7500. The relative expression of target genes was calculated using the 2-ΔΔCt method [24]. GAPDH was served as an internal control. The sequences were as follows: IDH3A forward, 5’-TGCCCAGACTGAAGAGACCT-3’, IDH3A reverse, 5’-TTTCCCTTTTAGGTCCCACGA-3’; MTA1 forward: 5’-CCGAGAAACTAAAGCACCAG-3’, MTA1 reverse: 5’-AAGAAGAAATCCTCCCGCTC-3’; E-cadherin forward: 5’-GAAATCACATCCTACACTGCCC-3’, E-cadherin reverse: 5’-GTAGCAACTGGAGAACCATTGTC-3’; N-cadherin forward: 5’-AGGCTTCTGGTGAAATCGCA-3’, N-cadherin reverse: 5’-TGGAAAGCTTCTCACGGCAT-3’; Vimentin forward: 5’-ATTGAGATTGCCACCTACAG-3’, Vimentin reverse: 5’-ATCCAGATTAGTTTCCCTCAG-3’; VEGFA forward: 5’-CTGGAGCGTGTACGTTGGT-3’, VEGF1 reverse: 5’-GTTTAACTCAAGCTGCCTCGC-3’; PHF6 forward: 5’-AGACAGCGCAAATGTGGCTT-3’, PHF6 reverse: 5’-TCAGCTTCGTGCCTCTTTTAAT-3’; CASP2 forward: 5’-AGCTGTTGTTGAGCGAATTGT-3’, CASP2 reverse: 5’-AGCAAGTTGAGGAGTTCCACA-3’; TP53 forward: 5’-TGCTCAAGACTGGCGCTAAA-3’, TP53 reverse: 5’-GCTCGACGCTAGGATCTGAC-3’; ZNF205 forward: 5’-CCTCCACCCCGCTCTGAAA-3’, ZNF205 reverse: 5’-TCGGGCTCCATCTTAATGTGC-3’; SIRT7 forward: 5’-ACTTGGTCGTCTACACAGGC-3’, SIRT7 reverse: 5’-GGTGATGCTCATGTGGGTGA-3’; ZNF232 forward: 5’-CACCGCCCTTCAGGTACAAT-3’, ZNF232 reverse: 5’-TTGAGCGGAGCGAGAAAGAG-3’; GAPDH forward: 5’-CCCACTCCTCCACCTTTGAC-3’, GAPDH reverse: 5’-CATACCAGGAAATGAGCTTGACAA-3’. Each experiment was performed at least three times.
Western blotting analysis
Whole cells were lysed using RIPA buffer containing cocktail. The total protein concentration was measured using a BCA kit protein assay (Pierce). 40 μg of protein was loaded per well in 10% polyacrylamide gels and transferred to nitrocellulose filter membranes. After blocking with 5% non-fat milk at room temperature for 1 h, membranes were incubated with primary antibodies overnight at 4°C. The primary antibodies were anti-IDH3A (1:1000, Cat. #ab58641; Abcam), anti-MTA1 (1:1000, Cat. #ab40084; Abcam), anti-E-cadherin (1:500 dilution; Cat. #3195; Cell Signaling Technology), anti-N-cadherin (1:500 dilution; Cat. #13116; Cell Signaling Technology), anti-vimentin (1:1000 dilution; Cat. #5741; Cell Signaling Technology), anti-Sp1 (1:4000, Cat. #ab13370; Abcam) and anti-β-actin (1:5,000 dilution; cat. no. ab179467; Abcam). After washing with TBST for three times, the membranes were incubated with secondary antibodies for 1 h at room temperature. The immunoreactive bands were visualized using enhanced chemiluminescence ECL (Thermo Fisher, Cat. #32106). Each experiment was performed at least three times.
Wound healing analysis
The wound healing analysis was performed as previously described [25]. Briefly, cells were placed in 6-well plates and cultured to 95-100% confluence. Subsequently, cells were scraped with a 20 μl pipette tip, and plates were washed with PBS three times (time 0), and the medium was replaced with serum-free RPMI-1640. The migration distances of the cells were measured from the images that were obtained at the indicated time points. Each experiment was performed at least three times.
Transwell invasion assay
In vitro invasion assay was performed using Transwell migration chambers (8 μm pore size, BD Biosciences). The filters were coated with 100 μl Matrigel (PBS:Matrigel=8:1, BD Biosciences) and incubated in a 5% CO2 atmosphere at 37°C for 1 h for gelling. A total of 3×10⁴ transfected MHCC-97H cells were resuspended in 400 μl serum-free RPMI-1640 and seeded in the upper chamber, the bottom chambers were filled with 400 μl RPMI-1640 supplemented with 10% FBS. After incubation at 37°C with a 5% CO2 atmosphere for 24 h, the cells on the surface of the chamber were removed by a cotton swab, and the invaded cells were stained with 0.5% crystal violet. The invaded cells were photographed under an inverted fluorescence microscope (×200 magnification) and the number of invaded cells was counted. Each experiment was performed at least three times.
Luciferase reporter analysis
The promoter region (-500 to +200) of MTA1 was cloned into pGL3-basic plasmid. The QuikChange Lightning Site-Directed Mutagenesis kit (Agilent Technologies, USA) was used to mutate the promoter region of MTA1. HepG2 cells were transfected with MTA1-Luc, together with vector or Sp1 and Renilla. After transfection for 24 h, the luciferase activity of the cells was detected using a luciferase assay kit (Promega). Each experiment was performed at least three times.
ChIP and qChIP
ChIP and qChIP analyses were performed in HepG2 cells as previous described [26]. qChIP analysis was performed using the TransStart Top Green qPCR supermix (TransGen Biotech). The qChIP primers were the following: MTA1-1 forward: 5’-GACCACCTGTCCAGAGATGC-3’ and reverse: 5’-TAGCTCTCCAGGGGTTCCTC-3’; and MTA1-2 forward: 5’-GGCAAAGGTTAGGCCTGGAA-3’ and reverse: 5’-TCCTCCACAAGGGCCATTTC-3’. Each independent experiment was performed at least three times.
Pulmonary metastasis model
For pulmonary metastasis analysis, 5×10⁶ MHCC-97H cells infected with lentiviruses carrying control shRNA, IDH3A shRNA and/or MTA1 were intravenously injected into SCID mice (5 weeks, n=6) via the tail vein. After injection for 6 weeks, each mouse was first anesthetized and then given 150 μg/g of D-luciferin in PBS by intraperitoneal injection. After 15 min, bioluminescence images were obtained with a charge-coupled device camera (IVIS; Xenogen). Bioluminescence was calculated manually from the relative optical intensity, and the data was expressed as photon flux (photons·sec-1·cm-2·Steradian-1) and normalized to background photon flux, which was defined as the relative optical intensity of a mouse that was not injected with luciferin.
Statistical analyses
The results were reported as the mean ± SD and each independent experiment was performed at least three times. All data were analyzed using SPSS 18.0. Two-tailed unpaired Student’s t test and ANOVA with Turkey’s post-hoc test were used to assess comparisons between two groups or multiple groups. The correlations between various clinicopathological characteristics with IDH3A and MTA1 expression were examined by the chi-square test in 41 HCC specimens of the HCC microarray from patients with complete available information on age, gender and clinicopathologic stages. The Kaplan-Meier estimate was used to compute survival curves, and statistical analysis was performed using Log-rank (Mantel-Cox) Test. The correlation of IDH3A and MTA1 was examined by Pearson analysis. *P < 0.05 was considered as statistically significant.
Results
IDH3A is upregulated in hepatocellular carcinoma (HCC), and high expression of IDH3A protein is strongly associated with tumor size and advanced stages of HCC
To gain more mechanistic insights into the role of IDH3A in carcinogenesis, we analyzed the expression of IDH3A across a set of cancer types on the cBioPortal for Cancer Genomics website [27]. The analysis revealed that the mRNA level of IDH3A was remarkably upregulated in multiple types of cancers, such as bladder cancer, breast invasive cancer, colorectal adenocarcinoma, hepatocellular carcinoma, lung adenocarcinoma, pancreatic adenocarcinoma, thymoma cancer and thyroid carcinoma (Figure 1A). In addition, we also analyzed the expression of IDH3A in tumor tissues as well as adjacent non-tumor tissue in the GTEx database [28]. The result indicated that the expression of IDH3A was higher in HCC tumor tissues than normal tissues (Figure 1B). A previous report supported that IDH3A expression correlates with poor postoperative overall survival in lung and breast cancer patients [18]. To further decipher the role of IDH3A in HCC carcinogenesis, we first detected IDH3A expression in HCC by a tissue array. A series of carcinoma and normal tissues from HCC patients were collected, including 41 HCC tissues and 41 adjacent normal tissues. Immunohistochemical staining demonstrated that IDH3A protein was mainly detected in the cytoplasm, and partially detected in the nucleus of HCC cells, and the expression of IDH3A was markedly upregulated in HCC tissues compared with adjacent normal tissues (Figure 1C). Further analysis was carried out in 41 HCC patients for whom complete information on age, gender and clinicopathologic stage was available. Remarkably, the level of IDH3A protein expression was correlated with tumor size and clinicopathologic stages (Figure 1D), while no correlations were found between IDH3A expression and gender or age (Table 1). Moreover, a significant negative correlation between IDH3A expression and the survival rate of patients were observed (Figure 1E, *P < 0.05). Meanwhile, we also determined the expression of IDH3A in HCC cell lines, such as HepG2, MHCC-97H and Hep3B, while human hepatocytes were used as control. IHD3A expression is significantly increased in HepG2, MHCC-97H and Hep3B than in human hepatocytes (Figure 1F). Collectively, these findings suggested that IDH3A plays a crucial role in the development and progression of HCC.
Figure 1.

IDH3A is upregulated in hepatocellular carcinoma (HCC), and high expression of IDH3A protein is strongly associated with tumor size and advanced stage in HCC. A. The mRNA level of IDH3A in a variety of cancers by online analysis (www.cbioportal.org/public-portal/). B. The expression of IDH3A in HCC by GTEx database (http://gepia.cancer-pku.cn/index.html). C. Representative sections of normal liver tissues and primary and metastatic HCC tissues that were stained with IDH3A antibody are presented. Scale bar=100 μm. The scores were assessed by evaluating the intensity and extent of immunopositivity. Two-tailed unpaired Student’s t test was utilized to analyze the results (*P < 0.05). D. Representative images of samples of clinicopathologic stage I, II and III HCC that were stained with IDH3A antibody are shown. The scores were assessed by evaluating the intensity and extent of immunopositivity. A two-tailed unpaired Student’s t test was utilized to analyze the results (*P < 0.05). E. The survival rate of HCC patients with high or low IDH3A expression was analyzed by the Kaplan-Meier analysis (*P < 0.05). F. The expression of IDH3A in HCC cell lines and human hepatocytes was determined using western blotting and RT-qPCR analyses (*P < 0.05).
Table 1.
Clinic pathologic variables in 41 HCC patients
| Variables | No. (n=41) | IDH3A expression | P value | |
|---|---|---|---|---|
|
| ||||
| Low (n=18) | High (n=23) | |||
| Age | ||||
| < 50 | 15 | 6 | 9 | 0.702 |
| ≥ 50 | 26 | 12 | 14 | |
| Gender | ||||
| Male | 34 | 16 | 18 | 0.369 |
| Female | 7 | 2 | 5 | |
| Tumor size | ||||
| Small (< 5 cm) | 18 | 11 | 7 | 0.050 |
| Large (≥ 5 cm) | 23 | 7 | 16 | |
| clinicopathologic stage | ||||
| I-II | 26 | 15 | 11 | 0.019 |
| III | 15 | 3 | 12 | |
IDH3A promotes EMT and cell migration as well as invasion in HCC
EMT has been found to play a key role in HCC metastasis [11-13]. To decipher the potential role of IDH3A in the regulation of EMT, IDH3A was overexpressed or knocked down in HepG2 cells. The expression of IDH3A and EMT markers was determined by RT-qPCR and western blotting assays (Figure 2A and 2B). The results suggested that ectopic expression of IDH3A led to elevated expression of mesenchymal markers and reduced expression of epithelial markers at both the mRNA and protein levels. On the contrary, inhibition of IDH3A resulted in reduced expression of mesenchymal markers and more evident induction of epithelial markers at both the mRNA and protein levels (Figure 2B).
Figure 2.

IDH3A promotes EMT and cell migration as well as invasion in HCC. A and B. IDH3A was overexpressed or knocked down in HepG2 cells. The expression of IDH3A and EMT markers were determined by RT-qPCR and western blotting analyses (*P < 0.05). C. IDH3A was overexpressed or knocked down in MHCC-97H cells. The expression of MTA1 was determined by RT-qPCR and western blotting analyses (*P < 0.05). D. MHCC-97H cells were transfected with IDH3A siRNA and/or IDH3A for the wound healing assay (*P < 0.05). E. MHCC-97H cells were transfected with IDH3A siRNA and/or IDH3A for the transwell invasion assay (*P < 0.05).
It is believed that EMT promotes tumor progression under malignant conditions [29]. To explore whether the regulation of EMT by IDH3A promotes HCC cell migration and invasion, IDH3A was overexpressed or knocked down in MHCC-97H cells. The expression of IDH3A was determined by RT-qPCR and western blotting assays (Figure 2C). Subsequently, wound healing assay and transwell invasion assay were performed to explore the effect of IDH3A in HCC cells migration and invasion. The results of the wound healing assay revealed that ectopic expression of IDH3A significantly increased the area of wound healing, whereas inhibition of IDH3A reduced the area of wound healing (Figure 2D). In addition, the transwell invasion assay demonstrated that overexpression of IDH3A obviously increased the number of invaded cells, whereas depletion of IDH3A remarkably reduced the number of invaded cells (Figure 2E). Together, the above data suggest that IDH3A promotes EMT and cell migration as well invasion in HCC.
IDH3A regulates MTA1 expression in HCC
To identify the potential gene expression regulated by IDH3A in HCC, IDH3A was knocked down in HepG2 cells using IDH3A siRNAs, and the influence of IDH3A loss-of-function on the global profile of gene expression was analyzed by RNA deep-sequencing (RNA-seq). Several genes were significantly downregulated or upregulated with IDH3A knockdown, such as MTA1 and VEGFA (Figure 3A). Subsequently, we found that IDH3A regulated the different expression genes that are related to several KEGG signaling pathways, including focal adhesion, MAPK signaling pathway, cell cycle and cell adhesion molecules (Figure 3B). Previous reports have been shown that the MAPK signaling pathway and focal adhesion could regulate EMT [30,31], which was consistent with our present work. We next verified whether IDH3A regulates those genes through RT-qPCR assay. Interestingly, we found that MTA1, VEGFA and CASP2 expression were significantly regulated by IDH3A (Figure 3C). To verify that the expression of MTA1 is modulated by IDH3A, IDH3A expression was knocked down in HepG2 cells. Measurement by RT-qPCR and western blotting suggested that inhibition of IDH3A led to a reduced expression of MTA1, which could be rescued by reconstituting the expression of siRNA resistance IDH3A (Figure 3D).
Figure 3.

IDH3A regulates MTA1 expression in HCC. A. Heatmap of 3933 differentially expressed genes in HepG2 cells expressing IDH3A siRNA to siRNA control from three independent biological replicates. B. Bioinformatics analysis of the different gene expression events that were identified in IDH3A-depleted HepG2 cells using the DAVID Functional Annotation Tool (DAVID, https://david.ncifcrf.gov/). C. IDH3A was knocked down in HepG2 cells, RT-qPCR was performed to detect the roles of IDH3A (*P < 0.05). D. HepG2 cells were transfected with IDH3A siRNA and/or IDH3A. The expression of MTA1 was determined by RT-qPCR and western blotting analyses (*P < 0.05).
The expression of MTA1 is increased in HCC and associated with IDH3A expression
We next detected the expression of MTA1 in HCC tissues, and the results of the tissue array showed that MTA1 was also upregulated in HCC tissues compared with adjacent normal tissues (Figure 4A). Further analysis was performed in 41 HCC patients for whom complete information on age, gender and pathological characteristics was available. Remarkably, high expression of MTA1 was strongly associated with pathological characteristics (Figure 4B), while no correlations were found between MTA1 expression and gender, age as well as tumor size (Table 2). Moreover, Kaplan-Meier analysis also revealed that high expression of MTA1 predicted a poor prognosis (Figure 4C, *P < 0.05). In addition, the results of the Pearson analysis strongly indicated that the expression of MTA1 was correlated with IDH3A expression (Figure 4D, Pearson r=0.6456, *P < 0.05).
Figure 4.

The expression of MTA1 is increased in HCC and associated with IDH3A expression. A. Representative sections of adjacent normal tissues and HCC tissue that were stained with MTA1 antibody are presented. Scale bar=100 μm. The scores were assessed via evaluating the intensity and extent of immunopositivity. A two-tailed unpaired Student’s t test was utilized to analyze the results (*P < 0.05). B. Representative images of samples of clinicopathologic stage I, II and III HCC that were stained with MTA1 antibody, the scores were assessed via evaluating the intensity and extent of immunopositivity. A two-tailed unpaired Student’s t test was utilized to analyze the results (*P < 0.05). C. The survival rate of HCC patients with high or low MTA1 expression was analyzed by the Kaplan-Meier analysis (*P < 0.05). D. The correlation between IDH3A expression and MTA1 expression was analyzed by Pearson analysis.
Table 2.
Clinic pathologic variables in 41 HCC patients
| Variables | No. (n=41) | MTA1 expression | P value | |
|---|---|---|---|---|
|
| ||||
| Low (n=16) | High (n=25) | |||
| Age | ||||
| < 50 | 15 | 4 | 11 | 0.218 |
| ≥ 50 | 26 | 12 | 14 | |
| Gender | ||||
| Male | 34 | 15 | 19 | 0.141 |
| Female | 7 | 1 | 6 | |
| Tumor size | ||||
| Small (< 5 cm) | 18 | 10 | 8 | 0.055 |
| Large (≥ 5 cm) | 23 | 6 | 17 | |
| clinicopathologic stage | ||||
| I-II | 26 | 14 | 12 | 0.010 |
| III | 15 | 2 | 13 | |
IDH3A regulates MTA1 expression through Sp1
To better characterize function of IDH3A in HCC, we performed ATAC-seq followed by HOMER motif discovery algorithm in IDH3A-depled HepG2 cells. The argument is because IDH3A is not a sequence-specific DNA-binding protein; it probably is recruited to specific sites through association with transcription factors. Among the list of enriched motifs (Figure 5A), the most highly enriched motif was the binding site for the bZIP family of DNA binding factors (Figure 5A). De novo motif enrichment also assembled the JunB and AP-2α motif (Figure 5A). These data suggest that AP-1, KLF3, specificity protein 1 (SP1) and NYF transcription factors might play an important role in siIDH3A-regulated chromatin accessible region. Previously report has been found that Sp-1 could transcriptionally regulate MTA1 expression [32]. To verify whether Sp-1 transcriptionally regulated MTA1 expression, we analyzed the putative consensus binding sequences for Sp-1 on the promoter region of MTA1 using the Alggen database. The result revealed the presence of several putative consensus binding sequences for the transcription factor specificity protein 1 (SP1) (Figure 5B), indicating a possible contribution of SP1 to the transcriptional regulation of MTA1. We thus cloned a 700 bp fragment (-500 to +200) from the MTA1 promoter region in the upstream of a luciferase reporter gene (MTA1-Luc) and co-transfected these constructs into HepG2 cells with vector or Sp1 and Renilla. The dual luciferase reporter assays revealed that Sp-1 significantly stimulated the luciferase activity of MTA1-Luc (Figure 5C). Moreover, we used anti-Sp1 antibody to performed qChIP assay, the result demonstrated that the fold of enrichment of Sp1 on MTA1 promoter was significantly increased upon IDH3A overexpression; however, inhibition of IDH3A decreased the fold of enrichment of Sp1 on MTA1 promoter (Figure 5D). Furthermore, analyses by RT-qPCR and Western blotting in HepG2 cells transfected with vector or Sp1 or treated with control siRNA or Sp-1 siRNAs showed that ectopic expression of Sp1 resulted in an increase of MTA1 and knockdown of Sp1 resulted in a decrease of MTA1 at both mRNA and protein levels (Figure 5E).
Figure 5.

IDH3A Regulates MTA1 Expression through Sp1. A. TF motifs identified from ATAC-seq peaks. Top known and de novo motif enrichments. B. Sp1 recognized consensus site was identified in the promoter region of MTA1 using a bioinformatics website (http://alggen.lsi.upc.es/cgi-bin/promo_v3/promo/promoinit.cgi?dirDB=TF_8.3). The number represents the nucleotide position relative to the transcription start site (+1). C. HepG2 cells were co-transfected with MTA1-Luc and expression construct for vector or Sp-1 and Renilla. 48 h after the transfection, luciferase activity was measured. Relative luciferase activity was calculated as firefly luciferase activity divided by Renilla luciferase activity and shown relative to the control. D. HepG2 cells were transfected with the vector, IDH3A, or treated with siControl, siIDH3A. qChIP analysis of MTA1 promoters was performed using antibodies against Sp1. Results are represented as fold change over control IgG. E. HepG2 cells were transfected with vector, Sp1, or treated with control siRNA or Sp1 siRNAs. Total RNAs and proteins were extracted and analyzed for the expression of MTA1 by RT-qPCR and Western blotting, respectively.
IDH3A promotes cell migration and invasion through regulating MTA1 expression in HCC
To further investigate whether IDH3A promotes EMT through regulation of MTA1, HepG2 cells were transfected with IDH3A and/or MTA1 siRNA, IDH3A siRNA and/or MTA1. The expression of EMT markers was determined by RT-qPCR and western blotting analyses. The results demonstrated that the effect of IDH3A on EMT was offset by inhibition of MTA1 in IDH3A-overexpressed cells. Meanwhile, the inhibitory effect of IDH3A inhibition on EMT was offset by overexpression of MTA1 in IDH3A-depleted cells (Figure 6A). Subsequently, we investigated whether IDH3A facilitates cell migration and invasion by regulation of MTA1 in MHCC-97H cells. The expression of MTA1 was established by RT-qPCR and western blotting analyses (Figure 6B). The results of the wound healing assay suggested that ectopic expression of IDH3A or MTA1 significantly facilitated wound healing, inhibition of MTA1 in IDH3A-overexpressed cells could offset the effect of IDH3A on wound healing. Meanwhile, inhibition of IDH3A or MTA1 were associated with a decreased wound healing, moreover, ectopic expression of MTA1 in IDH3A-depleted cells could reversed the effect of IDH3A inhibition (Figure 6C). Moreover, transwell assays with MHCC-97H cells showed that ectopic expression of IDH3A or MTA1 significantly promoted cell invasion, the effect of IDH3A on cell invasion was offset by inhibition of MTA1 in IDH3A-overexpressed cells. Meanwhile, inhibition of IDH3A or MTA1 suppressed cell invasion, simultaneous overexpression of MTA1 in IDH3A-depleted cells could offset the effect of IDH3A inhibition (Figure 6D). To further explore the role of IDH3A in metastasis in vivo, MHCC-97H cells stably expressing firefly luciferase were infected with lentiviruses carrying control shRNA or IDH3A shRNA and/or infected with retroviruses carrying MTA1. These cells were injected intravenously into SCID mice. The result of bioluminescence imaging showed that IDH3A depletion was associated with a marked suppression of the lung metastasis, which could be reversed by ectopic expression of MTA1 (Figure 6E). Altogether, these experiments supported a role for IDH3A in regulating cell migration and invasion through regulating MTA1 expression.
Figure 6.

IDH3A promotes cell migration and invasion through regulating MTA1 expression in HCC. A. HepG2 cells were transfected with MTA1, IDH3A and/or MTA1 siRNA, MTA1 siRNA, IDH3A siRNA and/or MTA1. The expression of MTA1 and EMT markers were determined by RT-qPCR and western blotting analyses (*P < 0.05). B. MHCC-97H cells were transfected with MTA1, IDH3A and/or MTA1 siRNA, MTA1 siRNA, IDH3A siRNA and/or MTA1. The expression of MTA1 was determined by RT-qPCR and western blotting analyses (*P < 0.05). C. MHCC-97H cells were transfected with MTA1, IDH3A and/or MTA1 siRNA, MTA1 siRNA, IDH3A siRNA and/or MTA1 for wound-healing assay (*P < 0.05). D. MHCC-97H cells were transfected with MTA1, IDH3A and/or MTA1 siRNA, siMTA1, IDH3A siRNA and/or MTA1 for transwell invasion assay (*P < 0.05). E. MHCC-97H cells that were infected with lentiviruses carrying control shRNA, IDH3A shRNA and/or infected with retroviruses carrying MTA1 were injected intravenously through the tail vein of SCID mice (n=6). Lung metastasis was quantified by bioluminescence imaging.
Discussion
HCC is the fifth leading cause of cancer death worldwide [1,2]. Even though much progress has been made in the treatment of HCC, tumor metastasis and advanced stages of the disease are responsible for the high mortality of HCC [4-6]. Therefore, new therapeutic strategies are emergency required. Metabolic reprogramming is emerging as an essential process which plays a role in improved tumor proliferation and survival. Among the metabolic pathways, the tricarboxylic acid (TCA) cycle is a primary route for the biosynthetic, bioenergetic and redox balance requirements of cells.
Metabolic reprogramming is a critical essential hallmark of cancers, including HCC, as metabolic shifts represent a selective advantage for tumor proliferation, growth as well as survival by maintaining redox balance, the increased synthesis of macromolecules and energy production. Elevated aerobic glycolysis, which also known as the Warburg effect, is a well-known metabolic alteration in cancer cells [33]. Positron emission tomography (PET) based on 18F-fluorodeoxyglucose (18F-FDG) uptake has confirmed that the uptake of glucose is significantly increased in cancer compared to non-proliferating normal tissues [34]. Growing evidence have supported that TCA cycle rewiring plays a crucial role in cancer. Altered gene expression of TCA cycle components resulted in cancer metabolic reprogramming [35,36]. Multiple potential anticancer protein targets of the TCA cycle have been found, such as SDH, FH and MDH2 [37-42]. Deficiency of SDH results in accumulation of succinate, thereby promoting exert pro-inflammatory effects through the generation of mtROS. Especially, upregulation of MDH2 in prostate cancer is associated with chemoresistance and predicts a shorter survival [42].
The isocitrate dehydrogenase (IDH) family contains three isoforms, IDH1, IDH2, and IDH3. These three isoforms catalyze the oxidative decarboxylation of isocitrate to α-KG, but the enzymatic ability of IDH1 and IDH2 depends on NADP+, while the enzymatic ability of IDH3 depends on NAD+ [43]. Previous studies have shown that IDH1 and/or IDH2 mutations occur in glioma [44,45]. These mutations led to the gained function of producing the oncometabolite 2-HG, resulting in reduced levels of 5-hydroxymethylcytosine (5-HmC) through suppressing the α-KG dependent-ten-eleven translocation (TET) family [46]. IDH3 is a rate-limiting step of the TCA cycle which catalyzes an irreversible enzyme reaction [17]. Moreover, aberrant IDH3A expression associates with poor postoperative overall survival of breast and lung cancer patients [18]. Many repots focus on IDH1 and IDH2; however, the detailed roles of IDH3 in HCC is still unknown.
In our present work, we identified that the expression of IDH3A was significantly higher in HCC than in normal tissues. Moreover, high level of IDH3A was associated with tumor size and clinicopathological stage in HCC. To understand the mechanistic role of IDH3A in HCC, we performed RNA-seq in HepG2 cells and found that IDH3A regulated the expression of MTA1. The levels of MTA1 in HCC tumor samples were significantly higher than those in nontumor tissues. The overexpression of MTA1 was associated with higher-grade tumors and poor prognosis [47,48], which are consistent with our observations. Multiple research have shown that MTA1 promotes EMT and metastasis in cancers, such as non-small-cell lung cancer, colorectal cancer and malignant pleural mesothelioma [49-51]. In addition, several in vitro and in vivo assays suggested that that IDH3A promoted EMT, migration and invasion in HCC through regulation of MTA1.
To further decipher the detailed mechanism for IDH3A regulation of MTA1 expression, we performed ATAC-seq followed by HOMER motif discovery algorithm in IDH3A-depleted HepG2 cells. The result indicated that IDH3A influenced chromatin accessibility, and transcription factors Sp1 might play an important role in IDH3A-regulated chromatin accessible region. Sp1 was first identified as a general transcription factor that is required for transcription of ‘housekeeping genes’ [52]. However, increasing evidence demonstrated that high levels of Sp1 is correlate with cancer cell migration and metastasis in several type of cancers, such as breast cancer, pancreatic cancer and gastric cancer [53-55]. These studies underscore the importance of Sp1 in the regulation of a number of pro-invasive factors, such as membrane type 1 matrix metalloproteinase (MT1-MMP), matrix metalloproteinases (MMPs) and MTA1 [32,56,57]. Our finding revealed that IDH3A influenced the chromatin accessibility, Sp1 bound the promoter region of MTA1 and transcriptionally promoted MTA1 expression in HCC.
Here, we found that IDH3A promoted EMT in HCC cells through regulation of MTA1 expression, thereby increasing the migration and invasion of HCC cells (Figure 7). However, there are still several limitations in our work. The detailed mechanism underlying IDH3A regulated MTA1 expression in HCC still need further investigation. IDH3A catalyzes the oxidative decarboxylation of isocitrate to α-KG, a key coenzyme factor of Jumonji C domain-containing histone lysine residue demethylases and TET family of 5-methylcytosine (5-mC) hydroxylases [16,46]. More details about whether IDH3A influences histone or DNA methylation through catalyzing the oxidative decarboxylation of isocitrate to α-KG also raised the question. Moreover, IDH3A is a rate-limiting enzyme of TCA cycle, and aberrant expression of IDH3A in HCC might modulate metabolic reprogramming through the TCA cycle. It is interesting to further explore the effect of IDH3A upregulation in HCC on the flux of various metabolites, such as glucose, ATP, citrate, fumarate and malate. However, our work uncovers the potential of metabolic targets for new HCC treatments.
Figure 7.
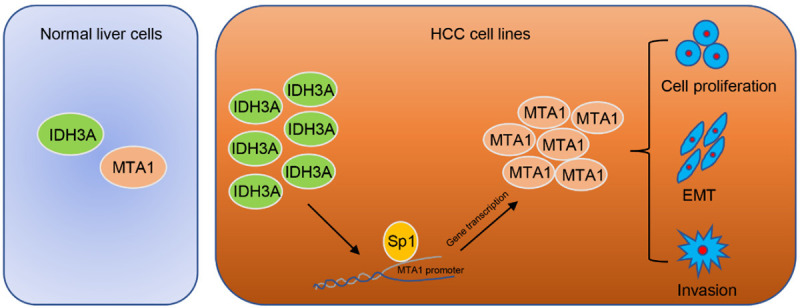
Proposed model for the role of IDH3A in HCC cells. The mechanism of IDH3A-mediated HCC cancer cell migration and invasion as well as EMT is mediated by the regulation of MTA1.
Acknowledgements
This work was supported by grants from the National Natural Science Foundation of China (81972659, 81602473 to W.S), Beijing Natural Science Foundation (7194334 to Y.Q) and Key Clinical Projects of Peking University Third Hospital (BYSYZD2019025 to W.S).
Disclosure of conflict of interest
None.
References
- 1.Siegel RL, Miller KD, Jemal A. Cancer statistics, 2018. CA Cancer J Clin. 2018;68:7–30. doi: 10.3322/caac.21442. [DOI] [PubMed] [Google Scholar]
- 2.Allemani C, Matsuda T, Di Carlo V, Harewood R, Matz M, Niksic M, Bonaventure A, Valkov M, Johnson CJ, Esteve J, Ogunbiyi OJ, Azevedo ESG, Chen WQ, Eser S, Engholm G, Stiller CA, Monnereau A, Woods RR, Visser O, Lim GH, Aitken J, Weir HK, Coleman MP CONCORD Working Group. Global surveillance of trends in cancer survival 2000-14 (CONCORD-3): analysis of individual records for 37 513 025 patients diagnosed with one of 18 cancers from 322 population-based registries in 71 countries. Lancet. 2018;391:1023–1075. doi: 10.1016/S0140-6736(17)33326-3. [DOI] [PMC free article] [PubMed] [Google Scholar]
- 3.Cornella H, Alsinet C, Villanueva A. Molecular pathogenesis of hepatocellular carcinoma. Alcohol Clin Exp Res. 2011;35:821–825. doi: 10.1111/j.1530-0277.2010.01406.x. [DOI] [PubMed] [Google Scholar]
- 4.Llovet JM, Zucman-Rossi J, Pikarsky E, Sangro B, Schwartz M, Sherman M, Gores G. Hepatocellular carcinoma. Nat Rev Dis Primers. 2016;2:16018. doi: 10.1038/nrdp.2016.18. [DOI] [PubMed] [Google Scholar]
- 5.Llovet JM, Di Bisceglie AM, Bruix J, Kramer BS, Lencioni R, Zhu AX, Sherman M, Schwartz M, Lotze M, Talwalkar J, Gores GJ Panel of Experts in HCC-Design Clinical Trials. Design and endpoints of clinical trials in hepatocellular carcinoma. J Natl Cancer Inst. 2008;100:698–711. doi: 10.1093/jnci/djn134. [DOI] [PubMed] [Google Scholar]
- 6.Bruix J, Sherman M Practice Guidelines Committee, American Association for the Study of Liver Diseases. Management of hepatocellular carcinoma. Hepatology. 2005;42:1208–1236. doi: 10.1002/hep.20933. [DOI] [PubMed] [Google Scholar]
- 7.Hanahan D, Weinberg RA. Hallmarks of cancer: the next generation. Cell. 2011;144:646–674. doi: 10.1016/j.cell.2011.02.013. [DOI] [PubMed] [Google Scholar]
- 8.Diepenbruck M, Christofori G. Epithelial-mesenchymal transition (EMT) and metastasis: yes, no, maybe? Curr Opin Cell Biol. 2016;43:7–13. doi: 10.1016/j.ceb.2016.06.002. [DOI] [PubMed] [Google Scholar]
- 9.Yang J, Weinberg RA. Epithelial-mesenchymal transition: at the crossroads of development and tumor metastasis. Dev Cell. 2008;14:818–829. doi: 10.1016/j.devcel.2008.05.009. [DOI] [PubMed] [Google Scholar]
- 10.Kalluri R, Weinberg RA. The basics of epithelial-mesenchymal transition. J Clin Invest. 2009;119:1420–1428. doi: 10.1172/JCI39104. [DOI] [PMC free article] [PubMed] [Google Scholar]
- 11.Peng JM, Bera R, Chiou CY, Yu MC, Chen TC, Chen CW, Wang TR, Chiang WL, Chai SP, Wei Y, Wang H, Hung MC, Hsieh SY. Actin cytoskeleton remodeling drives epithelial-mesenchymal transition for hepatoma invasion and metastasis in mice. Hepatology. 2018;67:2226–2243. doi: 10.1002/hep.29678. [DOI] [PubMed] [Google Scholar]
- 12.Chen DP, Ning WR, Li XF, Wei Y, Lao XM, Wang JC, Wu Y, Zheng L. Peritumoral monocytes induce cancer cell autophagy to facilitate the progression of human hepatocellular carcinoma. Autophagy. 2018;14:1335–1346. doi: 10.1080/15548627.2018.1474994. [DOI] [PMC free article] [PubMed] [Google Scholar]
- 13.Ma M, Xu H, Liu G, Wu J, Li C, Wang X, Zhang S, Xu H, Ju S, Cheng W, Dai L, Wei Y, Tian Y, Fu X. Metabolism-induced tumor activator 1 (MITA1), an energy stress-inducible long noncoding rna, promotes hepatocellular carcinoma metastasis. Hepatology. 2019;70:215–230. doi: 10.1002/hep.30602. [DOI] [PubMed] [Google Scholar]
- 14.Dalziel K. Isocitrate dehydrogenase and related oxidative decarboxylases. FEBS Lett. 1980;117(Suppl):K45–55. doi: 10.1016/0014-5793(80)80569-2. [DOI] [PubMed] [Google Scholar]
- 15.Dang L, White DW, Gross S, Bennett BD, Bittinger MA, Driggers EM, Fantin VR, Jang HG, Jin S, Keenan MC, Marks KM, Prins RM, Ward PS, Yen KE, Liau LM, Rabinowitz JD, Cantley LC, Thompson CB, Vander Heiden MG, Su SM. Cancer-associated IDH1 mutations produce 2-hydroxyglutarate. Nature. 2010;465:966. doi: 10.1038/nature09132. [DOI] [PMC free article] [PubMed] [Google Scholar]
- 16.Figueroa ME, Abdel-Wahab O, Lu C, Ward PS, Patel J, Shih A, Li Y, Bhagwat N, Vasanthakumar A, Fernandez HF, Tallman MS, Sun Z, Wolniak K, Peeters JK, Liu W, Choe SE, Fantin VR, Paietta E, Lowenberg B, Licht JD, Godley LA, Delwel R, Valk PJ, Thompson CB, Levine RL, Melnick A. Leukemic IDH1 and IDH2 mutations result in a hypermethylation phenotype, disrupt TET2 function, and impair hematopoietic differentiation. Cancer Cell. 2010;18:553–567. doi: 10.1016/j.ccr.2010.11.015. [DOI] [PMC free article] [PubMed] [Google Scholar]
- 17.Gabriel JL, Zervos PR, Plaut GW. Activity of purified NAD-specific isocitrate dehydrogenase at modulator and substrate concentrations approximating conditions in mitochondria. Metabolism. 1986;35:661–667. doi: 10.1016/0026-0495(86)90175-7. [DOI] [PubMed] [Google Scholar]
- 18.Zeng L, Morinibu A, Kobayashi M, Zhu Y, Wang X, Goto Y, Yeom CJ, Zhao T, Hirota K, Shinomiya K, Itasaka S, Yoshimura M, Guo G, Hammond EM, Hiraoka M, Harada H. Aberrant IDH3alpha expression promotes malignant tumor growth by inducing HIF-1-mediated metabolic reprogramming and angiogenesis. Oncogene. 2015;34:4758–4766. doi: 10.1038/onc.2014.411. [DOI] [PubMed] [Google Scholar]
- 19.Pakala SB, Rayala SK, Wang RA, Ohshiro K, Mudvari P, Reddy SD, Zheng Y, Pires R, Casimiro S, Pillai MR, Costa L, Kumar R. MTA1 promotes STAT3 transcription and pulmonary metastasis in breast cancer. Cancer Res. 2013;73:3761–3770. doi: 10.1158/0008-5472.CAN-12-3998. [DOI] [PMC free article] [PubMed] [Google Scholar]
- 20.Hofer MD, Kuefer R, Varambally S, Li H, Ma J, Shapiro GI, Gschwend JE, Hautmann RE, Sanda MG, Giehl K, Menke A, Chinnaiyan AM, Rubin MA. The role of metastasis-associated protein 1 in prostate cancer progression. Cancer Res. 2004;64:825–829. doi: 10.1158/0008-5472.can-03-2755. [DOI] [PubMed] [Google Scholar]
- 21.Deng L, Tang J, Yang H, Cheng C, Lu S, Jiang R, Sun B. MTA1 modulated by miR-30e contributes to epithelial-to-mesenchymal transition in hepatocellular carcinoma through an ErbB2-dependent pathway. Oncogene. 2017;36:3976–3985. doi: 10.1038/onc.2016.491. [DOI] [PubMed] [Google Scholar]
- 22.Li DQ, Pakala SB, Nair SS, Eswaran J, Kumar R. Metastasis-associated protein 1/nucleosome remodeling and histone deacetylase complex in cancer. Cancer Res. 2012;72:387–394. doi: 10.1158/0008-5472.CAN-11-2345. [DOI] [PMC free article] [PubMed] [Google Scholar]
- 23.Sen N, Gui B, Kumar R. Role of MTA1 in cancer progression and metastasis. Cancer Metastasis Rev. 2014;33:879–889. doi: 10.1007/s10555-014-9515-3. [DOI] [PMC free article] [PubMed] [Google Scholar]
- 24.Livak KJ, Schmittgen TD. Analysis of relative gene expression data using real-time quantitative PCR and the 2(-Delta Delta C(T)) Method. Methods. 2001;25:402–408. doi: 10.1006/meth.2001.1262. [DOI] [PubMed] [Google Scholar]
- 25.Wang TH, Lin YS, Chen Y, Yeh CT, Huang YL, Hsieh TH, Shieh TM, Hsueh C, Chen TC. Long non-coding RNA AOC4P suppresses hepatocellular carcinoma metastasis by enhancing vimentin degradation and inhibiting epithelial-mesenchymal transition. Oncotarget. 2015;6:23342–23357. doi: 10.18632/oncotarget.4344. [DOI] [PMC free article] [PubMed] [Google Scholar]
- 26.Si W, Huang W, Zheng Y, Yang Y, Liu X, Shan L, Zhou X, Wang Y, Su D, Gao J, Yan R, Han X, Li W, He L, Shi L, Xuan C, Liang J, Sun L, Wang Y, Shang Y. Dysfunction of the reciprocal feedback loop between GATA3- and ZEB2-nucleated repression programs contributes to breast cancer metastasis. Cancer Cell. 2015;27:822–836. doi: 10.1016/j.ccell.2015.04.011. [DOI] [PubMed] [Google Scholar]
- 27.Cerami E, Gao J, Dogrusoz U, Gross BE, Sumer SO, Aksoy BA, Jacobsen A, Byrne CJ, Heuer ML, Larsson E, Antipin Y, Reva B, Goldberg AP, Sander C, Schultz N. The cBio cancer genomics portal: an open platform for exploring multidimensional cancer genomics data. Cancer Discov. 2012;2:401–404. doi: 10.1158/2159-8290.CD-12-0095. [DOI] [PMC free article] [PubMed] [Google Scholar]
- 28.Tang Z, Li C, Kang B, Gao G, Li C, Zhang Z. GEPIA: a web server for cancer and normal gene expression profiling and interactive analyses. Nucleic Acids Res. 2017;45:W98–W102. doi: 10.1093/nar/gkx247. [DOI] [PMC free article] [PubMed] [Google Scholar]
- 29.Liu K, Sun B, Zhao X, Wang X, Li Y, Qiu Z, Gu Q, Dong X, Zhang Y, Wang Y, Zhao N. Hypoxia induced epithelial-mesenchymal transition and vasculogenic mimicry formation by promoting Bcl-2/Twist1 cooperation. Exp Mol Pathol. 2015;99:383–391. doi: 10.1016/j.yexmp.2015.08.009. [DOI] [PubMed] [Google Scholar]
- 30.Lamouille S, Xu J, Derynck R. Molecular mechanisms of epithelial-mesenchymal transition. Nat Rev Mol Cell Biol. 2014;15:178–196. doi: 10.1038/nrm3758. [DOI] [PMC free article] [PubMed] [Google Scholar]
- 31.Ji M, Li W, He G, Zhu D, Lv S, Tang W, Jian M, Zheng P, Yang L, Qi Z, Mao Y, Ren L, Zhong Y, Tu Y, Wei Y, Xu J. Zinc-alpha2-glycoprotein 1 promotes EMT in colorectal cancer by filamin A mediated focal adhesion pathway. J Cancer. 2019;10:5557–5566. doi: 10.7150/jca.35380. [DOI] [PMC free article] [PubMed] [Google Scholar]
- 32.Li DQ, Pakala SB, Reddy SD, Ohshiro K, Zhang JX, Wang L, Zhang Y, Moreno de Alboran I, Pillai MR, Eswaran J, Kumar R. Bidirectional autoregulatory mechanism of metastasis-associated protein 1-alternative reading frame pathway in oncogenesis. Proc Natl Acad Sci U S A. 2011;108:8791–8796. doi: 10.1073/pnas.1018389108. [DOI] [PMC free article] [PubMed] [Google Scholar]
- 33.Warburg O, Wind F, Negelein E. The metabolism of tumors in the body. J Gen Physiol. 1927;8:519–530. doi: 10.1085/jgp.8.6.519. [DOI] [PMC free article] [PubMed] [Google Scholar]
- 34.Almuhaideb A, Papathanasiou N, Bomanji J. 18F-FDG PET/CT imaging in oncology. Ann Saudi Med. 2011;31:3–13. doi: 10.4103/0256-4947.75771. [DOI] [PMC free article] [PubMed] [Google Scholar]
- 35.Chen L, Liu T, Zhou J, Wang Y, Wang X, Di W, Zhang S. Citrate synthase expression affects tumor phenotype and drug resistance in human ovarian carcinoma. PLoS One. 2014;9:e115708. doi: 10.1371/journal.pone.0115708. [DOI] [PMC free article] [PubMed] [Google Scholar]
- 36.Todisco S, Convertini P, Iacobazzi V, Infantino V. TCA cycle rewiring as emerging metabolic signature of hepatocellular carcinoma. Cancers (Basel) 2019;12:68. doi: 10.3390/cancers12010068. [DOI] [PMC free article] [PubMed] [Google Scholar]
- 37.Niemann S, Muller U. Mutations in SDHC cause autosomal dominant paraganglioma, type 3. Nat Genet. 2000;26:268–270. doi: 10.1038/81551. [DOI] [PubMed] [Google Scholar]
- 38.Astuti D, Latif F, Dallol A, Dahia PL, Douglas F, George E, Skoldberg F, Husebye ES, Eng C, Maher ER. Gene mutations in the succinate dehydrogenase subunit SDHB cause susceptibility to familial pheochromocytoma and to familial paraganglioma. Am J Hum Genet. 2001;69:49–54. doi: 10.1086/321282. [DOI] [PMC free article] [PubMed] [Google Scholar]
- 39.Bardella C, Pollard PJ, Tomlinson I. SDH mutations in cancer. Biochim Biophys Acta. 2011;1807:1432–1443. doi: 10.1016/j.bbabio.2011.07.003. [DOI] [PubMed] [Google Scholar]
- 40.Sudarshan S, Shanmugasundaram K, Naylor SL, Lin S, Livi CB, O’Neill CF, Parekh DJ, Yeh IT, Sun LZ, Block K. Reduced expression of fumarate hydratase in clear cell renal cancer mediates HIF-2alpha accumulation and promotes migration and invasion. PLoS One. 2011;6:e21037. doi: 10.1371/journal.pone.0021037. [DOI] [PMC free article] [PubMed] [Google Scholar]
- 41.Lo YW, Lin ST, Chang SJ, Chan CH, Lyu KW, Chang JF, May EW, Lin DY, Chou HC, Chan HL. Mitochondrial proteomics with siRNA knockdown to reveal ACAT1 and MDH2 in the development of doxorubicin-resistant uterine cancer. J Cell Mol Med. 2015;19:744–759. doi: 10.1111/jcmm.12388. [DOI] [PMC free article] [PubMed] [Google Scholar]
- 42.Liu Q, Harvey CT, Geng H, Xue C, Chen V, Beer TM, Qian DZ. Malate dehydrogenase 2 confers docetaxel resistance via regulations of JNK signaling and oxidative metabolism. Prostate. 2013;73:1028–1037. doi: 10.1002/pros.22650. [DOI] [PMC free article] [PubMed] [Google Scholar]
- 43.Stoddard BL, Dean A, Koshland DE Jr. Structure of isocitrate dehydrogenase with isocitrate, nicotinamide adenine dinucleotide phosphate, and calcium at 2.5-A resolution: a pseudo-Michaelis ternary complex. Biochemistry. 1993;32:9310–9316. doi: 10.1021/bi00087a008. [DOI] [PubMed] [Google Scholar]
- 44.Anderson NM, Mucka P, Kern JG, Feng H. The emerging role and targetability of the TCA cycle in cancer metabolism. Protein Cell. 2018;9:216–237. doi: 10.1007/s13238-017-0451-1. [DOI] [PMC free article] [PubMed] [Google Scholar]
- 45.Yen KE, Bittinger MA, Su SM, Fantin VR. Cancer-associated IDH mutations: biomarker and therapeutic opportunities. Oncogene. 2010;29:6409–6417. doi: 10.1038/onc.2010.444. [DOI] [PubMed] [Google Scholar]
- 46.Xu W, Yang H, Liu Y, Yang Y, Wang P, Kim SH, Ito S, Yang C, Wang P, Xiao MT, Liu LX, Jiang WQ, Liu J, Zhang JY, Wang B, Frye S, Zhang Y, Xu YH, Lei QY, Guan KL, Zhao SM, Xiong Y. Oncometabolite 2-hydroxyglutarate is a competitive inhibitor of alpha-ketoglutarate-dependent dioxygenases. Cancer Cell. 2011;19:17–30. doi: 10.1016/j.ccr.2010.12.014. [DOI] [PMC free article] [PubMed] [Google Scholar]
- 47.Hamatsu T, Rikimaru T, Yamashita Y, Aishima S, Tanaka S, Shirabe K, Shimada M, Toh Y, Sugimachi K. The role of MTA1 gene expression in human hepatocellular carcinoma. Oncol Rep. 2003;10:599–604. [PubMed] [Google Scholar]
- 48.Moon WS, Chang K, Tarnawski AS. Overexpression of metastatic tumor antigen 1 in hepatocellular carcinoma: relationship to vascular invasion and estrogen receptor-alpha. Hum Pathol. 2004;35:424–429. doi: 10.1016/j.humpath.2003.11.007. [DOI] [PubMed] [Google Scholar]
- 49.Ma K, Fan Y, Dong X, Dong D, Guo Y, Wei X, Ning J, Geng Q, Wang C, Hu Y, Li M, Niu W, Li E, Wu Y. MTA1 promotes epithelial to mesenchymal transition and metastasis in non-small-cell lung cancer. Oncotarget. 2017;8:38825–38840. doi: 10.18632/oncotarget.16404. [DOI] [PMC free article] [PubMed] [Google Scholar]
- 50.Xue L, Yang D. MiR-421 inhibited proliferation and metastasis of colorectal cancer by targeting MTA1. J BUON. 2018;23:1633–1639. [PubMed] [Google Scholar]
- 51.Xu C, Hua F, Chen Y, Huang H, Ye W, Yu Y, Shen Z. MTA1 promotes metastasis of MPM via suppression of E-cadherin. J Exp Clin Cancer Res. 2015;34:151. doi: 10.1186/s13046-015-0269-8. [DOI] [PMC free article] [PubMed] [Google Scholar]
- 52.Black AR, Black JD, Azizkhan-Clifford J. Sp1 and kruppel-like factor family of transcription factors in cell growth regulation and cancer. J Cell Physiol. 2001;188:143–160. doi: 10.1002/jcp.1111. [DOI] [PubMed] [Google Scholar]
- 53.Wang XB, Peng WQ, Yi ZJ, Zhu SL, Gan QH. Expression and prognostic value of transcriptional factor sp1 in breast cancer. Ai Zheng. 2007;26:996–1000. [PubMed] [Google Scholar]
- 54.Jiang NY, Woda BA, Banner BF, Whalen GF, Dresser KA, Lu D. Sp1, a new biomarker that identifies a subset of aggressive pancreatic ductal adenocarcinoma. Cancer Epidemiol Biomarkers Prev. 2008;17:1648–1652. doi: 10.1158/1055-9965.EPI-07-2791. [DOI] [PubMed] [Google Scholar]
- 55.Yao JC, Wang L, Wei D, Gong W, Hassan M, Wu TT, Mansfield P, Ajani J, Xie K. Association between expression of transcription factor Sp1 and increased vascular endothelial growth factor expression, advanced stage, and poor survival in patients with resected gastric cancer. Clin Cancer Res. 2004;10:4109–4117. doi: 10.1158/1078-0432.CCR-03-0628. [DOI] [PubMed] [Google Scholar]
- 56.Sroka IC, Nagle RB, Bowden GT. Membrane-type 1 matrix metalloproteinase is regulated by sp1 through the differential activation of AKT, JNK, and ERK pathways in human prostate tumor cells. Neoplasia. 2007;9:406–417. doi: 10.1593/neo.07193. [DOI] [PMC free article] [PubMed] [Google Scholar]
- 57.Qin H, Sun Y, Benveniste EN. The transcription factors Sp1, Sp3, and AP-2 are required for constitutive matrix metalloproteinase-2 gene expression in astroglioma cells. J Biol Chem. 1999;274:29130–29137. doi: 10.1074/jbc.274.41.29130. [DOI] [PubMed] [Google Scholar]