

Abstract
Multidrug chemoresistance is a major clinical obstacle in breast cancer treatment. We aimed to elucidate the sensitivity to therapeutics in gemcitabine-resistant breast cancer models. Pooled library screening combined with RNA-seq was conducted to explore the potential targets involved in gemcitabine resistance in breast cancer cells. Cytotoxicity and tumor xenograft assays were used to evaluate the effect of calcium-activated channel subfamily N member 4 (KCNN4) inhibitors on the cellular sensitivity of breast cancer cells to chemotherapeutic drugs both in vitro and in vivo. We found that KCNN4 is an important determinant for the cytotoxicity of gemcitabine. Elevated KCNN4 expression enhanced resistance to chemotherapeutic antimetabolites and promoted cell proliferation. Conversely, silencing KCNN4 or chemical inhibition of KCNN4 by the specific inhibitor TRAM-34 inhibited the chemoresistance and cell proliferation. Mechanistically, KCNN4 upregulated BCL2-related protein A1 (BCL2A1) to suppress apoptosis by activating RAS-MAPK and PI3K-AKT signaling. Moreover, high expression levels of KCNN4 and BCL2A1 were associated with shortened disease-free survival in the cohort studies. Collectively, our findings showed that KCNN4 is a key modulator of progression and drug resistance in breast cancer, indicating that targeting KCNN4 may serve as a promising therapeutic strategy to overcome multidrug chemoresistance in this disease.
Keywords: KCNN4, BCL2A1, breast cancer, chemoresistance, high-throughput screening
Introduction
Breast cancer is the most frequently diagnosed malignancy and the second leading cause of cancer-related death among females worldwide [1]. Although substantial advances in cancer biology and clinical treatment have been achieved, the heterogeneity of breast cancer, which has led to the emergence of several molecular subtypes, is still one of the major challenges for successful treatment. Each of these subtypes has different risk factors for the incidence, therapeutic response, disease progression, and preferential organ sites of metastases [2]. Accordingly, integrated therapy, including hormone therapy, radiation therapy, chemotherapy, targeted therapy and even immunotherapy, is indicated in current clinical practice. Chemotherapy with various agents and regimens remains the fundamental treatment to eliminate breast cancer regardless of molecular subtypes.
Multiple studies have indicated that chemotherapy substantially improves the survival outcomes of breast cancer patients and quality of life. The EBCTCG meta-analysis demonstrated that standard anthracycline-plus-taxane-based adjuvant chemotherapy reduced the relative risk of breast cancer-related mortality at 10 years by 33% compared to no chemotherapy, with an overall absolute benefit of 10% [3]. Nevertheless, half of patients may fail to benefit from chemotherapy as a result of drug resistance [4]. According to the American Cancer Society, treatment failure in more than 90% of patients with metastatic cancer is considered to be caused by resistance to chemotherapy [5]. Moreover, cells resistant to the drugs used in chemotherapy exhibit cross-resistance to other structurally and mechanistically unrelated drugs [6]. Unfortunately, the genomic and molecular bases of chemoresistance remain poorly understood.
The mechanisms determining the chemoresistance of breast cancers, whether intrinsic or acquired, are complicated and involve various molecules. Several molecular mechanisms are associated with the chemo-resistant phenotype of breast cancer, including induction of DNA damage [7], increased efflux and reduced influx, and dysregulation of key oncogenic signaling pathways [8]. Although extensive laboratory and clinical investigations have been conducted to elucidate the underlying biological mechanisms, most yielded mixed results. Furthermore, the dynamic evolution of chemoresistance limits the successful treatment of breast cancer. Consequently, exploring efficient approaches to address this problem and improve the cancer cure rate is one of the priorities of current cancer research [9].
Accumulating evidence supports gemcitabine as a first-line therapeutic agent in metastatic breast cancer [10], and some mechanisms involved in gemcitabine resistance were reported in our previous study [11]. On this basis, herein, we applied high-throughput gain-of-function library screening technology to identify potential genes related to the gemcitabine-resistant phenotype of breast cancer and to explore further molecular mechanisms. Finally, we aimed to identify a strategy to combat refractory breast cancer.
Material and methods
Cell culture and reagents
The HEK293T cell line was obtained from the Shanghai Cell Bank Type Culture Collection Committee in 2014. The human breast cancer cell lines MDA-MB-231 (MDA-231), MDA-MB-468 (MDA-468), MDA-MB-453 (MDA-453), ZR-75-1 and HS578T were obtained from the American Type Culture Collection (ATCC). The gemcitabine-resistant cell line MDA-231-Gem was established in our previous study. All cell lines were cultured in complete medium supplemented with 10% fetal bovine serum and 1% penicillin/streptomycin (Invitrogen, Carlsbad, CA, USA) according to the ATCC recommendations. Gemcitabine, cytarabine (Ara-C), paclitaxel (PTX), docetaxel (DOX) and triarylmethane-34 (TRAM-34) were purchased from Selleck (http://www.selleckchem.com) and dissolved in DMSO for stock solutions.
Gemcitabine resistance gene barcoding (GRGB) library construction, virus production and cell transduction
In the 40 Gene Ontology (GO) terms that were primarily enriched, we searched and matched the ORFs based on 145 genes from the human open reading frame library (hORFeome 5.1). A semirandom 30-bp-long barcode sequence and a flanking primer pair for barcode amplification were synthesized by integrated DNA technology. Double-stranded oligonucleotides were generated by an annealing reaction and ligated into a retroviral pDEST vector. All vectors were validated by Sanger sequencing to confirm their identity. After sequence verification, the ORFs were transferred into the pDEST-barcode vector by LR recombination to construct sets of retrovirus-based pDEST-barcoded-ORF vectors. Each ORF was labeled by two unique barcode and control vectors. A total of 258 pDEST-ORF vectors were pooled as the GRBG library. Retroviral supernatants were generated by transient transfection of 293T cells using polyetherimide and harvested 48 h later. MDA-231 cells were infected using 8 µg/ml polybrene (Sigma-Aldrich, Shanghai, CHN). To ensure that most cells received only 1 viral construct per cell, for retroviral infection, we used a target multiplicity of infection (MOI) of approximately 0.3, corresponding to 30% infectivity after 2 µg/ml puromycin (InvivoGen, San Diego, CA, USA) selection for 5 days.
Two-step PCR and MiSeq sequencing
Two-step PCR was used to amplify the barcode sequence for next-generation sequencing by introducing Illumina adaptors and 5-bp-long index sequences using NEBNext High-Fidelity 2 × PCR Master Mix (NEB, Herts, UK). Amplification was performed with 22 cycles for the first PCR and 11 cycles for the second PCR. For the first PCR, 1.65 µg DNA per sample (assuming 6.6 pg of gDNA per cell) was used to achieve 10000 × coverage over the GRGB library. For each sample, we performed 6 separate 50-µl reactions with 300 ng gDNA in each reaction and then mixed the resulting amplicons. The sequences for the primers used for barcode amplification for the first PCR are as follows: F1: 5’-TCGTCGGCAGCGTCAGATGTGTATAAGAGACAGttcttgtacaaagtggttcgca; R1: 5’-GTCTCGTGGGCTCGGAGATGTGTATAAGAGACAGcctaccggtggatgtggaat.
The second PCR was performed to attach Illumina adaptors and to index the samples. The second PCR was performed in a 50 µl reaction containing 5 µl of the purified product from the first PCR. Labeling each sample with unique indexes enabled us to simultaneously multiplex and sequence different biological samples. The following primers were used for the second PCR: F2: AATGATACGGCGACCACCGAGATCTACAC [8-bp index] TCGTCGGCAGCGTC; R2: CAAGCAGAAGACGGCATACGAGAT [8-bp index] GTCTCGTGGGCTCGG. The resulting amplicons from the second PCR were purified using AMPure XP beads (Beckman Coulter, Nyon, Switzerland), quantified using Qubit2.0 (Life Technologies), mixed and sequenced using MiSeq (Illumina) at the Chinese National Human Genome Center in Shanghai (CHGCS).
Data analysis of next-generation sequencing (NGS)
Raw FASTQ files were demultiplexed using Geneious 7.0 (Biomatters, Inc., Auckland, New Zealand) and divided into each sample according to the different indexes. Reads were processed to contain only the unique barcode sequence and were aligned to the mapping reference sequence from the barcode library. Then, the number of aligned reads for each unique barcode sequence was calculated and normalized as follows: normalized reads per unique barcode for a given sample = reads per barcode/total reads for all barcodes in the sample × 106 + 1. After normalization, enrichment scores (ESs) were calculated using the log2 (Day 14/Day 0 avg), log2 (Day 7/Day 0 avg), log2 (Day 14 gem/Day 14 con) ratios of the normalized read counts for each replicate or the average of two biological replicates. The ES indicates the change in relative abundance observed in a gene relative to the difference in abundance between the initial and final samples for the control, and a positive ES indicates enrichment in the proliferation or gemcitabine resistance assays. Hierarchical clustering analysis and heatmap construction were performed using MeV4.0 (Dana-Farber Cancer Institute, Boston, USA). The avg ES indicates the average of two biological replicates.
Quantitative RT-PCR
RNA was extracted using TRIzol, and quantification was performed using TM7900. cDNA was generated using the SuperScript III First Strand Synthesis System for RT-PCR (Invitrogen). cDNA was subjected to quantitative PCR in triplicate. GAPDH was used as the housekeeping gene to normalize the data. The relative quantity was determined using the ΔΔCt method.
Cell proliferation and cytotoxicity
Cell proliferation was assessed using the IncuCyte live-cell imager (Essen BioScience, Ann Arbor, MI, USA). Briefly, 2 × 10³ cells were seeded into 96-well plates and allowed to acclimatize overnight. The plates were transferred to the IncuCyte and cultured for a total of 7 days, with images collected every 12 h. The medium was replaced every 2 days. To analyze of cytotoxicity, the monolayers were treated with escalating concentrations of drugs or inhibitors with sulforhodamine B (SRB) assays. Dose-response curves were constructed to indicate the half maximal inhibitory concentration (IC50) of each reagent. All experiments were repeated three times in triplicate.
Cell apoptosis analysis
Cells were collected, washed in PBS and stained with an FITC Annexin V apoptosis detection kit (BD Bioscience), and apoptotic cells were then identified and quantified by flow cytometry following the manufacturer’s instructions.
Western blot
Protein extracts were generated as previously described. Equal amounts of protein (20 µg) were resolved by SDS-PAGE and subjected to immunoblot analysis. Antigen-antibody interactions were detected with ECL reagent (Amersham, Amersham, UK). Proteins were detected using the following antibodies: KCNN4 (Abcam) and BCL2A1 (Signalway Antibody, USA). Secondary antibodies were used at a concentration of 1/5000 (Dako, Denmark). Integrated density of bands of western blot was calculated by Image J (NIH, Bethesda, MD, US).
Mouse xenograft studies
All mouse studies were conducted using Institutional Animal Care and Use Committee-approved animal protocols in accordance with the institutional guidelines. All mice were female and allowed to mature to 6-8 weeks prior to injection. To determine the endogenous functionality of KCNN4 and its inhibitor, single cell suspensions of 1 × 10⁶ cells (MDA-231/CON or MDA-231/KCNN4-OE) in Matrigel were orthotopically injected into the mammary gland. Tumor outgrowth in the mice was measured twice weekly, and when an approximate tumor volume of 100 mm3 was reached, the mice were randomized to the treatment or control groups using covariate-adaptive randomization to minimize differences in baseline tumor volumes. Drugs (25 mg/kg gemcitabine or vehicle once a week, 25 mg/kg TRAM-34 or vehicle daily) were simultaneously administered by subcutaneous injection, and the tumor volumes were measured twice weekly until the end stage (an approximate tumor volume of 25 mm3). Tumors were measured with electronic calipers, and the tumor volume was calculated according to the formula Vol = 0.52 × L × W2. For pharmacodynamics studies, the mice were killed by asphyxiation in a chamber with an adequate CO2 flow per AVMA procedures, and the tumors were removed, snap-frozen, and prepared for immunohistochemistry.
Tissue microarray assay (TMA)
The tissue microarray assay was constructed as previously described [11], which was consisted of duplicated cores from different areas of the same tumor to compare staining patterns. Immunohistochemistry for KCNN4 and BCL2A1 was conducted using a two-step protocol (GTVision™III).
Statistical analysis
Statistical analyses were performed using SPSS Software version 22.0 (IBM SPSS Statistics, Chicago, IL, US) and Graph Pad Prism 7. Student’s t test was used to determine the statistical significance between experimental groups. Survival outcomes were estimated using the Kaplan-Meier method and compared between groups using the log-rank test. A two-tailed P < 0.05 was considered significant. The results are presented as the mean and standard error of the mean (SEM).
Results
Identification of candidate genes associated with gemcitabine resistance from a cell model
As our previous study showed, the MDA-231-Gem subline displayed gemcitabine chemoresistance, and we further explored the molecular mechanism involved in gemcitabine resistance. First, we performed a dose-response analysis of gemcitabine in the MDA-231-Gem cells compared with the parental cells. As shown in Supplementary Figure 1A, the IC50 value for gemcitabine in the MDA-231-Gem cells (IC50 = 190 nmol/l) was 100-fold higher than that for the parental line (MDA-231, IC50 = 1.56 nmol/l). Next, we calculated the fold changes of the differentially expressed genes in the MDA-231-Gem cells compared to the MDA-231 cells based on our previous mRNA microarray data, and 829 genes with mRNA levels elevated more than three times were identified (Supplementary Figure 1B). GO analysis revealed 40 pathways with P < 0.01, most of which were correlated with cell adhesion, cell proliferation, drug resistance and so on. Finally, 145 genes involved in these pathways were found to be available in ORFeome 5.1 after removing the overlapping genes (Figure 1A).
Figure 1.

Design of the GRGB library and its application to functional screening for gemcitabine resistance-associated genes. A. GO analysis showed 40 gene sets with P < 0.01 and 228 genes constituting a set of resistance-related candidate genes, including 145 ORFs. B. The design of the GRGB library and its screening schema are illustrated. C. Waterfall chart (left) showing the fold-changes of genes normalized by the log2 (Day 14 gem/Day 14 con) ratios of the read counts in MDA-231 cells. Histogram (right) indicating that a total of 32 genes were selected as contributors to gemcitabine-resistant candidates. D. The clustering of the two barcodes revealed the enriched genes that were consistent in the functional screens. The color scale represents the mean normalized log2 (Day 14 gem/Day 14 con) ratios of the read counts. E. MDA-231 cells were retrovirally transduced with the GRGB library or control vector. The IC50 for MDA-231-Lib is presented. F. Cell proliferation assays were performed with MDA-231-Lib cells that were exposed to a determined concentrations of gemcitabine (IC75) for 14 days. G. CDA, KCNN4, MMP14, C8orf4, FPR1 and BCL2A1 were validated as potential targets for gemcitabine resistance by the cytotoxicity in silico analysis. Experiments were performed in triplicate, and representative results are shown.
Identification of genes contributing to gemcitabine resistance through library screening
To systematically investigate the function of the established gene sets, we applied a recombination-based retroviral expression system to high-throughput screening. The library design, the timeline and an overview of the screening are shown in Figure 1B. Briefly, each gene with two unique barcodes was cloned into an expression vector. All of the clones were mixed in pools in equal amounts to generate a library. Next, the indicated cells were transduced with the library virus at a low MOI (MOI = 0.3). Then, stable cells were derived from selection with puromycin for 5 days and subjected to proliferation and cytotoxicity assays. Finally, genomic DNA, which was extracted from the cells that survived to Day 14 in the cell proliferation and drug response screening, as well as from the original cells after puromycin selection, was used for NGS.
Bioinformatic analyses showed that all of the barcodes corresponding to each gene could be aligned to the library (Supplementary Figure 2A). The cumulative distribution frequency curves demonstrated no significant variation in the total number of barcodes after screening (Supplementary Figure 2B and 2C). The fold changes calculated by the normalized read counts of each gene are presented in Figure 1C. Consequently, with GFP as the negative control and CDA as the positive control, 32 genes were selected as candidates contributing to gemcitabine resistance. Furthermore, proliferation and cytotoxicity assays were performed to validate the in silico analyses in stable MDA-231 cell lines. As shown in Figure 1G, in addition to CDA, KCNN4, MMP14, C8orf4, FPR1 and BCL2A1 were potential targets related to gemcitabine resistance in breast cancer cells.
KCNN4 is associated with chemoresistance
We identified some genes responsible for gemcitabine resistance in breast cancer cells. Processes involving proliferation and apoptosis are common mechanisms for inducing drug resistance in cancer cells. Based on this finding and the fold change of the IC50, we selected KCNN4 for further investigation. A series of breast cancer cell lines were used to examine the baseline expression level of KCNN4 by western blots (Figure 2A). Variation of KCNN4 protein expression was detected in the cell lines, with the strongest enrichment in the MDA-231-Gem and MDA-468 cells; conversely, MDA-231, HS578T, BT549 and MDA-453 cells had relatively lower expression. Gain-of-function assays conducted in MDA-231 and HS578T cells (Supplementary Figure 3A and 3B) demonstrated that overexpression of KCNN4 conferred gemcitabine chemoresistance (Figure 2B-E). In contrast and as expected, loss-of-function assays conducted in MDA-231-Gem and MDA-468 cells (Supplementary Figure 3C and 3D) illustrated that depletion of KCNN4 resensitized the breast cancer cell lines to gemcitabine (Figure 2F-I).
Figure 2.
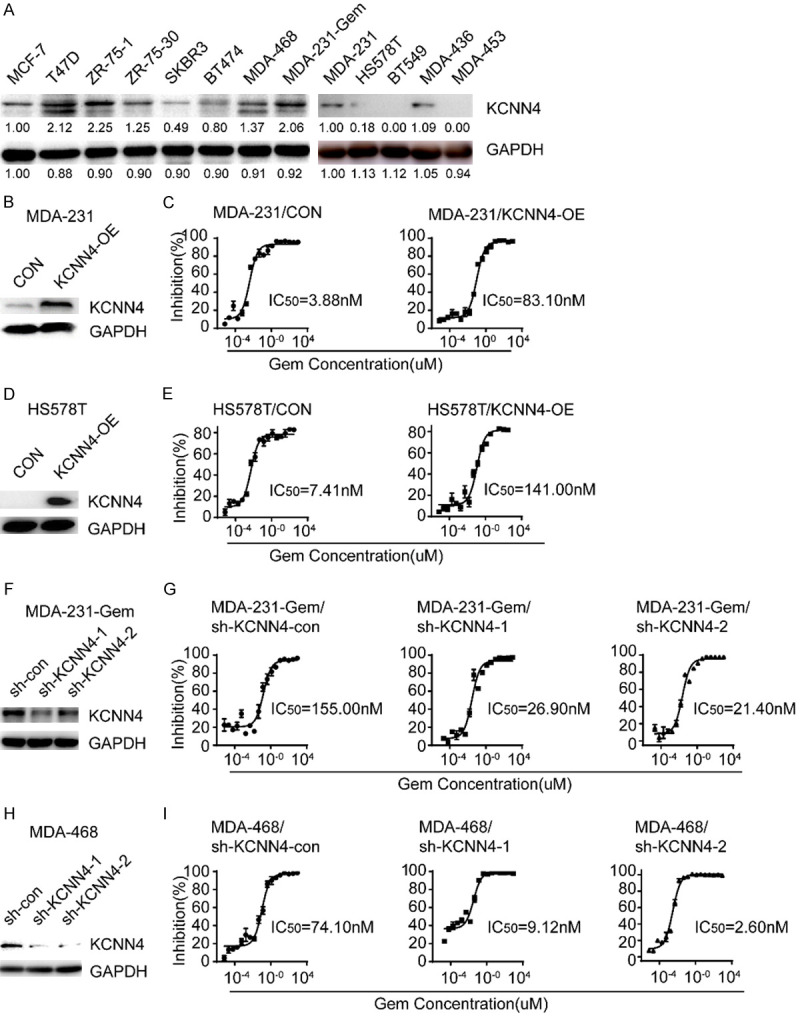
Establishment of KCNN4 overexpression or knockdown cell lines. A. The protein level of KCNN4 in a panel of breast cancer cell lines was detected by western blot. B-E. Western blot and cytotoxicity assays of MDA-231 and HS578T cells stably transduced with KCNN4 and their counterparts. F, H. Western blot assays of MDA-231-Gem and MDA-468 cells stably infected with sh-KCNN4-expressing or sh-KCNN4-negative lentiviruses. G, I. Knockdown of KCNN4 sensitized the cellular response to gemcitabine treatment; the IC50 for each cell line is presented. Experiments were performed in triplicate and representative results are shown.
As immortalization and evasion of programmed cell death are hallmarks of cancer cells, most chemotherapeutics are designed based on these theories. Therefore, cell proliferation and apoptosis were examined in the indicated cells. Figure 3A and 3B show that cells with elevated expression of KCNN4 were highly insensitive to anti-growth signals and resistant to apoptosis and vice versa. We considered whether KCNN4 has a general effect on gemcitabine analogs in breast cancer cells. Accordingly, some antimetabolites [gemcitabine and cytosine arabinoside (Ara-C)] and taxanes (paclitaxel and docetaxel) were used to determine the function of KCNN4. Interestingly, cytotoxicity assays supported our hypothesis to some extent (Figure 3C and 3D), namely, aberrant expression of KCNN4 also resulted in resistance to Ara-C, a kind of antimetabolite, but had a weak or even no influence on taxanes (Supplementary Figure 4A and 4B).
Figure 3.

KCNN4 was associated with cell proliferation, apoptosis and anti-metabolism chemotherapeutic drugs sensitivity. A. Cell proliferation assays were performed with KCNN4 overexpression or knockdown in the indicated cell lines. B. Apoptosis analysis of MDA-231/KCNN4-OE or MDA-231-Gem/sh-KCNN4-1 cells and the corresponding control groups treated with 200 nM gemcitabine and incubated for 4 days. C. MDA-231 (up) and HS578T (down) cells were transfected with KCNN4-OE or control vector. Cells were treated with increasing concentrations of gemcitabine (left) or cytarabine (right) for 5 days; the IC50 is shown. D. MDA-468 (up) and ZR-75-1 (down) cells were lentivirally transduced with NC-shRNA or KCNN4 shRNA. Then, cells were treated with different doses of gemcitabine (left) and cytarabine (right); the IC50 for each cell line is presented. The P values were two-tailed from matched t tests, with ** indicated P < 0.01. Experiments were performed in triplicate, and representative results are shown.
Our results proved that KCNN4 is involved in multidrug chemoresistance, especially antimetabolites.
KCNN4 activates the RAS-MAPK/PI3K-BCL2A1 signaling pathways
The strong effect of KCNN4 on cell proliferation, apoptosis and chemoresistance prompted us to examine the underlying mechanism of this molecule. First, total RNA extracted from MDA-231/KCNN4-OE cells and the corresponding control cells was sent for RNA sequencing (RNA-seq). GO analysis was established based on the RNA-seq results, which revealed that the classical MAPK, NF-κB and PI3K-AKT signaling pathways were the top pathways (Figure 4A). Through the intersection of differentially expressed genes from RNA-seq and library screening, 14 genes with potential roles in regulating breast cancer chemoresistance were obtained (Figure 4B-D). BCL2A1, with an explicit effect on the apoptotic process and a high ranking, attracted our attention. The expression of BCL2A1 in various stable cell lines was examined (Supplementary Figure 3E-I). We further explored the impact of BCL2A1 on gemcitabine chemosensitivity, and the results were encouraging. Similar to KCNN4, increasing BCL2A1 expression enhanced the gemcitabine resistance of breast cancer cells, and decreasing the expression had the opposite effect (Figure 4I and 4J), (Supplementary Figure 5A-D).
Figure 4.
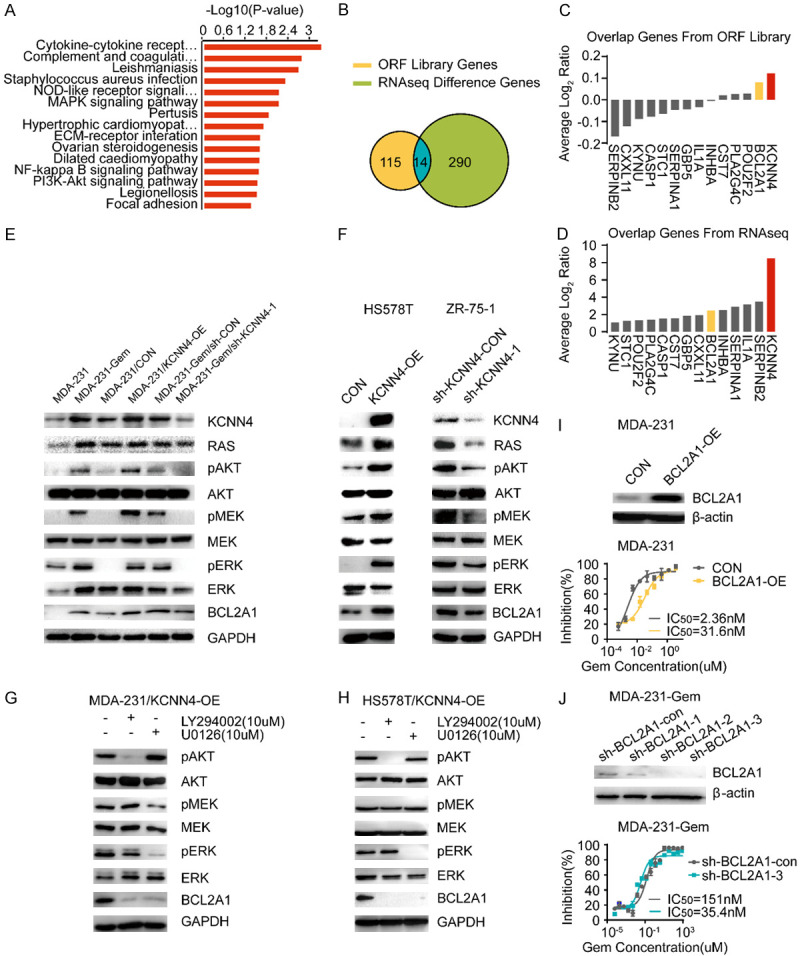
KCNN4 activated the RAS-MAPK/PI3K-BCL2A1 signaling pathway. A. RNA-seq pathway signatures between 231/KCNN4-OE and MDA-231/CON cells ranked by the -Log10 (P-value). B-D. Venn diagram for the interaction genes between ORF library screening and RNA-seq; the overlapped genes from ORF library and RNA-seq are listed. E, F. Western blot was conducted to detect MAPK and PI3K signaling pathway activity using phospho-AKT/MEK/ERK and their downstream molecule, BCL2A1. G, H. Western blot analysis of the variation of MAPK and PI3K signaling pathway activity with or without treatment with LY294002, a highly select inhibitor of phosphatidylinositol 3 (PI3) kinase, or U0126, a selective inhibitor of MEK, in MDA-231/KCNN4-OE cells and HS578T/KCNN4-OE cells. I. MDA-231 cells were retrovirally transduced with BCL2A1-OE or control vector. The protein level was detected by western blot and the IC50 values by cytotoxicity are presented. J. Western blot assays for BCL2A1 after stable knockdown with shRNAs; the corresponding cells were subjected to cytotoxicity analysis to determine the IC50. Experiments were performed in triplicate and representative results are shown.
Based on these results and for validation of the above mechanism, typical components of the MAPK and PI3K-AKT signaling pathways were detected in the indicated cell lines. As shown in Figure 4E and 4F, RAS, pAKT, pERK and BCL2A1 protein levels were upregulated by increasing KCNN4 expression. In contrast, knockdown of KCNN4 resulted in downregulation of RAS, pAKT, pERK and BCL2A1. Furthermore, LY294002 and U0126, inhibitors of PI3K and MAPK, respectively, downregulated members of each pathway and had similar effects on BCL2A1, which is consistent with the data from KCNN4 knockdown (Figure 4G and 4H).
In summary, in breast cancer cell models, our results demonstrated that KCNN4 activates the RAS-MAPK and PI3K-AKT signaling pathways, subsequently upregulating BCL2A1 expression, and is responsible for chemoresistance.
TRAM-34 reverses the phenotypes of KCNN4
Accumulating evidence has shown that inhibitors of various signaling pathways are promising for the treatment of malignancies. TRAM-34 is an inhibitor of KCNN4 (Figure 5A). Cell proliferation assays confirmed its growth inhibitory phenotype with a weak dose-dependent relationship (Figure 5B). In addition, in vitro cytotoxicity assays showed that TRAM-34 could resensitize breast cancer cells to antimetabolites, such as gemcitabine and Ara-C (Figure 5C and 5D). Mechanistically, TRAM-34 sensitized breast cancer cells to antimetabolites through regulation of the RAS-MAPK and PI3K-AKT signaling pathways (Figure 5E). Importantly, our in vivo results were consistent with the in vitro results, which further confirmed our findings (Figure 5F-I). Overall, these results indicate that TRAM-34 can indeed reverse the phenotypes induced by KCNN4.
Figure 5.

TRAM-34 can reverse the function of KCNN4. A. The schematic diagram of TRAM-34, a specific inhibitor of KCNN4. B. Cell proliferation assays were conducted to determine the impact of TRAM-34 on cell growth in MDA-231/KCNN4-OE or HS578T/KCNN4-OE cells. C, D. Cytotoxicity assays were performed to examine the influence of TRAM-34 (5 ug/ml) on sensitivity to gemcitabine or Ara-C, in MDA-231/KCNN4-OE or HS578T/KCNN4-OE cells, respectively. E. Western blot analysis of the activity of the KCNN4-RAS-MAPK/PI3K-AKT-BCL2A1 pathways under treatment with an increasing dose of TRAM-34 in HS578T/KCNN4-OE cells. F, G. The responses of mice given a constant dose of gemcitabine with or without TRAM-34 and tumor volumes are presented as indicated (n = 7 for each group). H. Representative IHC images of KCNN4 staining in xenograft tumor samples. I. Quantification of KCNN4 expression in xenograft tumor samples. The P values were two-tailed from matched t tests, with * indicating P < 0.05, *** indicating P < 0.001, and **** indicating P < 0.0001. Experiments were performed in triplicate, and representative results are shown.
KCNN4 indicates a poor prognosis in breast cancer
To assess the clinical significance of KCNN4 and BCL2A1 in breast cancer, we analyzed the survival outcomes related to KCNN4 and BCL2A1 in a public breast cancer database (http://kmplot.com/analysis/index.php?p=service&cancer=breast). The results demonstrated that higher levels of KCNN4 or BCL2A1 correlated with poorer relapse-free survival (RFS) in patients with breast cancer (P = 0.00079 and P = 7.9e^-0.9, respectively, Figure 6A and 6B).
Figure 6.
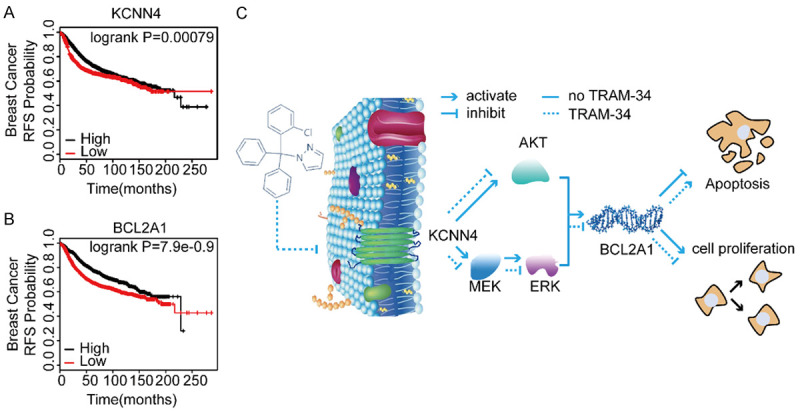
KCNN4 and BCL2A1 indicated a poor prognosis in cancers. A, B. Kaplan-Meier analysis of the relationship between KCNN4 or BCL2A1 and RFS using the Kaplan-Meier plotter database of breast cancer. C. A model depicting the role of KCNN4 upregulation in modulating breast cancer cell response to chemotherapy. In Kaplan-Meier plots, the P values refer to log-rank test results. Experiments were performed in triplicate, and representative results are shown.
In general, the current study suggested that KCNN4 acted as an oncogene to promote cell proliferation and chemoresistance, which may be due to activation of the RAS-MAPK/PI3K-AKT-BCL2A1 signaling pathways. TRAM-34, a highly selective small molecule inhibitor of KCNN4, reversed the effects of KCNN4 both in vitro and in vivo (Figure 6C). Therefore, our study indicated that KCNN4 may be a promising therapeutic target to overcome chemoresistance in breast cancer.
Discussion
Breast cancer is one of the most common malignancies in women worldwide [12]. Major advances in breast cancer therapy have been reported over the last decades. However, patients with advanced disease typically respond poorly to therapeutics, and many still die due to the complexity of refractory breast cancers. Understanding the underlying mechanisms that influence chemotherapeutic resistance in cancer cells is the key to developing new targeted therapies and more efficacious pharmacological approaches. The major findings of this study are as follows. First, some novel genes, including KCNN4, MMP14, C8orf4, FPR1 and BCL2A1, were shown to lead to gemcitabine resistance in breast cancer cells. Moreover, KCNN4 promoted cell proliferation and resistance to cell apoptosis and antimetabolites and indicated an unfavorable prognosis and a poor outcome in breast cancer, while blocking KCNN4 with the specific inhibitor TRAM-34 or directly knocking down KCNN4 reversed these phenotypes both in vitro and in vivo. Finally, activated RAS-MAPK/PI3K-AKT-BCL2A1 signaling pathways may lead to the aggressive behaviors induced by KCNN4.
KCNN4 is an intermediate conductance Ca2+-activated potassium channel that is sensitive to charges in intracellular Ca2+ and is voltage-independent [13]. This channel has been related to tumor grade, cell proliferation, metastatic spread, and cell cycle progression in several cancer types, including prostate, pancreatic, and breast cancers [14-17], melanoma [18], endometrial cancer [19], and non-small cell lung cancer [20]. KCNN4 expression has been shown to be upregulated in many cancers. Consistent with this finding, we found that KCNN4 is upregulated in gemcitabine-resistant cells compared to parental cells. Given the versatile attributes of KCNN4, we hypothesized that it may have a similar effect on other chemotherapeutic analogs. Although no effect on taxanes was found, our results demonstrated that high KCNN4 expression induces antimetabolite resistance in breast cancer, and that low expression had the opposite effect. To some extent, our results are consistent with those in a recent study conducted by Corinna J. Mohr et al. reporting that KCNN4 conferred radioresistance to breast cancer cells but had no significant association with the antiproliferative effects of cytotoxic drugs, such as docetaxel, doxorubicin, 5-fluorouracil and cyclophosphamide [21]. Notably, our results confirmed the role of KCNN4 in resistance to antimetabolites. Several explanations may account for the discrepancies with this recent study. The key mediator of KCNN4 function is caspase activation of stress response signaling pathways, such as the MAPK and PI3K pathways presented in our study. In addition, different antitumor drugs may show different effects. However, the detailed mechanisms require further elucidation.
Various mechanisms have been proposed to explain how KCNN4 mediates tumor growth. The NF-κB, ERK, ER stress, MAPK, TGF-β1 and PI3K signaling pathways were all shown to contribute to the growth induced by KCNN4 in previous studies [22-24]. These pathways are related to many processes with important roles in cancer development and progression, such as apoptosis, proliferation and migration. As expected, in the current study, the MAPK and PI3K signaling pathways were strongly associated with KCNN4, which is consistent with past studies. Through rigorous experiments, we found that the antiproliferative effects of TRAM-34 in our study are likely due to downregulation of the RAS-MAPK/PI3K-AKT signaling pathways in breast cancer cell lines. However, this conclusion lacks verification in vivo, which is the limitation in this study.
Further analysis of the sequencing data identified another molecule, BCL2A1. BCL2A1 is a member of the BCL-2 family of antiapoptotic proteins that confer resistance to anticancer drugs. Although BCL2A1 is located in the downstream cascades of numerous signaling pathways, no agents targeting BCL2A1 are currently available [25]. Transcription of BCL2A1 is regulated by NF-κB and ELK1, which are downstream effectors of the MAPK/PI3K-AKT pathways [26,27]. Our western blot and phenotypic data indicated that BCL2A1 may be downstream of KCNN4 in breast cancer cells. Therefore, we demonstrated that high expression of KCNN4 can activate RAS and then stimulate the MAPK/PI3K-AKT signaling pathways, finally causing BCL2A1 transcription, which results in cell proliferation and antiapoptotic effects. Further studies are needed to support this conclusion. To date, some inhibitors directly targeting these two pathways have emerged; nevertheless, severe side effects or off-target effects have limited their use in routine clinical practice. Consequently, whether KCNN4 is a suitable therapeutic target in the management of breast cancer should be examined.
TRAM-34, which is derived from clotrimazole, is a well-known inhibitor used to study the role of KCNN4. TRAM-34 has been reported to effectively inhibit proliferation and motility in several types of human cancers, including hepatocellular carcinoma, glioblastoma and lung cancer [20,28,29]. Consistent with these results, our study showed that TRAM-34 can block the proliferation of KCNN4 and sensitize breast cancer to antimetabolites, suggesting that targeting KCNN4 should be investigated in preclinical and clinical investigations.
In conclusion, we found that KCNN4 has several functions in breast cancer cells. Our results clearly identified KCNN4 as an important player in cell proliferation. Moreover, the results from different cytotoxicity assays indicated a role of KCNN4 in chemoresistance, especially against antimetabolites. Pharmacological inhibition of KCNN4 with TRAM-34 reversed the phenotypes of KCNN4. Clinically, KCNN4 is correlated with unfavorable outcomes in breast cancer. Further studies are required to elucidate the complete underlying mechanism, and the anomalous effect of KCNN4 blockers should be considered in therapeutic strategies.
Acknowledgements
This study was supported by grants from The National Natural Science Foundation of China (No. 81672817), The National Natural Science Foundation of China (No. 81672601) and the National Natural Science Foundation of China (No. 81872137).
Disclosure of conflict of interest
None.
Supporting Information
References
- 1.Siegel RL, Miller KD, Jemal A. Cancer statistics, 2017. CA Cancer J Clin. 2017;67:7–30. doi: 10.3322/caac.21387. [DOI] [PubMed] [Google Scholar]
- 2.Tong CWS, Wu M, Cho WCS, To KKW. Recent advances in the treatment of breast cancer. Front Oncol. 2018;8:227. doi: 10.3389/fonc.2018.00227. [DOI] [PMC free article] [PubMed] [Google Scholar]
- 3.Early Breast Cancer Trialists’ Collaborative Group (EBCTCG) Peto R, Davies C, Godwin J, Gray R, Pan HC, Clarke M, Cutter D, Darby S, McGale P, Taylor C, Wang YC, Bergh J, Di Leo A, Albain K, Swain S, Piccart M, Pritchard K. Comparisons between different polychemotherapy regimens for early breast cancer: meta-analyses of long-term outcome among 100,000 women in 123 randomised trials. Lancet. 2012;379:432–444. doi: 10.1016/S0140-6736(11)61625-5. [DOI] [PMC free article] [PubMed] [Google Scholar]
- 4.O’Driscoll L, Clynes M. Biomarkers and multiple drug resistance in breast cancer. Curr Cancer Drug Targets. 2006;6:365–384. doi: 10.2174/156800906777723958. [DOI] [PubMed] [Google Scholar]
- 5.Longley DB, Johnston PG. Molecular mechanisms of drug resistance. J Pathol. 2005;205:275–292. doi: 10.1002/path.1706. [DOI] [PubMed] [Google Scholar]
- 6.Gottesman MM, Fojo T, Bates SE. Multidrug resistance in cancer: role of ATP-dependent transporters. Nat Rev Cancer. 2002;2:48–58. doi: 10.1038/nrc706. [DOI] [PubMed] [Google Scholar]
- 7.Wang S, Zou Z, Luo X, Mi Y, Chang H, Xing D. LRH1 enhances cell resistance to chemotherapy by transcriptionally activating MDC1 expression and attenuating DNA damage in human breast cancer. Oncogene. 2018;37:3243–3259. doi: 10.1038/s41388-018-0193-4. [DOI] [PubMed] [Google Scholar]
- 8.The Lancet. Breast cancer targeted therapy: successes and challenges. Lancet. 2017;389:2350. doi: 10.1016/S0140-6736(17)31662-8. [DOI] [PubMed] [Google Scholar]
- 9.Li Y, Gao X, Yu Z, Liu B, Pan W, Li N, Tang B. Reversing multidrug resistance by multiplexed gene silencing for enhanced breast cancer chemotherapy. ACS Appl Mater Interfaces. 2018;10:15461–15466. doi: 10.1021/acsami.8b02800. [DOI] [PubMed] [Google Scholar]
- 10.Hu XC, Zhang J, Xu BH, Cai L, Ragaz J, Wang ZH, Wang BY, Teng YE, Tong ZS, Pan YY, Yin YM, Wu CP, Jiang ZF, Wang XJ, Lou GY, Liu DG, Feng JF, Luo JF, Sun K, Gu YJ, Wu J, Shao ZM. Cisplatin plus gemcitabine versus paclitaxel plus gemcitabine as first-line therapy for metastatic triple-negative breast cancer (CBCSG006): a randomised, open-label, multicentre, phase 3 trial. Lancet Oncol. 2015;16:436–46. doi: 10.1016/S1470-2045(15)70064-1. [DOI] [PubMed] [Google Scholar]
- 11.Ye FG, Song C, Cao ZG, Xia C, Chen DN, Chen L, Li S, Qiao F, Ling H, Hu X. Cytidine deaminase axis modulated by miR-484 differentially regulates cell proliferation and chemoresistance in breast cancer. Cancer Res. 2015;75:1504–15. doi: 10.1158/0008-5472.CAN-14-2341. [DOI] [PubMed] [Google Scholar]
- 12.Bray F, Ferlay J, Soerjomataram I, Siegel RL, Torre LA, Jemal A. Global cancer statistics 2018: GLOBOCAN estimates of incidence and mortality worldwide for 36 cancers in 185 countries. CA Cancer J Clin. 2018;68:394–424. doi: 10.3322/caac.21492. [DOI] [PubMed] [Google Scholar]
- 13.Zhao H, Guo E, Hu T, Sun Q, Wu J, Lin X, Luo D, Sun C, Wang C, Zhou B. KCNN4 and S100A14 act as predictors of recurrence in optimally debulked patients with serous ovarian cancer. Oncotarget. 2016;7:43924. doi: 10.18632/oncotarget.9721. [DOI] [PMC free article] [PubMed] [Google Scholar]
- 14.Lallet-Daher H, Roudbaraki M, Bavencoffe A, Mariot P, Gackiere F, Bidaux G, Urbain R, Gosset P, Delcourt P, Fleurisse L. Intermediate-conductance Ca2+-activated K+ channels (IK Ca1) regulate human prostate cancer cell proliferation through a close control of calcium entry. Oncogene. 2009;28:1792. doi: 10.1038/onc.2009.25. [DOI] [PubMed] [Google Scholar]
- 15.Ohya S, Kimura K, Niwa S, Ohno A, Kojima Y, Sasaki S, Kohri K, Imaizumi Y. Malignancy grade-dependent expression of K+-channel subtypes in human prostate cancer. J Pharmacol Sci. 2009;109:148–51. doi: 10.1254/jphs.08208sc. [DOI] [PubMed] [Google Scholar]
- 16.Jäger H, Dreker T, Buck A, Giehl K, Gress T, Grissmer S. Blockage of intermediate-conductance Ca2+-activated K+ channels inhibit human pancreatic cancer cell growth in vitro. Mol Pharmacol. 2004;65:630–8. doi: 10.1124/mol.65.3.630. [DOI] [PubMed] [Google Scholar]
- 17.Haren N, Khorsi H, Faouzi M, Ahidouch A, Sevestre H, Ouadid-Ahidouch H. Intermediate conductance Ca2+ activated K+ channels are expressed and functional in breast adenocarcinomas: correlation with tumour grade and metastasis status. Histol Histopathol. 2010;25:1247–55. doi: 10.14670/HH-25.1247. [DOI] [PubMed] [Google Scholar]
- 18.Tajima N, Schönherr K, Niedling S, Kaatz M, Kanno H, Schönherr R, Heinemann SH. Ca2+-activated K+ channels in human melanoma cells are up-regulated by hypoxia involving hypoxia-inducible factor-1α and the von Hippel-Lindau protein. J Physiol. 2006;571:349–59. doi: 10.1113/jphysiol.2005.096818. [DOI] [PMC free article] [PubMed] [Google Scholar]
- 19.Wang ZH, Shen B, Yao HL, Jia YC, Ren J, Feng YJ, Wang YZ. Blockage of intermediate-conductance-Ca(2+) -activated K(+) channels inhibits progression of human endometrial cancer. Oncogene. 2007;26:5107–14. doi: 10.1038/sj.onc.1210308. [DOI] [PubMed] [Google Scholar]
- 20.Bulk E, Ay AS, Hammadi M, Ouadid-Ahidouch H, Schelhaas S, Hascher A, Rohde C, Thoennissen NH, Wiewrodt R, Schmidt E. Epigenetic dysregulation of KCa3.1 channels induces poor prognosis in lung cancer. Int J Cancer. 2015;137:1306–1317. doi: 10.1002/ijc.29490. [DOI] [PubMed] [Google Scholar]
- 21.Mohr CJ, Gross D, Sezgin EC, Steudel FA, Ruth P, Huber SM, Lukowski R. K3.1 channels confer radioresistance to breast cancer cells. Cancers (Basel) 2019;11:1285. doi: 10.3390/cancers11091285. [DOI] [PMC free article] [PubMed] [Google Scholar]
- 22.Dolcet X, Llobet D, Pallares J, Matias-Guiu X. NF-kB in development and progression of human cancer. Virchows Arch. 2005;446:475–482. doi: 10.1007/s00428-005-1264-9. [DOI] [PubMed] [Google Scholar]
- 23.Yu Z, Yi M, Wei T, Gao X, Chen H. KCa3.1 inhibition switches the astrocyte phenotype during astrogliosis associated with ischemic stroke via endoplasmic reticulum stress and mapk signaling pathways. Front Cell Neurosci. 2017;11:319. doi: 10.3389/fncel.2017.00319. [DOI] [PMC free article] [PubMed] [Google Scholar]
- 24.Huang C, Shen S, Ma Q, Chen J, Gill A, Pollock CA, Chen XM. Blockade of KCa3.1 ameliorates renal fibrosis through the TGF-β1/Smad pathway in diabetic mice. Diabetes. 2013;62:2923–34. doi: 10.2337/db13-0135. [DOI] [PMC free article] [PubMed] [Google Scholar]
- 25.Hiraki M, Maeda T, Mehrotra N, Jin C, Alam M, Bouillez A, Hata T, Tagde A, Keating A, Kharbanda S. Targeting MUC1-C suppresses BCL2A1 in triple-negative breast cancer. Signal Transduct Target Ther. 2018;3:13. doi: 10.1038/s41392-018-0013-x. [DOI] [PMC free article] [PubMed] [Google Scholar]
- 26.Vogler M. BCL2A1: the underdog in the BCL2 family. Cell Death Differ. 2012;19:67–74. doi: 10.1038/cdd.2011.158. [DOI] [PMC free article] [PubMed] [Google Scholar]
- 27.Lee SY, Choi HC, Choe YJ, Shin SJ, Lee SH, Kim HS. Nutlin-3 induces BCL2A1 expression by activating ELK1 through the mitochondrial p53-ROS-ERK1/2 pathway. Int J Oncol. 2014;45:675–682. doi: 10.3892/ijo.2014.2463. [DOI] [PubMed] [Google Scholar]
- 28.D’alessandro G, Catalano M, Sciaccaluga M, Chece G, Cipriani R, Rosito M, Grimaldi A, Lauro C, Cantore G, Santoro A. KCa3.1 channels are involved in the infiltrative behavior of glioblastoma in vivo. Cell Death Dis. 2013;4:e773. doi: 10.1038/cddis.2013.279. [DOI] [PMC free article] [PubMed] [Google Scholar]
- 29.Liu Y, Zhao L, Ma W, Cao X, Chen H, Feng D, Liang J, Yin K, Jiang X. The blockage of KCa3.1 channel inhibited proliferation, migration and promoted apoptosis of human hepatocellular carcinoma cells. J Cancer. 2015;6:643. doi: 10.7150/jca.11913. [DOI] [PMC free article] [PubMed] [Google Scholar]
Associated Data
This section collects any data citations, data availability statements, or supplementary materials included in this article.