Abstract
Background: Cholangiocarcinoma (CHOL) is one of the most fatal malignancies worldwide. PBRM1 is a tumor suppressor gene in diverse cancers. It regulates cell cycle, genomic stability, centromeric cohesion, and apoptosis. However, its relevance to remodel tumor cell immune response of PBRM1 in CHOL remains unclear. Methods: PBRM1 mutation and expression of CHOL patients were analyzed by the TCGA database using R packages and cBioPortal site. The correlation between PBRM1 and tumor cell immune infiltrates among CHOL patients was investigated by TIMER2.0. Correlation analysis between PBRM1 and gene markers of tumor-infiltrating immune cells in CHOL was analyzed by GEPIA. Pathway enrichment analysis and protein-protein interaction network of PBRM1 mutation and expression was investigated using STRING and Cytoscape. Results: Among CHOL patients, PBRM1 has a high mutation probability and significant differential expression. Mutations and differential expression of PBRM1 both have a significant effect on the infiltration of cancer associated fibroblasts (CAF) in CHOL patients. PBRM1 was highly correlated with MMP2 and FAK, which were reported as key regulators of CAF. Through protein-protein interaction network with hub gene analysis, we discovered that NCAM1 could play key roles in the potential mechanism of how PBRM1 affects immune infiltration and progress of CHOL. Conclusion: PBRM1 may play an important role in immune cell infiltration, matrix formation, and tumor invasion of CHOL, by regulating the function and infiltrating of tumor stromal cells including cancer-associated fibroblasts through NCAM1. Therefore, PBRM1 might be a new therapeutic target in CHOL.
Keywords: PBRM1, Cholangiocarcinoma (CHOL), immune cell infiltration, cancer associated fibroblast(CAF), NCAM1
Introduction
Cholangiocarcinoma (CHOL) is an adenocarcinoma of biliary epithelial cells [1,2], including the intrahepatic, perihilar, and distal subsets. Incidence rates of CHOL in Asia were reported the highest all around the world, most likely because of the high occurrence of chronic infection with liver flukes in the Asian area [3]. Recently, studies demonstrated that the incidence and mortality of intrahepatic cholangiocarcinomas were increasing, while those of extrahepatic cholangiocarcinomas were declining worldwide [3]. Surgical treatment is the preferred option for all types, but the 5-year overall survival is unsatisfactory [4,5]. Similarly to pancreatic cancer, CHOL often subsequently generates a strong desmoplastic reaction, highlighting the relevance of microenvironments to its pathogenesis [1]. The tumor micro-environment in CHOL includes stromal cells, mainly consisting of cancer-associated fibroblasts, innate immune cells such as tumor-associated macrophages, neutrophils, and tumor-infiltrating lymphocytes. The highly desmoplastic characteristic of CHOL and the extensive support by a complex tumor microenvironment all contribute to its therapeutic resistance [6]. Therefore, to discover novel effective therapeutic targets, identifying the complex relationship between the host cell and malignant cholangiocytes is necessary. Targeting the immune infiltration cells and the stromal cells could provide novel strategies to prevent the progression of CHOL.
Polybromo-1 (PBRM1), also called BAF180, located on chromosome 3p21, functions as a part of SWI/SNF chromatin remodeling complex [7]. PBRM1 is a tumor suppressor gene in diverse cancers. Previous studies reported the effect of PBRM1 on cell cycle controlling, genomic stability, centromeric cohesion, and apoptosis [8]. It was discovered that PBRM1 mutation was an early event in carcinogenesis [9]. In addition, mutations of PBRM1 were related to the progression of kidney renal clear cell carcinoma (KIRC), and associated with clinical benefit of immunotherapy in KIRC [10]. However, the effect of PBRM1 mutations on immune response remains undefined and the molecular mechanism of PBRM1 in cancers is not fully understood. Meanwhile, PBRM1 was the second most frequently mutated gene in CHOL. As a result, PBRM1 may act as a key regulator of tumor cell immune response in CHOL, and could be a novel effective therapeutic target for CHOL.
Materials and methods
TCGA database analysis
The expression level of the PBRM1 gene in diverse cancers was identified in the TCGA database (https://portal.gdc.cancer.gov/). The threshold of high expression was determined according to the fold change of 2, and the gene was ranked of all.
Mutations alterations analysis with cBioportal
The cBioPortal for Cancer Genomics (http://cbioportal.org) provides a Web resource for exploring, visualizing, and analyzing multidimensional cancer genomics data [11]. We used this site to discover the features of PBRM1 mutation.
TIMER2.0 database analysis
TIMER2.0 is a comprehensive online resource for analysis of immune cell infiltration among diverse cancers (http://timer.cistrome.org/). TIMER applies a deconvolution previously published statistical method to infer the abundance of tumor-infiltrating immune cells (TIICs) from gene expression profiles [12]. We analyzed PBRM1 expression in CHOL and the correlation of PBRM1 expression with the abundance of immune infiltrates, including B cells, CD4+ T cells, CD8+ T cells, neutrophils, macrophages, and dendritic cells, via gene modules.
Correlation analysis between PBRM1 and gene markers of tumor-infiltrating immune cells
Correlations between PBRM1 expression and gene markers of tumor-infiltrating immune cells were performed using GEPIA database (http://gepia.cancer-pku.cn/) [13]. The gene markers of tumor-infiltrating immune cells included markers of Tregs, B cells, CAF, and neutrophils, which are significant in prior results. Gene markers of tumor-infiltrating immune cells pairs with R > 0.1 and P-value < 0.05 were considered as significant pairs.
Pathway enrichment analysis and protein-protein interaction network with hub genes analysis
Pathway enrichment analysis was analyzed using STRING v10.0 and was visualized by ggplot2 R packages. Protein-protein interaction network for enriched target genes was analyzed using STRING v10.0 and visualized by Cytoscape v3.4.0. Genes with top ten degrees were identified as hub genes using Cytoscape v3.4.0 [14].
Statistic analysis
Most of the statistical analysis has been done by the bioinformatic tools mentioned above. Results were shown as mean ± SD. Paired student’s t-test was used to evaluate expression differences of genes or PBRM1 between the altered group and the unaltered group, normal tissue group and tumor group. Differences between the two groups were estimated by unpaired Student’s t-test. A two-tailed value of P < 0.05 was considered as statistically significant. Correlations between PBRM1 expression and gene markers were analyzed with Spearman correlation analysis, while P < 0.05 was considered as statistically significant.
Results
PBRM1 mutation in CHOL
To clarify the relevance of PBRM1 mutation in human cancers, we profiled PBRM1 mutation by data extracted from TCGA. As shown in Figure 1, the mutation frequency of PBRM1 is almost significantly different in diverse cancers. PBRM1 has the highest mutation frequency in KIRC among all diverse cancers explored, which is known to be associated with a less immunogenic TME and upregulated angiogenesis [10]. The mutation frequency of PBRM1 in CHOL is secondly high, suggesting that PBRM1 may also play an important role in the progression of CHOL. Indeed, the overall survival of the PBRM1 mutant group was significantly higher than that of the PBRM1 WT group (Figure 2A, P=0.0132). These results indicate that PBRM1 mutation may have high prognostic values, and function in tumorigenesis and tumor progression of CHOL.
Figure 1.
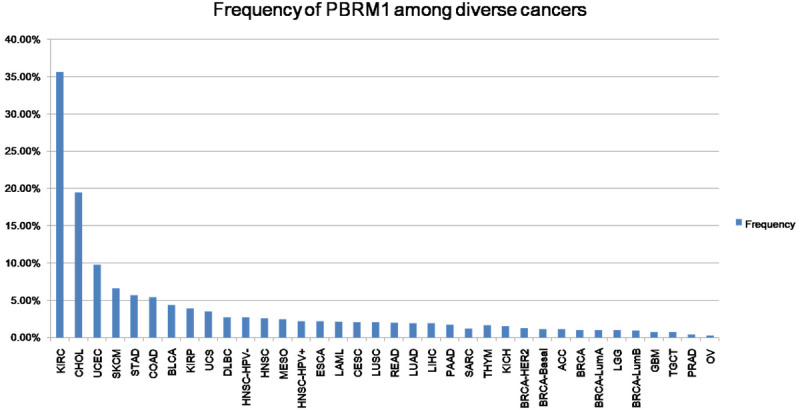
PBRM1 mutation frequency among diverse cancers. The mutation frequency of PBRM1 in each tumor from TCGA database.
Figure 2.
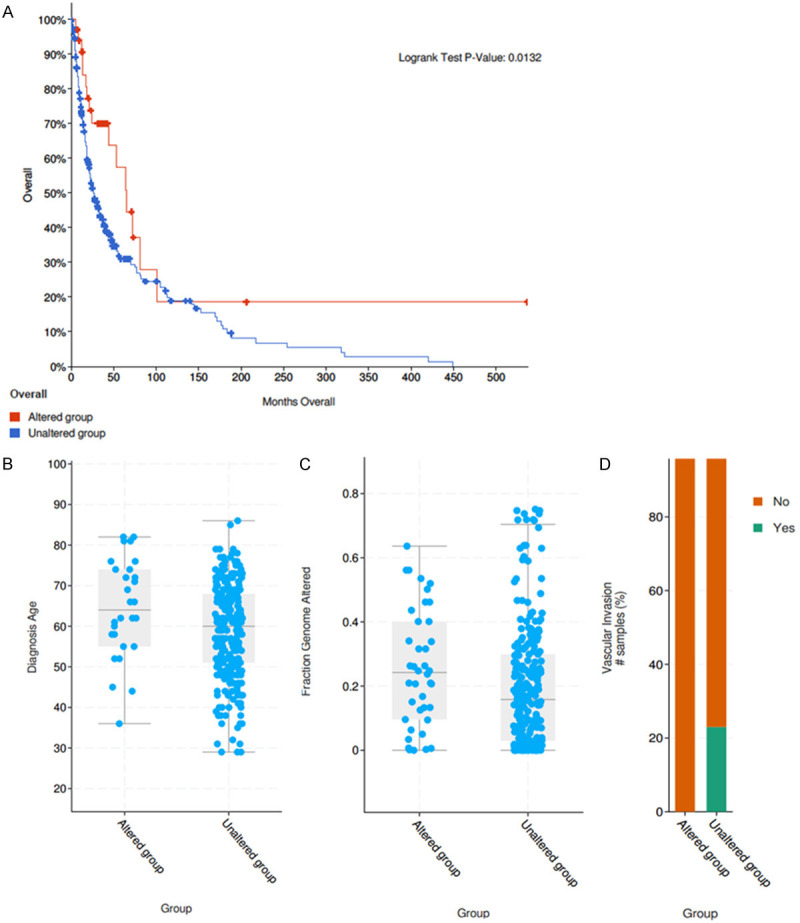
Clinical features between PBRM1 mutated group and WT group in CHOL. (A) The overall survival of the PBRM1 mutant group compared with the PBRM1 unmutated group (P=0.0132 < 0.05) (B, P-vlaue =3.722e-3). The diagnostic age in PBRM1 mutated group and WT group (C, P-vlaue =5.286e-3. The genomic mutation ratio in the mutation group and WT group (D, P-vlaue =0.133). The vascular invasion events in the mutation group and WT group.
Using data from cBioportal, we explored whether the clinical characteristics of CHOL patients between mutation group and WT group were different. Interestingly, the diagnostic age at diagnosis was significantly older, the genomic mutation ratio was greater while the vascular invasion ratio was less in PBRM1 mutated group than WT group (Figure 2B-D, P vlaue =3.722e-3, 5.286e-3, 0.133). The different clinical traits in PBRM1 mutated group demonstrated that the PBRM1 mutation might play a key role in tumorigenesis and invasion of CHOL.
Differential expression of PBRM1 in various tumors and in different CHOL stages
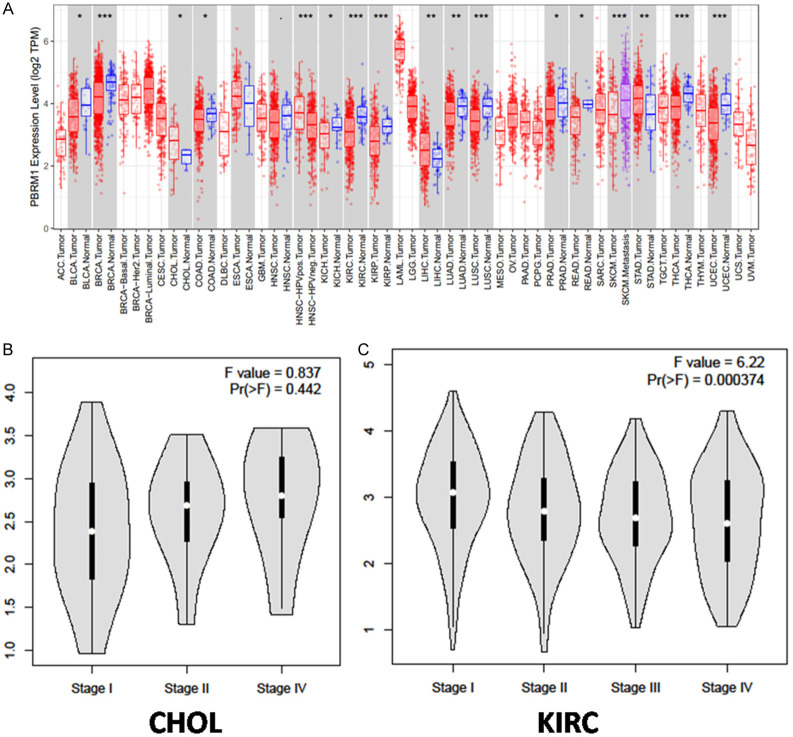
The differential expression of PBRM1 in different tumors compared with normal samples was analyzed using data extracted from TCGA database. In most tumors, such as KIRC and KITH, the expression of PBRM1 was significantly down-regulated. PBRM1 expression was up-regulated in CHOL, which suggested that PBRM1 may have various regulatory mechanisms in different tumors (Figure 3A). Meanwhile, we studied the expression of PBRM1 in different clinical stages in CHOL with GEPIA database using one-way ANOVA analysis. In CHOL, the expression level was increased in the advanced stage, although there was no significant difference (Figure 3B). However, low-level expression of PBRM1 was significantly correlated with an advanced clinical stage in KIRC (Figure 3C, P < 0.05). These results indicated that PBRM1 could play different roles in tumor progression of diverse cancers.
Figure 3.
Differential expression of PBRM1 in various tumors and in different CHOL stages (A) PBRM1 expression levels in different tumors from TCGA database were determined by TIMER (*P < 0.05, **P < 0.01, ***P < 0.001). (B) the expression of PBRM1 in different clinical stages in CHOL (C) the expression of PBRM1 in different clinical stages in KIRC.
The relevance of PBRM1 to the immune infiltration of CHOL patients
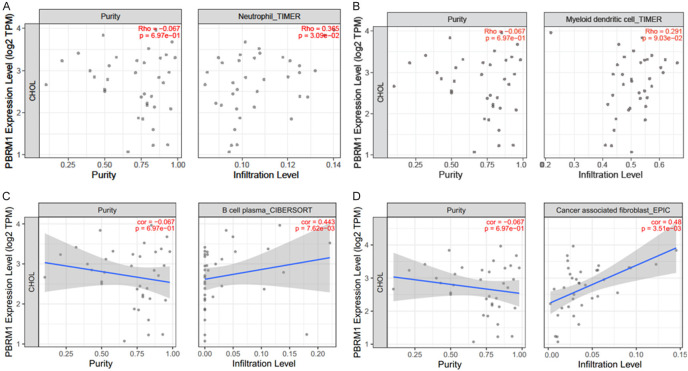
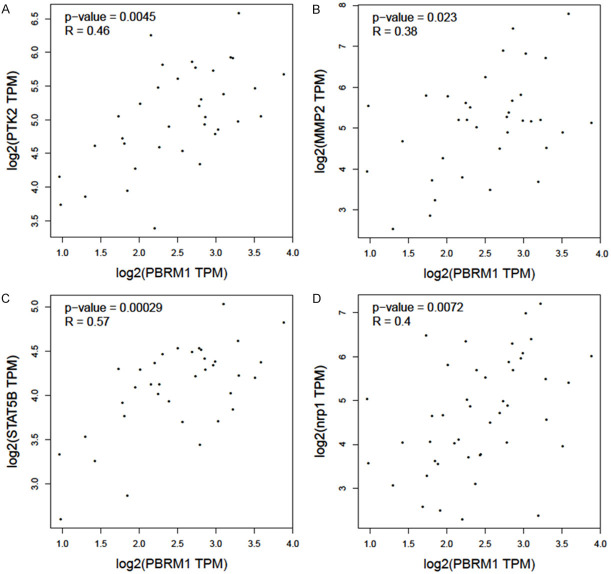
Next, we used TIMER2.0 to study the differences of various types between immune cell infiltration in patients with mutated PBRM1 and WT PBRM1. It was found that CHOL patients of PBRM1 mutated and WT groups have different immune cell infiltration. B Cells, regulatory T cells (Tregs), and cancer-associated fibroblasts (CAF) all showed consistent reduced immune infiltration in PBRM1 mutated group compared with the WT group (Figure 4A-C). Through TIMER2.0, the effect of PBRM1 expression on immune cell infiltration in CHOL patients was also studied. The results are shown in (Figure 5A-D). The expression of PBRM1 is significantly and positively correlated with the levels of neutrophil, B cell plasma, and DC dendritic cells (DCs) and CAF infiltration in CHOL patients. This suggests that PBRM1 expression is positively correlated with the infiltration level of some immune cells in CHOL patients. Most of the PBRM1 mutation was the loss of function mutation, results from PBRM1 mutation and PBRM1 expression consistently indicated that PBRM1 expression is positively correlated with immune infiltration of CHOL patient. Furthermore, we investigated the correlation between PBRM1 and gene markers of immune infiltration of CHOL patients. The expression of PBRM1 is significantly positively correlated with gene markers of CAF infiltration (PTK2 and MMP2), (Figure 6A, 6B), Treg infiltration (STAT5B, Figure 6C), and neutrophil infiltration (NRP1, Figure 6D).
Figure 4.
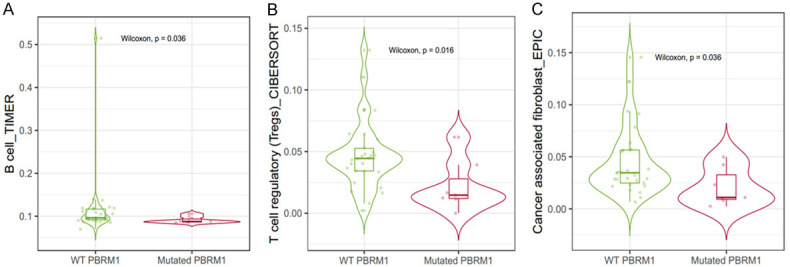
Relevance of PBRM1 mutation to the immune infiltration of CHOL patients. The B Cells (A), T cells regulatory (Tregs) (B), and cancer-associated fibroblasts (CAF) (C) all show consistent reduced immune infiltration in PBRM1 mutated group compared with WT group.
Figure 5.
Relevance of PBRM1 expression to the immune infiltration of CHOL patients. The expression of PBRM1 is significantly positively correlated with the levels of neutrophil (A), dendritic cell (B), B cell plasma (C), and cancer associated fibroblast (CAF) (D) infiltration in CHOL patients. The high expression of PBRM1 means high infiltration level of neutrophil, B cell plasma and CAF in tumor tissue.
Figure 6.
Relevance of PBRM1 expression to gene markers of immune infiltration of CHOL patients. The expression of PBRM1 is significantly positively correlated with gene markers of CAF infiltration (PTK2 and MMP2, A and B), Treg infiltration (STAT5B, C), and neutrophil infiltration (NRP1, D).
Differentially expressed genes between PBRM1 mutated group and WT group in CHOL
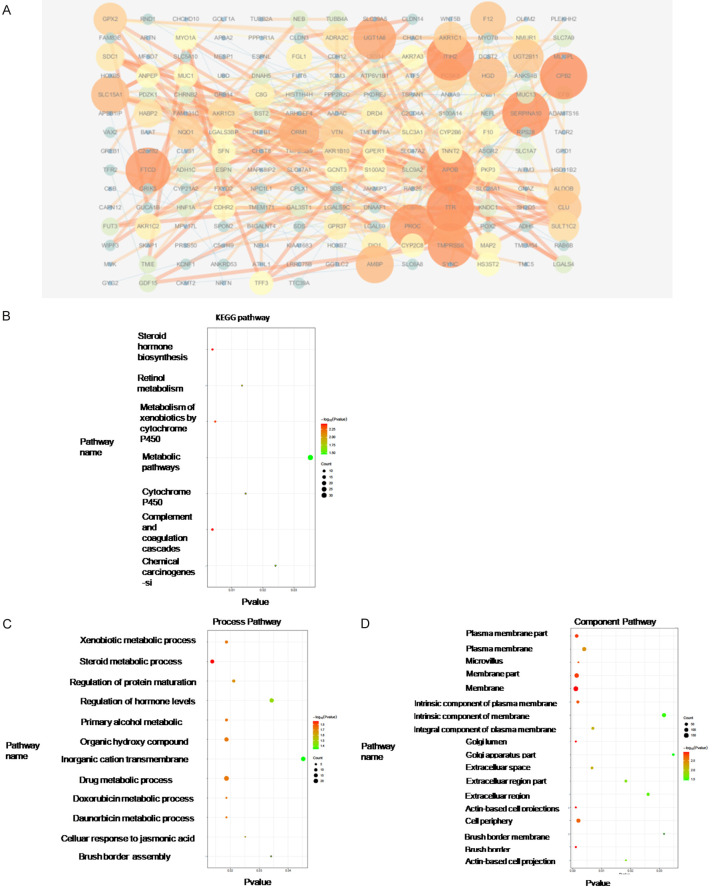
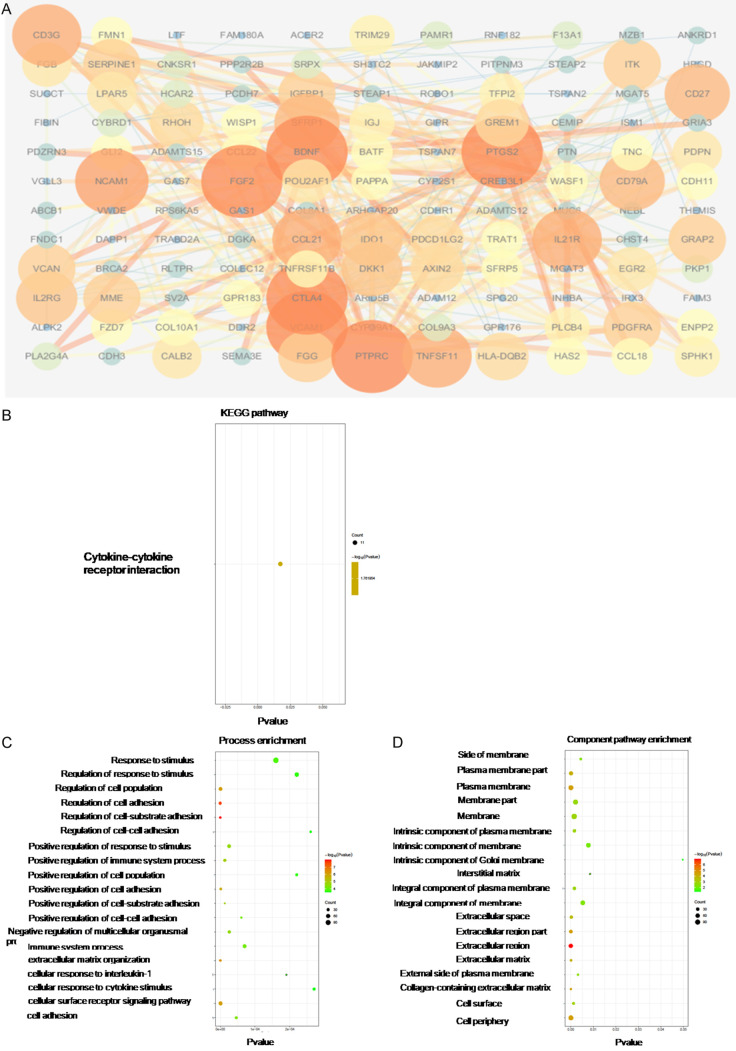
The differentially expressed genes between PBRM1 mutated group and the WT group in CHOL were analyzed to find the dysregulated genes and related pathways. Through differential expression analysis, the Top200 genes significantly up-regulated and the Top200 significantly down-regulated in the mutant group were selected (Figures 7A and 8A). PPI analysis and GO and KEGG pathway analysis of dysregulated genes were conducted to identify hub genes and related pathways. The up-regulated hub genes in the mutated group were those that mainly affect the metabolism of CCA cells such as APOB, which was consistent with the screened metabolic process-related pathways in pathway analysis (Table 1). The GO analysis, component mainly concentrated on the cell membrane and extracellular area (Figure 7B-D). The down-regulated hub genes included immunity-related genes such as CTLA4, BDNF, TNFSF11, CD3G, and IL21R. The down-regulated hub genes also included FGF2, VCAM1, and NCAM1, which are significantly associated with stromal production, cell adhesion, and vascular invasion (Table 2). In KEGG analysis, the significantly related pathways were cytokine to cytokine receptor interaction. The component also focused on the extracellular area (Figure 8B-D).
Figure 7.
PPI analysis and GO and KEGG pathway analysis of dysregulated genes from high-expression group of the mutation group in CHOL. Protein-protein interaction network of top 200 up-regulated genes was constructed using STRING v10.0, and visualized by Cytoscape v3.4.0 (A). GO and KEGG Pathway enrichment analysis was analyzed using STRING v10.0 and was visualized by ggplot2 R packages (B-D).
Figure 8.
PPI analysis and GO and KEGG pathway analysis of dysregulated genes from low-expression group of the mutation group in CHOL. Protein-protein interaction network of top200 up-regulated genes was constructed using STRING v10.0, and visualized by Cytoscape v3.4.0 (A). GO and KEGG Pathway enrichment analysis was analyzed using STRING v10.0 and was visualized by ggplot2 R packages (B-D).
Table 1.
Up-regulated hub genes in mutated group
| Name | Degree | Closeness Centrality | Betweenness Centrality | Gene description |
|---|---|---|---|---|
| APOB | 22 | 0.302222 | 0.248282 | Apolipoprotein B-100 |
| ITIH2 | 15 | 0.261538 | 0.021842 | Inter-alpha-trypsin inhibitor heavy chain H2 |
| SERPINA10 | 15 | 0.262042 | 0.033403 | Protein Z-dependent protease inhibitor |
| CPB2 | 14 | 0.257089 | 0.016069 | Carboxypeptidase B2 |
| TTR | 14 | 0.279835 | 0.147093 | Transthyretin |
| PROC | 13 | 0.253731 | 0.024379 | Vitamin K-dependent protein C |
| TMPRSS6 | 13 | 0.259542 | 0.05632 | Transmembrane protease serine 6 |
| FTCD | 13 | 0.265107 | 0.053097 | Formimidoyltransferase-cyclodeaminase |
| UGT1A6 | 12 | 0.261036 | 0.087723 | UDP-glucuronosyltransferase 1-6 |
| ORM1 | 11 | 0.270916 | 0.027003 | Alpha-1-acid glycoprotein 1 |
Table 2.
Down-regulated hub genes in mutated group
| Name | Degree | Closeness Centrality | Betweenness Centrality | Gene description |
|---|---|---|---|---|
| PTPRC | 24 | 0.45188285 | 0.21907957 | Receptor-type tyrosine-protein phosphatase C |
| FGF2 | 20 | 0.44081633 | 0.18552069 | Fibroblast growth factor 2 |
| CTLA4 | 18 | 0.38571429 | 0.06445833 | Cytotoxic T-lymphocyte protein 4 |
| VCAM1 | 15 | 0.40909091 | 0.09752962 | Vascular cell adhesion protein 1 |
| PTGS2 | 14 | 0.42023346 | 0.16118209 | Prostaglandin G/H synthase 2 |
| BDNF | 14 | 0.4 | 0.12983006 | Brain-derived neurotrophic factor |
| NCAM1 | 12 | 0.38709677 | 0.04818733 | Neural cell adhesion molecule 1 |
| TNFSF11 | 11 | 0.41860465 | 0.05839004 | Tumor necrosis factor ligand superfamily member 11 |
| CD3G | 11 | 0.35409836 | 0.05727753 | T-cell surface glycoprotein CD3 gamma chain |
| IL21R | 11 | 0.36 | 0.02923529 | Interleukin-21 receptor |
Differentially expressed genes between the PBRM1 high expression group and the PBRM1 low expression group in CHOL
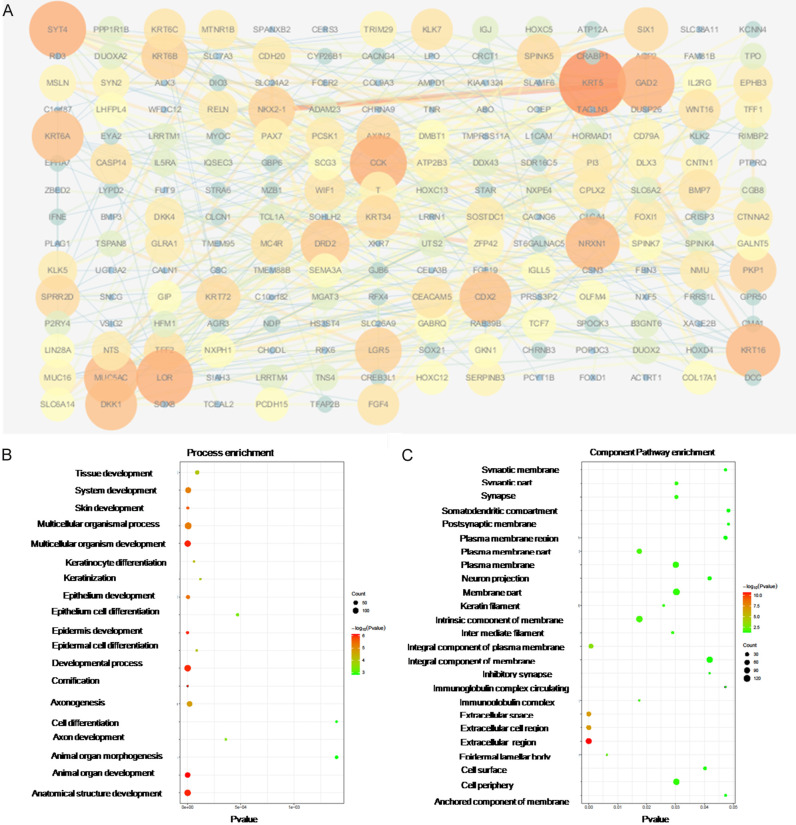
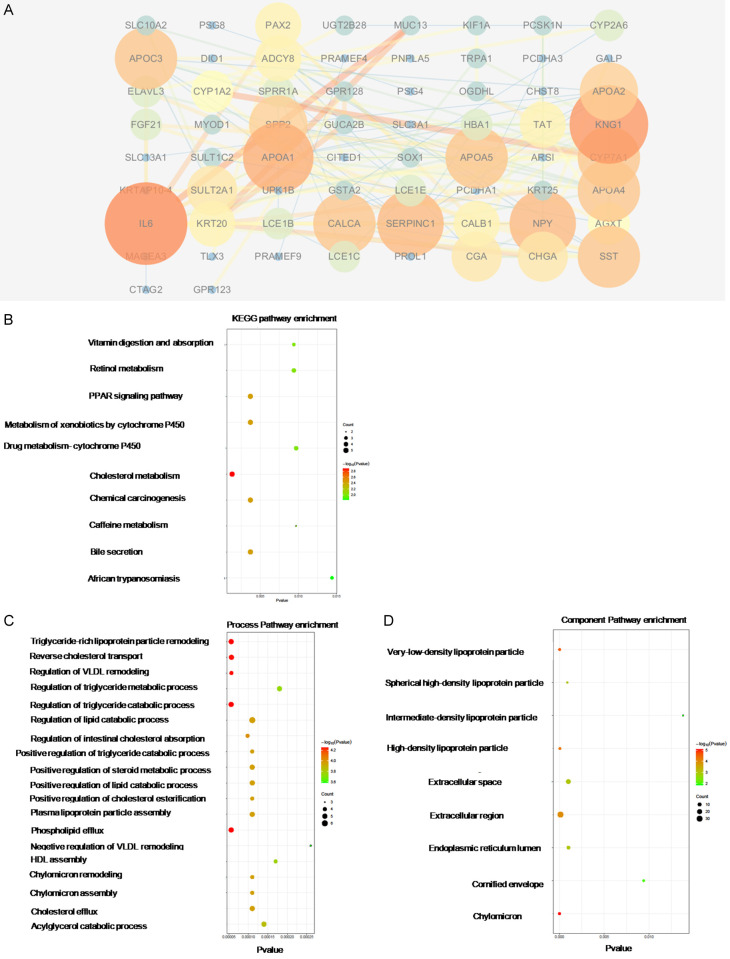
The differentially expressed genes between the PBRM1 high expression group and PBRM1 low expression group CHOL were analyzed to find the dysregulated genes and related pathways. The patients were divided into two groups according to the expression levels of PBRM1. Patients with the top 50% high levels of PBRM1 were allocated into the PBRM1 high expression group. Through differential expression analysis, the Top200 genes which were significantly up-regulated in the mutation group and the Top200 genes significantly down-regulated in the mutation group were selected (Figures 9A and 10A). PPI analysis and GO and KEGG pathway analysis of dysregulated genes were conducted to search for hub genes and significantly related pathways. The hub genes that expression was up-regulated in the PBRM1 high expression group after PPI analysis included KRT5, KRT16, KRT6A, and LOR, that related to keratin formation, and CCK, GAD2, which related to metabolism. (Table 3) Process-related pathways mainly included epithelial development and cell differentiation. The component was mainly concentrated in the extracelluar region (Figure 9B, 9C). The hub genes that expression is up-regulated in the PBRM1 low expression group after PPI analysis included genes related to lipid metabolism such as APOA1, APOC3, APOA4, and APOA5 (Table 4). Hub gene also includes IL6. The correlation was very high, suggesting that IL6 may play a key role in PBRM1 in the immune regulation of CCA (Table 4). Process-related pathways mainly include cholesterol and other lipid metabolism-related pathways, which was also consistent with the results of the mutant group’s high expression group. The component was also mainly concentrated in the extracelluar region (Figure 10B-D).
Figure 9.
PPI analysis and GO and KEGG pathway analysis of dysregulated genes from high-expression group of PBRM1 high expression group in CHOL. Protein-protein interaction network of top 200 up-regulated genes was constructed using STRING v10.0, and visualized by Cytoscape v3.4.0 (A). GO and KEGG Pathway enrichment analysis was analyzed using STRING v10.0 and was visualized by ggplot2 R packages (B, C).
Figure 10.
PPI analysis and GO and KEGG pathway analysis of dysregulated genes from low-expression group of PBRM1 high expression group in CHOL. Protein-protein interaction network of top200 up-regulated genes was constructed using STRING v10.0, and visualized by Cytoscape v3.4.0 (A). GO and KEGG Pathway enrichment analysis was analyzed using STRING v10.0 and was visualized by ggplot2 R packages (B-D).
Table 3.
Up-regulated hub genes in PBRM1 high expression group
| Name | Degree | Closeness Centrality | Betweenness Centrality | Gene description |
|---|---|---|---|---|
| KRT5 | 17 | 0.28125 | 0.184057 | Keratin, type II cytoskeletal 5 |
| CCK | 13 | 0.265449 | 0.093949 | Cholecystokinin |
| LOR | 13 | 0.240764 | 0.03337 | Loricrin |
| SYT4 | 13 | 0.255061 | 0.120538 | Synaptotagmin-4 |
| GAD2 | 13 | 0.280415 | 0.15754 | Glutamate decarboxylase 2 |
| KRT16 | 12 | 0.247382 | 0.061994 | Keratin, type I cytoskeletal 16 |
| NRXN1 | 12 | 0.25855 | 0.098708 | Neurexin-1 |
| MUC5AC | 12 | 0.272727 | 0.101905 | Mucin-5AC |
| KRT6A | 11 | 0.236546 | 0.011681 | Keratin, type II cytoskeletal 6A |
| DKK1 | 11 | 0.256098 | 0.063557 | Dickkopf-related protein 1 |
Table 4.
Down-regulated hub genes PBRM1 high expression group
| Name | Degree | Closeness Centrality | Betweenness Centrality | Gene description |
|---|---|---|---|---|
| IL6 | 14 | 0.43589744 | 0.35408194 | Interleukin-6 |
| KNG1 | 13 | 0.38636364 | 0.13229618 | Kininogen-1 |
| APOA1 | 11 | 0.38931298 | 0.05735743 | Apolipoprotein A-I |
| NPY | 10 | 0.38636364 | 0.12054065 | Pro-neuropeptide Y |
| SERPINC1 | 10 | 0.375 | 0.05173602 | Antithrombin-III |
| APOC3 | 9 | 0.375 | 0.06430863 | Apolipoprotein C-III |
| APOA5 | 9 | 0.38059701 | 0.03826935 | Apolipoprotein A-V |
| SST | 9 | 0.3984375 | 0.09531326 | Somatostatin |
| APOA4 | 9 | 0.32075472 | 0.08604189 | Apolipoprotein A-IV |
| CYP7A1 | 9 | 0.34459459 | 0.18167434 | Cholesterol 7-alpha-monooxygenase |
NCAM1 was identified as a target gene of PBRM1 on CAF infiltration in CHOL patients
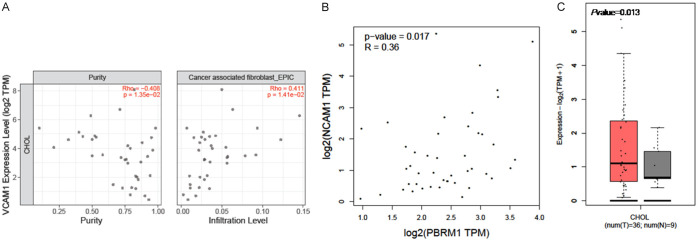
Furthermore, we identified the correlation between all the 40 hub genes we found above and PBRM1, as well as CAF infiltration using TIMER2.0. Only the expression of NCAM1 was significantly associated with the expression of PBRM1 and CAF infiltration (Figure 11A, 11B). This indicated that NCAM1 may be the potential target of PBRM1 on CAF infiltration in CHOL patients. Next, we discovered the expression of NCAM1 in CHOL patients (Figure 11C). NCAM1 showed high expression in CHOL patients.
Figure 11.
NCAM1 was identified as target gene of PBRM1 on CAF infiltration in CHOL patients. A. NCAM1 is significantly positively correlated with the levels of cancer associated fibroblast (P=1.4*e^-2). B. The expression of NCAM1 is significantly positively correlated with PBRM1 (P=0.017). C. The expression of NCAM1 is significantly high in CHOL patients (P=0.013).
Discussion
Our study found that in CHOL tumor tissues, PBRM1 has high mutation probability and significant differential expression. PBRM1 mutations and its differential expression seemed to have a significant effect on the infiltration of some immune cells including B cells plasma, regulatory T cells (Tregs), and cancer-associated fibroblasts (CAF), neutrophil, and DC cell. We tried to identify the hub genes and related pathways of the dysregulated genes in PBRM1 mutated group and PBRM1 overexpression subgroup, to clarify the potential mechanism of how PBRM1 affects immune infiltration and progress of CHOL.
KIRC had the highest PBRM1 mutation probability among diverse cancers and low expression of PBRM1. It was revealed that in this PBRM1-deficient tumor, transcriptional output in JAK/STAT, hypoxia, and immune signaling pathways had been altered by the gene expression analysis [15]. PBRM1 loss may alter global expression patterns of tumor cells to affect the response to immune checkpoint therapy in KIRC patients [10]. With regards to CHOL, it also had a high PBRM1 mutation probability, which may have a significant effect on the survival of CHOL. Therefore, we assumed PBRM1 may play a similar role in the response to immune checkpoint therapy in CHOL patients.
The mutation of PBRM1 had a significant effect on the immune cell infiltration including B cell, Treg, and CAF. The differential expression of PBRM1 had a significant effect on the immune cell infiltration including neutrophil, plasma cell, and CAF in CHOL patients. CAF, TAM, CD4+, CD8+ and Foxp3+ T lymphocyte depletion and CD163+ TAM enrichment have been reported to be related to the cancer progression and poor prognosis in CHOL patients [16,17].
Multiple cytokines and chemokines produced by tumor cells and non-tumor cells in the tumor microenvironment can lead to continuous activation of CAF [20,21]. Clinical studies have shown that there is a correlation between the high CAF infiltration of CHOL and the poor survival of patients [22]. CAF can communicate with various cytokines and chemokines of different cell types that constitute the tumor microenvironment. CAF can also produce major extracellular matrix (ECM) components, such as tenascin C and periostin, and secrete multiple matrix metalloproteinases (MMPs) [23]. MMP is essential for the degradation and remodeling of ECM, which is a prerequisite for tumor progression. In CHOL, CAF expresses MMP1, MMP2, MMP3, and MMP9, and this phenotype is associated with more aggressive tumors. It has also been reported that cancer associated fibroblast FAK regulates malignant cell metabolism [24]. In CHOL, not only mutations and differential expression of PBRM1 significantly affect the level of immune infiltration of CAF, but also PBRM1 is highly correlated with MMP2 and PTK2, suggesting that PBRM1 may be involved in the regulation of MMP2 and PTK2 expression, and influence the CAF function in the tumor microenvironment. The number of CD4+ and CD8+ lymphocytes in CHOL may be affected by dendritic cell (DC). It has been proved that immature CD1a+ DC exists only in the core of the tumor, while mature CD83+ DC is mainly located at the frontier of invasion [25]. Besides, the number of DCs at the margin of invasion is related to the number of CD4+ and CD8+ TIL in the tumor [25]. In CHOL patients, DC cell related genes NRP1 and PBRM1 also have a significant positive correlation, suggesting that PBRM1 may affect the function of DC cells through NRP1 and thus affect the infiltration of immune cells. These results indicated that CAF may be the potential target of PBRM1 on immune infiltration in CHOL patients.
The role of B lymphocytes in CCA is still unclear. B cells have been identified in the TIL of the BTC population, but B cells are rarely observed in patient tissues [16,26]. Although high-density CD20+ cells are observed in low-grade tumors and are associated with good overall survival [16]. Further studies are needed to clarify their correlation.
In both the mutation group and the differential expression group, hub genes include genes such as APOA and APOB that are mainly involved in lipid metabolism, which is consistent with the cell metabolism characteristics of cholangiocarcinoma, and also reflects the significant effect of PBRM1 on the cell metabolism of CHOL patients. FGF2, VCAM1, and NCAM1 were discovered in the low expression group of the altered group. These genes are significantly related to matrix generation, cell adhesion, and vascular invasion. We explored the co-expression of all the hub genes we found with PBRM1 and CAF. Only the expression of NCAM1 was significantly associated with the expression of PBRM1 and CAF infiltration (Figure 11A, 11B). A recent study suggests that mesenchymal stromal cells increase expression of BDNF, NCAM-1, MMP-1A, and FGF-2 [28], which was consistent with previous hub genes results. It was reported that cancer cell dispersion could be dependent on Schwann cell expression of neural cell adhesion molecule 1 (NCAM1) and ultimately promote perineural invasion [29]. These results all demonstrated that NCAM1 may be the potential target of PBRM1 on CAF infiltration in CHOL patients.
In general, the mutation and expression of PBRM1 are related to the level of immune cell infiltration including B cell, Treg, CAF, plasma cell, and neutrophil in CHOL. There was a close relationship between PBRM1 expression and MMP2, PTK2, while MMP2, PTK2 are all significantly related to CAF. Hub gene NCAM1 was significantly associated with expression of PBRM1 and CAF infiltration. Therefore, in CHOL, PBRM1 may affect the secretion and function of CAF by regulating the expression and function of NCAM1, thereby playing an important role in immune cell infiltration, matrix formation, and tumor invasion of CHOL.
Taken together, PBRM1 was the second most frequently mutated gene in CHOL. As a result, PBRM1 may act as a key regulator of tumor cell immune response in CHOL and could be a novel effective therapeutic target for CHOL.
Disclosure of conflict of interest
None.
References
- 1.Leyva-Illades D, McMillin M, Quinn M, Demorrow S. Cholangiocarcinoma pathogenesis: role of the tumor microenvironment. Transl Gastrointest Cancer. 2012;1:71–80. [PMC free article] [PubMed] [Google Scholar]
- 2.Razumilava N, Gores GJ. Cholangiocarcinoma. Lancet. 2014;383:2168–2179. doi: 10.1016/S0140-6736(13)61903-0. [DOI] [PMC free article] [PubMed] [Google Scholar]
- 3.Blechacz B. Cholangiocarcinoma: current knowledge and new developments. Gut Liver. 2017;11:13–26. doi: 10.5009/gnl15568. [DOI] [PMC free article] [PubMed] [Google Scholar]
- 4.Aljiffry M, Walsh MJ, Molinari M. Advances in diagnosis, treatment and palliation of cholangiocarcinoma: 1990-2009. World J Gastroenterol. 2009;15:4240–4262. doi: 10.3748/wjg.15.4240. [DOI] [PMC free article] [PubMed] [Google Scholar]
- 5.Shaib Y, El-Serag HB. The epidemiology of cholangiocarcinoma. Semin Liver Dis. 2004;24:115–125. doi: 10.1055/s-2004-828889. [DOI] [PubMed] [Google Scholar]
- 6.Gentilini A, Pastore M, Marra F, Raggi C. The role of stroma in cholangiocarcinoma: the intriguing interplay between fi broblastic component, immune cell subsets and tumor epithelium. Int J Mol Sci. 2018;19:2885. doi: 10.3390/ijms19102885. [DOI] [PMC free article] [PubMed] [Google Scholar]
- 7.Yan Z, Cui K, Murray DM, Ling C, Xue Y, Gerstein A, Parsons R, Zhao K, Wang W. PBAF chromatin-remodeling complex requires a novel specifi city subunit, BAF200, to regulate expression of selective interferon-responsive genes. Genes Develop. 2005;19:1662–1667. doi: 10.1101/gad.1323805. [DOI] [PMC free article] [PubMed] [Google Scholar]
- 8.Mota STS, Vecchi L, Zóia MAP, Oliveira FM, Alves DA, Dornelas BC, Bezerra SM, Andrade VP, Maia YCP, Neves AF, Goulart LR, Araújo TG. New insights into the role of polybromo-1 in prostate cancer. Int J Mol Sci. 2019;20:2852. doi: 10.3390/ijms20122852. [DOI] [PMC free article] [PubMed] [Google Scholar]
- 9.Chowdhury B, Porter EG, Stewart JC, Ferreira CR, Schipma MJ, Dykhuizen EC. PBRM1 regulates the expression of genes involved in metabolism and cell adhesion in renal clear cell carcinoma. PLoS One. 2016;11:e0153718. doi: 10.1371/journal.pone.0153718. [DOI] [PMC free article] [PubMed] [Google Scholar]
- 10.Liu XD, Kong W, Peterson CB, McGrail DJ, Hoang A, Zhang X, Lam T, Pilie PG, Zhu H, Beckermann KE, Haake SM, Isgandrova S, Martinez-Moczygemba M, Sahni N, Tannir NM, Lin SY, Rathmell WK, Jonasch E. PBRM1 loss defi nes a nonimmunogenic tumor phenotype associated with checkpoint inhibitor resistance in renal carcinoma. Nat Commun. 2020;11:2135. doi: 10.1038/s41467-020-15959-6. [DOI] [PMC free article] [PubMed] [Google Scholar]
- 11.Cerami E, Gao J, Dogrusoz U, Gross BE, Sumer SO, Aksoy BA, Jacobsen A, Byrne CJ, Heuer ML, Larsson E, Antipin Y, Reva B, Goldberg AP, Sander C, Schultz N. The cBio cancer genomics portal: an open platform for exploring multidimensional cancer genomics data. Cancer Discov. 2012;2:401–404. doi: 10.1158/2159-8290.CD-12-0095. [DOI] [PMC free article] [PubMed] [Google Scholar]
- 12.Li T, Fan J, Wang B, Traugh N, Chen Q, Liu JS, Li B, Liu XS. TIMER: a web server for comprehensive analysis of tumor-infi ltrating immune cells. Cancer Res. 2017;77:e108–e110. doi: 10.1158/0008-5472.CAN-17-0307. [DOI] [PMC free article] [PubMed] [Google Scholar]
- 13.Tang Z, Li C, Kang B, Gao G, Li C, Zhang Z. GEPIA: a web server for cancer and normal gene expression profi ling and interactive analyses. Nucleic Acids Res. 2017;45:W98–W102. doi: 10.1093/nar/gkx247. [DOI] [PMC free article] [PubMed] [Google Scholar]
- 14.Szklarczyk D, Morris JH, Cook H, Kuhn M, Wyder S, Simonovic M, Santos A, Doncheva NT, Roth A, Bork P, Jensen LJ, von Mering C. The STRING database in 2017: quality-controlled protein-protein association networks, made broadly accessible. Nucleic Acids Res. 2017;45:D362–D368. doi: 10.1093/nar/gkw937. [DOI] [PMC free article] [PubMed] [Google Scholar]
- 15.Miao D, Margolis CA, Gao W, Voss MH, Li W, Martini DJ, Norton C, Bosse D, Wankowicz SM, Cullen D, Horak C, Wind-Rotolo M, Tracy A, Giannakis M, Hodi FS, Drake CG, Ball MW, Allaf ME, Snyder A, Hellmann MD, Ho T, Motzer RJ, Signoretti S, Kaelin WG Jr, Choueiri TK, Van Allen EM. Genomic correlates of response to immune checkpoint therapies in clear cell renal cell carcinoma. Science. 2018;359:801–806. doi: 10.1126/science.aan5951. [DOI] [PMC free article] [PubMed] [Google Scholar]
- 16.Goeppert B, Frauenschuh L, Zucknick M, Stenzinger A, Andrulis M, Klauschen F, Joehrens K, Warth A, Renner M, Mehrabi A, Hafezi M, Thelen A, Schirmacher P, Weichert W. Prognostic impact of tumour-infi ltrating immune cells on biliary tract cancer. Br J Cancer. 2013;109:2665–2674. doi: 10.1038/bjc.2013.610. [DOI] [PMC free article] [PubMed] [Google Scholar]
- 17.Kitano Y, Okabe H, Yamashita YI, Nakagawa S, Saito Y, Umezaki N, Tsukamoto M, Yamao T, Yamamura K, Arima K, Kaida T, Miyata T, Mima K, Imai K, Hashimoto D, Komohara Y, Chikamoto A, Ishiko T, Baba H. Tumour-infi ltrating inflammatory and immune cells in patients with extrahepatic cholangiocarcinoma. Br J Cancer. 2018;118:171–180. doi: 10.1038/bjc.2017.401. [DOI] [PMC free article] [PubMed] [Google Scholar]
- 18.Vivier E, Ugolini S, Blaise D, Chabannon C, Brossay L. Targeting natural killer cells and natural killer T cells in cancer. Nat Rev Immunol. 2012;12:239–252. doi: 10.1038/nri3174. [DOI] [PMC free article] [PubMed] [Google Scholar]
- 19.Whiteside TL. What are regulatory T cells (Treg) regulating in cancer and why? Semin Cancer Biol. 2012;22:327–334. doi: 10.1016/j.semcancer.2012.03.004. [DOI] [PMC free article] [PubMed] [Google Scholar]
- 20.Östman A, Augsten M. Cancer-associated fi broblasts and tumor growth-bystanders turning into key players. Curr Opin Genet Dev. 2009;19:67–73. doi: 10.1016/j.gde.2009.01.003. [DOI] [PubMed] [Google Scholar]
- 21.Sirica AE. The role of cancer-associated myofi broblasts in intrahepatic cholangiocarcinoma. Nat Rev Gastroenterol Hepatol. 2012;9:44–54. doi: 10.1038/nrgastro.2011.222. [DOI] [PubMed] [Google Scholar]
- 22.Chuaysri C, Thuwajit P, Paupairoj A, Chau-In S, Suthiphongchai T, Thuwajit C. Alpha-smooth muscle actin-positive fi broblasts promote biliary cell proliferation and correlate with poor survival in cholangiocarcinoma. Oncol Rep. 2009;21:957–969. doi: 10.3892/or_00000309. [DOI] [PubMed] [Google Scholar]
- 23.Terada T, Okada Y, Nakanuma Y. Expression of immunoreactive matrix metalloproteinases and tissue inhibitors of matrix metalloproteinases in human normal livers and primary liver tumors. Hepatology. 1996;23:1341–1344. doi: 10.1053/jhep.1996.v23.pm0008675149. [DOI] [PubMed] [Google Scholar]
- 24.Prakobwong S, Yongvanit P, Hiraku Y, Pairojkul C, Sithithaworn P, Pinlaor P, Pinlaor S. Involvement of MMP-9 in peribiliary fi brosis and cholangiocarcinogenesis via Rac1-dependent DNA damage in a hamster model. Int J Cancer. 2010;127:2576–2587. doi: 10.1002/ijc.25266. [DOI] [PubMed] [Google Scholar]
- 25.Takagi S, Miyagawa SI, Ichikawa E, Soeda J, Miwa S, Miyagawa Y, Iijima S, Noike T, Kobayashi A, Kawasaki S. Dendritic cells, T-cell infi ltration, and grp94 expression in cholangiocellular carcinoma. Hum Pathol. 2004;35:881–886. doi: 10.1016/j.humpath.2004.03.016. [DOI] [PubMed] [Google Scholar]
- 26.Kasper HU, Drebber U, Stippel DL, Dienes HP, Gillessen A. Liver tumor infi ltrating lymphocytes: comparison of hepatocellular and cholangiolar carcinoma. World J Gastroenterol. 2009;15:5053–5057. doi: 10.3748/wjg.15.5053. [DOI] [PMC free article] [PubMed] [Google Scholar]
- 27.Sripa B, Thinkhamrop B, Mairiang E, Laha T, Kaewkes S, Sithithaworn P, Periago MV, Bhudhisawasdi V, Yonglitthipagon P, Mulvenna J, Brindley PJ, Loukas A, Bethony JM. Elevated plasma IL-6 associates with increased risk of advanced fi brosis and cholangiocarcinoma in individuals infected by Opisthorchis viverrini. PLoS Negl Trop Dis. 2012;6:e1654. doi: 10.1371/journal.pntd.0001654. [DOI] [PMC free article] [PubMed] [Google Scholar]
- 28.Satar B, Hidir Y, Serdar MA, Kucuktag Z, Ural AU, Avcu F, Safali M, Oguztuzun S. Protein profi ling of anastomosed facial nerve treated with mesenchymal stromal cells. Cytotherapy. 2012;14:522–528. doi: 10.3109/14653249.2011.651530. [DOI] [PubMed] [Google Scholar]
- 29.Deborde S, Omelchenko T, Lyubchik A, Zhou Y, He S, McNamara WF, Chernichenko N, Lee SY, Barajas F, Chen CH, Bakst RL, Vakiani E, He S, Hall A, Wong RJ. Schwann cells induce cancer cell dispersion and invasion. J Clin Invest. 2016;126:1538–1554. doi: 10.1172/JCI82658. [DOI] [PMC free article] [PubMed] [Google Scholar]


