Abstract
Breast cancer (BC) in adolescents and young adults (AYAs) accounts for 5.6% of BC in all women. BC in this population is often characterized as aggressive. Two-thirds of BC in AYAs belong to the hormone-receptor positive (HR(+))/human epidermal growth factor receptor 2 negative (HER2(-)) subtype. However, the underlying pathogenesis of this subtype has not been fully elucidated. To study HR(+)/HER2(-) BC in AYAs, we downloaded the available RNA-seq data from The Cancer Genome Atlas (TCGA) database and then performed differential expression gene screening and constructed a protein-protein interaction (PPI) network, identified the key genes, and did gene set enrichment analysis (GSEA). Based on the analyses, 32.26% of patients were in stage III. Additionally, we identified 1671 differentially expressed genes (DEGs) and 35 key genes. In addition, GSEA showed that ether lipid metabolism and complement and coagulation cascades were significantly enriched in the GNAI1 high expression phenotype. The key genes CXCL2, CXCL5, CXCL3, GPR37L1, NPY2R, OXGR1, NPW, CCL21, GNAI1, SAA1, GRM4, HCAR2, CX3CL1, GRM8, CCL28, SSTR1, PENK, P2RY12, NMUR1, NMU, ADCY5, TAS1R1, OXER1, GNG13, CCL16, CCR8, NPY5R, CXCL11, CXCL10, CXCL9, CXCL1, CXCL6, CCR4, and ANXA1 may be molecular markers of tumorigenesis of HR(+)/HER2(-) BC in AYAs. In addition, ether lipid metabolism and complement and coagulation cascades may be key pathways for GNAI1 regulation in HR(+)/HER2(-) BC in AYAs.
Keywords: Breast cancer, adolescents and young adults, differential expression, pathway analysis, HR(+)/HER2(-)
Introduction
Breast cancer (BC) is the most common tumor, with the highest incidence in women worldwide [1]. BC in adolescents and young adult (AYAs) women between the ages of 15 and 39 years old [2], which accounts for 5.6% of all BC in women [3]. BC in this population is often characterized as aggressive, involving vascular or lymphatic invasion, and the pathologic grade is grade 3 [4]. Two-thirds of BC cases in AYAs involve the hormone-receptor positive (HR(+))/human epidermal growth factor receptor 2 negative (HER2(-)) subtype [5,6]. However, the underlying pathogenesis of this subtype has not been fully elucidated. Studies have shown that the abnormal expression of BRCA1 is very common in the HR(+)/HER2(-) subtype in AYAs [7]. Among patients diagnosed with HR(+)/HER2(-) BC and younger than 30 years old, 30% are found to have abnormal expression levels of BRCA1, BRCA2, or TP53 [8]. In addition, the abnormal expression of the PALB2 gene increases the risk of developing HR(+)/HER2(-) BC in AYAs by 8 times [9]. Therefore, it is important to understand the molecular mechanisms of HR(+)/HER2(-) BC in AYAs in order to develop new diagnostic and therapeutic strategies.
In recent years, with the development of next-generation sequencing technologies (NGS), bioinformatics has matured. Bioinformatics involves the use of computers to run advanced algorithms to analyse massive biologic data. The purpose of using bioinformatics to process the data generated by NGS is to convert biologic signals into data and then convert the data into understandable information. Thanks to these technologies, we can now more easily identify genes and related pathways that are differentially expressed in disease states.
This work aimed to study differentially expressed genes (DEGs) and differentially expressed pathways (DEPs) of HR(+)/HER2(-) BC in AYAs, to provide a direction for the development of new tumorigenesis molecular markers.
Materials and methods
RNA-sequencing data and bioinformatics analysis
As of January 2020, we collected data from 76 BC patients between the ages of 15 and 39 years old from The Cancer Genome Atlas (TCGA) database. Considering that there are different subtypes of BC [10], we excluded patients without data regarding oestrogen receptor (ER), progesterone receptor (PR), and HER2. Ultimately, 31 patients with the HR(+)/HER2(-) subtype, were selected (HR(+) is in other words ER(+)/PR(+)). Para-carcinoma tissues were collected from 23 patients and used as the control group.
Protein-protein interaction (PPI) network
The STRING database (version 11.0) is used for analysing PPIs, including both direct physical interactions between proteins and indirect functional correlations [11]. In this study, we used the STRING database to construct a PPI network for DEGs, and the genes having an interaction with a combined score > 0.4 were considered statistically significant. Then, Cytoscape (Version 3.72) was used to visualize the PPI network. Cytoscape was used for the graphical display and analysis of the network [12]. Next, we used the cytoHubba plug-in in Cytoscape to analyse the PPI network and ranked the DEGs based on the calculated Matthews’ correlation coefficient (MCC) scores to select the top 35 genes. cytoHubba provides 11 topological methods to analyse important nodes in biologic networks [13].
Gene set enrichment analysis (GSEA)
GSEA is an analytical method that compares the differences between predefined gene sets, calculates scores according to the differences, calculates the enrichment score according to the score and the enrichment degree in a certain gene set, and generates plots in order to find which pathways differ from the preset parameters [14]. In this study, according to the correlations between genes and GNAI1 expression, we performed GSEA to generate a sequenced gene list and then to predict the difference between the overexpression and low expression of GNAI1 on tumorigenesis. The expression of GNAI1 was used as a phenotype tag. The cut-off value for the expression of each gene was defined by the median value. Normalized enrichment scores (NESs) and nominal p-value (NOM p-value) were used to find the degree of pathway enrichment for the phenotype. A NOM p-value < 0.05 indicated a significant difference.
Statistical analysis
All statistical analyses were performed using R statistical software (version 3.6.1). To screen DEGs, we used the LIMMA package in R statistical software [15]. The definition of DEGs was P < 0.01 and |logFC| > 2. We used the cluster Profiler package in R statistical software [16] for Gene Ontology (GO) and Kyoto Encyclopedia of Genes and Genomes (KEGG) functional enrichment analysis. GO and KEGG results were considered statistically significant when P < 0.01.
Results
Patient characteristics
In this study, all patients were female, between the ages of 15 and 39 years old, with HR(+)/HER(-) BC, and their pathological diagnosis was infiltrating ductal carcinoma. Of these patients, 87.10% did not have distant metastasis, 41.94% were in stage N1, 54.84% were in stage T2, and 41.94% were in stage II (Table 1).
Table 1.
TCGA breast cancer in adolescents and young adults’ patient characteristics
| Clinical factor | n | % | |
|---|---|---|---|
| Age (y) | < 30 | 5 | 16.13 |
| 30-34 | 6 | 19.35 | |
| 35-39 | 20 | 64.52 | |
| T | 1 | 9 | 29.03 |
| 2 | 17 | 54.84 | |
| 3 | 5 | 16.13 | |
| N | 0 | 9 | 29.03 |
| 1 | 13 | 41.94 | |
| 2 | 6 | 19.35 | |
| 3 | 3 | 9.68 | |
| M | 0 | 27 | 87.10 |
| X | 4 | 12.90 | |
| Stage | I | 8 | 25.81 |
| II | 13 | 41.94 | |
| III | 10 | 32.26 | |
Identification of DEGs
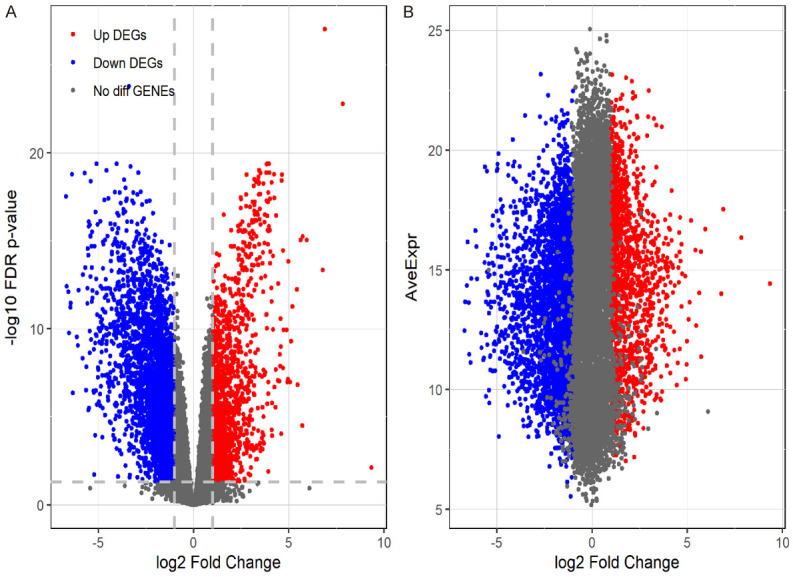
By analyzing 31 tumour tissue samples and 23 para-carcinoma tissue samples in R software, we found a total of 1671 DEGs, of which 448 were upregulated genes and 1223 were downregulated genes (Figure 1).
Figure 1.

Volcano plot. By analysing data for HR(+)/HER2(-) BC in AYAs and para-carcinoma tissues, we screened a total of 1671 DEGs. DEGs were defined as P < 0.01 and |logFC| > 2.
KEGG and GO functional enrichment analysis of DEGs
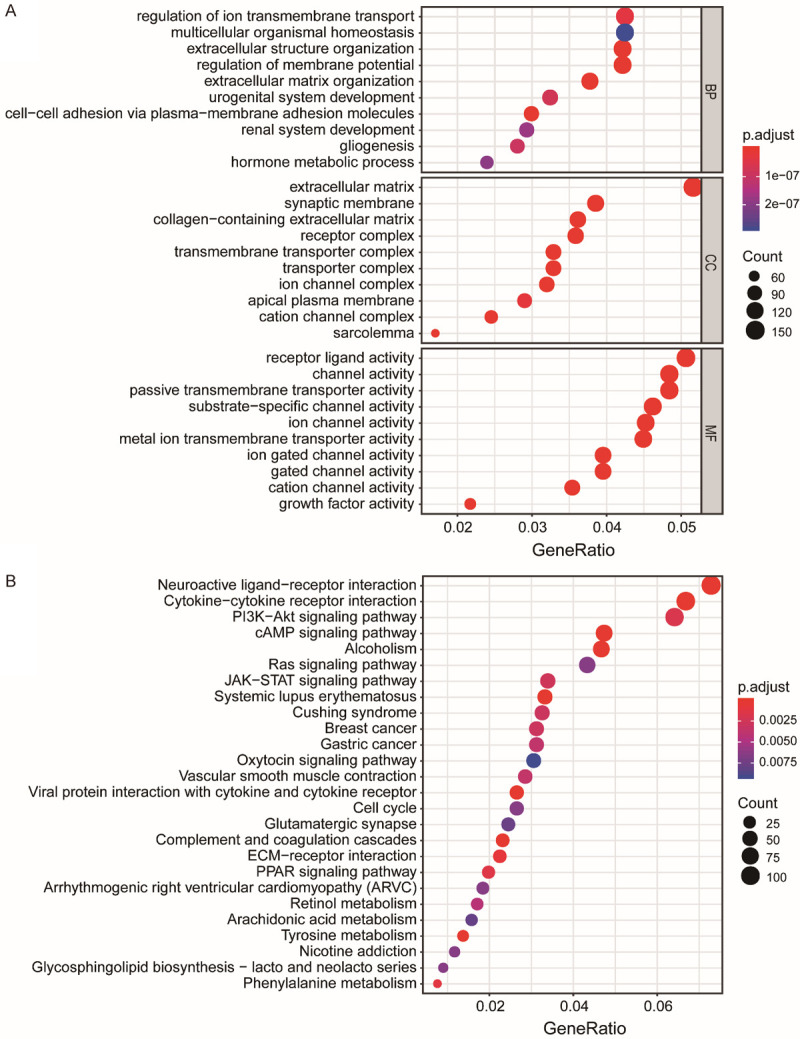
Through functional enrichment analysis of 1671 DEGs, in the GO functional enrichment analysis, the DEGs in biologic processes (BP) were mainly enriched in the regulation of ion transmembrane transport, multicellular organismal homeostasis, and extracellular structure organization. The DEGs in cell component (CC) were mainly enriched in extracellular matrix and synaptic membrane, and the DEGs in molecular function (MF) were mainly enriched in receptor ligand activity and channel activity (Figure 2A). In the KEGG pathway enrichment analysis, the DEGs in were mainly enriched in neuroactive ligand-receptor interaction, cytokine-cytokine receptor interaction, and Pl3K-Akt signalling pathway (Figure 2B).
Figure 2.

Bubble chart. Function and pathway enrichment analyses of 1671 DEGs. A. GO analysis shows the top 10 most significant enrichments in BP (biologic processes), CC (cell component), and MF (molecular function). B. KEGG analysis shows the top 26 most significant enrichments. P < 0.01 was considered significant.
Construction of the PPI network and identification of key genes
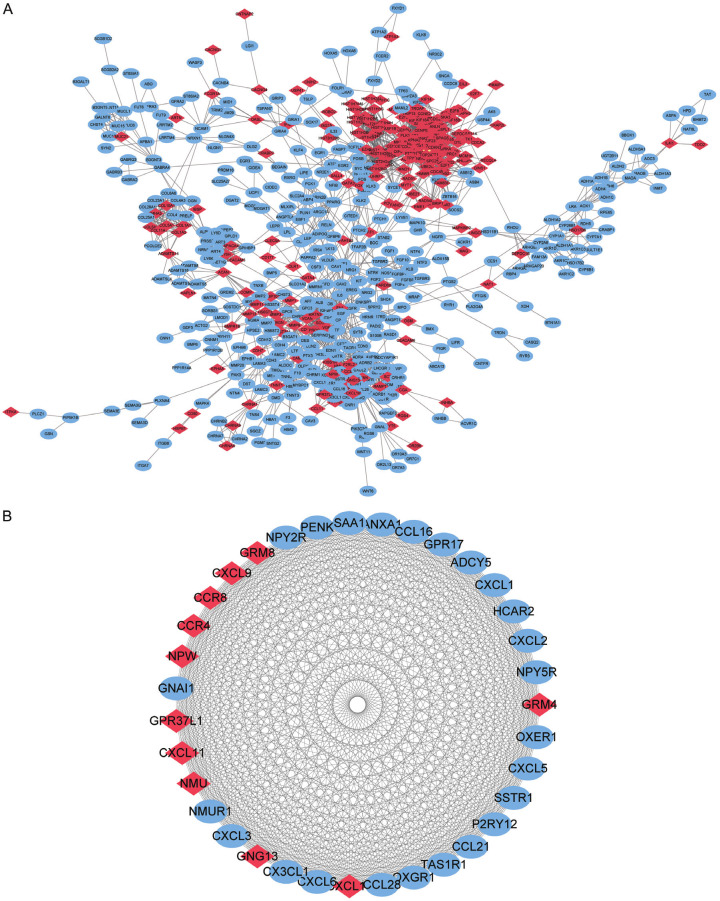
Among the 1671 DEGs, we used the STRING website to construct a PPI network of 621 functionally related genes (Figure 3A). Then, we analysed the PPI network using cytoHubba and selected the genes with the top 35 MCC scores as the key genes, namely, CXCL2, CXCL5, CXCL3, GPR37L1, NPY2R, OXGR1, NPW, CCL21, GNAI1, SAA1, GRM4, HCAR2, CX3CL1, GRM8, CCL28, SSTR1, PENK, P2RY12, NMUR1, NMU, ADCY5, TAS1R1, OXER1, GNG13, CCL16, CCR8, NPY5R, CXCL11, CXCL10, CXCL9, CXCL1, CXCL6, CCR4, and ANXA1 (Figure 3B).
Figure 3.
PPI network. A. PPI network constructed using 621 DEGs that are functionally related. B. According to the MCC score, the Top 35 genes were selected as the key genes.
Identification of GNAI1-related signalling pathways using GSEA
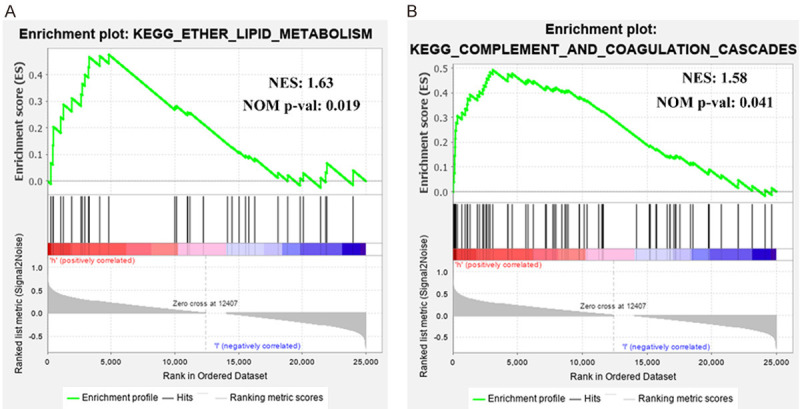
Based on NESs, we found ether lipid metabolism (NES: 1.63, NOM p-value: 0.019) and complement and coagulation cascades (NES: 1.58, NOM p-value: 0.041) were significantly enriched in the high GNAI1 expression phenotype (Figure 4A, 4B).
Figure 4.

GSEA (plots from gene set enrichment analysis). The GSEA results show that in adolescents and young adults with HR(+)/HER2(-) subtype breast cancer, (A) ether lipid metabolism; and (B) complement and coagulation cascades are significantly enriched in the high GNAI1 expression phenotype. NES, Normalized enrichment score; NOM p-value, nominal p-value.
Discussion
The purpose of this study was to investigate molecular-level changes in HR(+)/HER2(-) BC in AYAs, such as DEGs, intermolecular interactions, and regulation between molecules and pathways. Comparing HR(+)/HER2(-) BC tissues in AYAs with para-carcinoma tissues, molecular differences between the 2 types of tissues may help explain the pathogenesis of this subtype. The study also provided insight into key genes and their main regulatory pathways for the future development of diagnostic and therapeutic strategies. Among different BC subtypes in AYAs, this study focused on patients with HR(+)/HER2(-) BC. Previous studies have shown that two-thirds of BC cases in AYAs involve the HR(+)/HER2(-) subtype and that the prognosis is worse than that of patients with the same subtype at other ages [17,18]. Therefore, it is particularly important to understand the pathogenesis of HR(+)/HER2(-) BC in AYAs.
In this study, by screening DEGs and constructing a PPI network, we found that GNAI1 was a key gene in the pathogenesis of HR(+)/HER2(-) BC in AYAs. GSEA showed that in BC in AYAs, the high GNAI1 expression phenotype was related to ether lipid metabolism and complement and coagulation cascades. GNAI1 encodes the α subunit of guanine nucleotide binding protein and it is one of the components of heterotrimeric signaling molecules. GNAI1, a member of Gα inhibitory family, is largely expressed in immune cells and participates in G protein-coupled receptor (GPCR) and non-GPCR signaling pathways [19]. GNAI1 participates in many physiologic processes such as proliferation and differentiation by transducing a variety of extracellular signals [20,21]. Ether lipid metabolism is usually disordered in tumor cells, and the changes of the lipid metabolism affect many cell processes, such as proliferation, autophagy, and development [22]. In breast cancer, it is closely related to progression [23]. Complement and coagulation cascades play an important role in the host immune response and help the body eliminate pathogens, and the interaction between the complement pathway and the coagulation cascade pathway also participates in many other important biological behaviors. In tumors, the complement system may promote tumor growth by regulating the inflammatory response, and may also promote epithelial-mesenchymal transition (EMT) and angiogenesis [24,25]. The coagulation cascade may affect the occurrence and development of tumors by affecting the expression of genes in tumor cells [26]. These studies indicate that GNAI1 may be a potential tumorigenesis molecular marker and therapeutic target for HR(+)/HER2(-) BC in AYAs.
In addition, a total of 1671 DEGs were found in this study. In the GO functional enrichment analysis, the DEGs in BP were mainly concentrated in the regulation of ion transmembrane transport. Previous studies have shown that ion transmembrane transport is associated with BC metastasis and chemotherapy resistance [27,28]. The DEGs in CC were mainly enriched in the extracellular matrix. Studies have shown that during the progression of BC, the components of the extracellular matrix can change greatly, for example, inducing specific laminins, and these changes play an important role in tumour progression and distant metastasis [29]. In the KEGG pathway enrichment analysis, the DEGs were mainly enriched in neuroactive ligand-receptor interaction. Disturbances in neuroactive ligand-receptor interaction can affect neurotransmitter transmission, leading to diseases such as alcohol dependence syndrome [30]. In addition, increased alcohol consumption increases the risk of BC [31]. These above-described studies also show that the regulation of ion transmembrane transport, extracellular matrix, and neuroactive ligand-receptor interaction may play important roles in HR(+)/HER2(-) BC in AYAs.
In addition, among other hub genes, TAS1R1 belongs to the TAS1R family, which has 3 members: TAS1R1, TAS1R2, and TAS1R3. The heterodimer complex composed of TAS1R1/TAS1R3 can be selectively activated by glutamic acid, thereby sensing the umami taste [32]. Although TAS1R1-TAS1R3 were originally found in taste neurons, studies have shown that it is expressed in many tissues, such as skeletal muscle and liver. The upregulation of this receptor can increase the insulin content in β cells [33]. As a receptor for amino acids, TAS1R1/TAS1R3 is also related to cell autophagy [34]. These studies also show that other key genes have potential biological value in HR(+)/HER2(-) BC in AYAs.
However, in this study, the association of GNAI1 expression with ether lipid metabolism and complement and coagulation cascades was reported for the first time. The specific regulatory mechanisms require further study.
In summary, this study analysed the RNA-seq data available for AYAs with HR(+)/HER2(-) BC and revealed that the key genes (CXCL2, CXCL5, CXCL3, GPR37L1, NPY2R, OXGR1, NPW, CCL21, GNAI1, SAA1, GRM4, HCAR2, CX3CL1, GRM8, CCL28, SSTR1, PENK, P2RY12, NMUR1, NMU, ADCY5, TAS1R1, OXER1, GNG13, CCL16, CCR8, NPY5R, CXCL11, CXCL10, CXCL9, CXCL1, CXCL6, CCR4, and ANXA1) may be molecular markers for tumorigenesis. In addition, ether lipid metabolism and complement and coagulation cascades may be key pathways for GNAI1 regulation in HR(+)/HER2(-) BC in AYAs. Therefore, the biologic effects of GNAI1 and 34 other key genes should be verified in further studies.
Disclosure of conflict of interest
None.
References
- 1.Bray F, Ferlay J, Soerjomataram I, Siegel RL, Torre LA, Jemal A. Global cancer statistics 2018: GLOBOCAN estimates of incidence and mortality worldwide for 36 cancers in 185 countries. CA Cancer J Clin. 2018;68:394–424. doi: 10.3322/caac.21492. [DOI] [PubMed] [Google Scholar]
- 2.Murphy BL, Day CN, Hoskin TL, Habermann EB, Boughey JC. Adolescents and young adults with breast cancer have more aggressive disease and treatment than patients in their forties. Ann Surg Oncol. 2019;26:3920–3930. doi: 10.1245/s10434-019-07653-9. [DOI] [PubMed] [Google Scholar]
- 3.Johnson RH, Anders CK, Litton JK, Ruddy KJ, Bleyer A. Breast cancer in adolescents and young adults. Pediatr Blood Cancer. 2018;65:e27397. doi: 10.1002/pbc.27397. [DOI] [PMC free article] [PubMed] [Google Scholar]
- 4.Colleoni M, Rotmensz N, Robertson C, Orlando L, Viale G, Renne G, Luini A, Veronesi P, Intra M, Orecchia R, Catalano G, Galimberti V, Nole F, Martinelli G, Goldhirsch A. Very young women (< 35 years) with operable breast cancer: features of disease at presentation. Ann Oncol. 2002;13:273–279. doi: 10.1093/annonc/mdf039. [DOI] [PubMed] [Google Scholar]
- 5.Copson E, Eccles B, Maishman T, Gerty S, Stanton L, Cutress RI, Altman DG, Durcan L, Simmonds P, Lawrence G, Jones L, Bliss J, Eccles D. Prospective observational study of breast cancer treatment outcomes for UK women aged 18-40 years at diagnosis: the POSH study. J Natl Cancer Inst. 2013;105:978–988. doi: 10.1093/jnci/djt134. [DOI] [PubMed] [Google Scholar]
- 6.Anders CK, Hsu DS, Broadwater G, Acharya CR, Foekens JA, Zhang Y, Wang Y, Marcom PK, Marks JR, Febbo PG, Nevins JR, Potti A, Blackwell KL. Young age at diagnosis correlates with worse prognosis and defines a subset of breast cancers with shared patterns of gene expression. J. Clin. Oncol. 2008;26:3324–3330. doi: 10.1200/JCO.2007.14.2471. [DOI] [PubMed] [Google Scholar]
- 7.Antoniou A, Pharoah PD, Narod S, Risch HA, Eyfjord JE, Hopper JL, Loman N, Olsson H, Johannsson O, Borg A, Pasini B, Radice P, Manoukian S, Eccles DM, Tang N, Olah E, Anton-Culver H, Warner E, Lubinski J, Gronwald J, Gorski B, Tulinius H, Thorlacius S, Eerola H, Nevanlinna H, Syrjakoski K, Kallioniemi OP, Thompson D, Evans C, Peto J, Lalloo F, Evans DG, Easton DF. Average risks of breast and ovarian cancer associated with BRCA1 or BRCA2 mutations detected in case series unselected for family history: a combined analysis of 22 studies. Am J Hum Genet. 2003;72:1117–1130. doi: 10.1086/375033. [DOI] [PMC free article] [PubMed] [Google Scholar]
- 8.Lalloo F, Varley J, Moran A, Ellis D, O’Dair L, Pharoah P, Antoniou A, Hartley R, Shenton A, Seal S, Bulman B, Howell A, Evans DG. BRCA1, BRCA2 and TP53 mutations in very early-onset breast cancer with associated risks to relatives. Eur J Cancer. 2006;42:1143–1150. doi: 10.1016/j.ejca.2005.11.032. [DOI] [PubMed] [Google Scholar]
- 9.Antoniou AC, Casadei S, Heikkinen T, Barrowdale D, Pylkas K, Roberts J, Lee A, Subramanian D, De Leeneer K, Fostira F, Tomiak E, Neuhausen SL, Teo ZL, Khan S, Aittomaki K, Moilanen JS, Turnbull C, Seal S, Mannermaa A, Kallioniemi A, Lindeman GJ, Buys SS, Andrulis IL, Radice P, Tondini C, Manoukian S, Toland AE, Miron P, Weitzel JN, Domchek SM, Poppe B, Claes KB, Yannoukakos D, Concannon P, Bernstein JL, James PA, Easton DF, Goldgar DE, Hopper JL, Rahman N, Peterlongo P, Nevanlinna H, King MC, Couch FJ, Southey MC, Winqvist R, Foulkes WD, Tischkowitz M. Breast-cancer risk in families with mutations in PALB2. N Engl J Med. 2014;371:497–506. doi: 10.1056/NEJMoa1400382. [DOI] [PMC free article] [PubMed] [Google Scholar]
- 10.Keegan TH, Press DJ, Tao L, DeRouen MC, Kurian AW, Clarke CA, Gomez SL. Impact of breast cancer subtypes on 3-year survival among adolescent and young adult women. Breast Cancer Res. 2013;15:R95. doi: 10.1186/bcr3556. [DOI] [PMC free article] [PubMed] [Google Scholar]
- 11.Szklarczyk D, Gable AL, Lyon D, Junge A, Wyder S, Huerta-Cepas J, Simonovic M, Doncheva NT, Morris JH, Bork P, Jensen LJ, Mering CV. STRING v11: protein-protein association networks with increased coverage, supporting functional discovery in genome-wide experimental datasets. Nucleic Acids Res. 2019;47:D607–D613. doi: 10.1093/nar/gky1131. [DOI] [PMC free article] [PubMed] [Google Scholar]
- 12.Shannon P, Markiel A, Ozier O, Baliga NS, Wang JT, Ramage D, Amin N, Schwikowski B, Ideker T. Cytoscape: a software environment for integrated models of biomolecular interaction networks. Genome Res. 2003;13:2498–2504. doi: 10.1101/gr.1239303. [DOI] [PMC free article] [PubMed] [Google Scholar]
- 13.Chin CH, Chen SH, Wu HH, Ho CW, Ko MT, Lin CY. CytoHubba: identifying hub objects and sub-networks from complex interactome. BMC Syst Biol. 2014;8(Suppl 4):S11. doi: 10.1186/1752-0509-8-S4-S11. [DOI] [PMC free article] [PubMed] [Google Scholar]
- 14.Subramanian A, Tamayo P, Mootha VK, Mukherjee S, Ebert BL, Gillette MA, Paulovich A, Pomeroy SL, Golub TR, Lander ES, Mesirov JP. Gene set enrichment analysis: a knowledge-based approach for interpreting genome-wide expression profiles. Proc Natl Acad Sci U S A. 2005;102:15545–15550. doi: 10.1073/pnas.0506580102. [DOI] [PMC free article] [PubMed] [Google Scholar]
- 15.Ritchie ME, Phipson B, Wu D, Hu Y, Law CW, Shi W, Smyth GK. limma powers differential expression analyses for RNA-sequencing and microarray studies. Nucleic Acids Res. 2015;43:e47. doi: 10.1093/nar/gkv007. [DOI] [PMC free article] [PubMed] [Google Scholar]
- 16.Yu G, Wang LG, Han Y, He QY. ClusterProfiler: an R package for comparing biological themes among gene clusters. OMICS. 2012;16:284–287. doi: 10.1089/omi.2011.0118. [DOI] [PMC free article] [PubMed] [Google Scholar]
- 17.Azim HA, Partridge AH. Biology of breast cancer in young women. Breast Cancer Res. 2014;16:427. doi: 10.1186/s13058-014-0427-5. [DOI] [PMC free article] [PubMed] [Google Scholar]
- 18.Sheridan W, Scott T, Caroline S, Yvonne Z, Vanessa B, David V, Karen G, Stephen C. Breast cancer in young women: have the prognostic implications of breast cancer subtypes changed over time? Breast Cancer Res Treat. 2014;147:617–629. doi: 10.1007/s10549-014-3125-1. [DOI] [PubMed] [Google Scholar]
- 19.Tang W, Putluri V, Ambati CR, Dorsey TH, Putluri N, Ambs S. Liver- and microbiome-derived bile acids accumulate in human breast tumors and inhibit growth and improve patient survival. Clin Cancer Res. 2019;25:5972–5983. doi: 10.1158/1078-0432.CCR-19-0094. [DOI] [PMC free article] [PubMed] [Google Scholar]
- 20.Chandrasekar B, Bysani S, Mummidi S. CXCL16 signals via Gi, phosphatidylinositol 3-kinase, Akt, I kappa B kinase, and nuclear factor-kappa B and induces cell-cell adhesion and aortic smooth muscle cell proliferation. J Biol Chem. 2004;279:3188–3196. doi: 10.1074/jbc.M311660200. [DOI] [PubMed] [Google Scholar]
- 21.Foley JF, Singh SP, Cantu M, Chen L, Zhang HH, Farber JM. Differentiation of human T cells alters their repertoire of G protein alpha-subunits. J Biol Chem. 2010;285:35537–35550. doi: 10.1074/jbc.M110.128033. [DOI] [PMC free article] [PubMed] [Google Scholar]
- 22.Hahnefeld L, Gruber L, Schömel N, Fischer C, Mattjus P, Gurke R, Beretta M, Ferreirós N, Geisslinger N, Wegner MS. Ether lipid and sphingolipid expression patterns are estrogen receptor-dependently altered in breast cancer cells. Int J Biochem Cell Biol. 2020;127:105834. doi: 10.1016/j.biocel.2020.105834. [DOI] [PubMed] [Google Scholar]
- 23.Vidavsky N, Kunitake JAMR, Diaz-Rubio ME, Chiou AE, Loh HC, Zhang S, Masic A, Fischbach C, Estroff LA. Mapping and profiling lipid distribution in a 3D model of breast cancer progression. ACS Cent Sci. 2019;5:768–780. doi: 10.1021/acscentsci.8b00932. [DOI] [PMC free article] [PubMed] [Google Scholar]
- 24.Markiewski MM, Nilsson B, Ekdahl KN, Mollnes TE, Lambris JD. Complement and coagulation: strangers or partners in crime? Trends Immunol. 2007;28:184–192. doi: 10.1016/j.it.2007.02.006. [DOI] [PubMed] [Google Scholar]
- 25.Afshar-Kharghan V. The role of the complement system in cancer. J Clin Invest. 2017;127:780–789. doi: 10.1172/JCI90962. [DOI] [PMC free article] [PubMed] [Google Scholar]
- 26.Wang X, Wang E, Kavanagh JJ, Freedman RS. Ovarian cancer, the coagulation pathway, and inflammation. J Transl Med. 2005;3:25. doi: 10.1186/1479-5876-3-25. [DOI] [PMC free article] [PubMed] [Google Scholar]
- 27.Magpusao AN, Omolloh G, Johnson J, Gascon J, Peczuh MW, Fenteany G. Cardiac glycoside activities link Na(+)/K(+) ATPase ion-transport to breast cancer cell migration via correlative SAR. ACS Chem Biol. 2015;10:561–569. doi: 10.1021/cb500665r. [DOI] [PMC free article] [PubMed] [Google Scholar]
- 28.Szafraniec MJ, Szczygiel M, Urbanska K, Fiedor L. Determinants of the activity and substrate recognition of breast cancer resistance protein (ABCG2) Drug Metab Rev. 2014;46:459–474. doi: 10.3109/03602532.2014.942037. [DOI] [PubMed] [Google Scholar]
- 29.Insua-Rodriguez J, Oskarsson T. The extracellular matrix in breast cancer. Adv Drug Deliv Rev. 2016;97:41–55. doi: 10.1016/j.addr.2015.12.017. [DOI] [PubMed] [Google Scholar]
- 30.Biernacka JM, Geske J, Jenkins GD, Colby C, Rider DN, Karpyak VM, Choi DS, Fridley BL. Genome-wide gene-set analysis for identification of pathways associated with alcohol dependence. Int J Neuropsychopharmacol. 2013;16:271–278. doi: 10.1017/S1461145712000375. [DOI] [PMC free article] [PubMed] [Google Scholar]
- 31.Brinton L, Gaudet M, Gierach G. Cancer epidemiology and prevention. New York: Oxford University Press; 2018. [Google Scholar]
- 32.Li X. T1R receptors mediate mammalian sweet and umami taste. Am J Clin Nutr. 2009;90:733S–737S. doi: 10.3945/ajcn.2009.27462G. [DOI] [PubMed] [Google Scholar]
- 33.Wauson EM, Zaganjor E, Cobb MH. Amino acid regulation of autophagy through the GPCR TAS1R1-TAS1R3. Autophagy. 2013;9:418–419. doi: 10.4161/auto.22911. [DOI] [PMC free article] [PubMed] [Google Scholar]
- 34.Wauson EM, Zaganjor E, Lee AY, Guerra ML, Ghosh AB, Bookout AL, Chambers CP, Jivan A, McGlynn K, Hutchison MR, Deberardinis RJ, Cobb MH. The G protein-coupled taste receptor T1R1/T1R3 regulates mTORC1 and autophagy. Mol Cell. 2012;47:851–862. doi: 10.1016/j.molcel.2012.08.001. [DOI] [PMC free article] [PubMed] [Google Scholar]


