

Abstract
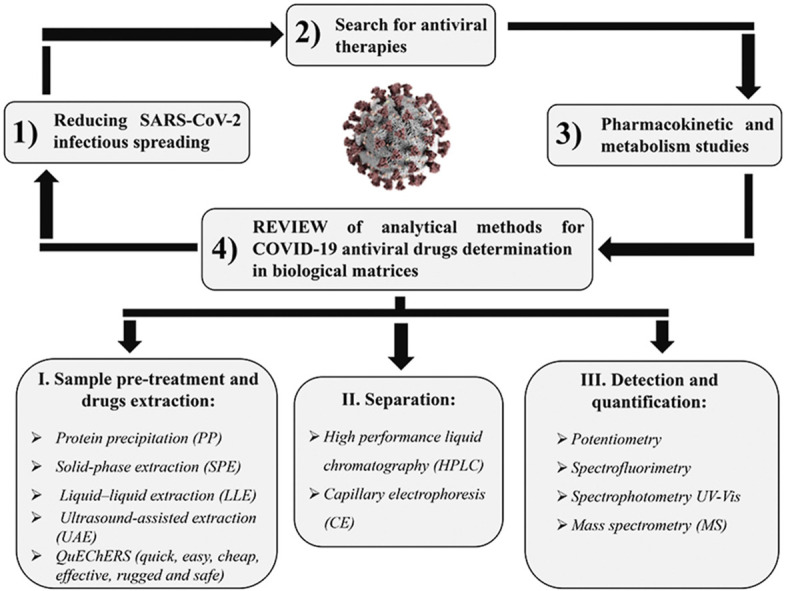
Since coronavirus disease 2019 (COVID-19) started as a fast-spreading pandemic, causing a huge number of deaths worldwide, several therapeutic options have been tested to counteract or reduce the clinical symptoms of patients infected with the severe acute respiratory syndrome coronavirus 2 (SARS-CoV-2). Currently, no specific drugs for COVID-19 are available, but many antiviral agents have been authorised by several national agencies. Most of them are under investigation in both preclinical and clinical trials; however, pharmacokinetic and metabolism studies are needed to identify the most suitable dose to achieve the desired effect on SARS-CoV-2. Therefore, the efforts of the scientific community have focused on the screening of therapies able to counteract the most severe effects of the infection, as well as on the search of sensitive and selective analytical methods for drug detection in biological matrices, both fluids and tissues. In the last decade, many analytical methods have been proposed for the detection and quantification of antiviral compounds currently being tested for COVID-19 treatment. In this review, a critical discussion on the overall analytical procedure is provided, i.e (a) sample pre-treatment and extraction methods such as protein precipitation (PP), solid-phase extraction (SPE), liquid–liquid extraction (LLE), ultrasound-assisted extraction (UAE) and QuEChERS (quick, easy, cheap, effective, rugged and safe), (b) detection and quantification methods such as potentiometry, spectrofluorimetry and mass spectrometry (MS) as well as (c) methods including a preliminary separation step, such as high performance liquid chromatography (HPLC) and capillary electrophoresis (CE) coupled to UV–Vis or MS detection. Further current trends, advantages and disadvantages and prospects of these methods have been discussed, to help the analytical advances in reducing the harm caused by the SARS-CoV-2 virus.
Keywords: SARS-CoV-2, Antivirals, Analytical methods, Biological matrices, Mass spectrometry, Liquid chromatography
Abbreviations: ACN, acetonitrile; AD, absolute deviation; ADME, adsorption, distribution, metabolism, and elimination; BeWos, human placental choriocarcinoma trophobplast cells; CE, capillary electrophoresis; CHCA, α-cyano-4-hydroxycinnamic acid; CRMs, certified reference materials; CSF, cerebrospinal fluid; CV, coefficient of variation; DEV, deviation from nominal concentration value; DHB, 2,5-dihydroxybenzoic acid; d-SPE, dispersive-sold-phase extraction; EMA, European Medicines Agency; Err, absolute value of the relative error; ESI, electrospray ionization; FDA, Food and Drug Administration; FL, fluorescence; HILIC, hydrophilic interaction liquid chromatography; HLB, hydrophilic-lipophilic balance; ICH, International Conference on Harmonization; LC, liquid chromatography; LLE, liquid-liquid extraction; LOD, limit of detection; LLOQ, lower limit of quantification; LOQ, limit of quantification; MALDI, matrix-assisted laser desorption/ionization; MCX, mixed-mode cationic exchange; MLC, micellar liquid chromatography; MRM, Muliple Reaction Monitoring; MSI, MALDI-MS Imaging; MTBE, methyltertbutyl ether; MS, mass spectrometry; NRTIs, nucleoside reverse transcriptase inhibitors; OSP, oseltamivir phosphate; PBA, phenylboronic acid; PBMCs, peripheral blood mononuclear cells; Ph. Eur, European Pharmacopoeia; PIs, protease inhibitors; PMA, phosphomolybdic acid; PP, protein precipitation; PSA, primary-secondary amine; Q, QuEChERS; QC, quality control; Q-MSI, quantitative MALDI-MS Imaging; RdRpIs, RNA polymerase inhibitors; RE, relative error; RSD, relative standard deviation; SDS, sodium dodecyl sulfate; SPE, solid-phase extraction; SRM, Selected Reaction Monitoring; TDM, therapeutic drug monitoring; TCA, trichloroacetic acid; UAE, ultrasound assisted extraction; UHPLC, ultra-high performance liquid chromatography
Graphical abstract
1. Introduction
A new coronavirus infection, designated as COVID-19 by the World Health Organization (WHO), emerged in December 2019 in Wuhan (Central China) [1], and then it rapidly spread worldwide, thus becoming a pandemic emergency, which forced most of the countries to take drastic actions of containment. As in the case of the severe acute respiratory syndrome (SARS) and the middle east respiratory syndrome (MERS), the virus of COVID-19 pandemic is formally associated with SARS coronavirus 2 (SARS-CoV-2), which affects the lower respiratory tract, manifesting as pneumonia in humans [2]. Even though neither a vaccine nor an effective antiviral treatment is available for humans, several drugs are currently undergoing clinical studies to test their efficacy and safety to treat the clinical symptoms of patients infected with SARS-CoV-2. The infected subjects have received off-label therapies such as chloroquine, hydroxychloroquine, azithromycin, interferon, steroids, monoclonal antibodies, anti–IL-6 inhibitors and other drugs approved for different infections, including Ebola, malaria, influenza, myelofibrosis, hypertension, rheumatoid arthritis, and acquired immune deficiency syndrome (AIDS) [[3], [4], [5]]. A huge number of antivirals have been tested both in in vitro studies and in authorised clinical trials. From a biochemical standpoint, most of them are protease inhibitors (PIs), i.e. darunavir, indinavir, lopinavir, ritonavir and saquinavir (Fig. 1 ) [[6], [7], [8], [9], [10]], thus preventing viral replication by selectively binding to viral proteases and blocking proteolytic cleavage of protein precursors that are necessary to produce infectious viral particles. Some others, like favipiravir, remdesivir and galidesivir [[11], [12], [13]] are RNA-dependent RNA polymerase inhibitors (RdRpIs), as they avoid RNA replication from an RNA template catalysed by RNA polymerase (Fig. 2 A). Favipiravir (6-fluoro-3-hydroxy-2-pyrazincarboxamide) is a carboxyamide derivative of pyrazine approved in Japan for treating influenza, but it is also active against various flu viruses, including the avian virus A (H7N9) and a paramyxovirus, respiratory syncytial virus [11]. Remdesivir, a monophosphoramidate prodrug, is an adenine nucleotide analogue, has been tested in 2015 in healthy volunteers to treat the Ebola virus disease [14]. Besides the families of PIs and RdRpIs as antivirals, other drugs used in therapy that belong to reverse transcriptase inhibitors (i.e., emtricitabine and tenofovir, Fig. 2B), neuraminidase enzyme inhibitors (i.e. oseltamivir, Fig. 3 A), RNA synthesis inhibitors (i.e. ribavirin, Fig. 3B), CAP-dependent endonuclease inhibitors (i.e. baloxavir-marboxil, Fig. 3C), and a membrane fusion inhibitors (umifenovir, Fig. 3D) [11,13,[15], [16], [17], [18]].
Fig. 1.

Structures, chemical formula and chemical properties (octanol-water partition coefficients, i.e. logP, and acid dissociation constants, i.e. pKa) of antivirals belonging to the class of protease inhibitors (PIs) tested for COVID-19 treatment, i.e. indinavir, ritonavir, saquinavir, darunavir and lopinavir.
Fig. 2.

Structures, chemical formula and chemical properties (octanol-water partition coefficients, i.e. logP, and acid dissociation constants, i.e. pKa) of antivirals belonging to the class of RNA-dependend RNA-polymerase inhibitors (A), i.e. favipiravir, remdesivir and galidesivir, and to the class of reverse transcriptase inhibitors (B), i.e. emtricitabin and tenofovir, tested for COVID-19 treatment.
Fig. 3.

Structures, chemical formula and chemical properties (octanol-water partition coefficients, i.e. logP, and acid dissociation constants, i.e. pKa) of antivirals belonging to the class of: inhibitors of the neuraminidase enzyme (A), i.e. oseltamivir, RNA synthesis inhibitors (B), i.e. ribavirin, cap-dependent endonuclease inhibitors (C), i.e. baloxavir marboxil and membrane fusion inhibitors (D), i.e. umifenovir, tested for COVID-19 treatment.
A literature screening of these drugs showed that many analytical techniques are used for their detection and quantification in biological samples of both human and animal origin. Most studies concerning quantification in animal tissues were aimed at detecting trace residues of antivirals used in livestock farming for the fast increase in animal growing [19,20]. The huge administration to animals of antiviral drugs leads to severe issues, including poisoning and immunosuppression [20]. To minimise these risks, in 2006 the Food and Drug Administration (FDA) prohibited on the extra-label use of antiviral agents such as oseltamivir in poultry. Instead, the research work in human biological fluids is strongly required to support the pharmacokinetic and metabolic studies. In detail, suitable analytical methodologies are needed for the sensitive quantification of these drugs and their metabolites in bio-fluids and tissues, to follow their adsorption, distribution, metabolism, and elimination (ADME) [21]. Moreover, the determination in biological matrices is also helpful in the development of new drugs, bioequivalence studies, toxicological analysis and therapeutic drug monitoring (TDM) [22]. TDM is defined as the continuous clinical laboratory monitoring of drug concentrations in various biological fluids during pharmaceutical administration to select the best therapeutic dose and duration of treatment for optimal patient benefit [23], thus avoiding therapeutic failure. In this context, a review focusing on the analytical methods developed for COVID-19 antiviral drugs detection in biological matrices is helpful to best know their ADME behavior. Due to the complexity of the biological samples and the low concentration of molecules of interest, sensitive and selective methods are demanded [24].
Here, we discuss the most recent and relevant literature, published in the period between 2010 and 2020, dealing with the analytical determination of antiviral drugs, currently tested for SARS-CoV-2 treatment, in human and animal biological samples. A special focus was addressed to method validation parameters, sample pre-treatment to remove endogenous interferences, drug extraction, chromatographic separation, and UV–Vis or MS detection. Such an overview would help the scientific community engaged on novel coronavirus studies for pharmacokinetics and drug monitoring scopes.
2. Method validation in pharmaceutical analysis of COVID-19 antiviral drugs in biological fluids and tissues
Analytical method validation is defined as the systematic process of establishing that an analytical method is acceptable for its intended purpose [25]. It demonstrates that a defined method protocol applies to a specified analyte with a defined concentration level and to a specified complex matrix and it represents the first level of quality control in the laboratories [26]. Quality control is an essential operation for pharmaceutical analysis. The demonstration of the suitability of an analytical method for the quantification of drug compounds is of great importance to ensure their occurrence in biological matrices. Besides, the validation of bioanalytical methods employed for the quantitative determination of drugs and their metabolites in biological matrices plays a key role in the evaluation of bioavailability, bioequivalence, pharmacokinetic and toxicokinetic studies [27].
Several guidelines can be used to validate a bio-analytical method for drug quantification in biological matrices: the Food and Drug Administration (FDA) guidelines, the European Medicines Agency (EMA) guidelines, the International Conference on Harmonization (ICH) guidelines and the European Pharmacopoeia (Ph. Eur.) are the most important reference for the quality control of medicines. In addition, the European Commission Decision 2002/657/EC provides a useful framework for xenobiotic residue detection in animal tissues as well in their products. All the mentioned validation guidelines list the analytical parameters and the established acceptance criteria which should be taken into account to define the method of interest as sensitive, accurate and selective.
The analytical parameters commonly investigated for validation are linearity, limit of detection (LOD) and limit of quantification (LOQ), sensitivity, accuracy, precision, recovery and matrix effect [28]. Linearity evaluates the ability of the bioanalytical procedure to obtain test results directly proportional to the concentration of analyte in the sample within the range of the standard curve [29]. As reported in the FDA guidelines [28], the linear range of the method, i.e. the calibration curve, should contain at least five standard points matrix-based, using single or replicate aliquots. The LOD and LOQ are defined, respectively, as the lowest amount of analyte that can be detected but not quantified and the lowest amount of analyte which can be quantitatively determined with suitable precision and accuracy [30]; LOQ defines the method sensitivity. The accuracy of a bioanalytical method is the closeness between the observed and the nominal or known true value and can be calculated for one day and between days [30,31]. It is expressed either as percent absolute bias or relative error (% RE) [29]. Instead, the precision is the ability to produce reproducible results between series of measurements from homogeneous samples. Precision is described as intra-day precision (i.e. repeatability) and inter-day precision (i.e. reproducibility) [30]. The precision is expressed as percent coefficient of variation (% CV) or percentage relative standard deviation (% RSD). Both accuracy and precision of a bioanalytical method need to be determined using quality control (QC) samples prepared at concentration levels covering the dynamic range of the method. Typically, QC samples are prepared at four levels: at the lower limit of quantification (LLOQC), low (LQC), middle (MQC) and high (HQC) limits of quantification [32]. The extraction efficiency of an analytical process, reported as a percentage of the known amount of an analyte carried through the sample extraction and processing steps of the method, is known as recovery [33]. Higher values of recovery indicate high efficiency of extraction procedure, higher sensitivity and accuracy of the bioanalytical method. Extraction efficiencies up to 100% can be achieved by the optimisation of the overall extraction protocol, including the pH and polarity of the extraction solvents, as well as the sample quantity. However, the recovery of the analyte from the biological matrix should not be 100%, but it should be consistent over the dynamic range of the method [32]. A biological matrix contains many interfering components such as salts, phospholipids, proteins and other substances that affect the results of the analyte quantification, for example, causing ion suppression or ion enhancement in LC-MS bioanalysis; therefore, the matrix effect should be evaluated during method validation. Moreover, certified reference materials (CRMs) and internal standards are needed in a laboratory's quality control programme to develop and validate accurate methods, thus ensuring traceable measurement results at a specified working level.
To date, several methods have been developed and validated for the analysis of antiviral drugs in biological fluids (e.g., urine, saliva, breast milk, cerebrospinal fluid, seminal plasma), feces, cell lysates and tissues according to the previously described guidelines. Furthermore, many studies have been devoted to the dried samples (i.e. blood, plasma, breast milk) spots [[34], [35], [36], [37], [38], [39], [40], [41]]. However, a lack of standard validation guidelines for drug quantification in dried samples spots is ascertained [34]. Therefore, accepted bio-analytical methodology validation practices are typically followed in those cases. One of the major challenges when developing a method for the quantification of pharmaceutical compounds in bio-fluids and tissues is the practical issues related to acquiring large volumes of sample for the preparation of calibration standards and quality controls [42]. Although the calibration standards should be prepared in the same biological matrix as the one that is going to be analysed, by adding an internal standard as well [28], many methods for antiviral drugs' quantification have been validated in aqueous solutions [20,[43], [44], [45], [46], [47], [48], [49]].
The methods used in the last decade for darunavir, indinavir, lopinavir, ritonavir, saquinavir, favipiravir, remdesivir, emtricitabine, ribavirin, tenofovir, oseltamivir and umifenovir detection in biological matrices are deepened in the next paragraphs. They were specific for a single drug or, more commonly, for the simultaneous analysis of several compounds, especially when they are used in the same therapy to improve long-term efficacy and tolerability. However, the validation parameters and the corresponding acceptance criteria are common to all of them and they are listed in Table 1 , which provides a comparison of the guidelines [28,[50], [51], [52]] commonly used for the validation of methods in the pharmaceutical analysis of COVID-19 antiviral drugs, in biological fluids and tissues.
Table 1.
Comparison of methods used to evaluate the main analytical validation parameters (linearity, sensititivity, accuracy, precision, recovery and matrix effect) as well as the corresponding acceptance criteria reported in the guidelines typically followed for bioanalytical methods validation developed for drugs quantitation in biological fluids and tissues.
| Guideline | Linearity | Sensitivity | Accuracy | Precision | Recovery | Matrix effect | |
|---|---|---|---|---|---|---|---|
| FDA | Method | Analyze a blank (no analyte, no IS), a zero calibrator (blank plus IS), and at least six, non-zero calibrator levels covering the quantitation range, including LLOQ in every run. | The lowest non-zero standard on the calibration curve defines the sensitivity (LLOQ). | Accuracy should be established by analysis of replicate concentrations with at least three independent runs, four QC levels per run (LLOQ, L, M, H QC), and ≥ five replicates per QC level. | Precision should be established with at least three independent runs, four QC levels per run (LLOQ, L, M, H QC), and ≥ five replicates per QC level. | Extracted samples at L, M, and H QC concentrations versus extracts of blanks spiked with the analyte post extraction (at L, M, and H) | Compare calibration curves in multiple sources of the biological matrix against a calibration curve in the matrix for parallelism (serial dilution of incurred samples) and nonspecific binding. |
| Acceptance criteria | Non-zero calibrators should be ±15% of nominal (theoretical) concentrations, except at LLOQ where the calibrator should be ±20% of the nominal concentrations in each run. | The analyte response at the LLOQ should be ≥ five times the analyte response of the zero calibrator. | ±15% of nominal concentrations; except ±20% at LLOQ. | ±15% CV, except ±20% CV at LLOQ | Recovery of analyte and IS need not be 100%, but it should consistent, precise and reproducible | / | |
| EMA | Method | A minimum of six calibration concentration levels should be used, in addition to the blank sample (processed matrix sample without analyte and without IS) and a zero sample (processed matrix with IS). Each calibration standard can be analysed in replicate. | Not described | Accuracy should be assessed on samples spiked with known amounts of the analyte (a minimum of 4 QC levels). The QC samples are analysed against the calibration curve, and the obtained concentrations are compared with the nominal value. | Precision should be assessed on minimum of five samples per concentration level at LLOQ, L, M and H QC samples in a single run (within- run precision) or in at least three runs analysed on at least two different days should be evaluated (between-run precision). | Not described | For each analyte and the IS, the matrix factor (MF) should be calculated for 6 lots of blank matrix, by the ratio of the peak area in the presence of matrix (measured by analysing blank matrix spiked after extraction with analyte), to the peak area in absence of matrix (pure solution of the analyte). |
| Acceptance criteria | The back calculated concentrations of the calibration standards should be within ±15% of the nominal value, except for the LLOQ for which it should be within ±20% | / | The mean concentration should be within 15% of the nominal values for the QC samples, except for the LLOQ which should be within 20% of the nominal value. | The within-run and between-run CV value should not exceed 15% for the QC samples, except for the LLOQ which should not exceed 20%. | / | The CV of the IS-normalized MF calculated from the 6 lots of matrix should not be greater than 15%. | |
| ICH | Method | A calibration curve should be generated with a blank sample, a zero sample (blank sample spiked with IS), and at least 6 concentration levels of calibration standards, including the LLOQ and the ULOQ. | Not described | Within-run accuracy should be evaluated by analysing at least 5 replicates at 4 QC concentration level in each analytical run. Between-run accuracy should be evaluated by analysing each QC concentration level in at least 3 analytical runs over at least two days. | Within-run precision should be evaluated by analysing at least 5 replicates at 4 QC concentration level in each analytical run. Between-run precision should be evaluated by analysing each QC concentration level in at least 3 analytical runs over at least two days. | Recovery is determined by comparing the analyte response in a biological sample that is spiked with the analyte and processed, with the response in a biological blank sample that is processed and then spiked with the analyte (L, M and H QC levels). | The matrix effect should be evaluated by analysing at least 3 replicates of L and H QCs, each prepared using matrix from at least 6 different sources/lots. |
| Acceptance criteria | The accuracy of the back-calculated concentrations of each calibration standard should be within ±20% of the nominal concentration at the LLOQ and within ±15% at all the other levels. | / | The overall accuracy at each concentration level should be within ±15% of the nominal concentration, except at the LLOQ, where it should be within ±20%. | The precision (%CV) of the concentrations determined at each level should not exceed 15%, except at the LLOQ, where it should not exceed 20%. | Recovery of the analyte does not need to be 100%, but the extent of recovery of an analyte and of the IS (if used) should be consistent. | The accuracy should be within ±15% of the nominal concentration and the precision (%CV) should not be greater than 15% in all individual matrix sources/lots. | |
| European Commission Decision 2002/657/EC | Method | At least five levels (including zero) should be used in the construction of the curve | Not described | Accuracy is determined by evaluating the trueness and the precision of the method. Trueness is evaluated by analysing six replicates of the CRM. Then, divide the detected mean concentration by the certified value (measured as concentration) and multiply by 100, to express the trueness as a percentage. If no CRM is available, instead of trueness, the recovery can be determined. | Fortify matrix with the analyte (to calculate repeatability) or CMR (for reproducibility) to yield concentrations equivalent to 1, 1,5 and 2 times the minimum required performance limit or 0,5, 1 and 1,5 times the permitted limit. At each level the analysis should be performed with at least six replicates analysed in repeatability conditions or reproducibility conditions. | Select 18 aliquots of a blank material and fortify six aliquots at each of 1, 1,5 and 2 times the minimum required performance limit or 0,5, 1 and 1,5 times the permitted limit. Then, analyze the samples and calculate the concentration present in each sample to determine recovery as: % Recovery = 100 × measured content/fortification level. |
Not described |
| Acceptance criteria | / | / | / | The CV under reproducibility conditions, shall not exceed the level calculated by the Horwitz Equation, or one half and two thirds (repeatability) | / | / | |
A method suitable for detecting and quantifying the drugs of interest in a relatively short time is essential for an efficient monitoring programme in biological matrices [53]. Irrespective of the type of method, at least three steps are required, among them sample pre-treatment and extraction, detection and quantification. In most cases a preliminary separation step is ensured before detection. Nevertheless, a description of each step of antiviral drugs analysis will be provided below. Note that for galidesevir and baloxavir-marboxil no studies are reported up to now.
3. Sample pre-treatment and extraction of COVID-19 antiviral drugs
An efficient sample preparation for detecting drugs in biological matrices should ensure recoveries as high as possible, remove potentially interfering with endogenous compounds, be quick, easy and cost-wise [54]. Typically it involves analytes extraction, clean-up and concentration before chromatographic separation [55].
Biological fluids, such as serum and plasma, as well as tissues are complex mixtures because they contain proteins, lipids, salts and metabolites with properties similar to the analytes of interest. Therefore, their direct injection into conventional chromatographic support is not suitable, due to the rapid worsening of column frits and stationary phases whereby clogging cannot be avoided [56]. To overcome this problem, several pre-treatment and extraction methods can be used, according to the matrix complexity (Table 2 ). To date, the analysis of antiviral drugs, which are tested for COVID-19 treatment, was performed in several biological matrices; most TDM studies were conducted on human plasma, but interest in measuring drug levels in urine, saliva, breast milk, cerebrospinal fluid, seminal plasma, faeces, poultry muscles and cell lysates (PBMCs, i.e. peripheral blood mononuclear cells, and BeWos, i.e. human placental choriocarcinoma trophoblast cells) was manifested as well.
Table 2.
Techniques used for the extraction of antiviral drugs from biological matrices with their main advantages and drawbacks.
| Extraction technique | Matrices | Advantages | Drawbacks |
|---|---|---|---|
| Protein precipitation (PP) | Plasma samples, seminal plasma, cell lysates, cerebrospinal fluid, mice vaginal lavage, saliva, urine and breast milk. | Fastest and simplest extraction technique. It can be used also as sample pre-treatment before applying other extraction techniques. | Low selectivity; it could induce analytes co-precipitation. It does not sufficiently remove endogenous compounds such as lipids, phospholipids and fatty acids. |
| Solid-phase extraction (SPE) | Plasma, cell lysates, cerebrospinal fluid, chicken tissue, poultry muscle. | It combines extraction, clean-up and concentration procedures in a single step. It ensures analytes extraction with high selectivity. | Slightly tedious and time-consuming extraction technique. In some cases, it could result in less intense chromatographic peaks if compared to liquid-liquid extraction. |
| Liquid-liquid extraction (LLE) | Plasma, urine, faeces, hairs, mice vaginal tissues, liver tissues, poultry muscles, peripheral blood mononuclear cells, and human placental choriocarcinoma trophobplast cells. | Faster and easier than SPE. It desalts samples very well, lessening the problem of source fouling in mass spectrometry analyses. | Time-consuming technique and a rather hazardous one, due to the use of large amounts of toxic organic solvents. It is less selective than solid-phase extraction; moreover, the possibility of emulsion formation prevents automation of this technique. |
| Ultrasound-assisted extraction (UAE) | Urine, chicken tissue, dried sample spots. | Ultrasound increases the rate of mass transfer of analytes from matrix in the solvent compared to the classic liquid-liquid extraction. | Technique not widespread for the extraction from biological matrices. |
| QuEChERS (Q) | Plasma, chicken muscle. | More suitable for the extraction of drugs from biological tissues compared to liquid-liquid extraction or solid-phase extraction. It is a quick, easy, cheap, effective, rugged and safe method, ensuring an high selectivity of the extraction. | The QuEChERS method yields final extracts less concentrated compared to the traditional extraction techniques. |
Typically, the preparation of plasma samples includes protein precipitation (PP), solid-phase extraction (SPE), liquid–liquid extraction (LLE) or a combination of two or more of them. PP protocols involve the addition of organic solvents to plasma, causing the precipitation of proteins by changing their solvation in water. Then, the resultant protein precipitates are separated from the analytes through centrifugation. This technique is one of the most commonly used for plasma samples, due to its low cost and minimal method development requirements [57]. As precipitating agents of antiviral drugs, acetonitrile/methanol mixtures have been widely preferred in different ratios [[58], [59], [60], [61], [62]]. Moreover, in some cases, acetonitrile [45,63,64] acidified with 0.01% HCl [65] or water adjusted with 8% (v/v) trichloroacetic acid (TCA) [66] and methanol alone [67] have been used too. In addition to plasma samples, PP has been applied to other matrices, such as seminal plasma [42], cell lysates [68], cerebrospinal fluid [67], mice vaginal lavage [69], saliva [64], urine [46] and breast milk [70]. Yamada et al. [64] used protein precipitation for extracting darunavir, tenofovir and other antiviral drugs from saliva samples, through a three-step protocol, including the addition of ACN, drying of the supernatant and its regeneration with the mobile phase. Moreover, ACN was used also for the extraction from urine samples assisted by sonication in an ultrasonic bath, in a method developed by Gumustas et al. [46] for the quantification of emtricitabine, rilpivirine and tenofovir. For mice vaginal lavage, the addition of ACN is used to precipitate mucins and dilute salts [69], while in the case of breast milk, PP is conducted after lipid removal through hexane treatment [70]. When applied to samples different from plasma, protein precipitation gave satisfactory results; it should be noted however that, in some cases, to prevent carryover effects during liquid chromatography, but keeping the same LLOQ as in plasma, an extra dilution of the residue obtained after evaporation was needed [42].
In spite of quick and easy extraction, traditional protein precipitation is characterized by low selectivity, because of the analytes co-precipitation [56,71]. Moreover, it fails to sufficiently remove endogenous compounds such as lipids, phospholipids, fatty acids whose co-elution with the compounds of interest affects the ESI droplet desolvation process [72]. Therefore, PP is used as a pre-treatment of plasma samples in other extraction techniques. Accordingly, Charbe et al. [73] developed a method for the extraction from human plasma of nine antiretroviral agents, including darunavir and lopinavir, based on protein precipitation with acetate buffer at pH 4.5, followed by solid phase extraction (SPE). SPE uses the affinity of solutes dissolved or suspended in a liquid (known as the mobile phase) for a solid through which the sample is passed (known as the stationary phase) to separate a mixture into desired and undesired components. The analytes are recovered either by elution using a proper solvent or thermal desorption into the gas phase [74]. This technique has been used in many works, as an attractive alternative to PP, to quantify antiviral drugs in plasma and cell lysates [75] because it combines extraction and clean-up procedures in a single step. The extractions were performed by C18 [76] and hydrophilic-lipophilic balance (HLB) cartridges [77,78]. HLB cartridges ensure a less tedious process compared to conventional C18 based SPE, due to the ability to remain wetted and simultaneously to adsorb analytes with various polarities and pH values. Besides, they allow the simultaneous analysis of a higher number of samples [79,80]. Nevertheless, their versatility makes them less selective. Mixed-mode cationic exchange (MCX) cartridges, which are built upon HLB copolymer with additional presence of sulphonic groups to make them a strong cation-exchanger, can overcome the shortcomings of HLB [81]. They have been exploited for COVID-19 antiviral drugs tested extraction by some authors [[82], [83], [84]]. Ocque et al. [83] developed a method based on MCX-SPE cartridges for extracting tenofovir from both plasma and cerebrospinal fluid, upon sample pre-treatment with 4% phosphoric acid in water. MCX-based SPE was also used by Liu et al. [84] to purify and concentrate chicken tissue sample, after ultrasound-assisted extraction (UAE) and protein precipitation. This sample preparation method gave the highest recoveries for oseltamivir, ranging between 80% and 100%, by using a trichloroacetic acid solution (20 g/L)/acetonitrile (9:1, v/v) as extracting solvent. To further reduce the matrix effects and facilitate the detection of antiviral drugs in poultry muscle, a tandem solid-phase extraction procedure was used by Berendsen et al. [85] in 2012. This method was suggested to ensure the simultaneous analysis of compounds with a broad range of physical and chemical properties, including umifenovir, oseltamivir and ribavirin. All compounds, except ribavirin, were separated from the matrix constituents by retaining them on a Strata-XC cartridge. Then this cartridge, containing ribavirin, was made basic, centrifuged, and applied onto a phenylboronic acid (PBA) cartridge to retain ribavirin to separate this drug from matrix constituents.
Regardless of providing clean extracts, which can be directly analysed by LC, Gupta et al. [86] found that SPE when applied for extracting darunavir from plasma resulted in less intense chromatographic peaks if compared to liquid-liquid extraction (LLE). LLE is a popular alternative to SPE in the bioanalytical field because it can be applied more quickly and easier, desalting samples very well and lessening the problem of source fouling in mass spectrometry analyses [87]. The solvents, useful to extract antiviral drugs from plasma, are ethyl acetate [43,88], diethyl ether [89] and methylene chloride [49], but the most widely employed remains methyltertbutyl ether (MTBE) [86,90] because it ensures better reproducibility and recovery [86]. MTBE was used for samples of urine and faeces as well [91]. Wu et al. [92] proposed a method based on LLE with methanol for the quantification of tenofovir in the hair samples. Hair analysis overcomes some limitations associated with drug detection in plasma, saliva, and other bio-fluids, such as the lack of drug long-term stability. Indeed, the drug concentration in hair strands can retrospectively reflect the drug usage over one month [93,94]. LLE for simultaneous measurements of antiviral drugs in mice vaginal tissues [69], liver tissue [95,96], poultry muscles [19], PBMCs [49] and BeWo [97] cells have been reported as well. Regarding poultry tissues, the LLE is often followed by a SPE clean-up procedure [19], whereas a preliminary treatment aimed at destroying the cell and nuclear membranes of PBMCs is necessary [98]. Along with the LLE, a treatment of PBMCs with more complex preparation protocols has been reported, including a dephosphorylation step conducted by adding phosphatase enzymes and an acid buffer solution (i.e. Tris–HCl buffer 30 mM pH 8.0, pure water and acetate buffer 1 M pH 4, 3:1:0.25, v:v:v, respectively) to the sample, followed by protein precipitation [99].
In addition to the above-mentioned protocols, also a method named QuEChERS (quick, easy, cheap, effective, rugged and safe) was used to extract antiviral drugs from bio-fluids and biological tissues [20,92,100], for which liquid-liquid extraction or solid-phase extraction is less suitable [20]. The QuEChERS (Q) is a fast and easy multi-residue method that involves an acetonitrile salting-out extraction followed by dispersive solid-phase extraction (d-SPE) to remove most remaining matrix interferences [101]. d-SPE is based on the same SPE methodology, but the sorbent is directly added to the extract without conditioning the clean-up, being easily conducted by shaking and centrifugation. As sorbent, a primary-secondary amine (PSA) is used and it's mixed alongside with anhydrous MgSO4 with the sample extract. QuEChERS was specifically developed in 2003 for pesticide determination [102] but it is currently used for drugs too, and many modifications have been proposed adaptating to the nature and fat content of the sample [103]. Wu et al. [92] used a modified Q method for extracting ribavirin from chicken muscles, using 1% acetic acid methanol extraction followed by a dispersive solid-phase extraction clean-up procedure, with PSA and C18 sorbent. ACN salt-out, which is typical of Q methods, was avoided due to the low solubility of ribavirin in water and responsible of low drug extraction recoveries. Sichilongo et al. [100] used a Q method for extracting tenofovir, emtricitabine, lopinavir, ritonavir and efavirenz from plasma samples. In the same work, the efficiencies of combined extraction techniques, i.e. Q-PP, Q-LLE and LLE-PP were also evaluated. The obtained results showed that the mixed extraction modes gave lower recoveries and poor accuracies, when compared to Q, PP or LLE alone. However, LOD values for all sample preparation techniques fell below the clinically relevant therapeutic range (3–8 ppm), thus being suitable for TDM routine analysis.
A separate discussion is needed for the preparation of dried sample spots [[34], [35], [36], [37], [38], [39], [40], [41]]. This low-cost technology has recently received a great deal of attention because of their distinct advantages of sample collection, less invasive sampling, simpler transfer, storage and shipping [104,105]. Dried sample spots are typically prepared by spotting low volumes (less than 50 μL) of the biofluids of interest on suitable cards. Before the analysis, they are placed in clean tubes, where the extraction solution is added. The extraction can be assisted by sonication [34,38] and, after centrifugation, the supernatant is collected for chromatographic analysis.
4. Separation and detection of COVID-19 antiviral drugs
Several analytical methods have been developed to accurately quantify antiviral drugs, currently tested against SARS-COV-2. As interfering compounds are normally occurring in biological samples, the use of analytical techniques that provide high selectivity and sensitivity is of crucial importance. A summary of methods published in the last decade, with their main advantages and drawbacks, is reported in Table 3 . Some methods based on potentiometry [44], spectrofluorimetry [45] or matrix-assisted laser desorption/ionization (MALDI) [[106], [107], [108]] were employed. However, as expected, the most widely used methods were based on hyphenated techniques, typically liquid chromatography but also capillary electrophoresis [46] (CE), coupled to UV–Vis detection or electrospray ionization (ESI) with mass spectrometry (MS). Indeed, besides their higher sensitivity, they offer the possibility to carry out multiresidue analyzes, i.e. analyzes in which more than one drug are detected and quantified simultaneously.
Table 3.
Analytical methods employed in the last ten years for the detection of antivirals currently tested for COVID-19 treatment, with their main advantages and drawbacks.
| Advantages | Drawbacks | ||
|---|---|---|---|
| Methods for direct detection and quantification | Potentiometry | Fast and economical possibility to monitor the drug of interest thanks to ion-selective electrodes, whose the electric potential created over membrane depends on its the activity and allows its quantification. | Still limited since many common ions occurring in biofluids and tissues could interfere with the measurement of the target analyte. |
| Spectrofluorimetry (FL) | Easy, less expensive and less time consuming methods; they offer better sensitivity compared to potentiometric methods. | Sometimes require derivatization steps before the detection to form fluorescent adducts, since not all the antivirals are characterized by native fluorescence. Endogenous compounds could interfere with the results of the analysis. | |
| Matrix Assisted Laser Desorption Ionization mass spectrometry (MALDI-MS) | Short analysis times and low ion suppression. | Quantification remains a major challenge due to problems associated with analyte recovery from the tissue and ionization matrix effects. | |
| Methods including a preliminary separation step | High performance liquid chromatography coupled to UV–Vis (HPLC-UV) | Better sensitivity compared to CE-UV. Possibility to carry out multiresidue analysis. | Sensitivity and selectivity are rather limited because LC-UV requires a huge volume of sample and complex sample preparation to detect drugs at a low concentration. |
| High performance liquid chromatography coupled to spectrofluorometric detection (LC-FL) | More sensitive and selective than LC-UV, since fluorescence is a characteristic of well-defined compounds. | Since not all the antivirals are characterized by native fluorescence, sometimes are required derivatization steps before the analysis. | |
| Capillary electrophoresis coupled to UV–Vis (CE-UV) | Faster analysis with higher efficiency than LC-UV, thanks to the drugs separation through a small capillary under the influence of an electric field. | Low concentration sensitivity | |
| High performance liquid chromatography coupled to mass spectrometry (LC-MS) | Higher selectivity and sensibility compared to LC-UV methods. Shorter analysis time. Possibility to carry out multiresidue analysis. | Susceptibility to matrix effects, due to the outcome of co-eluting interfering compounds on the analyte ionization. | |
| Ultra-high performance liquid chromatography coupled to mass spectrometry (UHPLC-MS) | Improved chromatographic efficiency compared to high performance liquid chromatography (HPLC) columns. Less susceptible to matrix effect. | Due to the smaller particles in the column, a more tedious pre-treatment of the sample in order to avoid its clogging is needed. |
4.1. Potentiometric methods
Recently, there has been a growing need for constructing chemical sensors for the fast and economical monitoring of drug compounds through potentiometric methods in pharmaceutical analysis. The potentiometric sensors are also known as ion-selective electrodes, where the electric potential created over the ion-selective membrane depends on the activity of the analyte and allows its quantification [109]. However, potentiometric methods to determinate antiviral drugs in biological matrices remain still limited because many common ions occurring in biofluids and tissues interfere with the measurement of the target analyte.
Hassan et al. [44] proposed a potentiometric sensor for monitoring oseltamivir phosphate (OSP). The sensor consisted of an ion association complex between the drug and phosphomolybdic acid (OSP-PMA) dispersed in polyvinyl chloride. The method was applied to OSP detection in spiked samples of urine and plasma without preliminary sample pre-treatments. Despite it offered a low cost of analysis and short response times [110], the developed ion-selective electrode exhibited relatively high limits of detection (LODs), approximately in the micromolar range [111], if compared to the other analytical techniques.
4.2. Spectrofluorimetric and spectrophotometric methods
Spectrophotometric and spectrofluorometric methods are often used for the determination of drugs, thanks to their versatility and cost-effectiveness. They can be successfully applied for pharmaceutical analysis, consisting of quality control of commercialized products and pharmacodynamic studies [112]. Since antiviral compounds show several unsaturations and aromatic rings in their structure (see Figs. 1, Figs. 2 and 3), one of the main advantages of their determination through spectrophotometric methods is the possibility to analyses without preliminary derivatization steps. The detection requires absorbance measurements typically carried out between 207 nm and 280 nm, with differences in λmax absorbtion depending on the specific target drug.
Conversely, spectrofluorimetric methods require derivatization steps before the detection of the antivirals to form fluorescent adducts, since not all of them are characterized by native fluorescence. Slightly high λexcitation and λemission are needed. As example, values of 408 nm and 475 nm were used, respectively, as λexcitation and λemission by Omar et al. [45] in a spectroflurorimetric method developed and validated in distilled water to quantify oseltamivir phosphate in plasma spiked samples. OSP was derivatized through the Hantzsch reaction of its primary amino group with acetylacetone and formaldehyde [45]. The calculated LOQ and LOD values were respectively 0.08 μg/mL and 0.24 μg/mL: these values were considerably lower than LLOQ (7.4 μg/mL) and LOD (3.73 μg/mL), obtained with the potentiometric method proposed by Hassan et al. [44].
Despite providing several advantages such as being easy, inexpensive and less time consuming, spectrophotometric and spectrofluorometric techniques alone for the quantification of drugs in biological matrices do not ensure high selectivity and suffer from the interference of many endogenous compounds, which can compromise the results of the analysis. Accordingly, a previous separation step by liquid chromatography (LC) or capillary electrophoresis (CE) is typically used before the detection of antiviral compounds.
CE is based on the separation of charged analytes through a small capillary under the influence of an electric field; thus, it represent a good alternative to conduct faster analysis with higher efficiency than LC [113]. However, the main disadvantage of CE is its low concentration sensitivity. In this regard, Gumustas et al. [46] compared LC-UV and CE-UV methods for the simultaneous determination of emtricitabine, rilpivirine and tenofovir. LC-UV sensitivity, calculated as the limit of detection (LOD) and limit of quantification (LOQ), was better than CE. Moreover, the LC-UV was found to be more precise than the CE method. The RSD values varied between 0.3 and 0.9% for LC-UV and between 2.5 and 4.2% for CE-UV.
Liquid chromatography coupled with UV–Vis detectors has been used in many works in order to quantify antiviral drugs in biological fluids, i.e. blood and plasma [43,73,89,90,[114], [115], [116], [117], [118], [119]]. Currently, reversed-phase liquid chromatography is the method of first choice for this task. The separation is carried out on C18 columns, with or without a guard-column system, and different mobile phase compositions (acidic or basic) are used. For ionizable specieswhich are the drugs tested for the COVID-19 treatment, the simplest and fastest way to implement the selectivity and the specificity of the LC-UV method is to adjust the pH of the mobile phase [120], which is known also for affecting the quantification limit of the method [121]. Studies reported in literature showed that the retention times of weak acids decrease with increasing pH values, while those of weak bases increase with increasing pH [122]. The chromatographic separation through the LC-UV methods employed in last ten years for antivirals has been achieved with mobile phases whose pH ranged from 3.23 to 8.10, since their pKa values are strongly different (−1.2 ≤ pKa ≤11.88, see Figs. 1, Figs. 2 and 3). As organic modifiers, acetonitrile and methanol have been used and mixed with water, phosphate buffer or acetate buffer in different proportions. The chromatographic run time is usually comprised between 4 and 25 min. The fastest run times of 4 and 5 min, respectively, occurred in isocratic methods for the determination of a single analyte, i.e. ritonavir and darunavir [89,90]. The longer run time for the determination of more than two drugs can be explained by the use of gradient elution mode in order to achieve good separation of drugs also from their own metabolites [123].
Recently, LC-UV methods have been also developed for drug enantiomers detection in dried blood spots, by using chiral columns, namely (±) darunavir and (±) emtricitabine [37,38]. In this case, a Chiralpak IA column (250 mm × 4.6 mm, 5 μm) has been employed and the chromatographic separation has been carried out isocratically with n-hexane-ethanol-diethyl amine (75:25:0.1) or with n-hexane-ethanol (65:35) as mobile phases. Run times of 13 and 15 min were needed, respectively, for the complete separations of the two enantiomers of darunavir and emtricitabine.
In addition, Peris-Vicente et al. [124] reported a method based on micellar liquid chromatography (MLC) combined with diode array detector for the simultaneous quantification of four antiretrovirals (darunavir, ritonavir, emtricitabine and tenofovir) in plasma. MLC, based on sodium dodecyl sulfate (SDS) as mobile phase, allows the direct injection of untreated plasma onto the chromatographic column for the rapid monitoring of drug contents. Apart from dilution and filtration, no sample pre-treatment is needed because SDS solubilizes plasma by denaturing proteins and avoiding their precipitation, by displacing the analytes from its components and by making them interact with the stationary phase [125]. A mobile phase consisting of 0.06 M SDS/2.5% 1-pentanol (pH 7) and running under isocratic mode through a C18 column, was chosen. The method, fully validated according to the ICH guideline, was linear between 0.25 and 25 μg/mL (r2 > 0.995); it showed an accuracy ranging from 89.3% to 103.2% and a precision lower than 8.2% for all the four analysed antivirals. The limit of detection was comprised between 0.080 and 0.110 μg/mL, while the limit of quantification ranged between 0.240 and 0.270 μg/mL.
Gralak-Dabrowska et al. [90] employed a LC-UV method to measure the level of darunavir in plasma. Although the proposed approach was advantageous for its run time of 5 min, considerably lower than the typical 10–30 min of the other reported methods, sensitivity and selectivity were rather limited because LC-UV requires a huge volume of sample and complex sample preparation to detect drugs at a low concentration [98,122]. Conversely, methods based on HPLC with fluorescence (FL) detection are inherently more sensitive than LC-UV. In addition, fluorescence is a characteristic of well-defined compounds, so that the FL detection is also more selective than UV, thus allowing to obtain a baseline without peaks associated to foreign substances [[98], [118], [126]]. A method for the determination of darunavir in PBMCs by LC-FL detection was presented by Nagano et al. [98] in 2014. The method took advantage of the compound native fluorescence, not requiring derivatization. Chromatographic separation was achieved on a C18 column with a mobile phase consisting of 20 mmol/L potassium phosphate buffer (pH 4.3)/acetonitrile (57/43, v/v), and spectrofluorometric detection at λexcitation = 235 nm and λemission = 337 nm. Voriconazole was used as internal standard and linear calibration curves were in the range 5–100 ng/106 cells. Intra-day precision and accuracy were lower than 8.77% and 12.0%, respectively.
4.3. Mass spectrometric methods
Mass spectrometry (MS) is a powerful analytical tool with many applications in several fields, such as in the environmental field [127] or in the foodomic [128]. Besides, it's useful also for both qualitative and quantitative application in the pharmaceutical field [[136], [137]]. In detail, soft ionization techniques such as matrix-assisted laser desorption ionization (MALDI) and, more importantly, electrospray ionization (ESI) are used to effectively ionize the drugs of interest [21,[129], [130], [131]]. Clearly, the polarity chosen for ionization, i.e. the positive or the negative one, depends on the relative acidity (pKa) of the functional groups occurring on the molecules [132]. For example, the detection of phenols is carried out in negative mode, since the deprotonation of phenolic OH groups is considered as the most likely ionization process under ESI conditions [133]. As regard to antiviral compounds, positive polarity is typically used because they have several secondary amino groups which can be readily protonated.
The main difference between MALDI and ESI ionization techniques is the physical state in which the sample is introduced to the ion source: ESI uses solvated samples that are infused into the instrument, whereas MALDI uses the solid state, as the sample is co-crystallized with an adequate matrix [134]. Anyway, both ESI-MS and MALDI-MS are very sensitive, as they allow the detection of analytes whose concentrations are as low as picomolar [134]. In addition, ESI-MS can efficiently be interfaced with analytical separation techniques, i.e. the chromatographic ones, enhancing its quantitative applications [135]. Regardless of the ionization source, the sensitivity of a mass spectrometer is related to its mass analyzer. Quadrupole (Q) and time of flight (ToF) mass analyzers are commonly used and they can be configured together as QqToF or QqQ tandem mass spectrometric instruments [138,139]. Tandem mass spectrometry (MS/MS) represents the most efficient and reliable analytical techniques for specific isolation, unequivocal identification and accurate quantification of drug compounds in biological samples.
The fragmentation pattern of COVID-19 tested antiviral drugs is well known for most of them. Due to the great variability and complexity in their structures, it is not possible to define a common behavior, but the breakdown of the same kinds of chemical bonds can be ascertained. In the product ion mass spectra of protease inhibitors, i.e. ritonavir ([M+H]+ at m/z 721), lopinavir ([M+H]+ at m/z 629) and darunavir ([M+H]+ at m/z 548), fragment ions at m/z 296, m/z 447 and m/z 392, respectively, are obtained after breaking of amide linkage. As regards indinavir ([M+H]+ at m/z 614) and saquinavir ([M+H]+ at m/z 671), the signals at m/z 421 and m/z 570 are obtained by the cleavage of the linkage between amide carbon and the carbon in alpha to the amide group (see Fig. 4 as example) [138].
Fig. 4.

Product ion mass spectra of some protease inhibitors, i.e. ritonavir, lopinavir and indinavir. Reproduced with the permission of Mishra et al., 2012 [138].
Instead, MS/MS fragmentation of umifenovir ([M+H]+ at m/z 477) involves the formation of product ions at m/z 432 and m/z 387 due to the loss of dimethylamine ((H3C)2NH) and to the subsequent loss of ethanal (C2H4O). The loss of dimethylamine and a phenylsulfanyl radical (C6H5S) produces a fragment ion at m/z 323 from which, after a subsequent elimination of an ethyl radical (C2H5) or ethanal, ions at m/z 294 and m/z 279 are obtained (Fig. 5 ) [139]. Oseltamivir ([M+H]+ at m/z 313) fragmentation occurs through the formation of ions at m/z 296, due the loss of ammonia (NH3), at m/z 243, due to the loss of pentene (C5H10), and ions at m/z 225, m/z 208 and m/z 166 due, respectively, to the loss of 3-pentanol (C5H12O), ammonia or acetamide (C2H5NO) (Fig. 5) [139].
Fig. 5.

Fragmentation phatways proposed for umifenovir and oseltamivir. Reproduced with the permission of Niessen et al., 2020 [139].
As for product ion mass spectra of tenofovir ([M+H]+ at m/z 288) and emtricitabine ([M+H]+ at m/z 248), fragment ions at m/z 176 and m/z 130 are obtained, respectively, after the cleavage of the phosphoestere bond (tenofovir) and after the cleavage of the link with the nitrogen ring (emtricitabine) (Fig. 6 ) [140]. Instead, for ribavirin ([M+H]+ at m/z 245), the loss of the pentofuranose unit from the molecular ion gives the fragment ion at m/z 113 [141].
Fig. 6.

Product ion mass spectra of tenofovir and emtricitabine. Reproduced with the permission of Yadav et al. [140].
MS/MS analyses are typically performed in Selected Reaction Monitoring (SRM) and Multiple Reaction Monitoring (MRM) mode, when one or more product ions are monitored, respectively [142]. Therefore, the monitoring of specific precursor–product ion transitions increases the sensibility in quantitative bioanalysis and the selectivity, by decreasing the probability of false positive identification [143]. For the antiviral drugs under study, the monitored transitions are the same for either MALDI-MS and ESI-MS analysis.
4.3.1. MALDI-MS
Nowadays, MALDI-MS and MALDI-MS imaging (MSI), are considered as a useful approach for the direct screening and mapping of xenobiotic compounds in complex biological samples, particularly tissues. MALDI-MS is characterized by short analysis times and low ion suppression, compared to ESI sources. However, the application of MSI for quantification (Q-MSI) of antiviral drugs extracted from biological samples remains a major challenge [129]. Q-MSI, in fact, has to deal with several fundamental aspects that are difficult to control for absolute quantification, such as analyte recovery from the tissue and ionization matrix effects. Thus, the use of internal standards and specific preparation of calibration standards is crucial [144]. In addition, the selection of an appropriate matrix is critical to ensure a successful Q-MSI experiment. A suitable matrix for the MALDI-MS analysis of small molecules, such as drug compounds, should reduce the background signal in order to facilitate the identification of target analytes [145]. In this regard, 2,5-dihydroxybenzoic acid (DHB) and α-cyano-4-hydroxycinnamic acid (CHCA) are the preferred matrices [145].
Due to these limitations, few studies were proposed for the quantification of COVID-19 tested antiviral drugs in biological matrices, in the last ten years. In detail, the reported methods regarded tenefovir [107], indinavir, lopinavir, ritonavir and saquinavir [106] quantification in plasma and PBMCs samples. In order to overcome the problems associated with background signals, derived from the biological sample and the MALDI matrix, SRM and MRM scan modes were used to detect the target drugs. Tenofovir was quantified in plasma, through the application of a MALDI-QqQ-MS technology in combination with an isotope dilution method, by Meesters et al. [107]. These authors used CHCA as MALDI matrix and the laser power was set to 60%. The developed method was validated according to the FDA guidelines and values of 0.04 μmol/L and 0.1 μmol/L were obtained, respectively, for LOD and LLOQ. Besides, values of LLOQ ranging from 3.2 to 167 nM were obtained with a MALDI-QqQ-MS method developed and validated by Van Kampen et al. [106] for quantification of indinavir, lopinavir, ritonavir and saquinavir. It should be noted that, for lopinavir and ritonavir, SRMs were performed on the sodium adducts of the drugs. For those analyses, sodium iodide (NaI) was added to the matrix solution, i.e. CHCA, to increase the intensity of the sodium adducts of the drugs, respectively, at m/z 651 and m/z 743.
In 2014, a quantitative mass spectrometry imaging method based on infrared matrix-assisted laser desorption electrospray ionization (IR-MALDESI) was developed for emtricitabine quantification [108]. IR-MALDESI combines advantages of both ESI and MALDI, such as the production of multiply charged ions, high salt tolerance, ambient nature and amenability to imaging. With this technique, the ablation occurs by using an IR laser in combination with ESI [146]. Bokhart et al. [108] set the IR laser wavelength to 2.94 μm in order to cause emtricitabine desorption. After applying the method to incubated human cervical tissues, the concentration level found in the analysed samples (17.2 ± 1.8 μg/gtissue) was compared to that resulting from LC-MS/MS analyses (28.4 ± 2.8 μg/gtissue) within a cross-validation study (see Supplementary Material, Table S1).
4.3.2. ESI-MS and MS/MS
Electrospray ionization has been the most used ionization technique for the analysis of COVID-19 tested antiviral drugs. Electrospray ionization mass spectrometric or tandem mass spectrometric (ESI-MS or ESI-MS/MS) analyses of antiviral compounds are always preceded by a chromatographic separation step. LC–MS is often preferred to ultraviolet or fluorescence detection in the bioanalytical field, because it offer a better selectivity and sensibility [[143], [154], [155], [156], [157], [158], [159], [160], [161], [162], [163], [164], [165], [166], [167], [168]].
As for LC-UV methods, also with LC-MS methods the chromatographic separation of antiviral compounds is typically carried out on C18 columns, but some methods based on the use of C8 columns [147,148], as well as one based on the use of a C30 column were also proposed [39]. As mobile phases, MeOH, ACN and ultrapure water added with formic acid have been mainly employed. Mobile phases additives, such as formic acid, are often used in the bioanalytical field to increase ionization with ESI (+). As previously described, positive polarity is typically used for ESI ionization of COVID-19 tested antiviral drugs. However, Valluru et al. [82] compared both negative (ESI-) and positive (ESI+) ion modes, finding that negative one showed better selectivity and sensitivity for tenofovir. Its quantification in plasma samples was carried out by using the peak signals at m/z 286.1 as precursor ion and at m/z 134.0 as product ion. The ionization efficiency of analytes undergoing quantification, can modulate well the selectivity of the LC-MS methods [149] and it can further be increased by promoting the ionization by proper desolvation temperature, gas flows and source settings [150]. When these strategies are not sufficient, the second easiest method to improve the selectivity of the method may be the replacement of the C18 phase with a different sort of stationary phase. As example, Chan et al. [19] analysed amantadine, rimantadine, oseltamivir (and its active metabolite oseltamivir carboxylate) and zanamivir in poultry muscle, on a zwitterionic hydrophilic interaction liquid chromatography (HILIC) column coupled to a triple quadrupole mass spectrometer. HILIC offers an alternative retention and separation mechanism to reversed phase, whereby polar compounds, such as oseltamivir or zanamivir, are more strongly retained, increasing the selectivity of the method.
Isocratic elution programs are generally used for the chromatographic separations of antivirals, also when more than one drugs have to be detected. Indeed, Yamada et al. [64] well separated, in 6 min, two drugs, namely abacavir and tenofovir, in human plasma and saliva samples through a chromatographic method performed on a C18 reverse phase column (1.5 × 50 mm, 5 μm) isocratically, at a flow rate of 0.2 mL/min, using 5 mM formic acid-3% (v/v) acetonitrile as the mobile phase It should be noted that the run times of the proposed LC-MS methods for the detection and quantification of antiviral compounds tested for the COVID-19 treatment are, on average, shorter if compared to those of the LC-UV methods. Indeed they range from 1 to a maximum of 11 min. Only Berendsen et al. [85] reported a method based on a run time of 20 min for the simultaneous analysis of seven antiviral drugs, i.e. zanamivir, ribavirin, oseltamivir, oseltamivir carboxylate, amantadine, rimantadine and arbidol, in poultry muscle. The proposed method was based on a column-switch liquid chromatography system combining a C18 column with a Hypercarb column. In detail, zanamivir and ribavirin were eluted from the C18 column, within 5 min, and subsequently retained on the Hypercarb column. After that, on the Hypercarb column, zanamivir and ribavirin were separated from the matrix constituents using a gradient and then directly detected by MS. After their elution, the other antiviral drugs were eluted from the C18 column by increasing the organic content of the mobile phase, passing by the Hypercarb column and entering the MS directly. In general, LC-MS/MS allows to obtain LOD and LOQ values in the order of ng/mL within antivirals analysis. Kanneti et al. [77] developed and validated a high-throughput LC–MS/MS method for simultaneous quantitation of oseltamivir phosphate and its oseltamivir carboxylate metabolite in human plasma, obtaining the best values of LLOQ (lower limit of quantification), i.e. 0.92 ng/mL for OSP and 5.22 ng/mL for its metabolite. However, one limitation associated with LC-MS analysis is its susceptibility to matrix effects [[151], [152]]. Matrix effect is defined as the outcome of co-eluting interfering compounds on the analyte ionization. Typically, suppression or enhancement of analyte response affect precision and accuracy of corresponding results [149,150]. This issue could be resolved by improving chromatographic efficiency, by using ultra high-performance liquid chromatography (UHPLC) columns. UHPLC has been used by numerous authors for the analysis of antivirals in biological matrices [[58], [59], [67], [70], [83], [86], [95], [96], [99]]. Since its commercial introduction in 2004, there has been a considerable interest in ultra-high-performance (pressure) liquid chromatography (UHPLC), which dramatically increases the throughput of regular HPLC methods [153]. One of the most recent UHPLC-MS/MS method for the antiviral compounds analysis was developed and fully validated by Courlet et al. [67] in 2018 for the quantification of five nucleoside reverse transcriptase inhibitors (NRTIs), among which emtricitabine and tenofovir, in plasma and cerebrospinal fluids. For the chromatographic separation, the mobile phase consisted of ultrapure water with 0.1% formic acid (component A) and MeOH with 0.1% formic acid (component B). The mobile phase was delivered at a flow rate of 0.5 mL/min using a 2-step gradient elution program; the total run time was of 5 min. With this method, the matrix effects were quantitatively estimated at three concentration levels, i.e. low (L, 10 ng/mL), medium (M, 300 ng/mL for plasma and 100 ng/mL for cerebrospinal fluid- CSF) and high (H, 3000 ng/mL) QC concentrations, through the standard line slope approach, and normalized to the internal standard. Briefly, the RSD of slopes from linear regressions estimated through L, M, H concentrations for spiked samples with both analytes and corresponding internal standard, after extraction were evaluated. The lack of significant matrix effects was confirmed by RSD values that did not exceed 3.4% for plasma or 2.5% for CSF. In addition, Avataneo et al. [62] calculated matrix effect by comparing the signal from the analysis of post-extraction spiked samples at high, medium, low QC levels and at LLOQ with those from direct injection of the same concentration of analytes without matrix, in the first UHPLC-MS/MS method, validated for remdesivir and its metabolite GS-441524 determination in plasma. In this case, the chromatographic conditions adopted, envisaged the use of an Acquity HSS T3 column, and a gradient elution program with ultrapure water with 0.05% formic acid (component A) and ACN with 0.1% formic acid (component B). as mobile phase The mean matrix effect factor obtained were 6% (RSD 4%) for remdesivir and −2% (RSD 12%) for GS-441524; while mean internal standard-normalized matrix effect (IS-nME) were −5% (RSD 4%) and −6% (RSD 8%), respectively (see Supplementary Material, Table S1).
5. Conclusions
Currently, indinavir, ritonavir, saquinavir, darunavir, lopinavir, favipiravir, remdesivir, galidesivir, emtricitabin, tenofovir, oseltamivir, ribavirin, baloxavir-marboxil and umifenovir are tested for COVID-19 infection. In this review, the literature screening has revealed that more than 80 analytical methods, most of them LC-MS/MS, have been developed and/or validated for the identification and detection of these antiviral drugs in biological samples. The absence of methods dedicated to baloxavir-marboxil and galidesivir was ascertained. The present article provides some degree of foundation for readers to successfully identify and/or establish the most suitable method to accurately quantify these compounds in biological fluids. It is desirable that with state-of-the-art analytical techniques, the selective identification and accurate quantification of antiviral drugs will lead us to a comprehensive understanding of their therapeutic effects.
Author contributions
Maria A. Acquavia: Writing - Original Draft, Visualization. Luca Foti: Data Curation, Investigation. Raffaella Pascale: Writing - Review & Editing Antonia Nicolò: Investigation Vincenzo Brancaleone: Validation. Tommaso R. I. Cataldi: Validation. Giuseppe Martelli: Supervision. Laura Scrano: Supervision. Giuliana Bianco: Supervision, Project administration.
Declaration of competing interest
The authors declare that they have no known competing financial interests or personal relationships that could have appeared to influence the work reported in this paper.
Footnotes
Supplementary data to this article can be found online at https://doi.org/10.1016/j.talanta.2020.121862.
Appendix A. Supplementary data
The following is the Supplementary data to this article:
References
- 1.Devaux C.A., Rolain J.M., Colson P., Raoult D. New insights on the antiviral effects of chloroquine against coronavirus: what to expect for COVID-19? Int. J. Antimicrob. Agents. 2020;55:1–6. doi: 10.1016/j.ijantimicag.2020.105938. [DOI] [PMC free article] [PubMed] [Google Scholar]
- 2.Sohrabi C., Alsafi Z., O'Neill N., Khan M., Kerwan A., Al-Jabir A., Iosifidis C., R. Agha, World Health Organization declares global emergency A review of the 2019 novel coronavirus (COVID-19) Int. J. Surg. 2020;76:71–76. doi: 10.1016/j.ijsu.2020.02.034. [DOI] [PMC free article] [PubMed] [Google Scholar]
- 3.Madrid P.B., Panchal R.G., Warren T.K., Shurtleff A.C., Endsley A.N., Green C.E., Kolokoltsov A., Davey R., Manger I.D., Gilfillan L., Bavari S., Tanga M.J. Evaluation of Ebola virus inhibitors for drug repurposing. ACS Infect. Dis. 2016;1:317–326. doi: 10.1021/acsinfecdis.5b00030. [DOI] [PubMed] [Google Scholar]
- 4.Tanenbaum L., Tuffanelli D.L. Antimalarial agents: chloroquine, hydroxychloroquine, and quinacrine. Arch. Dermatol. 1980;116:587–591. doi: 10.1007/978-1-61779-213-7_16. [DOI] [PubMed] [Google Scholar]
- 5.Markham A. Baricitinib : first global approval. Drugs. 2017;77:697–704. doi: 10.1007/s40265-017-0723-3. [DOI] [PubMed] [Google Scholar]
- 6.Cao B., Wang Y., Wen D., Liu W., Wang J., Fan G., Ruan L., Song B., Cai Y., Wei M., Li X., Xia J., Chen N., Xiang J., Yu T., Bai T., Xie X., Zhang L., Li C., Yuan Y., Chen H., Li H., Huang H., Tu S., Gong F., Liu Y., Wei Y., Dong C., Zhou F., Gu X., Xu J., Liu Z., Zhang Y., Li H., Shang L., Wang K., Li K., Zhou X., Dong X., Qu Z., Lu S., Hu X., Ruan S., Luo S., Wu J., Peng L., Cheng F., Pan L., Zou J., Jia C., Wang J., Liu X., Wang S., Wu X., Ge Q., He J., Zhan H., Qiu F., Guo L., Huang C., Jaki T., Hayden F.G., Horby P.W., Zhang D., Wang C. A trial of lopinavir-ritonavir in adults hospitalized with severe covid-19. N. Engl. J. Med. 2020;382:1787–1799. doi: 10.1056/NEJMoa2001282. [DOI] [PMC free article] [PubMed] [Google Scholar]
- 7.Ford N., Vitoria M., Rangaraj A., Norris S.L., Calmy A., Doherty M. Systematic review of the efficacy and safety of antiretroviral drugs against SARS, MERS or COVID-19: initial assessment. J. Int. AIDS Soc. 2020;23:1–9. doi: 10.1002/jia2.25489. [DOI] [PMC free article] [PubMed] [Google Scholar]
- 8.Costanzo M., De Giglio M.A.R., Roviello G.N. SARS CoV-2: recent reports on antiviral therapies based on lopinavir/ritonavir, darunavir/umifenovir, hydroxychloroquine, remdesivir, favipiravir and other drugs for the treatment of the new coronavirus. Curr. Med. Chem. 2020;27:1–6. doi: 10.2174/0929867327666200416131117. [DOI] [PubMed] [Google Scholar]
- 9.Agrawal S., Goel A.D., Gupta N. Emerging prophylaxis strategies against COVID-19. Monaldi Arch. Chest Dis. 2020;90:169–172. doi: 10.4081/monaldi.2020.1289. [DOI] [PubMed] [Google Scholar]
- 10.Farag A., Wang P., Ahmed M., Haaham S. Identification of FDA approved drugs targeting COVID-19 virus by structure- based drug repositioning. JAMA, J. Am. Med. Assoc. 2020;323:1061–1069. doi: 10.7551/mitpress/3215.003.0017. [DOI] [Google Scholar]
- 11.Du Y.X., Chen X.P. Favipiravir: pharmacokinetics and concerns about clinical trials for 2019-nCoV infection. Clin. Pharmacol. Ther. 2020:1–6. doi: 10.1002/cpt.1844. 0. [DOI] [PubMed] [Google Scholar]
- 12.Rosa S.G.V., Santos W.C. Clinical trials on drug repositioning for COVID-19 treatment. Rev. Panam. Salud Públic. 2020;44:1. doi: 10.26633/rpsp.2020.40. [DOI] [PMC free article] [PubMed] [Google Scholar]
- 13.Elfiky A.A. Ribavirin, remdesivir, sofosbuvir, galidesivir, and tenofovir against SARS-CoV-2 RNA dependent RNA polymerase (RdRp): a molecular docking study. Life Sci. 2020;253 doi: 10.1016/j.lfs.2020.117592. [DOI] [PMC free article] [PubMed] [Google Scholar]
- 14.Bixler S.L., Duplantier A.J., Bavari S. Discovering drugs for the treatment of Ebola virus. Curr. Treat. Options Infect. Dis. 2017;9:299–317. doi: 10.1007/s40506-017-0130-z. [DOI] [PMC free article] [PubMed] [Google Scholar]
- 15.Khalili J.S., Zhu H., Mak N.S.A., Yan Y., Zhu Y. Novel coronavirus treatment with ribavirin: groundwork for an evaluation concerning COVID-19. J. Med. Virol. 2020:1–7. doi: 10.1002/jmv.25798. [DOI] [PMC free article] [PubMed] [Google Scholar]
- 16.Lythgoe M.P., Middleton P. Ongoing clinical trials for the management of the COVID-19 pandemic. Trends Pharmacol. Sci. 2020;41:363–382. doi: 10.1016/j.tips.2020.03.006. [DOI] [PMC free article] [PubMed] [Google Scholar]
- 17.Lou Y., Liu L., Qiu Y. Clinical outcomes and plasma concentrations of baloxavir marboxil and favipiravir in COVID-19 patients: an exploratory randomized, controlled trial. MedRxiv. 2020:2020. doi: 10.1101/2020.04.29.20085761. 04.29.20085761. [DOI] [PMC free article] [PubMed] [Google Scholar]
- 18.Wang D., Hu B., Hu C., Zhu F., Liu X., Zhang J., Wang B., Xiang H., Cheng Z., Xiong Y., Zhao Y., Li Y., Wang X., Peng Z. Clinical characteristics of 138 hospitalized patients with 2019 novel coronavirus-infected pneumonia in wuhan, China. JAMA, J. Am. Med. Assoc. 2020;323:1061–1069. doi: 10.1001/jama.2020.1585. [DOI] [PMC free article] [PubMed] [Google Scholar]
- 19.Chan D., Tarbin J., Sharman M., Carson M., Smith M., Smith S. Screening method for the analysis of antiviral drugs in poultry tissues using zwitterionic hydrophilic interaction liquid chromatography/tandem mass spectrometry. Anal. Chim. Acta. 2011;700:194–200. doi: 10.1016/j.aca.2010.11.015. [DOI] [PubMed] [Google Scholar]
- 20.Mu P., Xu N., Chai T., Jia Q., Yin Z., Yang S., Qian Y., Qiu J. Simultaneous determination of 14 antiviral drugs and relevant metabolites in chicken muscle by UPLC-MS/MS after QuEChERS preparation. J. Chromatogr. B Anal. Technol. Biomed. Life Sci. 2016;1023:17–23. doi: 10.1016/j.jchromb.2016.04.036. [DOI] [PubMed] [Google Scholar]
- 21.Hopfgartner G., Bourgogne E. Quantitative high-throughput analysis of drugs in biological matrices by mass spectrometry. Mass Spectrom. Rev. 2003;22:195–214. doi: 10.1002/mas.10050. [DOI] [PubMed] [Google Scholar]
- 22.Vasconcelos I., Fernandes C. Magnetic solid phase extraction for determination of drugs in biological matrices. TrAC Trends Anal. Chem. (Reference Ed.) 2017;89:41–52. doi: 10.1016/j.trac.2016.11.011. [DOI] [Google Scholar]
- 23.Kang J.S., Lee M.H. Overview of therapeutic drug monitoring. Korean J. Intern. Med. (Korean Ed.) 2009;24:1–10. doi: 10.3904/kjim.2009.24.1.1. [DOI] [PMC free article] [PubMed] [Google Scholar]
- 24.Cassiano N.M., Lima V.V., Oliveira R.V., De Pietro A.C., Cass Q.B. Development of restricted-access media supports and their application to the direct analysis of biological fluid samples via high-performance liquid chromatography. Anal. Bioanal. Chem. 2006;384:1462–1469. doi: 10.1007/s00216-005-0253-9. [DOI] [PubMed] [Google Scholar]
- 25.Chandran S., Singh P.R.S. Comparison of various international guidelines for analytical method validation. Die Pharm. Int. J. Pharm. Sci. 2007;62:4–14. doi: 10.1691/ph.2007.1.5064. [DOI] [PubMed] [Google Scholar]
- 26.Taverniers I., De Loose M., Van Bockstaele E., laboratory Analytical method validation and quality assurance. Trends Anal. Chem. 2004;23:1–48. doi: 10.1016/j.trac.2004.04.001. [DOI] [Google Scholar]
- 27.Shah V.P. The history of bioanalytical method validation and Regulation : evolution of a guidance document on bioanalytical methods validation. AAPS J. 2007;9:E43–E47. [Google Scholar]
- 28.Food and Drug Administration Bioanalytical method validation guidance. Food Drug Adm. 2018:1–41. [Google Scholar]
- 29.V Sonawane L., Poul B.N., V Usnale S., V Waghmare P., Surwase L.H. Bioanalytical method validation and its pharmaceutical application- A review. Pharm. Anal. Acta. 2014;5:1–7. doi: 10.4172/2153-2435.1000288. [DOI] [Google Scholar]
- 30.Moein M.M., El Beqqali A., Abdel-Rehim M. Bioanalytical method development and validation: critical concepts and strategies. J. Chromatogr. B Anal. Technol. Biomed. Life Sci. 2017;1043:3–11. doi: 10.1016/j.jchromb.2016.09.028. [DOI] [PubMed] [Google Scholar]
- 31.Shah V.P., Midha K.K., Findlay J.W.A., Hill H.M., James D H., Iain J M., McKay G., Miller K.J., Patnaik R.N., Powell M.L., Tonelli A.V., Yacobi A. Bioanalytical method validation—a revisit with a decade of progress. Pharm. Res. (N. Y.) 2000;17:1551–1557. doi: 10.1023/A. [DOI] [PubMed] [Google Scholar]
- 32.Kollipara S., Bende G., Agarwal N., Varshney B., Paliwal J. International guidelines for bioanalytical method validation: a comparison and discussion on current scenario. Chromatographia. 2011;73:201–217. doi: 10.1007/s10337-010-1869-2. [DOI] [Google Scholar]
- 33.Bansal S., Stefano D. Anthony, Key elements of bioanalytical method validation for macromolecules. AAPS J. 2007;9:109–114. doi: 10.1208/aapsj0902017. [DOI] [PMC free article] [PubMed] [Google Scholar]
- 34.Prathipati P.K., Mandal S., Destache C.J. LC–MS/MS method for the simultaneous determination of tenofovir, emtricitabine, elvitegravir and rilpivirine in dried blood spots. Biomed. Chromatogr. 2018;32:1–7. doi: 10.1002/bmc.4270. [DOI] [PMC free article] [PubMed] [Google Scholar]
- 35.Duthaler U., Berger B., Erb S., Battegay M., Letang E., Gaugler S., Krähenbühl S., Haschke M. Automated high throughput analysis of antiretroviral drugs in dried blood spots. J. Mass Spectrom. 2017;52:534–542. doi: 10.1002/jms.3952. [DOI] [PubMed] [Google Scholar]
- 36.Waitt C., Diliiy Penchala S., Olagunju A., Amara A., Else L., Lamorde M., Khoo S. Development, validation and clinical application of a method for the simultaneous quantification of lamivudine, emtricitabine and tenofovir in dried blood and dried breast milk spots using LC–MS/MS. J. Chromatogr. B Anal. Technol. Biomed. Life Sci. 2017;1060:300–307. doi: 10.1016/j.jchromb.2017.06.012. [DOI] [PMC free article] [PubMed] [Google Scholar]
- 37.Nageswara Rao R., Arnipalli M.S., Nimmu N.V. Dried blood spot analysis of (+) and (-) darunavir enantiomers on immobilized amylose tris-(3, 5-dimethylphenylcarbamate) LC and its application to pharmacokinetics. Biomed. Chromatogr. 2015;29:1878–1884. doi: 10.1002/bmc.3510. [DOI] [PubMed] [Google Scholar]
- 38.Rao R.N., Santhakumar K., Naidu C.G. Rat dried blood spot analysis of (R,S)-(-)- and (S,R)-(+)- enantiomers of emtricitabin on immobilized tris-(3,5-dimethylphenyl carbamate) amylose silica as a chiral stationary phase. J. Chromatogr. B Anal. Technol. Biomed. Life Sci. 2015;1002:160–168. doi: 10.1016/j.jchromb.2015.08.016. [DOI] [PubMed] [Google Scholar]
- 39.Jimmerson L.C., Zheng J.H., Bushman L.R., MacBrayne C.E., Anderson P.L., Kiser J.J. Development and validation of a dried blood spot assay for the quantification of ribavirin using liquid chromatography coupled to mass spectrometry. J. Chromatogr. B Anal. Technol. Biomed. Life Sci. 2014;944:18–24. doi: 10.1016/j.jchromb.2013.10.035. [DOI] [PMC free article] [PubMed] [Google Scholar]
- 40.Watanabe K., Varesio E., Hopfgartner G. Parallel ultra high pressure liquid chromatography-mass spectrometry for the quantification of HIV protease inhibitors using dried spot sample collection format. J. Chromatogr. B Anal. Technol. Biomed. Life Sci. 2014;965:244–253. doi: 10.1016/j.jchromb.2014.05.008. [DOI] [PubMed] [Google Scholar]
- 41.Hooff G.P., Meesters R.J.W., Van Kampen J.J.A., Van Huizen N.A., Koch B., Al Hadithy A.F.Y., Van Gelder T., Osterhaus A.D.M.E., Gruters R.A., Luider T.M. Dried blood spot UHPLC-MS/MS analysis of oseltamivir and oseltamivircarboxylate-a validated assay for the clinic. Anal. Bioanal. Chem. 2011;400:3473–3479. doi: 10.1007/s00216-011-5050-z. [DOI] [PMC free article] [PubMed] [Google Scholar]
- 42.Illamola S.M., Valade E., Hirt D., Dulioust E., Zheng Y., Wolf J.P., Tréluyer J.M. Development and validation of a LC–MS/MS method for the quantification of tenofovir and emtricitabine in seminal plasma. J. Chromatogr. B Anal. Technol. Biomed. Life Sci. 2016;1033–1034:234–241. doi: 10.1016/j.jchromb.2016.08.011. [DOI] [PubMed] [Google Scholar]
- 43.Vanaja M., Sreeramulu J. Stability indicating determination of darunavir with hplc in blood plasma samples. Rasayan J. Chem. 2019;12:839–848. doi: 10.31788/RJC.2019.1225118. [DOI] [Google Scholar]
- 44.Hassan S.S.M., El-Nashar R.M., El-Tantawy A.S.M. A new validated potentiometric method for batch and continuous quality control monitoring of oseltamivir phosphate (Taminil) in drug Formulations and biological fluids. Electroanalysis. 2013;25:408–416. doi: 10.1002/elan.201200437. [DOI] [Google Scholar]
- 45.Omar M.A., Derayea S.M., Mostafa I.M. Development and validation of stability-indicating spectrofluorometric method for determination of H1N1 antiviral drug (Oseltamivir phosphate) in human plasma through Hantzsch reaction. R. Soc. Chem. Adv. 2015;5:27735–27742. [Google Scholar]
- 46.Gumustas M., Caglayan M.G., Onur F., Ozkan S.A. Simultaneous determination and validation of emtricitabine, rilpivirine and tenofovir from biological samples using LC and CE methods. Biomed. Chromatogr. 2018;32:1–8. doi: 10.1002/bmc.4158. [DOI] [PubMed] [Google Scholar]
- 47.Wiriyakosol N., Puangpetch A., Manosuthi W., Tomongkon S., Sukasem C., Pinthong D. A LC/MS/MS method for determination of tenofovir in human plasma and its application to toxicity monitoring. J. Chromatogr. B Anal. Technol. Biomed. Life Sci. 2018;1085:89–95. doi: 10.1016/j.jchromb.2018.03.045. [DOI] [PubMed] [Google Scholar]
- 48.Belkhir L., De Laveleye M., Vandercam B., Zech F., Delongie K.A., Capron A., Yombi J., Vincent A., Elens L., Haufroid V. Quantification of darunavir and etravirine in human peripheral blood mononuclear cells using high performance liquid chromatography tandem mass spectrometry (LC-MS/MS), clinical application in a cohort of 110 HIV-1 infected patients and evidence of a pote. Clin. Biochem. 2016;49:580–586. doi: 10.1016/j.clinbiochem.2015.12.011. [DOI] [PubMed] [Google Scholar]
- 49.Koehn J., Ding Y., Freeling J., Duan J., Ho R.J.Y. A simple, efficient, and sensitive method for simultaneous detection of anti-HIV drugs atazanavir, ritonavir, and tenofovir by use of liquid chromatography-tandem mass spectrometry. Antimicrob. Agents Chemother. 2015;59:6682–6688. doi: 10.1128/AAC.00869-15. [DOI] [PMC free article] [PubMed] [Google Scholar]
- 50.European Parliament and the Council of the European Union, 96/23/EC COMMISSION DECISION of 12 August 2002 implementing Council Directive 96/23/EC concerning the performance of analytical methods and the interpretation of results (notified under document number C(2002) 3044)(Text withEEA relevance) (2002/657/EC) Off. J. Eur. Communities. 2002:8–36. doi: 10.1017/CBO9781107415324.004. [DOI] [Google Scholar]
- 51.Smith G. European medicines agency guideline on bioanalytical method validation: what more is there to say? Bioanalysis. 2012;4:865–868. doi: 10.4155/bio.12.44. [DOI] [PubMed] [Google Scholar]
- 52.European Medicines Agency . 2019. ICH Guideline M10 on Bioanalytical Method Validation; pp. 1–57. [Google Scholar]
- 53.Mullett W.M. Determination of drugs in biological fluids by direct injection of samples for liquid-chromatographic analysis. J. Biochem. Biophys. Methods. 2007;70:263–273. doi: 10.1016/j.jbbm.2006.10.001. [DOI] [PubMed] [Google Scholar]
- 54.Kataoka H. New trends in sample preparation for clinical and pharmaceutical analysis. Trends Anal. Chem. 2003;22:232–244. doi: 10.1016/S0165-9936(03)00402-3. [DOI] [Google Scholar]
- 55.McDowall R.D., Doyle E., Murkitt G.S., Picot V.S. Sample preparation for the HPLC analysis of drugs in biological fluids. J. Pharm. Anal. 1989;7:1087–1096. doi: 10.1016/0731-7085(89)80047-0. [DOI] [PubMed] [Google Scholar]
- 56.Souverain S., Rudaz S., Veuthey J. Restricted access materials and large particle supports for on-line sample preparation : an attractive approach for biological fluids analysis. J. Chromatogr. B. 2004;801:141–156. doi: 10.1016/j.jchromb.2003.11.043. [DOI] [PubMed] [Google Scholar]
- 57.Ma J., Shi J., Le H., Cho R., Huang J.C., Miao S., Wong B.K. A fully automated plasma protein precipitation sample preparation method for LC – MS/MS bioanalysis. J. Chromatogr. B. 2008;862:219–226. doi: 10.1016/j.jchromb.2007.12.012. [DOI] [PubMed] [Google Scholar]
- 58.Simiele M., Ariaudo A., De Nicolò A., Favata F., Ferrante M., Carcieri C., Bonora S., Di Perri G., D'Avolio A. UPLC–MS/MS method for the simultaneous quantification of three new antiretroviral drugs, dolutegravir, elvitegravir and rilpivirine, and other thirteen antiretroviral agents plus cobicistat and ritonavir boosters in human plasma. J. Pharmaceut. Biomed. Anal. 2017;138:223–230. doi: 10.1016/j.jpba.2017.02.002. [DOI] [PubMed] [Google Scholar]
- 59.Djerada Z., Feliu C., Tournois C., Vautier D., Binet L., Robinet A., Marty H., Gozalo C., Lamiable D., Millart H. Validation of a fast method for quantitative analysis of elvitegravir, raltegravir, maraviroc, etravirine, tenofovir, boceprevir and 10 other antiretroviral agents in human plasma samples with a new UPLC-MS/MS technology. J. Pharmaceut. Biomed. Anal. 2013;86:100–111. doi: 10.1016/j.jpba.2013.08.002. [DOI] [PubMed] [Google Scholar]
- 60.Pajares García S., Guillén Tunica D., Brunet Serra M. Desarrollo y validación de un método para la determinación de darunavir en plasma mediante LC-MS/MS. Rev. Del Lab. Clin. 2011;4:127–133. doi: 10.1016/j.labcli.2010.12.002. [DOI] [Google Scholar]
- 61.Ter Heine R., Bioanalysis . Slotervaart Hospital/The Netherlands Cancer Institute; Amsterdam, The Netherlands: 2009. Metabolism & Clinical Pharmacology of Antiretroviral Drugs. Publication. [Google Scholar]
- 62.Avataneo V., de Nicolò A., Cusato J., Antonucci M., Manca A., Palermiti A., Waitt C., Walimbwa S., Lamorde M., di Perri G., D'Avolio A. Development and validation of a UHPLC-MS/MS method for quantification of the prodrug remdesivir and its metabolite GS-441524: a tool for clinical pharmacokinetics of SARS-CoV-2/COVID-19 and Ebola virus disease. J. Antimicrob. Chemother. 2020:1–6. doi: 10.1093/jac/dkaa152. [DOI] [PMC free article] [PubMed] [Google Scholar]
- 63.Else L., Watson V., Tjia J., Hughes A., Siccardi M., Khoo S., Back D. Validation of a rapid and sensitive high-performance liquid chromatography-tandem mass spectrometry (HPLC-MS/MS) assay for the simultaneous determination of existing and new antiretroviral compounds. J. Chromatogr. B Anal. Technol. Biomed. Life Sci. 2010;878:1455–1465. doi: 10.1016/j.jchromb.2010.03.036. [DOI] [PubMed] [Google Scholar]
- 64.Yamada E., Takagi R., Sudo K., Kato S. Determination of abacavir, tenofovir, darunavir, and raltegravir in human plasma and saliva using liquid chromatography coupled with tandem mass spectrometry. J. Pharmaceut. Biomed. Anal. 2015;114:390–397. doi: 10.1016/j.jpba.2015.06.005. [DOI] [PubMed] [Google Scholar]
- 65.Grigoriev A., Borisova I., Yaroshenko I., Sidorova A. In vitro and in vivo stability of oseltamivir within a bioequivalence trial. Anal. Bioanal. Chem. 2016:3891–3897. doi: 10.1007/s00216-016-9483-2. [DOI] [PubMed] [Google Scholar]
- 66.Kromdijk W., Rosing H., van den Broek M.P.H., Beijnen J.H., Huitema A.D.R. Quantitative determination of oseltamivir and oseltamivir carboxylate in human fluoride EDTA plasma including the ex vivo stability using high-performance liquid chromatography coupled with electrospray ionization tandem mass spectrometry. J. Chromatogr. B Anal. Technol. Biomed. Life Sci. 891–892. 2012:57–63. doi: 10.1016/j.jchromb.2012.02.026. [DOI] [PubMed] [Google Scholar]
- 67.Courlet P., Spaggiari D., Cavassini M., Du Pasquier R., Alves Saldanha S., Buclin T., Marzolini C., Csajka C., Decosterd L. Determination of nucleosidic/tidic reverse transcriptase inhibitors in plasma and cerebrospinal fluid by ultra-high-pressure liquid chromatography coupled with tandem mass spectrometry. Clin. Mass Spectrom. 2018;8:8–20. doi: 10.1016/j.clinms.2018.04.001. [DOI] [PMC free article] [PubMed] [Google Scholar]
- 68.Ouyang B., Zhou F., Zhen L., Peng Y., Sun J., Chen Q., Jin X., Wang G., Zhang J. Simultaneous determination of tenofovir alafenamide and its active metabolites tenofovir and tenofovir diphosphate in HBV-infected hepatocyte with a sensitive LC–MS/MS method. J. Pharmaceut. Biomed. Anal. 2017;146:147–153. doi: 10.1016/j.jpba.2017.08.028. [DOI] [PubMed] [Google Scholar]
- 69.Barreiros L., Cunha-Reis C., Silva E.M.P., Carvalho J.R.B., das Neves J., Sarmento B., Segundo M.A. Development and validation of a liquid chromatography-MS/MS method for simultaneous quantification of tenofovir and efavirenz in biological tissues and fluids. J. Pharmaceut. Biomed. Anal. 2017;136:120–125. doi: 10.1016/j.jpba.2016.12.028. [DOI] [PubMed] [Google Scholar]
- 70.Ramírez-Ramírez A., Sánchez-Serrano E., Loaiza-Flores G., Plazola-Camacho N., Rodríguez-Delgado R.G., Figueroa-Damián R., Domínguez-Castro M., López-Martínez M., Flores-García Z., Hernández-Pineda J. Simultaneous quantification of four antiretroviral drugs in breast milk samples from HIV-positive women by an ultra-high performance liquid chromatography tandem mass spectrometry (UPLC-MS/MS) method. PloS One. 2018;13:1–15. doi: 10.1371/journal.pone.0191236. [DOI] [PMC free article] [PubMed] [Google Scholar]
- 71.Souverain S., Rudaz S., Veuthey J. Protein precipitation for the analysis of a drug cocktail in plasma by LC – ESI –. MS. 2004;35:913–920. doi: 10.1016/j.jpba.2004.03.005. [DOI] [PubMed] [Google Scholar]
- 72.Van Eeckhaut A., Lanckmans K., Sarre S., Smolders I., Michotte Y. Validation of bioanalytical LC-MS/MS assays: evaluation of matrix effects. J. Chromatogr. B Anal. Technol. Biomed. Life Sci. 2009;877:2198–2207. doi: 10.1016/j.jchromb.2009.01.003. [DOI] [PubMed] [Google Scholar]
- 73.Charbe N., Baldelli S., Cozzi V., Castoldi S., Cattaneo D., Clementi E. Development of an HPLC–UV assay method for the simultaneous quantification of nine antiretroviral agents in the plasma of HIV-infected patients. J. Pharm. Anal. 2016;6:396–403. doi: 10.1016/j.jpha.2016.05.008. [DOI] [PMC free article] [PubMed] [Google Scholar]
- 74.Poole C.F. New trends in solid-phase extraction. Trends Anal. Chem. 2003;22:362–373. doi: 10.1016/S0165-9936(03)00605-8. [DOI] [Google Scholar]
- 75.Bushman L.R., Kiser J.J., Rower J.E., Klein B., Zheng J.H., Ray M.L., Anderson P.L. Determination of nucleoside analog mono-, di-, and tri-phosphates in cellular matrix by solid phase extraction and ultra-sensitive LC-MS/MS detection. J. Pharmaceut. Biomed. Anal. 2011;56:390–401. doi: 10.1016/j.jpba.2011.05.039. [DOI] [PMC free article] [PubMed] [Google Scholar]
- 76.Jr E.M., Massele A., Sepako E., Sichilongo K. A method employing SPE, MRM LC-MS/MS and a THF–water solvent system for the simultaneous determination of five antiretroviral drugs in human blood plasma. Anal. Methods. 2017;9:450–458. doi: 10.1039/C6AY02442D. [DOI] [Google Scholar]
- 77.Kanneti R., Bhavesh D., Paramar D., R S., Bhatt P.A. Development and validation of a high-throughput and robust LC-MS/MS with electrospray ionization method for simultaneous quantitation of oseltamivir phosphate and its oseltamivir carboxylate metabolite in human plasma for pharmacokinetic studies. Biomed. Chromatogr. 2011;25:727–733. doi: 10.1002/bmc.1509. [DOI] [PubMed] [Google Scholar]
- 78.Kanneti R., Jaswanth K.I., Neeraja K.R., Bhatt P.A. Development and validation of LC-MS/MS method for determination of Darunavir in human plasma for application of clinical pharmacokinetics. Int. J. Pharm. Pharmaceut. Sci. 2011;3:491–496. [Google Scholar]
- 79.Aburuz S., Millership J., Heaney L., Mcelnay J. Simple liquid chromatography method for the rapid simultaneous determination of prednisolone and cortisol in plasma and urine using hydrophilic lipophilic balanced solid phase extraction cartridges. J. Chromatogr. B. 2003;798:193–201. doi: 10.1016/j.jchromb.2003.09.044. [DOI] [PubMed] [Google Scholar]
- 80.Fernandez M., Sepulveda J., Aranguiz T., Von Plessing C. T echnique validation by liquid chromatography for the determination of acyclovir in plasma. J. Chromatogr. B. 2003;791:357–363. doi: 10.1016/s1570-0232(03)00252-6. [DOI] [PubMed] [Google Scholar]
- 81.Zhang H.C., jun Yu X., chao Yang W., feng Peng J., Xu T., Yin D.Q., lin Hu X. MCX based solid phase extraction combined with liquid chromatography tandem mass spectrometry for the simultaneous determination of 31 endocrine-disrupting compounds in surface water of Shanghai. J. Chromatogr. B Anal. Technol. Biomed. Life Sci. 2011;879:2998–3004. doi: 10.1016/j.jchromb.2011.08.036. [DOI] [PubMed] [Google Scholar]
- 82.Valluru R.K., B P.B.R., S K.S., V P.K., Kilaru N.B. High throughput LC-MS/MS method for simultaneous determination of tenofovir, lamivudine and nevirapine in human plasma. J. Chromatogr. B Anal. Technol. Biomed. Life Sci. 2013;931:117–126. doi: 10.1016/j.jchromb.2013.05.008. [DOI] [PubMed] [Google Scholar]
- 83.Ocque A.J., Hagler C.E., Morse G.D., Letendre S.L., Ma Q. Development and validation of an LC–MS/MS assay for tenofovir and tenofovir alafenamide in human plasma and cerebrospinal fluid. J. Pharmaceut. Biomed. Anal. 2018;156:163–169. doi: 10.1016/j.jpba.2018.04.035. [DOI] [PMC free article] [PubMed] [Google Scholar]
- 84.Liu Z.C., Yang F., Yao M., Lin Y.H., Su Z.J. Simultaneous determination of antiviral drugs in chicken tissues by ultra high performance liquid chromatography with tandem mass spectrometry. J. Separ. Sci. 2015;38:1784–1793. doi: 10.1002/jssc.201401461. [DOI] [PubMed] [Google Scholar]
- 85.Berendsen B.J.A., Wegh R.S., Essers M.L., Stolker A.A.M., Weigel S. Quantitative trace analysis of a broad range of antiviral drugs in poultry muscle using column-switch liquid chromatography coupled to tandem mass spectrometry. Anal. Bioanal. Chem. 2012;402:1611–1623. doi: 10.1007/s00216-011-5581-3. [DOI] [PMC free article] [PubMed] [Google Scholar]
- 86.Gupta A., Singhal P., Shrivastav P.S., Sanyal M. Application of a validated ultra performance liquid chromatography-tandem mass spectrometry method for the quantification of darunavir in human plasma for a bioequivalence study in Indian subjects. J. Chromatogr. B Anal. Technol. Biomed. Life Sci. 2011;879:2443–2453. doi: 10.1016/j.jchromb.2011.07.008. [DOI] [PubMed] [Google Scholar]
- 87.Zhang N., Hoffman K.L., Li W., Rossi D.T. Semi-automated 96-well liquid-liquid extraction for quantitation of drugs in biological fluids. J. Pharmaceut. Biomed. Anal. 2000;22:131–138. doi: 10.1016/S0731-7085(99)00247-2. [DOI] [PubMed] [Google Scholar]
- 88.Wang L., Zhao J., Zhang R., Mi L., Shen X., Zhou N., Feng T., Jing J., Liu X., Zhang S. Drug-drug interactions between PA-824 and darunavir based on pharmacokinetics in rats by LC-MS-MS. J. Chromatogr. Sci. 2018;56:327–335. doi: 10.1093/chromsci/bmy002. [DOI] [PubMed] [Google Scholar]
- 89.Louisa M., Soetikno V., Nafrialdi, Setiabudy R., Suyatna F.D. Primaquine decreased plasma concentration of ritonavir: single- and repeated-dose study in sprague dawley rats. Med. J. Indones. 2011;20:190–194. doi: 10.13181/mji.v20i3.449. [DOI] [PubMed] [Google Scholar]
- 90.Gralak-Dabrowska B., Pawinski T., Pulik P., Horban A. Interpatient variability of darunavir concentrations in plasma during long-term antiretroviral monotherapy. HIV AIDS Rev. 2014;13:10–13. doi: 10.1016/j.hivar.2013.10.002. [DOI] [Google Scholar]
- 91.Hendrikx J.J.M.A., Rosing H., Schinkel A.H., Schellens J.H.M., Beijnen J.H. Combined quantification of paclitaxel, docetaxel and ritonavir in human feces and urine using LC-MS/MS. Biomed. Chromatogr. 2014;28:302–310. doi: 10.1002/bmc.3021. [DOI] [PubMed] [Google Scholar]
- 92.Wu Y.L., Chen R.X., Zhu L., Lv Y., Zhu Y., Zhao J. Determination of ribavirin in chicken muscle by quick, easy, cheap, effective, rugged and safe method and liquid chromatography-tandem mass spectrometry. J. Chromatogr. B Anal. Technol. Biomed. Life Sci. 2016;1012:55–60. doi: 10.1016/j.jchromb.2016.01.016. [DOI] [PubMed] [Google Scholar]
- 93.Deshmukh N., Hussain I., Barker J., Petroczi A., Naughton D.P. Analysis of anabolic steroids in human hair using LC-MS/MS. Steroids. 2010;75:710–714. doi: 10.1016/j.steroids.2010.04.007. [DOI] [PubMed] [Google Scholar]
- 94.Pragst F., Balikova M.A. State of the art in hair analysis for detection of drug and alcohol abuse. Clin. Chim. Acta. 2006;370:17–49. doi: 10.1016/j.cca.2006.02.019. [DOI] [PubMed] [Google Scholar]
- 95.Ocque A.J., Hagler C.E., Difrancesco R., Woolwine-Cunningham Y., Bednasz C.J., Morse G.D., Talal A.H. Development and validation of a UPLC-MS/MS method for the simultaneous determination of paritaprevir and ritonavir in rat liver. Bioanalysis. 2016;8:1353–1363. doi: 10.4155/bio-2016-0040. [DOI] [PMC free article] [PubMed] [Google Scholar]
- 96.Ocque A.J., Hagler C.E., DiFrancesco R., Morse G.D., Talal A.H. Ultra-performance liquid chromatography tandem mass spectrometry for determination of Direct Acting Antiviral drugs in human liver fine needle aspirates. J. Chromatogr. B Anal. Technol. Biomed. Life Sci. 2017;1052:103–109. doi: 10.1016/j.jchromb.2017.03.020. [DOI] [PMC free article] [PubMed] [Google Scholar]
- 97.Wang M., Halquist M.S., Zhang Y., Gerk P.M. Simultaneous determination of lopinavir and three ester prodrugs by LC-MS/MS in lysates of BeWo cells. J. Chromatogr. B Anal. Technol. Biomed. Life Sci. 2015;975:84–90. doi: 10.1016/j.jchromb.2014.10.032. [DOI] [PubMed] [Google Scholar]
- 98.Nagano D., Araki T., Nakamura T., Yamamoto K. Determination of intracellular darunavir by liquid chromatography coupled with fluorescence detection. J. Chromatogr. Sci. 2014;52:1021–1025. doi: 10.1093/chromsci/bmt147. [DOI] [PubMed] [Google Scholar]
- 99.Agnesod D., De Nicolò A., Simiele M., Mohamed Abdi A., Boglione L., Di Perri G., D'Avolio A. Development and validation of a useful UPLC-MS/MS method for quantification of total and phosphorylated-ribavirin in peripheral blood mononuclear cells of HCV+ patients. J. Pharmaceut. Biomed. Anal. 2014;90:119–126. doi: 10.1016/j.jpba.2013.11.027. [DOI] [PubMed] [Google Scholar]
- 100.Sichilongo K., Mwando E., Sepako E., Massele A. Comparison of efficiencies of selected sample extraction techniques for the analysis of selected antiretroviral drugs in human plasma using LC-MS. J. Pharmacol. Toxicol. Methods. 2018;89:1–8. doi: 10.1016/j.vascn.2017.10.001. [DOI] [PubMed] [Google Scholar]
- 101.Rejczak T., Tuzimski T. A review of recent developments and trends in the QuEChERS sample preparation approach. Open Chem. 2015;13:980–1010. doi: 10.1515/chem-2015-0109. [DOI] [Google Scholar]
- 102.Anastassiades Michelangelo L.S.J. Fast and easy multiresidue method employing acetonitrile extraction/partitioning and “dispersive solid-phase extraction” for the determination of pesticide residues in produce. J. AOAC Int. 2003;86:412–431. [PubMed] [Google Scholar]
- 103.Pascale R., Onzo A., Ciriello R., Scrano L., Bufo S.A., Bianco G. Elsevier; 2020. LC/MS Based Food Metabolomics. [DOI] [Google Scholar]
- 104.Minzi O.M.S., Massele A.Y., Gustafsson L.L., Ericsson Ö. Simple and cost-effective liquid chromatographic method for determination of pyrimethamine in whole blood samples dried on filter paper. J. Chromatogr. B Anal. Technol. Biomed. Life Sci. 2005;814:179–183. doi: 10.1016/j.jchromb.2004.10.049. [DOI] [PubMed] [Google Scholar]
- 105.V Mei J., Alexander J.R., Adam B.W., Hannon W.H. Innovative non- or minimally-invasive technologies for monitoring Health and nutritional status in mothers and young children use of filter paper for the collection and analysis of human whole blood specimens 1. J. Nutr. 2001;131:1631–1636. doi: 10.1093/jn/131.5.1631S. [DOI] [PubMed] [Google Scholar]
- 106.van Kampen J.J.A., Reedijk M.L., Burgers P.C., Dekker L.J.M., Hartwig N.G., van der Ende I.E., de Groot R., Osterhaus A.D.M.E., Burger D.M., Luider T.M., Gruters R.A. Ultra-fast analysis of plasma and intracellular levels of HIV protease inhibitors in children: a clinical application of MALDI mass spectrometry. PloS One. 2010;5:1–9. doi: 10.1371/journal.pone.0011409. [DOI] [PMC free article] [PubMed] [Google Scholar]
- 107.Meesters R.J.W., Van Kampen J.J.A., Scheuer R.D., Van Der Ende M.E., Gruters R.A., Luider T.M. Determination of the antiretroviral drug tenofovir in plasma from HIV-infected adults by ultrafast isotope dilution MALDI-triple quadrupole tandem mass spectrometry. J. Mass Spectrom. 2011;46:282–289. doi: 10.1002/jms.1897. [DOI] [PubMed] [Google Scholar]
- 108.Bokhart M.T., Rosen E., Thompson C., Sykes C., Kashuba A.D.M., Muddiman D.C. Quantitative mass spectrometry imaging of emtricitabine in cervical tissue model using infrared matrix-assisted laser desorption electrospray ionization. Anal. Bioanal. Chem. 2015;407:2073–2084. doi: 10.1007/s00216-014-8220-y. [DOI] [PMC free article] [PubMed] [Google Scholar]
- 109.Tran T., Chakraborty A., Xi X., Bohets H., Cornett C., Tsinman K., Rades T., Müllertz A. Using potentiometric free drug sensors to determine the free concentration of ionizable drugs in colloidal systems. J. Pharmacol. Sci. 2018;107:103–112. doi: 10.1016/j.xphs.2017.05.016. [DOI] [PubMed] [Google Scholar]
- 110.Kamel A.H., Almeida S.A.A., Sales M.G.F., Moreira F.T.C. Sulfadiazine-potentiometric sensors for flow and batch determinations of sulfadiazine in drugs and biological fluids. Anal. Sci. 2009;25:365–371. doi: 10.2116/analsci.25.365. [DOI] [PubMed] [Google Scholar]
- 111.Bakker E., Pretsch E. Potentiometric sensors for trace-level analysis. TrAC Trends Anal. Chem. (Reference Ed.) 2005;24:199–207. doi: 10.1016/j.trac.2005.01.003. [DOI] [PMC free article] [PubMed] [Google Scholar]
- 112.Gouda A.A., Kotb El-Sayed M.I., Amin A.S., El Sheikh R. Spectrophotometric and spectrofluorometric methods for the determination of non-steroidal anti-inflammatory drugs: a review. Arab. J. Chem. 2013;6:145–163. doi: 10.1016/j.arabjc.2010.12.006. [DOI] [Google Scholar]
- 113.Boone C.M., Waterval J.C.M., Lingeman H., Ensing K., Underberg W.J.M. Capillary electrophoresis as a versatile tool for the bioanalysis of drugs - a review. J. Pharmaceut. Biomed. Anal. 1999;20:831–863. doi: 10.1016/S0731-7085(99)00088-6. [DOI] [PubMed] [Google Scholar]
- 114.Youssef A.A., Magdy N., Hussein L.A., El-Kosasy A.M. Validated RP-HPLC method for simultaneous determination of ribavirin, sofosbuvir and daclatasvir in human plasma: a treatment protocol administered to HCV patients in Egypt. J. Chromatogr. Sci. 2019;57:636–643. doi: 10.1093/chromsci/bmz038. [DOI] [PubMed] [Google Scholar]
- 115.Phani R.S.C.H., Prasad K.R.S., Mallu U.R. New analytical HPLC method development and validation for the simultaneous quantification of paritaprevir ombitasvir and ritonavirin spiked human plasma. Orient. J. Chem. 2017;33:2363–2369. doi: 10.13005/ojc/330528. [DOI] [Google Scholar]
- 116.Ravi P.R., Joseph S., Avula U.S.R., Anthireddy S. A simple liquid chromatographic method for the determination of tenofovir in rat plasma and its application to pharmacokinetic studies. Acta Chromatogr. 2015;27:597–612. doi: 10.1556/AChrom.27.2015.4.2. [DOI] [Google Scholar]
- 117.D'Avolio A., De Nicolò A., Simiele M., Turini S., Agnesod D., Boglione L., Cusato J., Baietto L., Cariti G., Calcagno A., Sciandra M., Di Perri G., Bonora S. Development and validation of a useful HPLC-UV method for quantification of total and phosphorylated-ribavirin in blood and erythrocytes of HCV+ patients. J. Pharmaceut. Biomed. Anal. 2012;66:376–380. doi: 10.1016/j.jpba.2012.03.030. [DOI] [PubMed] [Google Scholar]
- 118.Sutar S.V., More H.N., Pishawikar S.A., Bandgar S.A., Raut I.D. Validated RP-HPLC method development for estimation of Tenofovir Disoproxil Fumarate from plasma. Res. J. Pharm. Technol. 2011;4:1626–1629. [Google Scholar]
- 119.Crawford K.W., Spritzler J., Kalayjian R.C., Parsons T., Landay A., Pollard R., Stocker V., Lederman M.M., Flexner C. Age-related changes in plasma concentrations of the HIV protease inhibitor lopinavir. AIDS Res. Hum. Retrovir. 2010;26:635–643. doi: 10.1089/aid.2009.0154. [DOI] [PMC free article] [PubMed] [Google Scholar]
- 120.Lemasson E., Bertin S., Hennig P., Lesellier E., West C. Impurity profiling of drug candidates: analytical strategies using reversed-phase and mixed-mode high-performance liquid chromatography methods. J. Chromatogr., A. 2018;1535:101–113. doi: 10.1016/j.chroma.2018.01.014. [DOI] [PubMed] [Google Scholar]
- 121.Loregian A., Gatti R., Palu G., F D.P.E. Separation methods for acyclovir and related antiviral compounds. J. Chromatogr. B. 2001;764:289–311. doi: 10.1016/S0378-4347(01)00319-X. [DOI] [PubMed] [Google Scholar]
- 122.Das Gupta V., Mathew M., Division P. Effect of mobile phase pH on the separation of drugs using high-performance liquid chromatography. Drug Dev. Ind. Pharm. 1995;21:833–837. [Google Scholar]
- 123.Wong A.L.A., Xiang X., Ong P.S., Mitchell E.Q.Y., Syn N., Wee I., Kumar A.P., Yong W.P., Sethi G., Goh B.C., Ho P.C.L., Wang L. A review on liquid chromatography-tandem mass spectrometry methods for rapid quantification of oncology drugs. Pharmaceutics. 2018;10:1–20. doi: 10.3390/pharmaceutics10040221. [DOI] [PMC free article] [PubMed] [Google Scholar]
- 124.Peris-vicente J., Casas-breva I., Carda-broch S., Esteve-romero J. Use of micellar liquid chromatography to analyze darunavir , ritonavir , emtricitabine , and tenofovir in plasma. J. Separ. Sci. 2014:2825–2832. doi: 10.1002/jssc.201400574. [DOI] [PubMed] [Google Scholar]
- 125.DeLuccia F.J., Arunyanart M., Love L.J.C. Direct serum injection with micellar liquid chromatography for therapeutic drug monitoring. Anal. Chem. 1985;57:1564–1568. doi: 10.1021/ac00285a015. [DOI] [PubMed] [Google Scholar]
- 126.Shin B.S., Hong S.H., Kim H.J., Yoon H.S., Kim D.J., Hwang S.W., Lee J.B., Yoo S.D. Development of a sensitive LC assay with fluorescence detection for the determination of zearalenone in rat serum. Chromatographia. 2009;69:295–299. doi: 10.1365/s10337-008-0871-4. [DOI] [Google Scholar]
- 127.Bianco G., Novario G., Anzilotta G., Palma A., Mangone A., Cataldi T.R.I. Polybrominated diphenyl ethers (PBDEs) in Mediterranean mussels (Mytilus galloprovincialis) from selected Apulia coastal sites evaluated by GC-HRMS. J. Mass Spectrom. 2010;45:1046–1055. doi: 10.1002/jms.1799. [DOI] [PubMed] [Google Scholar]
- 128.Bianco G., Pascale R., Carbone C.F., Acquavia M.A., Cataldi T.R.I., Schmitt-Kopplin P., Buchicchio A., Russo D., Milella L. Determination of soyasaponins in Fagioli di Sarconi beans (Phaseolus vulgaris L.) by LC-ESI-FTICR-MS and evaluation of their hypoglycemic activity. Anal. Bioanal. Chem. 2018;410:1561–1569. doi: 10.1007/s00216-017-0806-8. [DOI] [PubMed] [Google Scholar]
- 129.Cohen L.H., Gusev A.I. Small molecule analysis by MALDI mass spectrometry. Anal. Bioanal. Chem. 2002:571–586. doi: 10.1007/s00216-002-1321-z. [DOI] [PubMed] [Google Scholar]
- 130.Pascale R., Bianco G., Coviello D., Cristina Lafiosca M., Masi S., Mancini I.M., Bufo S.A., Scrano L., Caniani D. Validation of a liquid chromatography coupled with tandem mass spectrometry method for the determination of drugs in wastewater using a three-phase solvent system. J. Separ. Sci. 2020;43:886–895. doi: 10.1002/jssc.201900509. [DOI] [PubMed] [Google Scholar]
- 131.Drexler D.M., Garrett T.J., Cantone J.L., Diters R.W., Mitroka J.G., Prieto Conaway M.C., Adams S.P., Yost R.A., Sanders M. Utility of imaging mass spectrometry (IMS) by matrix-assisted laser desorption ionization (MALDI) on an ion trap mass spectrometer in the analysis of drugs and metabolites in biological tissues. J. Pharmacol. Toxicol. Methods. 2007;55:279–288. doi: 10.1016/j.vascn.2006.11.004. [DOI] [PubMed] [Google Scholar]
- 132.Liigand P., Kaupmees K., Haav K., Liigand J., Leito I., Girod M., Antoine R., Kruve A. Think negative: finding the best electrospray ionization/MS mode for your analyte. Anal. Chem. 2017;89:5665–5668. doi: 10.1021/acs.analchem.7b00096. [DOI] [PubMed] [Google Scholar]
- 133.Pascale R., Bianco G., Cataldi T.R.I., Buchicchio A., Losito I., Altieri G., Genovese F., Tauriello A., Di Renzo G.C., Lafiosca M.C. Investigation of the effects of virgin olive oil cleaning systems on the secoiridoid aglycone content using high performance liquid chromatography–mass spectrometry. JAOCS, J. Am. Oil Chem. Soc. 2018;95:665–671. doi: 10.1002/aocs.12072. [DOI] [Google Scholar]
- 134.El-Aneed A., Cohen A., Banoub J. Mass spectrometry, review of the basics: electrospray, MALDI, and commonly used mass analyzers. Appl. Spectrosc. Rev. 2009;44:210–230. doi: 10.1080/05704920902717872. [DOI] [Google Scholar]
- 135.Pitt J.J. Principles and applications of liquid chromatography-mass spectrometry in clinical biochemistry. Clin. Biochem. Rev. 2009;30:19–34. [PMC free article] [PubMed] [Google Scholar]
- 136.Ding X., Ghobarah H., Zhang X., Jaochico A., Liu X., Deshmukh G., Liederer B.M., Hop C.E.C.A., Dean B. High-throughput liquid chromatography/mass spectrometry method for the quantitation of small molecules using accurate mass technologies in supporting discovery drug screening. Rapid Commun. Mass Spectrom. 2013;27:401–408. doi: 10.1002/rcm.6461. [DOI] [PubMed] [Google Scholar]
- 137.Chernushevich I.V., Loboda A.V., Thomson B.A. An introduction to quadrupole-time-of-flight mass spectrometry. J. Mass Spectrom. 2001;36:849–865. doi: 10.1002/jms.207. [DOI] [PubMed] [Google Scholar]
- 138.Das Mishra T., Kurani H., Singhal P., Shrivastav P.S. Simultaneous quantitation of HIV-protease inhibitors ritonavir, lopinavir and indinavir in human plasma by UPLC-ESI-MS-MS. J. Chromatogr. Sci. 2012;50:625–635. doi: 10.1093/chromsci/bms048. [DOI] [PubMed] [Google Scholar]
- 139.Niessen W.M.A. Tandem mass spectrometry of small-molecule antiviral drugs: 3. antiviral agents against herpes, influenza and other viral infections. Int. J. Mass Spectrom. 2020;455:1–12. doi: 10.1016/j.ijms.2020.116377. [DOI] [PMC free article] [PubMed] [Google Scholar]
- 140.Yadav M., Singhal P., Goswami S., Pande U.C., Sanyal M., Shrivastav P.S. Selective determination of antiretroviral agents tenofovir, emtricitabine, and lamivudine in human plasma by a LC-MS-MS method for a bioequivalence study in healthy Indian subjects. J. Chromatogr. Sci. 2010;48:704–713. doi: 10.1093/chromsci/48.9.704. [DOI] [PubMed] [Google Scholar]
- 141.Lin C.C., Yeh L.T., Lau J.Y.N. Specific, sensitive and accurate liquid chromatographic-tandem mass spectrometric method for the measurement of ribavirin in rat and monkey plasma. J. Chromatogr. B Anal. Technol. Biomed. Life Sci. 2002;779:241–248. doi: 10.1016/S1570-0232(02)00379-3. [DOI] [PubMed] [Google Scholar]
- 142.Murray K.K., Boyd R.K., Eberlin M.N., Langley G.J., Li L., Naito Y. Standard definitions of terms related to mass spectrometry. Chem. Int. -- Newsmag. IUPAC. 2014;26:1515–1609. doi: 10.1515/ci.2004.26.3.23a. [DOI] [Google Scholar]
- 143.Kruve A., Rebane R., Kipper K., Oldekop M.L., Evard H., Herodes K., Ravio P., Leito I. Tutorial review on validation of liquid chromatography-mass spectrometry methods: Part I. Anal. Chim. Acta. 2015;870:29–44. doi: 10.1016/j.aca.2015.02.017. [DOI] [PubMed] [Google Scholar]
- 144.Porta T., Lesur A., Varesio E., Hopfgartner G. Quantification in MALDI-MS imaging: what can we learn from MALDI-selected reaction monitoring and what can we expect for imaging? Anal. Bioanal. Chem. 2015;407:2177–2187. doi: 10.1007/s00216-014-8315-5. [DOI] [PubMed] [Google Scholar]
- 145.Shanta S.R., Kim T.Y., Hong J.H., Lee J.H., Shin C.Y., Kim K.H., Kim Y.H., Kim S.K., Kim K.P. A new combination MALDI matrix for small molecule analysis: application to imaging mass spectrometry for drugs and metabolites. Analyst. 2012;137:5757–5762. doi: 10.1039/c2an35782h. [DOI] [PubMed] [Google Scholar]
- 146.Robichaud G., Barry J.A., Muddiman D.C. IR-MALDESI mass spectrometry imaging of biological tissue sections using ice as a matrix. J. Am. Soc. Mass Spectrom. 2014;25:319–328. doi: 10.1007/s13361-013-0787-6. [DOI] [PMC free article] [PubMed] [Google Scholar]
- 147.Bhuket P.R.N., Teerawonganan P., Yoosakul E., Supasena W., Watananikorn C., Chuasuwan B., Narakorn P., Techatanawat I., Pitisuttithum P. Validation of liquid chromatography-tandem mass spectrometric method for simultaneous determination of lopinavir and ritonavir in human plasma, and its application in a bioequivalescence study in Thai volunteers. J. Heal. Res. 2015;29:417–424. doi: 10.14456/jhr.2015.34. [DOI] [Google Scholar]
- 148.Ferreiros N., Labocha S., El-Duweik J., Schlecker C., Lotsch J., Geisslinger G. Quantitation of ribavirin in human plasma and red blood cells using LC – MS/MS. J. Separ. Sci. 2014:476–483. doi: 10.1002/jssc.201301173. [DOI] [PubMed] [Google Scholar]
- 149.Ventura G., Calvano C.D., Losito I., Bianco G., Pascale R., Palmisano F., Cataldi T.R.I. Effect of pH and mobile phase additives on the chromatographic behaviour of an amide-embedded stationary phase: cyanocobalamin and its diaminemonochloro-platinum(II) conjugate as a case study. J. Separ. Sci. 2019;42:1155–1162. doi: 10.1002/jssc.201801060. [DOI] [PubMed] [Google Scholar]
- 150.Rainville P.D., Smith N.W., Cowan D., Plumb R.S. Comprehensive investigation of the influence of acidic, basic, and organic mobile phase compositions on bioanalytical assay sensitivity in positive ESI mode LC/MS/MS. J. Pharmaceut. Biomed. Anal. 2012;59:138–150. doi: 10.1016/j.jpba.2011.10.021. [DOI] [PubMed] [Google Scholar]
- 151.Dams R., Huestis M.A., Lambert W.E., Murphy C.M. Matrix effect in bio-analysis of illicit drugs with LC-MS/MS: influence of ionization type, sample preparation, and biofluid. J. Am. Soc. Mass Spectrom. 2003;14:1290–1294. doi: 10.1016/S1044-0305(03)00574-9. [DOI] [PubMed] [Google Scholar]
- 152.Mei H., Hsieh Y., Nardo C., Xu X., Wang S., Ng K., Korfmacher W.A. Investigation of matrix effects in bioanalytical high-performance liquid chromatography/tandem mass spectrometric assays: application to drug discovery. Rapid Commun. Mass Spectrom. 2003;17:97–103. doi: 10.1002/rcm.876. [DOI] [PubMed] [Google Scholar]
- 153.Fekete S., Schappler J., Veuthey J.L., Guillarme D. Current and future trends in UHPLC. TrAC Trends Anal. Chem. (Reference Ed.) 2014;63:2–13. doi: 10.1016/j.trac.2014.08.007. [DOI] [Google Scholar]
- 154.Farouk F., Wahba D., Mogawer S., Elkholy S., Elmeligui A., Abdelghani R., Ibahim S. Development and validation of a new LC–MS/MS analytical method for direct-acting antivirals and its application in end-stage renal disease patients. Eur. J. Drug Metab. Pharmacokinet. 2020;45:89–99. doi: 10.1007/s13318-019-00584-6. [DOI] [PubMed] [Google Scholar]
- 155.Hummert P., Parsons T.L., Ensign L.M., Hoang T., Marzinke M.A. Validation and implementation of liquid chromatographic-mass spectrometric (LC–MS) methods for the quantification of tenofovir prodrugs. J. Pharmaceut. Biomed. Anal. 2018;152:248–256. doi: 10.1016/j.jpba.2018.02.011. [DOI] [PMC free article] [PubMed] [Google Scholar]
- 156.Wu Y., Yang J., Duan C., Chu L., Chen S., Qiao S., Li X., Deng H. Simultaneous determination of antiretroviral drugs in human hair with liquid chromatography-electrospray ionization-tandem mass spectrometry. J. Chromatogr. B Anal. Technol. Biomed. Life Sci. 2018;1083:209–221. doi: 10.1016/j.jchromb.2018.03.021. [DOI] [PMC free article] [PubMed] [Google Scholar]
- 157.Prathipati P.K., Mandal S., Destache C.J. Simultaneous quantification of tenofovir, emtricitabine, rilpivirine, elvitegravir and dolutegravir in mouse biological matrices by LC–MS/MS and its application to a pharmacokinetic study. J. Pharmaceut. Biomed. Anal. 2016;129:473–481. doi: 10.1016/j.jpba.2016.07.040. [DOI] [PMC free article] [PubMed] [Google Scholar]
- 158.Xiao Q., Wang D., Yang W., Chen L., Ding Y., Yang J. Simultaneous determination of pradefovir, PMEA and tenofovir in HBV patient serum using liquid chromatography-tandem mass spectrometry and application to phase 2 clinical trial. J. Chromatogr. B Anal. Technol. Biomed. Life Sci. 2016;1022:133–140. doi: 10.1016/j.jchromb.2016.04.019. [DOI] [PubMed] [Google Scholar]
- 159.Reddy A.V.B., Jaafar J., Bin Aris A., Majid Z.A., Umar K., Talib J., Madhavi G. Development and validation of a rapid ultra high performance liquid chromatography with tandem mass spectrometry method for the simultaneous determination of darunavir, ritonavir, and tenofovir in human plasma: application to human pharmacokinetics. J. Separ. Sci. 2015;38:2580–2587. doi: 10.1002/jssc.201500250. [DOI] [PubMed] [Google Scholar]
- 160.Shi X., Zhu D., Lou J., Zhu B., rong Hu A., Gan D. Evaluation of a rapid method for the simultaneous quantification of ribavirin, sofosbuvir and its metabolite in rat plasma by UPLC-MS/MS. J. Chromatogr. B Anal. Technol. Biomed. Life Sci. 2015;1002:353–357. doi: 10.1016/j.jchromb.2015.08.038. [DOI] [PubMed] [Google Scholar]
- 161.Mishra T., Shrivastav P.S. Validation of simultaneous quantitative method of HIV protease inhibitors atazanavir, darunavir and ritonavir in human plasma by UPLC-MS/MS. Sci. World J. 2014;2014:1–12. doi: 10.1155/2014/482693. [DOI] [PMC free article] [PubMed] [Google Scholar]
- 162.Matta M.K., Burugula L., Pilli N.R., Inamadugu J.K., Jvln S.R. A novel LC-MS/MS method for simultaneous quantification of tenofovir and lamivudine in human plasma and its application to a pharmacokinetic study. Biomed. Chromatogr. 2012;26:1202–1209. doi: 10.1002/bmc.2679. [DOI] [PubMed] [Google Scholar]
- 163.Danso D., Langman L.J., Snozek C.L.H. LC-MS/MS quantitation of ribavirin in serum and identification of endogenous isobaric interferences. Clin. Chim. Acta. 2011;412:2332–2335. doi: 10.1016/j.cca.2011.07.016. [DOI] [PubMed] [Google Scholar]
- 164.Uo J.G., Eng F.M., Li L.I., Hong B.Z., Hao Y.Z. Development and validation of an LC/MS/MS method for the determination of tenofovir in monkey. Plasma. 2011;34:877–882. doi: 10.1248/bpb.34.877. [DOI] [PubMed] [Google Scholar]
- 165.Vats R., Murthy A.N., Ravi P.R. Simple, rapid and validated LC determination of lopinavir in rat plasma and its application in pharmacokinetic studies. Sci. Pharm. 2011;79:849–863. doi: 10.3797/scipharm.1107-24. [DOI] [PMC free article] [PubMed] [Google Scholar]
- 166.Choi S.O., Rezk N., Kim J.S., Kashuba A.D.M. Development of an LC-MS method for measuring TNF in human vaginal tissue. J. Chromatogr. Sci. 2010;48:219–223. doi: 10.1093/chromsci/48.3.219. [DOI] [PMC free article] [PubMed] [Google Scholar]
- 167.Damaramadugu R., Inamadugu J., Kanneti R., Polagani S., Ponneri V. Simultaneous determination of ritonavir and lopinavir in human plasma after protein precipitation and LC-MS-MS. Chromatographia. 2010;71:815–824. doi: 10.1365/s10337-010-1550-9. [DOI] [Google Scholar]
- 168.Jansen R.S., Rosing H., Kromdijk W., ter Heine R., Schellens J.H., Beijnen J.H. Simultaneous quantification of emtricitabine and tenofovir nucleotides in peripheral blood mononuclear cells using weak anion-exchange liquid chromatography coupled with tandem mass spectrometry. J. Chromatogr. B Anal. Technol. Biomed. Life Sci. 2010;878:621–627. doi: 10.1016/j.jchromb.2010.01.002. [DOI] [PubMed] [Google Scholar]
Associated Data
This section collects any data citations, data availability statements, or supplementary materials included in this article.