

Key Points
Question
What are the associations of age, calendar period of diagnosis, and birth cohort with the increasing incidence of Merkel cell carcinoma (MCC), and how can they inform projected incidence rates?
Findings
This cross-sectional study of 3720 patients with MCC found that, although birth cohort effects continue to increase over time, the effect owing to period of diagnosis has started to plateau. The projected incidence rate is estimated to be 3023 new cases of MCC in 2020.
Meaning
The initial increase found in this cross-sectional study in the incidence of MCC was likely owing in part to increased detection (period effect), but the continued increase will likely be associated with changes in risk factors (birth cohort effects) and the aging population (age effects).
Abstract
Importance
Merkel cell carcinoma is an aggressive, cutaneous, neuroendocrine cancer that is increasing in incidence. Understanding why the incidence of Merkel cell carcinoma is increasing through underlying factors, such as age effects, calendar period of diagnosis effects, and birth cohort effects, can help guide resource allocation and design of screening programs.
Objectives
To evaluate the associations of patient age, calendar period of diagnosis, and birth cohort with the increasing incidence of Merkel cell carcinoma and to provide new incidence projections to 2030.
Design, Setting, and Participants
A cross-sectional retrospective study with age-period-cohort analysis and incidence projection modeling using data from the Surveillance, Epidemiology, and End Results Program database of 9 registries from 1987 to 2016 was conducted among 3720 patients with Merkel cell carcinoma. Statistical analysis was conducted from October 20, 2019, to July 29, 2020.
Exposures
Age effects (ie, physiology), period of diagnosis effects (ie, changes in diagnostics and clinical awareness), and birth cohort effects (ie, environmental risk factors) over time were assessed.
Main Outcomes and Measures
Incidence rates of Merkel cell carcinoma.
Results
Among the 3720 patients in the study (2200 male patients [59.1%]; median age, 77 years [interquartile range, 68-84 years]), during the period from 2012 to 2016, the age-adjusted Merkel cell carcinoma incidence rate was 0.66 per 100 000 (95% CI, 0.62-0.70), which represented a 3.5-times (95% CI, 3.0-4.2) increase from 1987 to 1991. The incidence of Merkel cell carcinoma increased with patient age across calendar periods and birth cohorts; the highest incidence rate was observed for those aged 85 years or older, with an age-adjusted rate from 2012 to 2016 of 14.6 per 100 000 for men and 5.5 per 100 000 for women. Although the birth cohort effect has continued to increase over time, the calendar period of diagnosis effect has started to plateau. It is projected that there will be 3023 new cases of Merkel cell carcinoma in 2020 and 5130 new cases in 2030, increased from an estimated 1933 cases in 2010.
Conclusions and Relevance
The slowing down of the period effect (ie, changes in diagnostics and awareness) found in this longitudinal cohort study suggests that part of the initial increased incidence of Merkel cell carcinoma was associated with increased detection. However, the projected increase in incidence rate is likely associated with the aging population and increasing risk factor exposure in more recent birth cohorts.
This cross-sectional study uses data from the Surveillance, Epidemiology, and End Results Program to evaluate the associations of patient age, calendar period of diagnosis, and birth cohort with the increasing incidence of Merkel cell carcinoma and provide new incidence projections to 2030.
Introduction
Merkel cell carcinoma (MCC) is an aggressive, cutaneous, neuroendocrine neoplasm that was first described as trabecular carcinoma in 19721 but later became known as MCC in 1985.2 The incidence of MCC has been increasing in the US and around the world.3,4,5,6,7,8,9 Between 2000 and 2013, the incidence of MCC increased from 0.5 to 0.7 cases per 100 000.10 In 2020, there are expected to be 2488 new cases in the US, which is projected to increase to 3284 in the year 2025 as the population ages.10 Potential reasons for the increased incidence are associated with increased detection of MCC since the development of cytokeratin-20 immunohistochemistry in 1992,11 population changes with regard to known risk factors, and increased awareness of the disease.
Risk factors for the development of MCC include increased age, UV radiation exposure, immunosuppressed status, and presence of Merkel cell polyomavirus.5,11,12,13,14 Patients are more likely to develop MCC after a diagnosis of HIV,15 chronic lymphocytic leukemia, Hodgkin lymphoma, or non-Hodgkin lymphoma and after a solid organ transplant.12,16 In addition to these immunosuppressant diseases, increasing age is highly associated with MCC incidence rates.10
The pathogenesis of MCC likely involves 2 non–mutually exclusive pathways: viral-induced and UV radiation–induced DNA damage. First, Merkel cell polyomavirus has been shown to be a key factor in the pathogenesis of the disease since its discovery in 2008.13 The role of Merkel cell polyomavirus became apparent when its DNA was identified in approximately 80% of MCC cases.13 Nonetheless, UV radiation–induced damage is believed to be another key factor in MCC pathogenesis. This evidence comes from MCC being almost exclusively a disease of White patients,11 tending to affect sun-exposed regions of the body, and having a higher incidence among patients with a history of malignant melanoma and other epithelial skin cancers.5,17 This complex interplay between viral-induced and UV radiation–induced DNA damage likely allows for tumorigenesis, especially in the absence of healthy immune systems.
Although previous publications have addressed what is happening with MCC epidemiology, an understanding of why the incidence of MCC is increasing is lacking. We therefore aimed to address this question by evaluating how patient age, calendar period of diagnosis, and birth cohort interact and are associated with the incidence of MCC. An age effect refers to the associations of physiological changes of aging, independent of birth cohort and calendar time, with cancer incidence. A calendar period effect refers to an artificial association with the incidence rates due to changes in medical practice and external factors that equally affect all age groups at a particular calendar time, such as methods of diagnosis, access to medical services, and classification of disease. A cohort effect refers to changes in the risk factors that are associated with a real change in disease incidence.18 An understanding of the relative importance of each of these factors allows for more accurate knowledge and projecting of disease incidence, which may help guide public health policy, resource allocation, and design of screening programs. We evaluated the hypothesis that all 3 factors are associated with the increasing incidence of MCC using an age-period-cohort (APC) analysis, which had not been yet performed. We further tested the hypothesis that MCC incidence will continue to increase by performing projection modeling that incorporates age effects, calendar period effects, and birth cohort effects.
Methods
Patient Selection
The Surveillance, Epidemiology, and End Results Program (SEER) consisting of 9 registries was queried for data from 1987 to 2016. Patients with MCC of the skin were selected for using histology International Classification of Diseases for Oncology, Third Edition (ICD-O-3) code 8247 and ICD-O-3 codes C44.0 to C44.9. This study was deemed exempt from investigational review board review by the Yale Human Research Protection Program under 45CFR46.104 (4).
Statistical Analysis
Statistical analysis was conducted from October 20, 2019, to July 29, 2020. Age-adjusted incidence rates were calculated using the 2000 US standard population. Rate ratios with 95% CIs were calculated using the Tiwari 2006 modification in SEER*Stat, version 8.3.6 (National Cancer Institute).19
An APC analysis was performed using 5-year age intervals and period intervals, which resulted in 6 age intervals (≤64 years, 65-69 years, 70-74 years, 75-79 years, 80-84 years, and ≥85 years) and 6 period intervals (1987-1991, 1992-1996, 1997-2001, 2002-2006, 2007-2011, and 2012-2016). Birth cohort was defined using the difference between the midpoint of the age interval and period interval. The midpoint of each age, period, or cohort interval is plotted in Figure 1 and eFigures 1-6 in the Supplement. For relative rate measurements, the reference birth cohort interval was from 1922 to 1931 (the median year of birth for patients with a diagnosis of MCC), and the reference period interval was from 2007 to 2011 (the median date of MCC incidence).
Figure 1. Associations of Age, Period, and Birth Cohort With Merkel Cell Carcinoma Incidence.
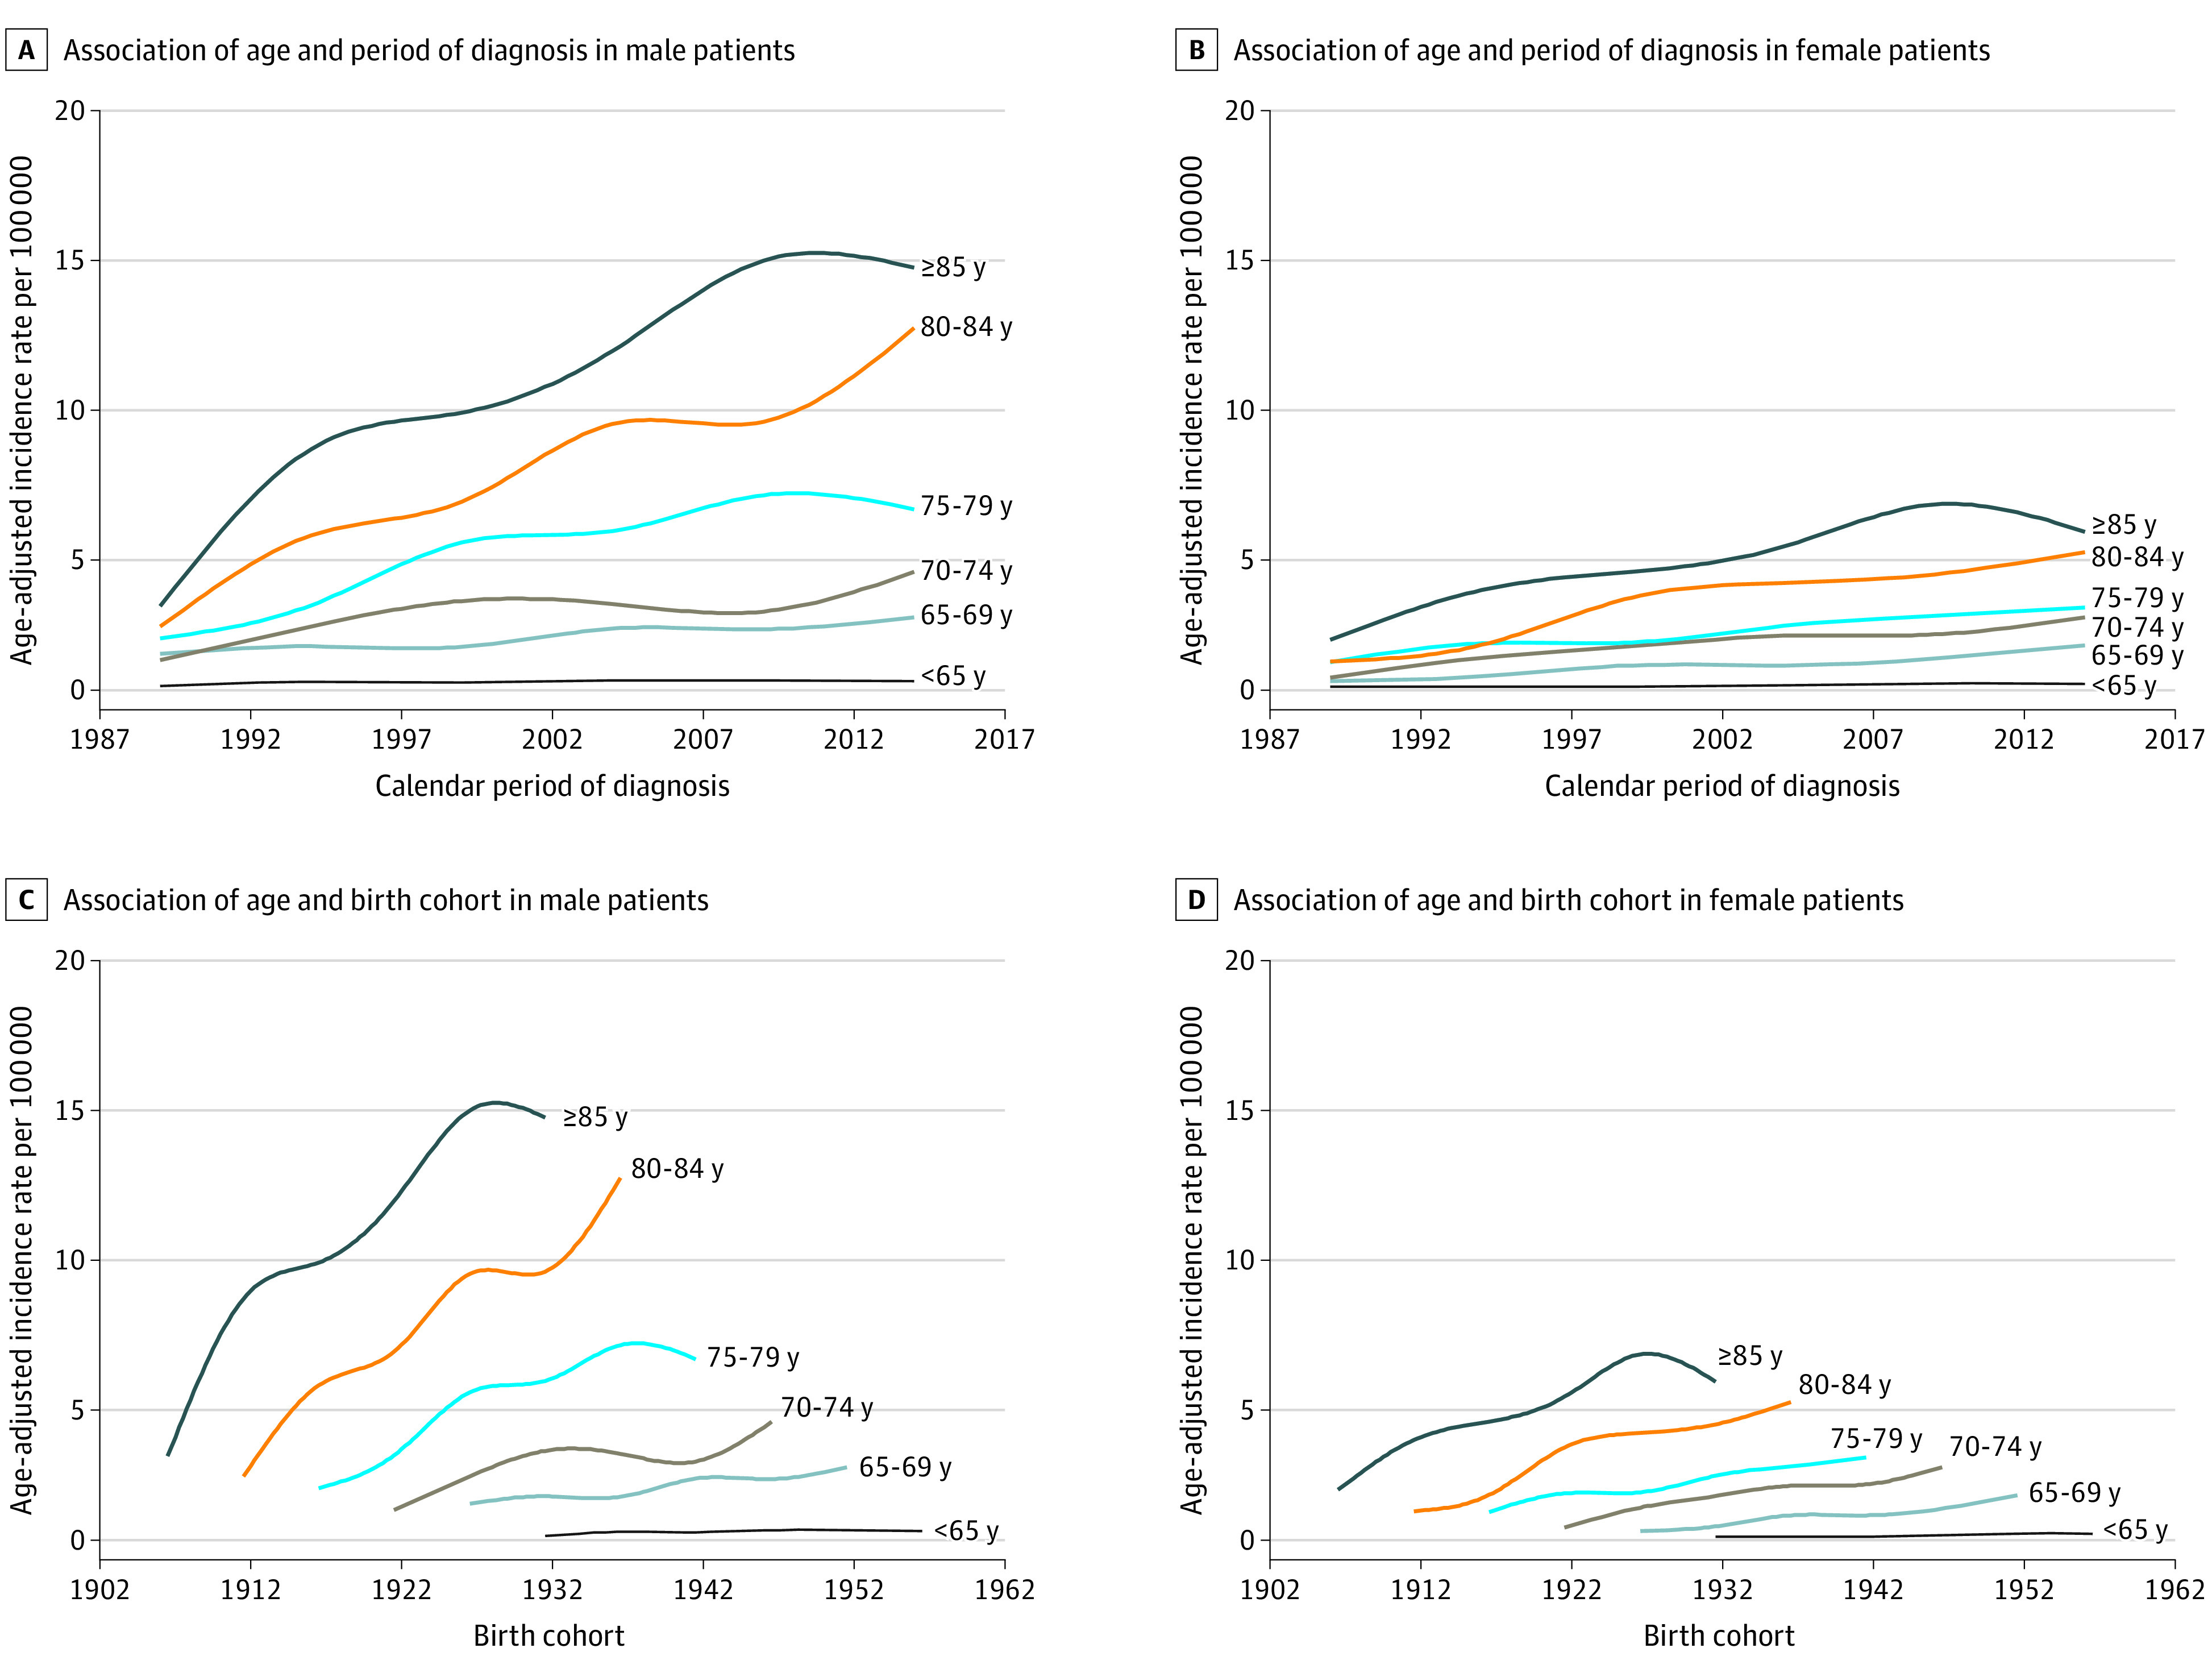
Age-period-cohort analysis for Merkel cell carcinoma (MCC). A, Associations of age and calendar period of diagnosis with MCC incidence among male patients. B, Associations of age and calendar period of diagnosis with MCC incidence among female patients. C, Associations of age and birth cohort with MCC incidence among male patients. D, Associations of age and birth cohort with MCC incidence among female patients.
Sex-specific, age-adjusted incidence rates were assessed. The APC analyses were conducted using a log-linear Poisson regression model that fitted the sex-specific, age-adjusted incidence rates to quantitatively estimate associations of age, period, and cohort with the observed trends. Owing to the nonidentifiability problem caused by the linear APC association (ie, Cohort = Period − Age), the age effects, period effects, and cohort effects are not allowed to be evaluated independently.20 Thus, the period and cohort effects were estimated by constraining the cohort and period effects, respectively, to be zero for the primary analysis. For the post hoc analysis, the cohort effect was constrained at β = 0.1, 0, or –0.1, while the period effect was constrained at β = 0.1 or 0. The period effect was not assumed to be negative because this assumption was not considered to be clinically plausible.
Future incidence was projected using the bayesian APC analysis with integrated nested Laplace approximations (eMethods in the Supplement).21 The national projected population was used for estimated population sizes in 2020 and beyond.22 All tests were 2-sided at α = .05. All CIs are 95% CIs unless otherwise stated.
Case information was exported from SEER*Stat to SAS, version 9.4 (SAS Institute Inc) and R, version 3.6.1 (R Foundation for Statistical Computing) for further statistical analysis.23 The bayesian APC analysis was performed with the R package BAPC, version 0.0.34, which built on the INLA package, version 19.12.10 to assess future cancer rates and counts within a fully bayesian inference setting (eMethods in the Supplement).21
Results
Incidence Rates and Prevalence
A total of 3720 patients (2200 male patients [59.1%]; median age, 77 years [interquartile range, 68-84 years]) were included in our analysis. The overall age-adjusted incidence rate for MCC from 2012 to 2016 was 0.66 per 100 000 (95% CI, 0.62-0.70), which represented a 3.5 (95% CI, 3.0-4.2) times increase from 1987 to 1991 (Table). In the same time period, by sex, the age-adjusted incidence rate was 0.94 per 100 000 persons (95% CI, 0.87-1.02) for men and 0.46 per 100 000 persons (95% CI, 0.42-0.51) for women, which represented a 3.6-times (95% CI, 2.9-4.5) increase in the age-adjusted incidence rate for men and a 3.3-times (95% CI, 2.6-4.3) increase in the age-adjusted incidence rate for women since the first cohort analyzed (1987-1991).
Table. Change in Merkel Cell Carcinoma Incidence Rates Over Time.
| Variable | Rate (95% CI) | Rate ratio (95% CI) | |
|---|---|---|---|
| 1987-1991a | 2012-2016a | ||
| Overall | 0.19 (0.16-0.21) | 0.66 (0.62-0.70) | 3.5 (3.0-4.2) |
| Sex | |||
| Male | 0.26 (0.21-0.32) | 0.94 (0.87-1.02) | 3.6 (2.9-4.5) |
| Female | 0.14 (0.11-0.17) | 0.46 (0.42-0.51) | 3.3 (2.6-4.3) |
| Race/ethnicity | |||
| White | 0.21 (0.18-0.24) | 0.78 (0.73-0.83) | 3.8 (3.2-4.5) |
| Black | 0.006 (<0.001-0.046) | 0.14 (0.081-0.22) | 24.0 (2.6-980.0) |
| Native American or Asian | 0.094 (0.037-0.19) | 0.21 (0.15-0.29) | 2.3 (1.0-6.2) |
| SEER registry | |||
| San Francisco, California | 0.21 (0.15-0.29) | 0.63 (0.53-0.74) | 3.0 (2.0-4.4) |
| Connecticut | 0.24 (0.17-0.33) | 0.64 (0.54-0.76) | 2.7 (1.9-4.0) |
| Detroit, Michigan | 0.13 (0.08-0.20) | 0.62 (0.52-0.74) | 4.6 (2.9-7.7) |
| Hawaii | 0.23 (0.11-0.42) | 0.42 (0.30-0.59) | 1.8 (0.9-4.1)b |
| Iowa | 0.15 (0.10-0.23) | 0.74 (0.62-0.87) | 4.8 (3.1-7.8) |
| New Mexico | 0.21 (0.11-0.36) | 0.64 (0.50-0.80) | 3.1 (1.7-6.3) |
| Seattle, Washington (Puget Sound) | 0.21 (0.14-0.30) | 0.79 (0.68-0.91) | 3.8 (2.6-5.9) |
| Utah | 0.19 (0.10-0.35) | 0.73 (0.58-0.91) | 3.8 (2.0-8.0) |
| Atlanta, Georgia | 0.11 (0.04-0.22) | 0.58 (0.45-0.72) | 5.4 (2.5-15.0) |
| Primary site | |||
| Head and neck | 0.080 (0.063-0.099) | 0.269 (0.244-0.296) | 3.4 (2.7-4.4) |
| Trunk | 0.030 (0.020-0.042) | 0.060 (0.049-0.073) | 2.0 (1.3-3.2) |
| Extremities | 0.070 (0.055-0.088) | 0.269 (0.244-0.296) | 3.8 (3.0-5.0) |
| Overlapping or NOS | 0.006 (0.003-0.013) | 0.058 (0.047-0.072) | 9.1 (4.2-24) |
| Disease stage | |||
| Localized | 0.084 (0.067-0.100) | 0.213 (0.191-0.237) | 2.5 (2.0-3.3) |
| Regional | 0.061 (0.047-0.078) | 0.231 (0.208-0.256) | 3.8 (2.9-5.0) |
| Distant | 0.012 (0.006-0.020) | 0.044 (0.034-0.056) | 3.8 (2.1-7.8) |
| Unstaged | 0.029 (0.020-0.042) | 0.031 (0.023-0.042) | 1.1 (0.7-1.8)b |
Abbreviations: NOS, not otherwise specified; SEER, Surveillance, Epidemiology, and End Results Program.
Incidence rates are per 100 000 persons and are age adjusted.
Rate ratios are not statistically significantly different from rate ratio = 1 at α = .05.
We also analyzed the distribution of MCC incidence by race/ethnicity, geographical location, primary site, and disease stage (Table). Merkel cell carcinoma was more common in White populations than in Black, Native American, or Asian populations. In Black populations, MCC incidence increased from 0.006 to 0.14 per 100 000 persons (rate ratio, 24.0; 95% CI, 2.6-980.0) from 1987-1991 to 2012-2016. By geographical location, the Seattle, Washington (Puget Sound), and Iowa registries reported higher MCC rates (Seattle, 0.79 per 100 000 persons; 95% CI, 0.68-0.91; Iowa, 0.74 per 100 000 persons; 95% CI, 0.62-0.87) compared with the Hawaii registry (0.42 per 100 000 persons; 95% CI, 0.30-0.59). Tumors of the head and neck and extremities were more common than tumors of the trunk, and localized and regional disease was more common than distant disease (Table). There was no statistically significant difference in the rates of localized and regional disease from 2012 to 2016 (localized disease, 0.21; 95% CI, 0.19-0.24; regional disease, 0.23; 95% CI, 0.21-0.26; P = .76). Rates of increase were similar across sex, race/ethnicity, geographical location, primary site, and disease stage at an overall rate increase of 3.5 times (95% CI, 3.0-4.2) from 1987-1991 to 2012-2016 (Table). The only exceptions were no statistically significant increases in the Hawaii registry (rate ratio, 1.8; 95% CI, 0.9-4.1) or in the rate of unstaged tumors (rate ratio, 1.1; 95% CI, 0.7-1.8) from 1987-1991 to 2012-2016.
APC Analysis
An APC analysis was next performed (eFigure 1 in the Supplement). The association of age with MCC incidence was first analyzed. Across calendar periods (Figure 1A and B) and birth cohorts (Figure 1C and D), for men and women, the age-adjusted incidence rate of MCC increased with patient age. The highest incidence rate was consistently among those aged 85 years or older, with an age-adjusted rate from 2012 to 2016 of 14.6 per 100 000 for men and 5.5 per 100 000 for women. These rates are increased from 2.9 per 100 000 for men and 1.7 per 100 000 for women during the period from 1987 to 1991.
Across calendar periods, temporal fluctuations were present, but the incidence rate increased across all age groups (Figure 1A and B). To account for these fluctuations and to address colinearity intrinsic in an APC analysis, relative rate ratios were calculated for period effects while constraining the cohort effects to be 0 (relative rate ratio of 1) (eFigure 2A and 2B in the Supplement). That is, we assumed no change in exposure to risk factors over time (ie, birth cohort effect of 0) to assess the association of changes in disease detection over time (ie, period effect) with MCC incidence. For both men and women (eFigure 2A and 2B in the Supplement, respectively), we found an increase in incidence rate across age. Furthermore, the period effect, as measured by a relative rate with the 2007-2011 period interval as reference, increased between 1987-1991 (relative rate ratio, 0.43; 95% CI, 0.35-0.54 among male patients) and 1992-1996 (relative rate ratio, 0.63; 95% CI, 0.54-0.73 among male patients) (eFigure 2A and 2B in the Supplement). However, since the 1997-2001 period interval (relative rate ratio, 0.86; 95% CI, 0.74-0.99 in male patients), the rate of increase has started to slow (relative rate ratio, 1.16; 95% CI, 1.03-1.31 among male patients in 2012-2016).
We next evaluated the association of birth cohort with MCC incidence (ie, birth cohort effect). Similar to the period effects, there is an overall trend toward increasing incidence with each subsequent birth cohort, with fluctuations apparent over short intervals (Figure 1C and D). Period effects were subsequently constrained at 0 (relative rate ratio of 1), and the age effects and birth cohort effects were independently analyzed (eFigure 2C and 2D in the Supplement). That is, we assumed no change in factors associated with disease detection over time (ie, period effect of 0) to assess the association of changes in exposure to risk factors over time (ie, birth cohort effect) with MCC incidence. Similar to when the birth cohort effect was set to zero, the incidence rate of MCC increased with age for both sexes. In contrast, however, while the period effect has started to plateau (eFigure 2A and 2B in the Supplement), the birth cohort effect increased log linearly over the entire cohort range (1897-1956) for both men and women, without a distinct deviation in slope (eFigure 2C and 2D in the Supplement). The relative rate ratio for developing MCC increased from 0.29 (95% CI, 0.21-0.42 among male patients) in the 1897-1906 birth cohort to 2.19 (95% CI, 1.67-2.86) in the most recent cohort (1947-1956) relative to the 1922-1931 cohort.
We performed a post hoc analysis to verify the observed slowing of the period effect. To do so, we made assumptions about the birth cohort effect (positive, neutral, and negative effects) to investigate changes in the period effect (eFigure 3A and 3C in the Supplement). Regardless of birth cohort effect, the period effect appears to begin to decrease in slope after the 1997-2001 cohort. Similarly, we investigated whether the birth cohort effect was increasing when we assumed a strong positive period effect. Under this assumption, for male and female patients (eFigure 3B and 3D in the Supplement, respectively), the birth cohort effect continued to increase but deviated from log linearity for male patients.
Finally, subgroup analysis by anatomical site (head and neck, trunk, and extremities) was performed (eFigures 4-6 in the Supplement). For each subgroup and sex, age effects were consistent with the aforementioned pooled analysis over all sites, as were period and cohort effects for MCC of the head and neck (eFigure 4 in the Supplement). However, for MCC of the trunk (eFigure 5 in the Supplement), we were unable to detect any association due to period or birth cohort with incidence rate. Furthermore, for MCC of the extremities (eFigure 6A in the Supplement), in contrast to the plateauing of period effects seen in MCC of the head and neck (eFigure 4A and 4B in the Supplement), the period effect is log linear over time for men without a distinct change in slope. In contrast, while in MCC of the head and neck there was no plateau in birth cohort effect (eFigure 4C and 4D in the Supplement), the cohort effect appears to plateau from the 1942-1951 cohort for men only for MCC of the extremities (eFigure 6C in the Supplement).
Projection Analysis
We next performed a projection analysis to estimate future incidence rates of MCC (Figure 2 and eFigure 7 in the Supplement). Patients aged 85 years or older are projected to have the greatest increase in the number of new cases (734 cases in 2020) and will continue to have the highest age-adjusted incidence rate (18.12 per 100 000 male patients and 6.88 per 100 000 female patients in 2020). Furthermore, among male patients 40 to 64 years of age, the age-adjusted incidence rate of MCC will remain approximately the same through 2030 (4.18 per million in 2014 compared with 5.38 per million in 2030). Over both sexes, we project there to be a total of 3023 new cases of MCC in the US in 2020, 3858 new cases in 2025, and 5130 new cases in 2030 (eTable in the Supplement).
Figure 2. Trends and Projected Incidence Rates for Merkel Cell Carcinoma.

Dots represent fitted points. Dashed line represents calendar year 2016. Each lighter shade of blue represents an additional 10% CI.
Discussion
In this study, we begin to address why MCC incidence rates have been increasing by using an APC analysis. We show that, while MCC continues to increase in older populations, the incidence rate is projected to remain largely constant in younger populations. Furthermore, the rate of incidence increase appears to be slowing in recent calendar periods. Despite this slowing, the birth cohort effect does not appear to be plateauing. This log-linear increase in the birth cohort effect may impact future changes in MCC incidence. Therefore, continued epidemiologic and clinical research into this disease and ways to prevent it is needed.
The main value of this study is in the APC analysis, which quantitatively describes the relative age, period, and birth cohort effects. We show that, using different assumptions for the birth cohort effect, starting around 1999, the period effect has started to slow. This finding suggests that the initial increase in MCC diagnoses was likely due to increased detection with the development of immunohistochemical tests, most notably cytokeratin-20 in 1992,11,24 and increased clinician awareness as opposed to true increases in disease burden in the US.11
Because the period effect is likely nonzero over time owing to clear advances in diagnostic tools, we also performed an analysis in which we assumed a strong positive period effect at β = 0.1 (eFigure 3B and 3D in the Supplement). Under this assumption, the birth cohort effect continues to increase. Therefore, differences in true risk exposure over time have also likely been associated with increased disease incidence. One possible reason for this association may be that there continues to be increasing exposure to known risk factors, especially lifestyle and occupational-induced UV radiation damage.25 Given that MCC predominantly affects the very old, the late-term complications of such UV radiation–induced DNA damage may only be starting to become apparent. Although UV radiation–induced damage is likely the major environmental risk factor, changes in the immune system and differences in exposure to Merkel cell polyomavirus cannot be excluded. High UV radiation exposure is associated with immunosuppression in animal models26; however, epidemiology studies linking UV radiation exposure with the development of non-Hodgkin lymphoma have yielded inconsistent results.27,28
Our results generally concur with those of previous epidemiologic studies of MCC. In particular, we and others report an increased incidence rate among the elderly population, among men, and among sun-exposed regions of the body.10,11,29,30,31 On the other hand, contrary to a previous study that showed an increase in tumor stage over time,30 we show that localized, regional, and distant disease have all increased at approximately the same rate (Table) from 1987-1991 to 2012-2016. Although other studies have shown associations with age, we quantitatively demonstrate the log-linear increase in incidence rate with age after adjusting for either period or cohort effects. This age effect may in part be due to an increased risk for cancers and/or immunosenescence with age.11,32 Finally, we show an increase in MCC diagnoses in Black individuals. However, this increase was not significantly different from the pooled rate increase across races/ethnicities. Furthermore, MCC is particularly rare in the Black population, so strong conclusions regarding this increase are not possible. Further research into this trend and epidemiologic evaluation should be performed.
Compared with the projection analysis provided by Paulson et al,10 which showed that the number of cases of MCC increases based solely on the aging population, we show that the MCC incidence rate is also likely to increase by applying a more robust statistical model that incorporates period and birth cohort effects. This projected increase in rate underscores the importance of research investigating underlying reasons for why MCC epidemiologic characteristics are changing. Given the projected increase in both incidence rate and the aging population, our projected total number of cases is greater than previously reported.10
Limitations
This retrospective analysis has some limitations, including database-specific factors. Namely, the SEER database is population based, and the 9 registries cover approximately 9.4% of the population.33 Given the limited sample size, APC analysis was performed using intervals of 5 years, which limits the ability to detect granular differences in the period and cohort effects over shorter time ranges. Furthermore, we were not able to use the 13- or 18-registry SEER databases because we prioritized data inclusion from prior to 1992 for our modeling. With regard to interpretation of our results, the SEER database is limited because it does not contain specific data on patient comorbidities, medications, or patient information regarding polyomavirus status. An understanding of how these comorbidities track alongside the incidence of MCC would have been useful to adjust for in our analyses.
Conclusions
Despite the MCC incidence continuing to increase, the rate of increase appears to be slowing in recent periods, with most new cases associated with the aging population and risk factor exposure as opposed to clinical detection factors. This study aids in clinician understanding of MCC epidemiologic characteristics and helps to inform the need for continued aggressive risk factor modification and potential screening of patients older than 65 years.
eMethods.
eReferences.
eFigure 1. Combined Effects of Age, Period, and Birth Cohort on MCC Incidence
eFigure 2. Analysis of Age and the Individual Effects of Period and Birth Cohort on MCC Incidence
eFigure 3. Post Hoc Analysis of Age, Period, and Cohort Effects Under Different Assumptions.
eFigure 4. Analysis of Age and the Individual Effects of Period and Birth Cohort on MCC Incidence of the Head and Neck
eFigure 5. Analysis of Age and the Individual Effects of Period and Birth Cohort on MCC Incidence of the Trunk
eFigure 6. Analysis of Age and the Individual Effects of Period and Birth Cohort on MCC Incidence of the Extremities
eFigure 7. Projected Incidence Rates for Merkel Cell Carcinoma
eTable. Estimated Number of New Cases of Merkel Cell Carcinoma
References
- 1.Toker C. Trabecular carcinoma of the skin. Arch Dermatol. 1972;105(1):107-110. doi: 10.1001/archderm.1972.01620040075020 [DOI] [PubMed] [Google Scholar]
- 2.Gould VE, Moll R, Moll I, Lee I, Franke WW. Neuroendocrine (Merkel) cells of the skin: hyperplasias, dysplasias, and neoplasms. Lab Invest. 1985;52(4):334-353. [PubMed] [Google Scholar]
- 3.Fondain M, Dereure O, Uhry Z, et al. Merkel cell carcinoma in France: a registries-based, comprehensive epidemiological survey. J Eur Acad Dermatol Venereol. 2018;32(8):1292-1296. doi: 10.1111/jdv.14798 [DOI] [PubMed] [Google Scholar]
- 4.Girschik J, Thorn K, Beer TW, Heenan PJ, Fritschi L. Merkel cell carcinoma in Western Australia: a population-based study of incidence and survival. Br J Dermatol. 2011;165(5):1051-1057. doi: 10.1111/j.1365-2133.2011.10493.x [DOI] [PubMed] [Google Scholar]
- 5.Kaae J, Hansen AV, Biggar RJ, et al. Merkel cell carcinoma: incidence, mortality, and risk of other cancers. J Natl Cancer Inst. 2010;102(11):793-801. doi: 10.1093/jnci/djq120 [DOI] [PubMed] [Google Scholar]
- 6.Kieny A, Cribier B, Meyer N, Velten M, Jégu J, Lipsker D. Epidemiology of Merkel cell carcinoma: a population-based study from 1985 to 2013, in northeastern of France. Int J Cancer. 2019;144(4):741-745. doi: 10.1002/ijc.31860 [DOI] [PubMed] [Google Scholar]
- 7.Kukko H, Böhling T, Koljonen V, et al. Merkel cell carcinoma—a population-based epidemiological study in Finland with a clinical series of 181 cases. Eur J Cancer. 2012;48(5):737-742. doi: 10.1016/j.ejca.2011.06.001 [DOI] [PubMed] [Google Scholar]
- 8.Robertson JP, Liang ES, Martin RC. Epidemiology of Merkel cell carcinoma in New Zealand: a population-based study. Br J Dermatol. 2015;173(3):835-837. doi: 10.1111/bjd.13782 [DOI] [PubMed] [Google Scholar]
- 9.Youlden DR, Soyer HP, Youl PH, Fritschi L, Baade PD. Incidence and survival for Merkel cell carcinoma in Queensland, Australia, 1993-2010. JAMA Dermatol. 2014;150(8):864-872. doi: 10.1001/jamadermatol.2014.124 [DOI] [PubMed] [Google Scholar]
- 10.Paulson KG, Park SY, Vandeven NA, et al. Merkel cell carcinoma: current US incidence and projected increases based on changing demographics. J Am Acad Dermatol. 2018;78(3):457-463. doi: 10.1016/j.jaad.2017.10.028 [DOI] [PMC free article] [PubMed] [Google Scholar]
- 11.Coggshall K, Tello TL, North JP, Yu SS. Merkel cell carcinoma: an update and review: pathogenesis, diagnosis, and staging. J Am Acad Dermatol. 2018;78(3):433-442. doi: 10.1016/j.jaad.2017.12.001 [DOI] [PubMed] [Google Scholar]
- 12.Clarke CA, Robbins HA, Tatalovich Z, et al. Risk of Merkel cell carcinoma after solid organ transplantation. J Natl Cancer Inst. 2015;107(2):dju382. doi: 10.1093/jnci/dju382 [DOI] [PMC free article] [PubMed] [Google Scholar]
- 13.Feng H, Shuda M, Chang Y, Moore PS. Clonal integration of a polyomavirus in human Merkel cell carcinoma. Science. 2008;319(5866):1096-1100. doi: 10.1126/science.1152586 [DOI] [PMC free article] [PubMed] [Google Scholar]
- 14.Villani A, Fabbrocini G, Costa C, Carmela Annunziata M, Scalvenzi M. Merkel cell carcinoma: therapeutic update and emerging therapies. Dermatol Ther (Heidelb). 2019;9(2):209-222. doi: 10.1007/s13555-019-0288-z [DOI] [PMC free article] [PubMed] [Google Scholar]
- 15.Engels EA, Frisch M, Goedert JJ, Biggar RJ, Miller RW. Merkel cell carcinoma and HIV infection. Lancet. 2002;359(9305):497-498. doi: 10.1016/S0140-6736(02)07668-7 [DOI] [PubMed] [Google Scholar]
- 16.Lanoy E, Costagliola D, Engels EA. Skin cancers associated with HIV infection and solid-organ transplantation among elderly adults. Int J Cancer. 2010;126(7):1724-1731. doi: 10.1002/ijc.24931 [DOI] [PMC free article] [PubMed] [Google Scholar]
- 17.Howard RA, Dores GM, Curtis RE, Anderson WF, Travis LB. Merkel cell carcinoma and multiple primary cancers. Cancer Epidemiol Biomarkers Prev. 2006;15(8):1545-1549. doi: 10.1158/1055-9965.EPI-05-0895 [DOI] [PubMed] [Google Scholar]
- 18.Zhu C, Zheng T, Kilfoy BA, et al. A birth cohort analysis of the incidence of papillary thyroid cancer in the United States, 1973-2004. Thyroid. 2009;19(10):1061-1066. doi: 10.1089/thy.2008.0342 [DOI] [PMC free article] [PubMed] [Google Scholar]
- 19.Tiwari RC, Clegg LX, Zou Z. Efficient interval estimation for age-adjusted cancer rates. Stat Methods Med Res. 2006;15(6):547-569. doi: 10.1177/0962280206070621 [DOI] [PubMed] [Google Scholar]
- 20.Holford TR. Understanding the effects of age, period, and cohort on incidence and mortality rates. Annu Rev Public Health. 1991;12:425-457. doi: 10.1146/annurev.pu.12.050191.002233 [DOI] [PubMed] [Google Scholar]
- 21.Riebler A, Held L. Projecting the future burden of cancer: bayesian age-period-cohort analysis with integrated nested Laplace approximations. Biom J. 2017;59(3):531-549. doi: 10.1002/bimj.201500263 [DOI] [PubMed] [Google Scholar]
- 22.United States Census Bureau. 2017 National population projections datasets: projections for the United States: 2017 to 2060. Published 2017. Updated February 20, 2020. Accessed October 10, 2019. https://www.census.gov/data/datasets/2017/demo/popproj/2017-popproj.html
- 23.The R Core Team. R: A Language and Environment for Statistical Computing Vienna, Austria: R Foundation for Statistical Computing; 2019.
- 24.Kervarrec T, Tallet A, Miquelestorena-Standley E, et al. Diagnostic accuracy of a panel of immunohistochemical and molecular markers to distinguish Merkel cell carcinoma from other neuroendocrine carcinomas. Mod Pathol. 2019;32(4):499-510. doi: 10.1038/s41379-018-0155-y [DOI] [PubMed] [Google Scholar]
- 25.Agelli M, Clegg LX, Becker JC, Rollison DE. The etiology and epidemiology of merkel cell carcinoma. Curr Probl Cancer. 2010;34(1):14-37. doi: 10.1016/j.currproblcancer.2010.01.001 [DOI] [PubMed] [Google Scholar]
- 26.Kripke ML. Effects of UV radiation on tumor immunity. J Natl Cancer Inst. 1990;82(17):1392-1396. doi: 10.1093/jnci/82.17.1392 [DOI] [PubMed] [Google Scholar]
- 27.Zhang Y, Holford TR, Leaderer B, et al. Ultraviolet radiation exposure and risk of non-Hodgkin’s lymphoma. Am J Epidemiol. 2007;165(11):1255-1264. doi: 10.1093/aje/kwm020 [DOI] [PubMed] [Google Scholar]
- 28.Cahoon EK, Pfeiffer RM, Wheeler DC, et al. Relationship between ambient ultraviolet radiation and non-Hodgkin lymphoma subtypes: a U.S. population-based study of racial and ethnic groups. Int J Cancer. 2015;136(5):E432-E441. doi: 10.1002/ijc.29237 [DOI] [PMC free article] [PubMed] [Google Scholar]
- 29.Albores-Saavedra J, Batich K, Chable-Montero F, Sagy N, Schwartz AM, Henson DE. Merkel cell carcinoma demographics, morphology, and survival based on 3870 cases: a population based study. J Cutan Pathol. 2010;37(1):20-27. doi: 10.1111/j.1600-0560.2009.01370.x [DOI] [PubMed] [Google Scholar]
- 30.Fitzgerald TL, Dennis S, Kachare SD, Vohra NA, Wong JH, Zervos EE. Dramatic increase in the incidence and mortality from Merkel cell carcinoma in the United States. Am Surg. 2015;81(8):802-806. doi: 10.1177/000313481508100819 [DOI] [PubMed] [Google Scholar]
- 31.Hodgson NC. Merkel cell carcinoma: changing incidence trends. J Surg Oncol. 2005;89(1):1-4. doi: 10.1002/jso.20167 [DOI] [PubMed] [Google Scholar]
- 32.Aw D, Silva AB, Palmer DB. Immunosenescence: emerging challenges for an ageing population. Immunology. 2007;120(4):435-446. doi: 10.1111/j.1365-2567.2007.02555.x [DOI] [PMC free article] [PubMed] [Google Scholar]
- 33.Survillance, Epidemiology, and End Results Program Number of persons by race and Hispanic ethnicity for SEER participants (2010. census data). National Cancer Institute. Accessed December 10, 2019. https://seer.cancer.gov/registries/data.html
Associated Data
This section collects any data citations, data availability statements, or supplementary materials included in this article.
Supplementary Materials
eMethods.
eReferences.
eFigure 1. Combined Effects of Age, Period, and Birth Cohort on MCC Incidence
eFigure 2. Analysis of Age and the Individual Effects of Period and Birth Cohort on MCC Incidence
eFigure 3. Post Hoc Analysis of Age, Period, and Cohort Effects Under Different Assumptions.
eFigure 4. Analysis of Age and the Individual Effects of Period and Birth Cohort on MCC Incidence of the Head and Neck
eFigure 5. Analysis of Age and the Individual Effects of Period and Birth Cohort on MCC Incidence of the Trunk
eFigure 6. Analysis of Age and the Individual Effects of Period and Birth Cohort on MCC Incidence of the Extremities
eFigure 7. Projected Incidence Rates for Merkel Cell Carcinoma
eTable. Estimated Number of New Cases of Merkel Cell Carcinoma