

Abstract

Membrane proteins are key constituents of the proteome of cells but are poorly characterized, mainly because they are difficult to solubilize. Proteome analysis involves separating proteins as a preliminary step toward their characterization. Currently, the most common method is “solubilizing” them with sophisticated detergent and lipid mixtures for later separation via, for instance, sodium dodecyl sulfate polyacrylamide gel electrophoresis. However, this later step induces loss of 3D structure (denaturation). Migration in a medium that mimics the cell membrane should therefore be more appropriate. Here, we present a successful electrophoretic separation of a mixture first of two and then of three different membrane objects in supported n-bilayers. These “objects” are composed of membrane proteins sulfide quinone reductase and α-hemolysin. Sulfide quinone reductase forms an object from three monomers together and self-inserts into the upper leaflet. α-Hemolysin inserts as a spanning heptamer into a bilayer or can build stable dimers of α-hemolysin heptamers under certain conditions. By appropriately adjusting the pH, it proved possible to move them in different ways. This work holds promise for separating membrane proteins without losing their 3D structure, thus their bioactivity, within a lipidic environment that is closer to physiological conditions and for building drug/diagnostic platforms.
1. Introduction
Membrane proteins play an important role in biological processes. Located at the boundary surface between the inside and the outside of the cell, they play many roles, acting as a gate in active/passive transport of ions/molecules through membranes and thereby ensuring reception/transmission of signals, modeling and adhesion, intercellular recognition, extracellular matrix binding, enzymatic activity, etc. Although they constitute roughly 30% of the proteome of a mammalian cell, i.e., close to 30,000 proteins, only 1040 (∼3.5%) 3D structures are known.1 Yet, membrane proteins represent 50% of pharmaceutical targets, with knowledge of 3D structure being crucial to researchers seeking to design better-targeted drugs.
This lack of characterization stems from issues with purifying, crystallizing, and functionally reconstituting membrane proteins. The main reason is that they are extremely difficult to handle in a water environment without denaturing them. In practice, a mixture of detergents and lipids must be used to stabilize the 3D structure. In addition, the environment is very difficult to reproduce in a fully biomimetic manner and can wind up being completely different, for example, with a separation method like SDS-PAGE. In that case, because of denaturing conditions, the 3D structure is completely lost. As a successful alternative, methods like Blue Native and Clear Native PAGE2−6 involve one-step isolation of membrane proteins using nonionic detergents such as dodecyl maltoside, Triton X-100, or digitonin under conditions enabling solubilization of biological membranes. By carefully selecting and adjusting the detergent and its concentration, it is possible to create conditions that are not harmful to the membrane proteins or the complexes owing to the presence of some of lipids from the solubilized membranes. Then, separated bands can be excised and run in another dimension for final separation with various denaturing techniques (SDS-PAGE, doubled SDS-PAGE, and IEF/SDS 3D PAGE).
Pioneering work has been done to apply electrophoresis to achieve biomolecule separation in model membranes. The authors showed that both the electrophoretic and electroosmotic forces could be altered independently of one another and then can be used to precisely control the movement of membrane-bound species.7 Later, they developed electrophoretic–electroosmotic focusing of membrane-bound proteins in SLB containing charged lipids.8
Some years ago, another strategy was used.9 In this work, the authors were able to report progress in the knowledge of membrane proteins by identifying complexes playing vital biological roles in Saccharomyces cerevisiae. They identified complexes with 1590 putative integral, extrinsic, and lipid-anchored membrane proteins using tandem affinity purification and mass spectrometry.
More recently, Okamoto et al. separated for the first time two membrane pore-forming proteins in multilayer lipid membranes at one pH.10 Embedding the membrane proteins in a medium that partially mimics their natural environment meant that they could be separated without denaturation. Bao et al. have reported a 25-fold increased concentration of transmembrane protein–proteorhodopsin incorporated into supported lipid bilayers using electric fields.11
In the field of separating membrane proteins, another interesting technique was developed by the Höök’s group.12 They demonstrated affinity capturing and local enrichment of membrane proteins using a fluid lipid bilayer as the mobile phase. Specific membrane protein capturing and enrichment were accomplished by moving with a hydrodynamic flow the membrane protein inserted in a supported bilayer over a capture region.12 An alternative to this method consists of targeting the desired membrane protein contained in proteoliposome with nanoparticles. Then, proteoliposomes are merged into a continuous supported bilayer. Through the extended nanoparticle tag, a weak hydrodynamic force could be applied, inducing directed in-membrane movement of targeted membrane protein exclusively. This enabled selective thousand-fold enrichment of the targeted membrane protein while preserving a natural lipid environment.13
We propose here to carry out electrophoretic separation of a mixture of two objects at differing pHs in differing lipidic systems (different chemical nature and number of bilayers) and then to separate a mixture of three objects: the two previous objects plus a dimer of one of them. These objects are composed of membrane proteins sulfide quinone reductase (SQR) or α-hemolysin (α-HL), model proteins easily handled in aqueous solution before insertion. Sulfide quinone reductase forms an object from three monomers together with some detergent and self-inserts into the upper leaflet of the bilayer. α-Hemolysin inserts as a spanning heptamer into the bilayer or can build stable dimers of α-hemolysin heptamers under certain conditions. In previous papers,14−17 we measured some physicochemical properties (diffusion coefficient, electrophoretic mobility, and charge) of these two different objects alone, taken as models in such an environment. Sulfide quinone reductase (SQR) and α-hemolysin (α-HL) were chosen because they are very different: one is monotopic (inserts in one leaflet); the other is transmembrane (spans the two leaflets). This increases the probability that they will have different electrophoretic mobilities. Another reason is that they are easy to handle because they are soluble as monomers in aqueous solution and auto-assemble and then self-insert into the bilayer. About α-HL and its ability to form multimers, this method shows that it could be a way for separation of multimeric ion channels.
We use supported phospholipidic n-bilayers of two different lipids with n, which can be set to 1, 2 or ∼35. The method was “learning when walking”: (i) building one single bilayer (n = 1) with a Langmuir–Blodgett trough leads to a well-defined basic system; (ii) a double bilayer (n = 2) provides another test system; and (iii) a multibilayer (n ≈ 35), very easy to build by simply rehydrating a desiccated film, will be useful for quick applications. It is a third system to test reproducibility of results and might improve membrane protein loading capacities for what we hope will become routine separation.
Starting with a mixture of known objects, conditions can be chosen so as to immobilize either one or the other object, move them in opposite directions, etc. Later, starting with an unknown mixture, after a screening of the pHs, separating conditions can be chosen in accordance with each situation. Furthermore, these systems can be used as a drug or diagnostic platform, once proteins have been separated.
2. Results and Discussion
2.1. Characterization of the Different Systems
Because lipids of our SLBs have phosphatidylcholine head groups and saturated aliphatic backbones and because diffusion coefficients and mobilities have been measured and quantitative analysis of protein incorporation has been performed in the fluid phase, there is no difference between them going from a system to another. This was expected and there is no reason to observe different behaviors under an electric field as reported,18,19 perhaps due to the confined geometry.
The different systems of our study are summarized in Table 1.
Table 1. Systems, pH, and Incubation Temperature in Different Supported Lipidic Bilayer Systems.
| mixture | conditions | DMPC single bilayer | DMPC double bilayer | DMPC multibilayer | EggPC multibilayer |
|---|---|---|---|---|---|
| 2 objects | pH | 6.8; 8.3; 9.2 | 6.8; 8.3; 9.2 | 6.8; 7.2; 8.3; 9.2 | |
| incubation T (°C) | 33 | 33 | 33 | ||
| 3 objects | pH | 9.2 | |||
| incubation T (°C) | 33 °C (SQR & α-HL) then 22 °C to obtain α-HL dimers |
2.1.1. Mixture of Two Objects
For the mixture of two objects, we used different membrane models and as shown in Table 1, we incubated both SQR and α-HL in a single bilayer of DMPC, a multibilayer of DMPC and a multibilayer of EggPC. After incubation of SQR over a single bilayer of DMPC, the support was placed under a fluorescence microscope and a density of 426 spots/mm2 was observed. After incubation of α-HL and washing, the spot density observed for α-HL was 177 spots/mm2. The order of magnitude of the spot densities was reproducible whatever the system.
2.1.2. Mixture of Three Objects
We did this experiment on a double bilayer of DMPC as indicated in Table 1. As an illustration of what was described in the previous paragraph, we observed 392/mm2 spots versus 426 spots/mm2 (mixture of 2) for SQR, a reproducibility of insertion to that of the protein alone, which saturated at around 400 spots/mm2 in ref (16). There was the same trend for α-HL with 182 spots/mm2versus 177 spots/mm2 (mixture of 2) and ∼180 spots/mm2 for the protein alone.14 For the dimer of heptameric α-HL, we found 130 spots/mm2, which is in good agreement with the 139 spots/mm2 obtained after 24 h of incubation.16 The number of spots varied from one experiment to another by around 5%.
In addition, these reproducible densities shed light upon the mechanism of dimer formation: the dimers are built independently; their formation does not consist of dimerization of already-inserted heptameric α-HL.
2.1.3. Identification of Objects
2.1.3.1. Fluorescence Intensity in Arbitrary Units (a.u.)
In previous work,14−17 we observed an average intensity close to 38 arbitrary units (a.u.) for trimeric SQR and heptameric α-HL. The same intensity was observed here, corresponding to the label content of each object. For the dimer of heptameric α-HL alone, the average intensity was ∼70 a.u, roughly twice the previous intensity, as expected.
In the mixture of two objects, we observed spots having an average intensity of 38 a.u. In the mixture of three objects, we observed spots having the same intensity (38 a.u.) and spots having an average intensity of 67–70 a.u, indicating the presence of the three objects.
2.1.3.2. Differentiation between SQR and α-HL
For both mixtures (2 or 3 objects):
SQR was incubated first, then videoed, and analyzed. Recording free particle trajectories with our video setup and treating them with Image J developed by the MOSAIC GROUP at ETH Zurich,33 we determined diffusion coefficients D of SQR at zero electric field (with the plugin), finding values of D in good agreement with previous reports.16
Next, α-HL was incubated. Then, we put the electric field on and observed two populations: each had its own mobility, similar to when it was measured on protein alone.14,15 This enabled us to distinguish SQR from α-HL.
No video measurements of diffusion coefficients were performed for α-HL but total spot density was observed to have increased, indicating that SQR and α-HL were now inserted in the same bilayer.
Each determination (fluorescence intensity and electrophoretic mobility) on each video was carried out on 10 spots at least. Using these determinations, we obtained a position pattern for a given object that was then used, in a sort of feedback loop, to selectively color the spots on the figures of the article (SQR in red, α-HL in blue) for easier discrimination.
2.2. Relevant pHs for Protein Separation
We wished to visualize, and thus to predict, which pH value could be used to separate the objects. Our previous studies15,17 provided data on how electrophoretic mobility of each protein inserted alone in an SLB depends on pH. We put together the two mobility variations enabling us to draw Figure 1 to compare them.
Figure 1.

Electrophoretic mobility of trimeric SQR alone (open red circles) and heptameric α-HL alone (full blue circles) as a function of pH (the error bar is ±10%).
From this figure, we determined four relevant pH values for testing:
7.2: objects should move in opposite directions, SQR being positively and α-HL negatively charged, respectively;
9.2: the two objects (later, the three) should race each other in the same direction, SQR being the fastest; and
6.8 and 8.3 (pI of SQR and α-HL, respectively): in each case, one object should be immobile because the pH corresponds to its pI.
That is what was observed. To help visualize the differing behaviors, in addition to the videos (Videos S1–S5, Supplementary Information), a series of snapshots are presented in Figures 2 and 3. SQR objects are colored red, α-HL objects blue, and dimer α-HL objects yellow as well as the arrows illustrating their motion.
Figure 2.
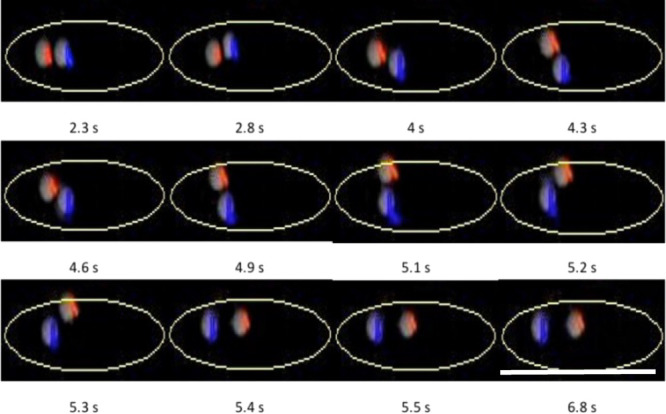
Zoom on SQR (red) bumping into α-HL (blue) inserted in EggPC-supported multibilayer at pH = 7.2 under a 3 V/cm electric field with the time interval 2.3 to 6.8 s extracted from Video S1. Scale bar: 50 μm.
Figure 3.

Distribution of measured electrophoretic mobility as a function of the number of individual objects tracked (distributions in nuances of blue for αHl and in nuances of red for SQR).
2.3. Separation of Two Objects (Trimeric SQR + Heptameric α-HL)
In this work, one issue is how to distinguish between the proteins since they are both labeled with the same fluorescent dye. In the case of a mixture with SQR and α-HL, it is deduced a posteriori from electrophoretic behavior.
At pH 7.2, both proteins have mobility but in opposite directions since they have opposite charges. α-HL moves toward the negative electrode and SQR toward the positive electrode as when they were alone according to Figure 1. This enables us to distinguish between SQR and α-HL. The complete sequence is shown in Video S1 (Supplementary Information). They frequently appear to simply go their own way, ignoring the existence of other species. However, there are some situations where two different objects approach each other closely enough to collide, with potentially varying results. The question is will they join together and stop migrating? Or will they migrate as one object with a mobility that is derived from their opposite mobilities?
We were able to capture these particular situations (bottom/left and top/right, yellow ellipses in Video S1). We focus on one of these events from the movie, detailed in Figure 2: we extracted some snapshots, time interval 2.3 to 6.8 s, from Video S1 (Supplementary Information).
In the movie, the objects start to bump into each other at first, bounce, and finally manage to find a way to glide past each other before following separate paths. The striking feature is that, even though they have opposite charges, they do not stick to each other. This is a very interesting result since it proves that, even with opposite charges, separation is still possible. This is one of the key points: such a platform could perform the separation for multiple biomolecules. We suggest that they do not stick to each other because each object is surrounded by a belt of bound lipids. This is supported by previous studies that have established that the folding, structure, and function of membrane proteins are influenced by their lipid environments and that lipids can bind to specific sites20,21
The complete sequence at pH 9.2 is shown in Video S2 (Supplementary Information). As Figure 1 shows, the difference in mobility is maximal, meaning that this is the pH at which separation is the fastest and most efficient for this system. At this pH, all objects have a negative charge and race toward the positive electrode as shown by the red (for SQR) and blue (for α-HL) arrows. We determined the mobility of each spot and found two populations. SQR migrates faster (μSQR = 2.2 × 10⁻⁴ cm2/V·s) than α-HL (μα-HL = 6 × 10⁻⁵ cm2/V·s), these mobilities being the same as when the proteins were alone. This enables us to distinguish between SQR and α-HL. SQR either overtakes α-HL easily while migrating when they are in distinct lanes or may overtake by changing lanes when SQR catches up with α-HL on the same trajectory (see yellow ellipse in Video S2 around t = 13 s). Again, we observe no sticking to each other or overcrowding that would prevent separation. A histogram of distribution of measured electrophoretic mobilities including the number of individual proteins tracked (SQR -different red- and αHl -different blue-) at pH 9.2 is provided in Figure 3.
This distribution results from the analysis of three experiments carried out at three different places on the same sample (around 60 spots followed). Beyond natural dispersion of a measure, this distribution can come from variation of the label content of the objects (two dyes on a monomer or two labeled monomers in an object). The overall variation for each mobility is close to 10%.
At pH 6.8, SQR is motionless, while α-HL moves toward the negative electrode (see Video S3, Supplementary Information). This enables us to distinguish between SQR and α-HL. At this pH, α-HL (blue spots) has a positive charge whereas SQR (red spots) has reached its pI (isoelectric point).15,17 We measured the mobility of α-HL and found μ = −1.9 × 10⁻⁵ cm2/V·s similar to when it was alone.15 The next experiment is intended to reverse roles for SQR and α-HL. At pH = 8.3, α-HL reached its pI and is motionless. SQR had a net negative charge. Similarly, this enables us to distinguish between SQR and α-HL. The SQR moves toward the positive electrode (see Video S4, Supplementary Information) but the α-HL is immobile. We measured the mobility of SQR, finding a value of 1.0 × 10⁻⁴ cm2/V·s, similar to when it was alone.17
All these scenarios at differing pHs will lead to the separation of the proteins.
2.4. Separation of Three Objects (Trimeric SQR + Heptameric α-HL+ Diheptameric α-HL)
As a final experiment, we prepared a mixture of three objects: trimeric SQR, heptameric α-HL, and a dimer of heptameric α-HL. We constructed a system composed of a double bilayer into which we inserted these three objects, as described in the Materials and Methods section. The experiment was run at pH 9.2, where all objects are negatively charged. Again, the issue is how to distinguish between the proteins since they are all labeled with the same fluorescent dye. We distinguish the trimeric SQR from heptameric α-HL as explained previously. The dimer of heptameric α-HL is easily distinguished from the others since its fluorescence is roughly twice their fluorescence.
They race each other toward the positive electrode (Video S5, Supplementary Information). In this video, the different objects have different shades of gray (trimeric SQR and heptameric α-HL: light gray; the dimer of heptameric α-HL: brilliant gray). In Figure 4, as illustration of Video S5, trimeric SQR and heptameric α-HL are shown in their usual color, red and blue, respectively, and the third object, the dimer, is in yellow (same color code for the arrows). Circles/ellipses illustrate situations where the three objects (red, blue and yellow) are close at the beginning and where distances between them increase with time.
Figure 4.

Images of fluorescent SQR (red), α-HL (blue), and dimeric α-HL (yellow) electrophoretic migration recorded at 0, 10, and 20 s extracted from Video S5. The vertical red dotted line is an arbitrary reference line to highlight the position change of objects. Scale bar: 50 μm.
The fastest is SQR, and the slowest is the dimer. Each object has its mobility value, determined during previous work on protein alone. This experiment shows again that it is possible to electrophoretically separate a mixture of membrane proteins in supported lipid bilayers in a short time and with a fairly low electric field.
All the mobilities recorded during these experiments are presented in Table 2.
Table 2. Mobilities μ (10–5 cm2/V·s)of the Different Objects as a Function of pH and x, the Number of Species Present in the Mixture (Values of μ ± 10%).
| SQR |
α-HL |
dimer α-HL |
||||||
|---|---|---|---|---|---|---|---|---|
| pH | x = 1 (alone) | x = 2 (+α-HL) | x = 3 (+α-HL, dimer) | x = 1 (alone) | x = 2 (+SQR) | x = 3 (+SQR, dimer) | x = 1 (alone) | x = 3 (+ SQR, αHL) |
| 5.2–5.5 | –20.6 | –8.2 | ||||||
| 6.4 | –6.0 | |||||||
| 6.8 (pI of SQR) | 0 | 0 | –1.9 | |||||
| 7.2 | 1.6 | 1.6 | –1.9 | –2.1 | –1,0 | |||
| 8.3 (pI of α-HL) | 9.9 | 10.0 | 0 | 0 | ||||
| 9.2 | 22.0 | 22.2 | 21.8 | 5.8 | 6.0 | 6.1 | 1.9 | |
3. Conclusions
This work provides new insights into the feasibility of an electrophoretic separation of membrane proteins in single, double, and multisupported bilayers that can be routinely used starting from a cell or a cell lysate. This separation occurs at a low electric field. Beyond separation to establish the 3D structure of individual membrane proteins, thus keeping their bioactivity, these systems can be used as a test platform for drugs or diagnostics. It reveals that SQR remains immobile (when at its pI) while α-HL can migrate alone or vice versa, which is achieved by suitably adjusting the pH of the buffer. We also demonstrated that when proteins are charged (mixture of two or three objects), separation is feasible due to the differing mobility that results from their differing structures and charges. If the proteins interact while migrating, they do not stick together, probably due to the existence of bound lipids which act as a bumper, avoid each other, and continue migrating. This is a very interesting result since even in these situations, separation occurs. Compared to standard electrophoretic methods, we observed clear separation of the three objects in substantially shorter distances (microns) and times (seconds) and with a weak field (3 V/cm). We hope to generalize to other membrane proteins after solving the next challenge, which is to insert an unknown membrane protein mixture from living systems into the supported multibilayer. We suggest two methods as potentially feasible: direct fusion of cells on an already-present supported bilayer or healing an intentionally created scratch in a multibilayer with a low-detergent solubilized biological membrane. In addition, this multibilayer system, easy to build using rehydration of a dried lipid film, could increase membrane protein loading capacities.
4. Materials and Methods
4.1. Sample
4.1.1. Supports
The slides used as supports were 2.5 × 2.5 cm2, either mica cleaved on both sides just before use (JBG-Metafix, France) to support the double bilayer or glass (Marienfield, cut edges, France) to support the single bilayer or the multibilayer. They were cleaned by immersion for 10 min in freshly prepared alcoholic NaOH, then thoroughly rinsed with ultrapure water, and sonicated three times for 5 min in ultrapure water.
4.1.2. Lipids
All lipids were purchased from Avanti Polar Lipids (Coger, France) and used without further purification. Supported single and double bilayers were prepared using 1,2-dimyristoyl-sn-glycero-3-phosphocholine (DMPC, Mw = 734 g·mol–1). Supported multibilayers were prepared using either DMPC or l-α-phosphatidylcholine (EggPC, Mw = 770 g·mol–1).
The single bilayer and double bilayer of DMPC were built using the Langmuir–Blodgett transfer technique (for details, see ref (22)). Lipid molecules solubilized in chloroform (∼1 mg/mL) were deposited on the water subphase (18 MΩcm, MilliQ, 15 °C) of a Langmuir trough (KSV Minitrough 361 mm × 74 mm, Finland), equilibrated for 10 min to allow complete solvent evaporation and then compressed to 30 mN/m. Transfer ratios were close to 1.
For the double bilayer on mica, the fourth monolayer, closing the second bilayer, was transferred using the Langmuir–Schaefer (LS) technique. Transfer ratios were close to 1 for the first three monolayers and 0.8 for the fourth monolayer.
The multibilayer was formed via the lipid film hydration method. Lipids (20 μL either DMPC or EggPC) in chloroform (1 mg/mL) were first desiccated under vacuum for 1 h on a glass slide. Then, the slide was positioned in our incubation cell (a Teflon cylinder embedded in steel, 1 cm diameter) and the film was rehydrated at room temperature with ultrapure water (18 MΩ·cm, MilliQ) for 30 min. Obtaining a multibilayer can be difficult. Several articles detail how multilamellar vesicles (MLVs) can be produced via rehydration of a dry lipidic film. We noticed that it usually involves supplying energy to the system, for instance through strong agitation or electric fields. Failing this, the outermost bilayer of a rehydrated DOPC film will spontaneously peel off (possibly bilayer by bilayer). However, it is also reported that peeling does not occur when starting from DPPC in the gel phase.23 More recently, Relat-Gobena et al.24 carried out AFM experiments on supported rehydrated multibilayer stacks in buffer solution. Keeping the same buffer without rinsing, they avoided turbulences and thus detachment of the lipid stacks.
In our system, we obtain a supported multibilayer and this is ensured by the following:
Removal, washing, and addition to the Teflon cell were performed very gently and along the wall of the cell, to minimize turbulence.
Working in pure water on glass increases electrostatic interactions because of the low ionic strength. This helps stabilize the rehydrated multibilayer at the glass surface.
Qualitatively, under the microscope, the sample appeared flat: there was no need to adjust the z direction to remain in focus, and no sign of the existence of slowly “swimming” MLVs.
Additionally, the electrophoretic mobilities of our objects were analogous when measured in single or double bilayers. Experiments were performed in replicate reproducibly in all systems (at least twice, sometimes more).
Assuming a lipid head molecular area25 of 0.63 nm2, given the amount of dried lipids (20 μL from a solution 1 mg/mL) and the area exposed to rehydration (a circle 1 cm in diameter), we estimated a number of bilayers close to ∼35 in the multibilayer.
Supported lipidic bilayers (SLBs) were kept under water throughout the experiment and used directly after preparation.
4.1.3. Proteins
α-Hemolysin (α-HL), extracted from Staphylococcus aureus, was purchased from Sigma Aldrich Inc. and used without further purification.
Sulfide quinone reductase (SQR) was extracted from an Aquifex aeolicus membrane with dodecyl-β-d-maltoside (DDM) and purified as previously described.26 Following purification, SQR was dialyzed against 50 mM HEPES buffer pH 7.2, 0.1% DDM using Vivaspin ultrafiltration spin columns (Sartorius stedim), concentrated at about 2 mg/mL and stored at −20 °C.
4.1.3.1. Protein Labeling
We labeled the proteins using a kit from Molecular Probes (Invitrogen) to covalently link an Alexafluor 488 fluorescent dye to the protein.27 Alexa Fluor dyes are reactive molecules used to add a fluorescent label to the primary amines (R-NH2) of proteins. It provides the combination of water solubility and pH insensitivity between pH 4 and 10 for compatibility in diverse biological environments. We used Alexa Fluor 488 TFP (tetrafluorophenyl) ester because TFP esters are less susceptible to spontaneous hydrolysis during conjugation reactions. The initial concentration of the protein was 0.4 mg/mL in PBS 1× (with DDM in the case of SQR), and the reaction time was 15 min for α-HL and 40 min for SQR. This yields an average labeling of 0.2 mol Alexa 488/mol protein.
After purification, the solution containing the labeled protein was mixed with the proper amount of a solution of the same protein unlabeled, to reach a final solution of α-HL with 1/7 labeled monomers and a solution of SQR with 1/3 labeled monomers. This rather low-labeled monomer content rules out any disturbance of the insertion mechanism of the protein and of the dynamics of the final object. Final aliquots of protein (0.2 μM) in 20 mM phosphate buffer (PB) and 100 mM NaCl (pH 7) were stored at −18 °C before use (with DDM in the case of SQR). We used the same label Alexa Fluor 488 for both proteins because our camera is black and white, we have acquired the skill of the labeling process, and our optical setups are designed for blue excitation and green emission.
4.1.3.2. Protein Insertion
SQR inserts as a trimeric integral monotopic (lipid-anchored in only one leaflet) membrane protein at the end of the process28,29 and we define it as the first object.
Incubated over a fluid bilayer, α-HL monomers in solution assemble as heptameric pre-pores at the surface of the bilayer, turning into transmembrane (spanning) heptameric pores.30,31 We define it as the second object.
Incubating α-HL over a lipid bilayer consisting of a mixture of fluid/gel regions (half transition) promotes the formation of dimers of α-HL heptameric pores,14 we define it as the third object of our protein mixture.
The composition of the aliquots leads on average to one fluorescent label per object (the heptameric pore for α-HL and the SQR trimer for SQR) and to two fluorescent labels per dimer of heptameric α-HL.
4.1.3.3. Preparing a System Containing a Mixture of Two Objects: Trimeric SQR and Single Heptameric α-HL
The volume over a slide with the bilayer (or multibilayer) positioned in our incubation cell was 1 mL. First, 700 μL of water was removed, leaving the bilayer under the remaining 300 μL, and 300 μL of an SQR aliquot was added. This final volume of 600 μL of protein (0.1 μM SQR in 10 mM PB and 100 mM NaCl, pH 7.2) was incubated for 12 h at 33 °C (bilayer in the fluid phase), after which 300 μL of the supernatant was discarded and the excess SQR was gently removed by adding and pipetting 500 μL of distilled water 10 times.
The sample was returned to the incubation cell and again immersed under 1 mL of distilled water, 700 μL of which was removed again. Then, 300 μL of an aliquot of α-HL was added to the incubation cell following the same protocol (12 h at 33 °C).
4.1.3.4. Preparing a System Containing a Mixture of Three Objects: SQR, Single Heptameric α-HL, and the Dimer of Heptameric α-HL
The incubation was carried out over a DMPC double bilayer. The first two steps were as described above for the mixture of two objects. Formation of dimers of heptameric α-HL depends on temperature and time. To obtain inserted dimers of heptameric α-HL, the solution was brought back to 22 °C, the temperature where gel and fluid lipid regions coexis, which is thus conducive to the formation of dimers of heptameric α-HL. An extra 12 h of incubation was carried out, which added to the initial 12 h incubation of α-HL, gave a total of 24 hours, found to be optimal to obtaining a large number of dimers.14
4.1.4. Systems
The temperature used to measure electrophoretic mobilities was 35 °C for all systems, the temperature where bilayers are fluid. For a given species and pH, all mobilities were identical whatever the system is (single bilayer, double bilayer, and multibilayer, composed of EggPC or DMPC) and identical to the value measured on the object when alone and not in a mixture.
4.2. Videomicroscopy
4.2.1. Cell
The sample (supported bilayer + inserted proteins) was transferred underwater in a thermostated electrophoretic cell (see ref (15) and Scheme S1, Supplementary information).
4.2.2. Video
An inverted fluorescence microscope (Leica) and a camera (Hamamatsu C2400-77: 768 × 494 pixels, 30 MHz) equipped with a fluorescence intensifier suitable for fluorescence imaging (magnification, 400×) were used to carry out protein velocity measurements. Videos of the migration of proteins under an electric field (3 V/cm) at different pHs are available in the Supplementary Information file (Videos S1–S5). As illustrations, a series of snapshots extracted from videos at different times are shown in the Results and Discussion section (Figures 2 and 3). Briefly, every time after applying the electric field of 20 s to record one experiment, we flush the cell with fresh buffer to remove electrolysis products, moved to another place over the sample. The setup is ready to record a new experiment.
4.3. Electrophoretic Mobility
The resulting effective mobility of an object (μeff) is the sum of several contributions:11
| 1 |
We showed that changing the sign of the protein by changing the pH reversed the direction of its migration. We also showed that the pI of the proteins was unchanged by the presence of Alexa Fluor 488. Both arguments mean that the contribution of the charge of the dye to the total charge of the object is negligible. Therefore, μE is the mobility of the charged object, depending on its charge and its size.32 Because phosphatidylcholine groups are globally neutral, μlipid is also negligible. Lastly, the contribution of electroosmosis (EOF) is also negligible due to the ionic strength and the “coating” of the surface by the bilayers as reported by Monson et al.7
We thus get
| 2 |
We obtain the mobility of the object directly by simply dividing its velocity by the field value. Drift velocity measurements were performed as described in the study of Harb and Tinland15 Briefly, the velocity of at least 10 spots measured on three different locations in the bilayer from each sample was obtained by dividing the distance traveled by the objects by time. Reproducibility was within 10%. The primary source of error was the measurement of the displacement due to the resolution of the microscope (±1 μm).
Acknowledgments
We are grateful to Dr. Marianne Guiral and Dr. Marie-Therese Guidici-Orticoni (Bioenergetics and protein engineering lab, CNRS-AMU) for the kind gift of SQR and for valuable comments. We thank Aix-Marseille University for financial support to Frederic Harb and Marjorie Sweetko for English language editing. We thank Dr. Mathilde Lepoitevin for careful rereading.
Glossary
ABBREVIATIONS
- DMPC
1,2-dimyristoyl-sn-glycero-3-phosphocholine
- EggPC
l-α-phosphatidylcholine (egg, chicken)
- SLB
supported lipidic bilayer
- SQR
sulfide quinone reductase
- α-HL
alpha hemolysin
Supporting Information Available
The Supporting Information is available free of charge at https://pubs.acs.org/doi/10.1021/acsomega.0c01196.
Video S1. Electrophoretic migration of SQR and α-HL inserted in EggPC-supported multibilayer under 3 V/cm at pH 7.2 (AVI)
Video S2. Electrophoretic migration of SQR and α-HL inserted in EggPC-supported multibilayer under 3 V/cm at pH 9.2 (AVI)
Video S3. Electrophoretic migration of SQR and α-HL inserted in EggPC-supported multibilayer under 3 V/cm at pH 6.8 (AVI)
Video S4. Electrophoretic migration of SQR and α-HL inserted in EggPC-supported multibilayer under 3 V/cm at pH 8.3 (AVI)
Video S5. Electrophoretic migration of a mixture of three objects (AVI)
Schematic diagram of the video/electrophoretic cell and its description and protocol to making the videos (text and diagram) (PDF).
Author Contributions
The manuscript was written through contributions of all authors. All authors have given approval to the final version of the manuscript.
The authors declare no competing financial interest.
Supplementary Material
References
- Stephen White laboratory, UC Irvine (2020/02/13), https://blanco.biomol.uci.edu/mpstruc/
- Schägger H.; von Jagow G. Blue native electrophoresis for isolation of membrane protein complexes in enzymatically active form. Anal. Biochem. 1991, 199, 223–231. 10.1016/0003-2697(91)90094-a. [DOI] [PubMed] [Google Scholar]
- Schagger H.; Cramer W. A.; Vonjagow G. Analysis of molecular masses and oligomeric states of protein complexes by blue native electrophoresis and isolation of membrane protein complexes by two-dimensional native electrophoresis. Anal. Biochem. 1994, 217, 220–230. 10.1006/abio.1994.1112. [DOI] [PubMed] [Google Scholar]
- Wittig I.; Braun H.-P.; Schägger H. Blue native PAGE. Nat. Protoc. 2006, 1, 418–428. 10.1038/nprot.2006.62. [DOI] [PubMed] [Google Scholar]
- Wittig I.; Karas M.; Schägger H. High resolution clear native electrophoresis for in-gel functional assays and fluorescence studies of membrane protein complexes. Mol. Cell. Proteomics 2007, 6, 1215–1225. 10.1074/mcp.M700076-MCP200. [DOI] [PubMed] [Google Scholar]
- Burré J.; Wittig I.; Schägger H.. Non-classical 2-D electrophoresis. In Proteomics, Methods in Molecular BiologyTM (Methods and Protocols); 2009; 564,33–57. [DOI] [PubMed]
- Monson C. F.; Pace H. P.; Liu C.; Cremer P. S. Supported Bilayer Electrophoresis under Controlled Buffer Conditions. Anal. Chem. 2011, 83, 2090–2096. 10.1021/ac1028819. [DOI] [PMC free article] [PubMed] [Google Scholar]
- Liu C.; Monson C. F.; Yang T.; Pace H.; Cremer P. S. Protein Separation by Electrophoretic-Electroosmotic Focusing on Supported Lipid Bilayers. Anal. Chem. 2011, 83, 7876–7880. 10.1021/ac201768k. [DOI] [PMC free article] [PubMed] [Google Scholar]
- Babu M.; et al. Interaction landscape of membrane-protein complexes in Saccharomyces cerevisiae. Nature 2012, 489, 585–589. 10.1038/nature11354. [DOI] [PubMed] [Google Scholar]
- Okamoto Y.; Tsujimoto Y.; Umakoshi H. Electrophoretic separation method for membrane pore-forming proteins in multilayer lipid membranes. Electrophoresis 2016, 37, 762–768. 10.1002/elps.201500567. [DOI] [PubMed] [Google Scholar]
- Bao P.; Cartron M. L.; Sheikh K. H.; Johnson B. R. G.; Hunter C. N.; Evans S. D. Controlling transmembrane protein concentration and orientation in supported lipid bilayers. Chem. Commun. 2017, 53, 4250–4253. 10.1039/C7CC01023K. [DOI] [PubMed] [Google Scholar]
- Gunnarsson A.; Simonsson Nyström L.; Burazerovic S.; Gunnarsson J.; Snijder A.; Geschwindner S.; Höök F. Affinity Capturing and Surface Enrichment of a Membrane Protein Embedded in a continuous Supported Lipid Bilayer. ChemistryOpen 2016, 5, 445–449. 10.1002/open.201600070. [DOI] [PMC free article] [PubMed] [Google Scholar]
- Lundgren A.; Fast B. J.; Block S.; Agnarsson B.; Reimhult E.; Gunnarsson A.; Höök F. Affinity Purification and Single-Molecule Analysis of Integral Membrane Proteins from Crude Cell-Membrane Preparations. Nano Lett. 2018, 18, 381–385. 10.1021/acs.nanolett.7b04227. [DOI] [PubMed] [Google Scholar]
- Harb F.; Sarkis J.; Ferte N.; Tinland B. Beyond Saffman-Delbruck approximation: a new regime for 2D diffusion of α-hemolysin complexes in supported lipid bilayer. Eur. Phys. J. E 2012, 35, 118. 10.1140/epje/i2012-12118-6. [DOI] [PubMed] [Google Scholar]
- Harb F.; Tinland B. Electric migration of α-hemolysin in supported n-bilayers: a model for transmembrane protein microelectrophoresis. Electrophoresis 2013, 34, 3054–3063. 10.1002/elps.201300202. [DOI] [PubMed] [Google Scholar]
- Harb F.; Prunetti L.; Giudici-Orticoni M. T.; Guiral M.; Tinland B. Insertion and self-diffusion of a monotopic protein, the Aquifex aeolicus sulfide quinone reductase, in supported lipid bilayers. Eur. Phys. J. E 2015, 38, 110. 10.1140/epje/i2015-15110-8. [DOI] [PubMed] [Google Scholar]
- Harb F.; Giudici-Orticoni M. T.; Guiral M.; Tinland B. Electrophoretic mobility of a monotopic membrane protein inserted into the top of supported lipid bilayers. Eur. Phys. J. E 2016, 39, 127. 10.1140/epje/i2016-16127-1. [DOI] [PubMed] [Google Scholar]
- Eggenberger O. M.; Leriche G.; Koyanagi T.; Ying C.; Houghtaling J.; Schroeder T. B. H.; Yang J.; Li J.; Hall A.; Mayer M. Fluid surface coatings for solid-state nanopores: comparison of phospholipid bilayers and archaea-inspired lipid monolayers. Nanotechnology 2019, 30, 325504. 10.1088/1361-6528/ab19e6. [DOI] [PubMed] [Google Scholar]
- Yusko E. C.; Johnson J. M.; Majd S.; Prangkio P.; Rollings R. C.; Li J.; Yang J.; Mayer M. Controlling the translocation of proteins through nanopores with bioinspired fluid walls. Nat. Nanotechnol. 2011, 6, 253–260. 10.1038/nnano.2011.12. [DOI] [PMC free article] [PubMed] [Google Scholar]
- Rasband W. S.ImageJ; U.S. National Institutes of Health: Bethesda, Maryland, 1997−2018. https://imagej.nih.gov/ij/.
- Laganowsky A.; Reading E.; Allison T. M.; Ulmschneider M. B.; Degiacomi M. T.; Baldwin A. J.; Robinson C. V. Membrane proteins bind lipids selectively to modulate their structure and function. Nature 2014, 510, 172–175. 10.1038/nature13419. [DOI] [PMC free article] [PubMed] [Google Scholar]
- de Vlugt J. E.; Xiao P.; Munro R.; Charchoglyan A.; Brewer D.; Al-Abdul-Wahid M. S.; Brown L. S.; Ladizhansky V. Identifying lipids tightly bound to an integral membrane protein. Biochim. Biophys. Acta, Biomembr. 2020, 1862, 183345. 10.1016/j.bbamem.2020.183345. [DOI] [PubMed] [Google Scholar]
- Harb F.; Tinland B. Effect of ionic strength on dynamics of supported phosphatidylcholine lipid bilayer revealed by FRAPP and Langmuir-Blodgett transfer ratios. Langmuir 2013, 29, 5540–5546. 10.1021/la304962n. [DOI] [PubMed] [Google Scholar]
- Hishida M.; Seto H.; Yamada N. L.; Yoshikawa K. Hydration process of multi-stacked phospholipid bilayers to form giant vesicles. Chem. Phys. Lett. 2008, 455, 297–302. 10.1016/j.cplett.2008.02.065. [DOI] [Google Scholar]
- Relat-Goberna J.; Beedle A. E. M.; Garcia-Meynes S. The Nanomechanics of Lipid Multibilayer Stacks Exhibits Complex Dynamics. Small 2017, 13, 1700147. 10.1002/smll.201700147. [DOI] [PubMed] [Google Scholar]
- Kukol A. Lipid Models for United-Atom Molecular Dynamics Simulations of Proteins. J. Chem. Theory Comput. 2009, 5, 615–626. 10.1021/ct8003468. [DOI] [PubMed] [Google Scholar]
- Prunetti L.; Infossi P.; Brugna M.; Ebel C.; Giudici-Orticoni M. T.; Guiral M. New functional sulfide oxidase-oxygen reductase supercomplex in the membrane of the hyperthermophilic bacterium Aquifex aeolicus. J. Biol. Chem. 2010, 285, 41815–41826. 10.1074/jbc.M110.167841. [DOI] [PMC free article] [PubMed] [Google Scholar]
- Alexa Fluor® 488 Protein Labeling Kit (A10235) Molecular Probes. [Google Scholar]
- Marcia M.; Ermler U.; Peng G.; Michel H. The structure of Aquifex aeolicus sulfide: quinone oxidoreductase, a basis to understand sulfide detoxification and respiration. Proc. Natl. Acad. Sci. 2009, 106, 9625–9630. 10.1073/pnas.0904165106. [DOI] [PMC free article] [PubMed] [Google Scholar]
- Gao R.; Liu H.; Xun L. Cytoplasmic Localization of Sulfide:Quinone Oxidoreductase and Persulfide Dioxygenase of Cupriavidus pinatubonensis JMP134. Appl. Environ. Microbiol. 2017, 83, e01820–e01817. 10.1128/AEM.01820-17. [DOI] [PMC free article] [PubMed] [Google Scholar]
- Harshman S.; Boquet P.; Duflot E.; Alouf J. E.; Montecucco C.; Papiniet E. Staphylococcal alpha-toxin: a study of membrane penetration and pore formation. J. Biol. Chem. 1989, 264, 14978–14984. [PubMed] [Google Scholar]
- Bhakdil S.; Tranum-Jensen J. Alpha-toxin of Staphylococcus aureus. Microbiol. Mol. Biol. Rev. 1991, 55, 733–751. [DOI] [PMC free article] [PubMed] [Google Scholar]
- Slater G. W.; Rousseau J.; Noolandi J. On the stretching of DNA in the reptation theories of gel electrophoresis. Biopolymers 1987, 26, 863–872. 10.1002/bip.360260607. [DOI] [PubMed] [Google Scholar]
Associated Data
This section collects any data citations, data availability statements, or supplementary materials included in this article.