Abstract
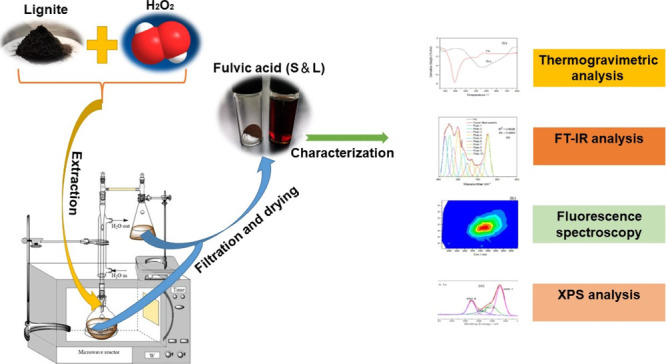
Fulvic acid (FA) is a complex organic mixture composed of small molecules. The structure and composition of FA vary greatly because of the different raw materials used for preparing FA. In this work, FA was extracted from shallow low-rank lignite by hydrogen peroxide (H2O2) in a microwave field, and the functional groups of FA were characterized. The optimal extraction process was determined, with the H2O2 concentration being the key factor affecting the yield of FA. Thermogravimetric analysis showed that FA was mainly composed of low molecular weight and readily pyrolyzed compounds. As shown by Fourier transform infrared spectroscopy, in the process of FA extraction by H2O2 oxidation of lignite, the content of −COOH increased, long-chain aliphatic compounds decreased, stretching vibrations of aromatic ring skeletons disappeared, and aromatic ring substitution became mainly tri- or disubstitution. Fluorescence spectroscopy indicated that FA had a low degree of aromaticity. X-ray photoelectron spectroscopy qualitatively and quantitatively revealed that the main modes of carbon–oxygen bonding in FA were C–O–, COO–, and C=O. Thus, this study not only lays a foundation for studying the composition and structure of coal-based FA but also opens a new avenue for a clean and efficient utilization of lignite.
1. INTRODUCTION
Humus is a complex polydisperse polymer mixture with diverse structures and aggregation states, which is widely distributed in natural soils, water, and minerals. It is mainly composed of C, O, H, and N, in which the proportion of organic carbon is generally between 40 and 60%.1−4 According to its source, humus can be divided into soil humus, aquatic humus, and mineral humus. According to its composition and structure, humus can be divided into fulvic acid (FA), humic acid (HA), and humin. Among these three components of humus, FA is the alkali- and acid-soluble component, HA is the alkali-soluble and acid-insoluble component, and humin is the insoluble residue.5−7
FA has a low molecular weight of only a few hundred Daltons. It can have a wide range of pH values. Because of its unique physical and chemical properties, FA has been used in a wide range of fields including agriculture, medicine, environment, and materials. In agriculture, FA can significantly improve the morphological characteristics of crops as well as their seed and straw yields. In addition, chelation of FA with metals can regulate metal absorption by crops, thereby affecting the growth and metabolism of plants.8−10 As a donor or recipient with a variety of biomedical functions, FA can promote electrochemical balance, stimulate immune regulatory molecules, and induce apoptosis of cancer cells.11,12 Compared with HA, FA contains a more diverse range of functional groups, has a higher degree of humization, and is more stable in the chemical and biological adsorption of some heavy metals.13 FA-based electrospun hard carbon nanofibers (PF–CNF) have been applied as negative electrodes of sodium ion batteries, where cycling 100 times at 100 mA·g–1 current density resulted in a capacity retention rate of 91%; this indicated that FA-based carbon nanomaterials have excellent cycling performance.14
The conventional extraction method for FA and HA is alkali dissolution and acid precipitation. First, humus in the raw material is extracted by NaOH or KOH, and then the pH is adjusted with HCl or HNO3 to obtain an FA solution.15−18 However, because of the introduction of high concentrations of Na+ and K+ in the extraction process, it is difficult to obtain pure FA by this method. Additionally, as large volumes of acid and alkali are used in this process, it is not an environmentally friendly method. Natural organic matter has been used to synthesize FA, with a composition similar to natural FA, but as the process is complex and the raw materials hard to obtain, this approach has not become popular.19 Recent studies have shown that the oxidation of coal increases the yields of FA and HA, and the macromolecular structure of coal is greatly affected by free radical chain reactions in the oxidation process.20 Among the oxidation methods, nitric acid not only increased the yield of HA from 20 to 85%, but also obtained FA and HA with low molecular weight and low aromaticity.21 However, nitric acid treatment is expensive, and pre-oxidation by H2O2 causes some weak covalent bonds in coal to break and introduces oxygen functional groups; this is similar to the effect of treatment with nitric acid, but high concentrations of H2O2 are not conducive to the formation of FA and HA.22 Different methods of extracting FA are compared in Table 1.
Table 1. Comparison of Different Extraction Methods of FA.
| method | principle | equipment | time | advantages | disadvantages |
|---|---|---|---|---|---|
| alkali-soluble acid precipitation23,24 | solubility differences | conventional extractor | 5–6 h | easy to operate | time-consuming |
| low extraction yield | |||||
| high content of impurities | |||||
| chemical degradation25,26 | oxidation increases acid solubility | conventional extractor | 36–72 h | high yielding | time-consuming |
| expensive | |||||
| ultrasound-assisted27 | ultrasound energy | ultrasonic water bath | 1 h | rapid | lower efficiency than the microwave method |
| range of ultrasonic action is narrow | |||||
| microwave-assisted28 | microwave energy | microwave extractor | 10–20 min | very rapid | difficult to industrialize |
Lignite is a type of inferior fuel with abundant reserves and rich organic matter, but with high moisture and ash content and low calorific value, it produces very high levels of pollutants in direct combustion. Therefore, the conversion of lignite into value-added chemicals or liquid fuel under mild conditions is of great value. For example, lignite has been used as a raw material for the effective production of FA.29−34 In this paper, FA was extracted from lignite using H2O2 in a microwave field, with a focus on exploring the optimal process conditions and investigating the composition and structure of the resulting FA. FA was analyzed and characterized by thermogravimetric (TG) analysis, Fourier transform infrared spectroscopy (FT-IR), fluorescence spectroscopy, and X-ray photoelectron spectroscopy (XPS) to provide theoretical and technical support for the production of high-purity FA products.
2. Results and Discussion
2.1. Extraction of FA from Lignite
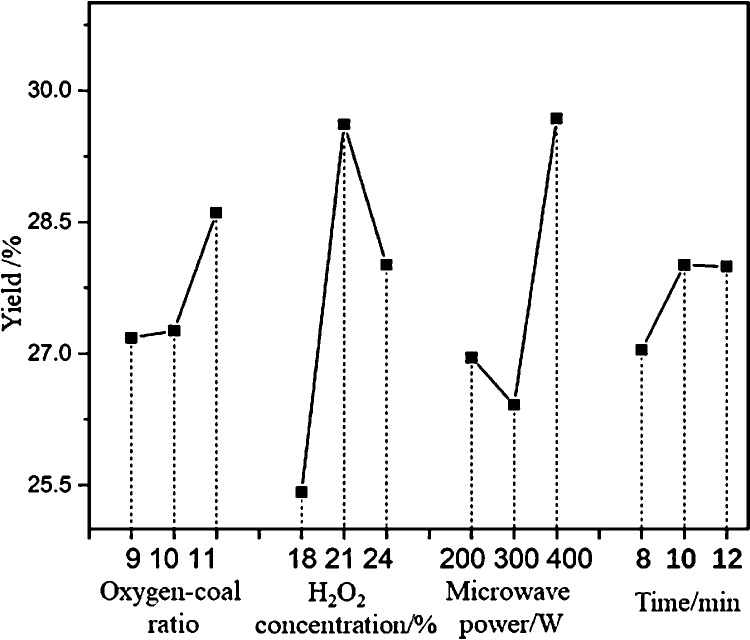
The effects of microwave power, reaction time, the concentration of H2O2, and the ratio of oxygen to coal on the yield of FA were investigated using an orthogonal experimental design. The L9 (34) orthogonal array was used, with the factors and levels shown in Table 2 and the experimental results shown in Table 3.
Table 2. Orthogonal Experiment Factors and Levels for FA Extraction Using H2O2a.
| factor |
||||
|---|---|---|---|---|
| level | A | B | C | D |
| 1 | 9 | 18 | 200 | 8 |
| 2 | 10 | 21 | 300 | 10 |
| 3 | 11 | 24 | 400 | 12 |
Note: A—oxygen–coal ratio; B—H2O2 concentration/%; C—microwave power/W; D—time/min.
Table 3. Orthogonal Experiment Results and Range Analysis for FA Extraction Using H2O2.
| factor |
|||||
|---|---|---|---|---|---|
| number | A | B | C | D | yield/% |
| 1 | 9 | 18 | 200 | 8 | 23.55 |
| 2 | 9 | 21 | 300 | 10 | 28.17 |
| 3 | 9 | 24 | 400 | 12 | 29.82 |
| 4 | 10 | 18 | 300 | 12 | 24.04 |
| 5 | 10 | 21 | 400 | 8 | 30.55 |
| 6 | 10 | 24 | 200 | 10 | 27.19 |
| 7 | 11 | 18 | 400 | 10 | 28.67 |
| 8 | 11 | 21 | 200 | 12 | 30.12 |
| 9 | 11 | 24 | 300 | 8 | 27.03 |
| K1 | 27.180 | 25.420 | 26.953 | 27.043 | |
| K2 | 27.260 | 29.613 | 26.413 | 28.010 | |
| K3 | 28.607 | 28.013 | 29.680 | 27.993 | |
| R | 1.427 | 4.193 | 3.267 | 0.967 | |
Table 3 shows that the yield of FA in the fifth group of experiments was the highest, at 30.55%. As a higher K value indicates higher priority, with KA3 > KA2 > KA1, A3 was the optimal level for factor A; and, by the same token, B2, C3, and D2 were the optimal levels for factors B, C, and D, respectively. Therefore, the optimal level combination for FA was A3B2C3D2; under these conditions, the oxygen–coal ratio was 11, the H2O2 concentration was 21%, the microwave power was 400 W, and the reaction time was 10 min. Because the experimental combination of A3B2C3D2 was not included in the orthogonal experimental scheme, the A3B2C3D2 combination was tested three times with an average FA yield of 31.67%.
As shown in Table 3, the range analysis results of RB > RC > RA > RD showed that the order of influence of the four factors was H2O2 concentration > microwave power > oxygen–coal ratio > reaction time. Orthogonal test results with different parameters are shown in Figure 1, which indicates that increasing the oxygen–coal ratio and microwave power could promote the extraction of FA. When the concentration of H2O2 was too high, the large amounts of •HO and O2– produced may have oxidized and decomposed the generated FA, resulting in its decreased yield.35Figure 1 also shows that with oxygenolysis of the shallow low-rank lignite (SLL), the yield of FA first increased, but as H2O2 did not oxidize the lignite continuously, the yield stabilized.
Figure 1.
Yields of FA under orthogonal experimental conditions.
2.2. Elemental Analysis
As shown in Table 4, the content of C and H in FA was significantly lower than in SLL, while the content of O was significantly higher. The ratios of C to H and C to O in FA were less than 1. The main reason for this was that, under the microwave field, H2O2 destroyed weak covalent bonds such as R–O–R, R–OH, α-H, and so forth. In SLL, this resulted in the cleavage of fatty side chains and other substituents, and many oxygen-containing hydrogen-rich groups were introduced into the molecular structure; alternatively, small oxygen- and hydrogen-rich molecules were formed, such as C=O, −OH, and −COOH, from fragments of the broken alkyl chains.22
Table 4. Elemental Analysis of SLL and FAa.
| elemental
analysis (W %, daf) |
molar
ratio |
||||||
|---|---|---|---|---|---|---|---|
| sample | C | H | N | S | O* | C/H | C/O |
| SLL | 76.20 | 4.25 | 1.7 | 0.39 | 17.46 | 1.49 | 5.82 |
| FA | 40.22 | 3.81 | 1.82 | 0.22 | 53.93 | 0.88 | 0.99 |
Note: *determined by subtraction.
The content of N increased, while S decreased, indicating that microwaves combined with H2O2 could regulate the structure of N- and S-containing components in SLL coal, but whether these components were inorganic salts in SLL or organic molecular structural elements of SLL and FA needs to be further verified.36
2.3. TG Analysis
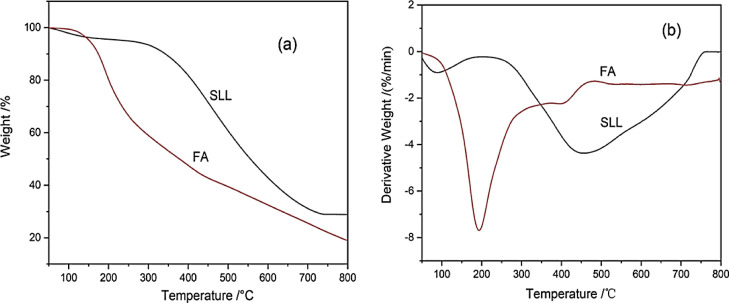
The pyrolysis behavior of SLL and FA at 0–800 °C is shown in Figure 2. The temperature range of 50–100 °C was a common region for SLL and FA, where drying and dehydration occurred. As can be seen from Figure 2a, the weight loss for both SLL and FA was less than 5% at this stage, as water adsorbed on the surface of SLL and FA surface evaporated37 with increasing temperature. Figure 2b shows that the weight loss rate of the FA increased rapidly after 75 °C, indicating that the loss of small molecular substances present in its structure began to accompany the moisture removal. As shown in Figure 2a, from 100–300 °C, the weight loss of SLL was only 4.7%, but FA lost more than 40% weight. The derivative TG (DTG) curve shows a maximum weight loss peak for FA near 200 °C, which was about 250 °C lower than the maximum weight loss peak for SLL (Figure 2b). This showed that FA contained many volatile small molecular compounds with poor thermal stability. At about 400 °C, a nonsignificant weight loss peak appeared in the FA DTG curve, which may have been caused by bridge bond fracture and the decomposition of most oxygen-containing functional groups. At 500 °C, the weight loss rate of FA was basically unchanged at 65% (Figure 2b), which was much higher than that of SLL (Figure 2a); this was because the content of readily pyrolyzed substances in FA was higher than in SLL.38 When the temperature exceeded 600 °C, the pyrolysis reaction entered the final stage.39
Figure 2.
(a) TG and (b) DTG curves of SLL and FA.
2.4. FT-IR Analysis
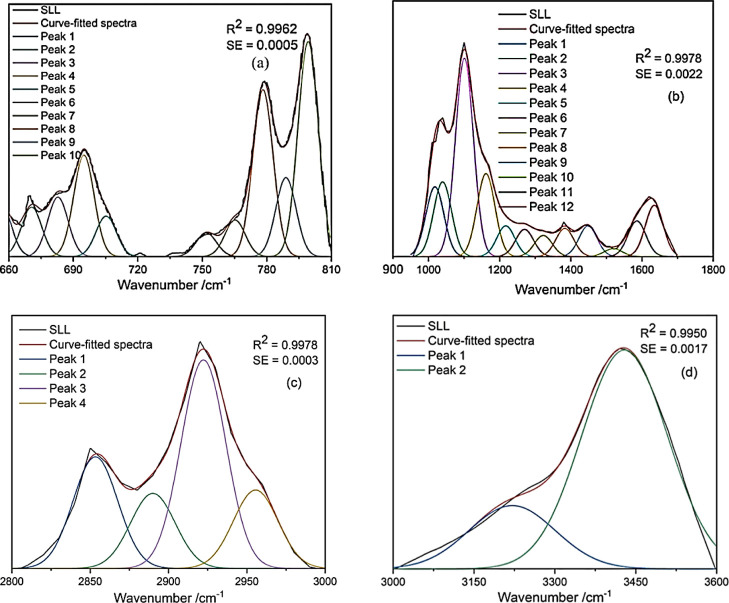
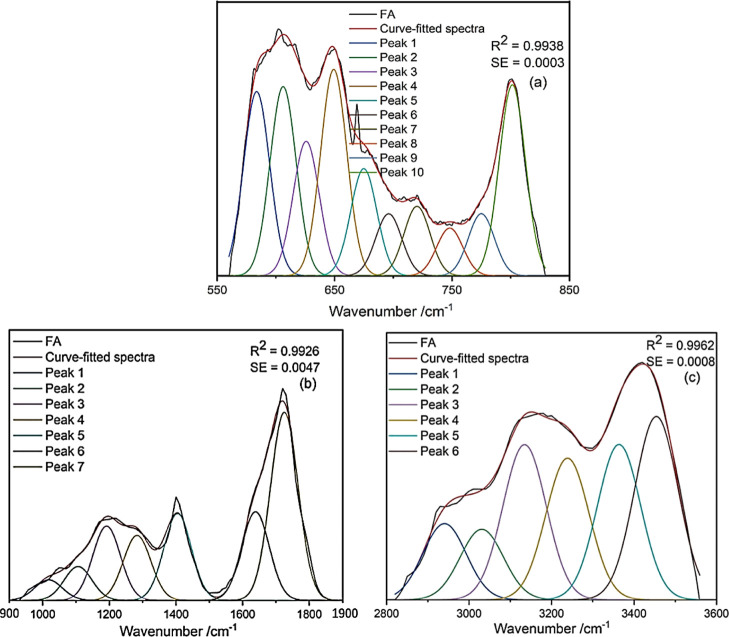
The types and relative content of functional groups in SLL and FA were studied by using qualitative and semi-quantitative FT-IR analysis methods. The IR spectra of SLL and FA were fitted and analyzed in detail by Peakfit V4.12. R2 and SE were used to measure the fitting effect. In order to obtain a better fitting effect, four regions of SLL were fitted and three regions of FA were fitted. Absorption peaks corresponding to functional groups are shown in Figures 3 and 4, and the relative contents of functional groups in each region are shown in Tables 5 and 6. The absorption peaks of SLL and FA could be divided into aromatic ring substituents from 900 to 660 cm–1, oxygen-containing functional groups from 1900 to 1000 cm–1, aliphatic alkyl groups from 3000 to 2700 cm–1, and hydroxyl functional groups from 3600 to 3000 cm–1.40,41
Figure 3.
FT-IR spectrum peak fitting curves for SLL: (a) 660–810; (b) 900–1800; (c) 2800–3000; and (d) 3000–3600 cm–1.
Figure 4.
FT-IR spectrum peak fitting curves for FA: (a) 550–850; (b) 900–1900; and (c) 2800–3600 cm–1.
Table 5. FT-IR Spectrum Peak Attributions for SLL.
| wavenumber range/cm–1 | peak number | wavenumber/cm–1 | area/% | attribution |
|---|---|---|---|---|
| 3600–3000 | 1 | 3429 | 77.58 | phenolic hydroxyl |
| 2 | 3220 | 22.42 | alcohol hydroxyl | |
| 3000–2800 | 1 | 2955 | 16.55 | RCH3 symmetric stretching |
| 2 | 2922 | 44.03 | R1CH2R2 anti-symmetric stretching | |
| 3 | 2889 | 15.85 | RCH3 symmetric stretching | |
| 4 | 2853 | 23.57 | R1CH2R2 symmetric stretching | |
| 1700–900 | 1 | 1634 | 7.79 | COO– anti-symmetric stretching |
| 2 | 1585 | 5.40 | aromatic ring skeleton | |
| 3 | 1519 | 1.20 | aromatic ring skeleton | |
| 4 | 1448 | 4.65 | aromatic ring skeleton | |
| 5 | 1383 | 4.28 | C–O on phenol | |
| 6 | 1322 | 3.20 | C–O on phenol | |
| 7 | 1270 | 4.12 | C–O on phenyl ether | |
| 8 | 1217 | 4.66 | C–O on phenol | |
| 9 | 1161 | 12.61 | C–O on phenyl ether | |
| 10 | 1100 | 30.14 | C–O on aliphatic ether | |
| 11 | 1039 | 11.35 | C–O on acid anhydride | |
| 12 | 1017 | 10.60 | C–O on aliphatic ether | |
| 810–660 | 1 | 799 | 25.93 | tri-substituted aromatics |
| 2 | 788 | 9.52 | tri-substituted aromatics | |
| 3 | 778 | 20.13 | tri-substituted aromatics | |
| 4 | 765 | 4.14 | di-substituted substitutions | |
| 5 | 751 | 2.86 | di-substituted aromatics | |
| 6 | 705 | 4.87 | mono-substituted aromatics | |
| 7 | 694 | 12.25 | mono-substituted aromatics |
Table 6. FT-IR Spectrum Peak Attributions for FA.
| waverange/cm–1 | peak number | wavenumber/cm–1 | area/% | attribution |
|---|---|---|---|---|
| 3600–2800 | 1 | 3454 | 23.44 | phenolic hydroxyl |
| 2 | 3363 | 19.86 | phenolic hydroxyl | |
| 3 | 3238 | 18.11 | alcohol hydroxyl | |
| 4 | 3134 | 19.84 | hydroxyl on carboxylic acids | |
| 5 | 3030 | 9.01 | hydroxyl on carboxylic acids | |
| 6 | 2940 | 9.74 | RCH3 stretching vibration | |
| 1890–850 | 1 | 1725 | 33.79 | C=O on carboxylic acids |
| 2 | 1638 | 15.91 | COO– anti-symmetric stretching vibration | |
| 3 | 1405 | 15.56 | C–O on hydroxyl | |
| 4 | 1283 | 11.66 | C–O on phenyl ether | |
| 5 | 1191 | 13.33 | C–O on aliphatic ether | |
| 6 | 1106 | 6.06 | C–O on aliphatic ether | |
| 7 | 1017 | 3.68 | C–O on acid anhydride | |
| 830–690 | 1 | 801 | 15.23 | tri-substituted aromatics |
| 2 | 774 | 4.96 | di-substituted aromatics | |
| 3 | 748 | 3.81 | di-substituted aromatics | |
| 4 | 720 | 5.54 | di-substituted aromatics | |
| 5 | 696 | 4.95 | mono-substituted aromatics |
Phenolic, alcohol, and carboxylic acid hydroxyl groups were the main types of hydroxyl groups, as shown in Tables 5 and 6 (3600–3000 cm–1). Because of the moisture in the sample, the spectral value of alcohol hydroxyl groups was larger than the actual hydroxyl content in SLL and FA. Figure 4c shows that, near 3030 and 3014 cm–1, FA had a moderate energy band corresponding to −OH stretching vibrations on −COOH. It was determined that the SLL hydroxyl groups were mainly phenolic (77.58%), as were the FA hydroxyl groups (43.3%), but FA also contained a considerable proportion of carboxylic acid hydroxyl groups (28.85%).
The aliphatic structure forms a bridge bond to connect the aromatic part of the molecular structure and various functional groups. As shown in Table 5 (3000–2700 cm–1), RCH3 and R1CH2R2 were the main components of the aliphatic structure in SLL, as indicated by their stretching vibrations. It was inferred that the peaks at 2922 and 2853 cm–1 corresponded to R1CH2R2 anti-symmetric stretching and symmetrical stretching, respectively, and 2889, 2955, and 2940 cm–1 corresponded to symmetrical stretching of RCH3. In SLL, the ratio of R1CH2R2 anti-symmetric stretching to symmetric stretching was 1.871 and the ratio of R1CH2R2 to RCH3 was 2.09.
As shown in Tables 5 and 6 (1900–1000 cm–1), the oxygen-containing functional groups of SLL and FA were mainly carboxyl, acid anhydride, and ether moieties. It can be seen from Figures 3b and 4b that there was a strong energy band corresponding to COO– anti-symmetric stretching vibrations near 1630 cm–1. For FA, carboxylic acid C=O groups appeared at 1725 cm–1 with a relative content of 33.79%, which indicated that there were more carboxyl groups in FA than in SLL. Aliphatic ethers and phenyl ethers are two important types of ethers, and their ratios were 2.44:1 and 1.66:1 for SLL and FA, respectively; thus, the relative content of aliphatic and phenyl ethers was lower in FA than in SLL, which could be explained by the cleavage of C–O bridge bonds during oxygen hydrolysis.
It is also worth noting that aromatic ring skeleton vibrations appeared near 1448, 1519, and 1585 cm–1 in SLL, which showed that SLL had stronger aromaticity than FA. The aromatic moieties of SLL and FA were examined via their characteristic peaks from 900 to 600 cm–1. Tables 5 and 6 show that both SLL and FA had aromatic rings with tri-, di-, and mono-substitution, with relative content of 55.58, 7.00, and 17.12% in SLL, respectively, and 15.23, 14.31, and 4.95% in FA, respectively. Thus, tri-substitution was the main substitution pattern in SLL, while FA mainly had tri- or di-substituted aromatic rings.
Results of FT-IR analysis showed that in the process of extracting FA by H2O2 oxidation of SLL, the content of −COOH, aliphatic alkyl groups decreased, long-chain aliphatic structures decreased, stretching vibrations of aromatic ring skeletons disappeared, and aromatic ring substitution was mainly tri- and di-substitution.
Compared with the structure of FA obtained by alkali-soluble acid precipitation (FA1), microwave-assisted H2O2 had a better oxygen hydrolysis effect on macromolecules and aromatic structures in the SLL. FA had fewer aromatic structures and lower molecular weight and had stronger absorption peaks than FA1 at 1660 and 1081 cm–1. The band at 1660 cm–1 was attributed to the C=C vibrations of aromatic structures, conjugated with C=O. The band at 1081 cm–1 was attributed to C–O stretching, indicating the presence of polysaccharide or polysaccharide-like compounds.24,28 Compared with FA obtained without H2O2 oxygenolysis (FA2), FA had a wider band near 1100 cm–1 arising from tensile vibrations of C–O. This indicated that the oxygenation process with H2O2 increased the content of C–O.23
2.5. Fluorescence Spectroscopy
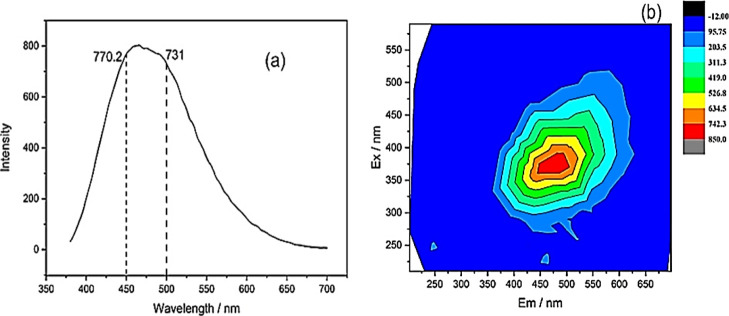
As shown in Figure 5a, there was a strong fluorescence peak at 465 nm and the fluorescence intensity reached 804. This indicated that the complex structure of FA was composed of a variety of groups with fluorescent characteristics, and the superposition of multiple peaks led to the high intensity and wide shape of the fluorescence peak. The fluorescence index (f450/500) refers to the ratio of the fluorescence intensities emitted by the sample at 450 and 500 nm when the fixed excitation wavelength was 370 nm, which reflects the aromaticity of the structure.42 As this value is negatively correlated with aromaticity, the f450/500 value of 1.05 indicated that FA has low aromaticity.
Figure 5.
(a) Fluorescence emission spectrum and (b) three-dimensional excitation emission matrix fluorescence spectrum contour map of FA.
The three-dimensional fluorescence spectrum of FA is shown in Figure 5b. It was clear that FA had only one fluorescence peak, positioned at λEx/Em = 360–393/443–498 nm. The peak appeared similar to an HA fluorescence peak, and it was considered that the appearance of the peak was related to the rich carboxyl and carbonyl groups in the material structure. This confirmed the presence of many carboxyl and carbonyl groups in FA.43
2.6. XPS Analysis
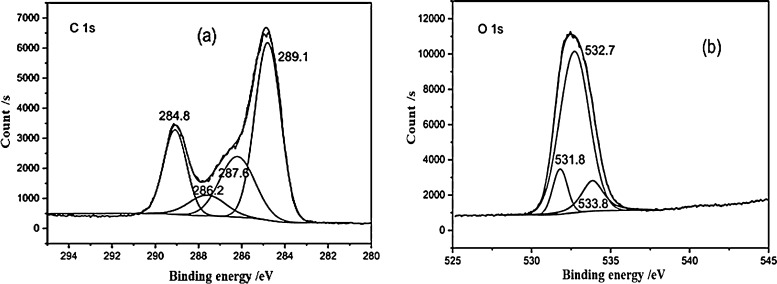
Data were fitted and analyzed in detail by Peakfit V4.12 (Figure 6). According to the XPS C 1s data given in Table 7, of the four forms in which carbon was found on the FA surface, the highest content was carbon in the form of C–H and C–C, corresponding to binding energy of 284.8 eV, and the relative content was 48.5%. This was followed by carbon in the form of C–O–, including C–OH and C–O–C, with a total relative content of 22.7%. The content of carbon in the form of COO– was slightly less than that of C–O, accounting for about 20%, indicating that FA contained a large proportion of COO–. There was least C=O carbon in FA, only 8.1%, indicating that C=O carbon made up only a small amount relative to the content of COO– carbon.
Figure 6.
(a) C 1s and (b) O 1s spectra of FA.
Table 7. XPS Results for FA, Including Binding Energies, fwhm, and Relative Percentages (Area).
| binding energy/eV | fwhm/eV | area/% | compound | |
|---|---|---|---|---|
| C 1s | 284.8 | 1.4 | 48.5 | C–C, C–H |
| 286.2 | 1.9 | 22.7 | C–O | |
| 287.6 | 2.0 | 8.1 | C=O | |
| 289.1 | 1.3 | 20.7 | COO– | |
| O 1s | 531.8 | 1.1 | 10.6 | C=O |
| 532.7 | 2.2 | 75.9 | C–O– | |
| 533.8 | 1.6 | 13.5 | COO– |
The oxygen elements identified via XPS O 1s mainly existed in three forms: C=O, C–O, and COO–. The relative content of C–O was the highest at 75.9%, followed by COO–, and then C=O, confirming the XPS C 1s results, which indicated that FA contains more C–O and COO– than C=O.
3. Conclusions
With the assistance of microwave energy, high-yield FA was obtained by oxidation of SLL with H2O2. Elemental analysis, TG analysis, and FT-IR showed that •OH and O2– produced by H2O2 caused SLL to undergo aromatic ring opening under the microwave field, destroying the long alkyl chains and aromatic structure of SLL. The obtained FA had low aromaticity and short molecular chains and was rich in functional groups such as −COOH and C–O. Fluorescence spectroscopy and XPS showed that the content of oxygen-containing functional groups in FA was C–O > −COO > C=O. Compared with the traditional method of extracting FA with alkali and acid, this process has advantages of a high extraction yield, environmentally friendly reagents, and process simplicity. Through characterization, it was determined that coal-based FA is a low molecular weight substance rich in −COOH and C–O. This work provides an effective method for the efficient utilization of low-rank coal and lays a foundation for in-depth understanding of coal-based FA molecules.
4. Experimental Section
4.1. Materials and Methods
Reagents were all analytically pure, and the mass fraction of H2O2 was 30%. The coal sample was SLL from the eastern mining area of Inner Mongolia, which was dried at 80 °C for 24 h.
SLL (2 g) and a certain concentration H2O2 solution were placed in a microwave chemical reactor to react at a certain microwave power. The reaction mixture was then filtered, and the filtrate was concentrated by a rotary evaporator. The concentrated filtrate was dried in a blast drying box at 60 °C to obtain solid FA. The yield of FA was calculated according to eq 1, where η is the yield of FA, m1 is the mass of FA, and m0 is the mass of SLL.
| 1 |
The source of SLL and the reaction device are shown in Figure 7. The FA obtained was purified by the sulfuric acid-acetone method.40
Figure 7.
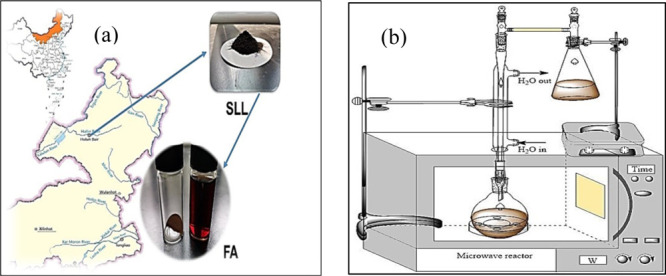
(a) Coal and FA (solid and liquid) samples and (b) reaction device.
4.2. Characterization
Elemental analysis was performed using a Kaiyuan 5e-CHN2000 and 5E-S3200, and the fluorescence index of FA was measured using a Hitachi F4600 fluorescence spectrophotometer with a fixed excitation wavelength of 370 nm. The state of C and O on the surface of FA was determined by photoelectron spectroscopy using a Thermo Fisher ESCALAB 250Xi X-ray photoelectron spectrometer. TG and DTG curves of SLL and FA at the heating rate of 5 min/°C were measured by a Netzsch TG–DSC synchronous thermal analyzer. Infrared spectra of SLL and FA were measured on a Bruker VERTEX 80v Fourier transform infrared spectrometer, and the infrared spectrum data between 500 and 4000 cm–1 were obtained.
Acknowledgments
This work was supported by the National Nature Science Foundation of China (grants 21776299 and 21576281), China Coal Industry Association Scientific and Technological Guidance Project (grants MTKJ2015-220 and MTKJ2012-288), and China University of Mining and Technology teaching reform project for postgraduate education (2019YJSJG043, YJSJG-2018-01). The authors are grateful to Advanced Analysis & Computation Center, China University of Mining and Technology for providing the testing services for this work.
Author Contributions
§ G.G. and L.X. contributed equally to this work and both of them are the co-first author.
The authors declare no competing financial interest.
References
- Piccolo A.Dissolved Humus in Soil Waters; Piccolo A., Ed.; Elsevier Science B.V.: Amsterdam, 1996. [Google Scholar]
- Zhang A.; Zhang Y. J.; Zheng H. L.; Ma L. L.; Liu W. J.; Gong G. Q. Study on the extraction of fulvic acid from lignite by microwave-assisted hydrogen peroxide. Int. J. Oil Gas Coal Technol. 2018, 18, 146–162. 10.1504/ijogct.2018.091557. [DOI] [Google Scholar]
- Doskočil L.; Grasset L.; Válková D. Hydrogen peroxide oxidation of humic acids and lignite. Fuel 2014, 134, 406–413. 10.1016/j.fuel.2014.06.011. [DOI] [Google Scholar]
- Zsolnay A.Dissolved Humus in Soil Waters; Piccolo A., Ed.; Elsevier Science B.V.: Amsterdam, 1996. [Google Scholar]
- Rodríguez F. J. Characterization of aquatic humic substances. Water Environ. J. 2011, 25, 163–170. 10.1111/j.1747-6593.2009.00205.x. [DOI] [Google Scholar]
- Amir S.; Hafidi M.; Merlina G.; Revel J.-C. Structural characterization of fulvic acids during composting of sewage sludge. Process Biochem. 2005, 40, 1693–1700. 10.1016/j.procbio.2004.06.037. [DOI] [Google Scholar]
- Klencsár Z.; Köntös Z. EPR analysis of Fe(3+) and Mn(2+) complexation sites in fulvic acid extracted from lignite. J. Phys. Chem. A 2018, 122, 3190–3203. 10.1021/acs.jpca.8b00477. [DOI] [PubMed] [Google Scholar]
- Abdel-Baky Y. R.; Abouziena H. F.; Amin A. A.; Elsh M. R. Improve quality and productivity of some faba bean cultivars with foliar application of fulvic acid. Bull. Natl. Res. Cent. 2019, 43, 1–11. 10.1186/s42269-018-0040-3. [DOI] [Google Scholar]
- Ali S.; Bharwana S. A.; Rizwan M.; Farid M.; Kanwal S.; Ali Q.; Ibrahim M.; Gill R. A.; Khan M. D. Fulvic acid mediates chromium (Cr) tolerance in wheat (Triticum aestivum L.) through lowering of Cr uptake and improved antioxidant defense system. Environ. Sci. Pollut. Res. 2015, 22, 10601–10609. 10.1007/s11356-015-4271-7. [DOI] [PubMed] [Google Scholar]
- Priya B. N. V.; Mahavishnan K.; Gurumurthy D. S.; Bindumadhava H.; Ambika P.; Sharma N. K. Fulvic acid (FA) for enhanced nutrient uptake and growth: insights from biochemical and genomic studies. J. Crop Improv. 2014, 28, 740–757. [Google Scholar]
- Ali S.; Rizwan M.; Waqas A.; Hussain M. B.; Hussain A.; Liu S.; Alqarawi A. A.; Hashem A.; Abd Allah E. F. Fulvic Acid Prevents Chromium-induced Morphological, Photosynthetic, and Oxidative Alterations in Wheat Irrigated with Tannery Waste Water. J. Plant Growth Regul. 2018, 37, 1357–1367. 10.1007/s00344-018-9843-6. [DOI] [Google Scholar]
- Jayasooriya R. G. P. T.; Dilshara M. G.; Kang C.-H.; Lee S.; Choi Y. H.; Jeong Y. K.; Kim G.-Y. Fulvic acid promotes extracellular anti-cancer mediators from RAW 264.7 cells, causing to cancer cell death in vitro. Int. Immunopharmacol. 2016, 36, 241–248. 10.1016/j.intimp.2016.04.029. [DOI] [PubMed] [Google Scholar]
- Rashid I.; Murtaza G.; Zahir Z. A.; Farooq M. Effect of humic and fulvic acid transformation on cadmium availability to wheat cultivars in sewage sludge amended soil. Environ. Sci. Pollut. Res. 2018, 25, 16071–16079. 10.1007/s11356-018-1821-9. [DOI] [PubMed] [Google Scholar]
- Zhao P.-Y.; Zhang J.; Li Q.; Wang C.-Y. Electrochemical performance of fulvic acid-based electrospun hard carbon nanofibers as promising anodes for sodium-ion batteries. J. Power Sources 2016, 334, 170–178. 10.1016/j.jpowsour.2016.10.029. [DOI] [Google Scholar]
- Tsuda K.; Mori H.; Asakawa D.; Yanagi Y.; Kodama H.; Nagao S.; Yonebayashi K.; Fujitake N. Characterization and grouping of aquatic fulvic acids isolated from clear-water rivers and lakes in Japan. Water Res. 2010, 44, 3837–3846. 10.1016/j.watres.2010.04.038. [DOI] [PubMed] [Google Scholar]
- Jiang T.; Han G.; Zhang Y.; Huang Y.; Li G.; Guo Y.; Yang Y. Improving extraction yield of humic substances from lignite with anthraquinone in alkaline solution. J. Cent. S. Univ. Technol. 2011, 18, 68–72. [Google Scholar]
- Gondar D.; Lopez R.; Fiol S.; Antelo J. M.; Arce F. Characterization and acid–base properties of fulvic and humic acids isolated from two horizons of an ombrotrophic peat bog. Geoderma 2005, 126, 367–374. 10.1016/j.geoderma.2004.10.006. [DOI] [Google Scholar]
- Baigorri R.; Fuentes M.; Gonzàlez-Gaitano G.; García-Mina J. M.; Almendros G.; Gonzàlez-Vila F. J. Complementary multianalytical approach to study the distinctive structural features of the main humic fractions in solution: gray humic acid, brown humic acid, and fulvic acid. J. Agric. Food Chem. 2009, 57, 3266–3272. 10.1021/jf8035353. [DOI] [PubMed] [Google Scholar]
- Litvin V. A.; Minaev B. F.; Baryshnikov G. V. Synthesis and properties of synthetic fulvic acid derived from hematoxylin. J. Mol. Struct. 2015, 1086, 25–33. 10.1016/j.molstruc.2014.12.091. [DOI] [Google Scholar]
- Fong S. S.; Seng L.; Majri N. B.; Mat H. B. A comparative evaluation on the oxidative approaches for extraction of humic acids from low rank coal of mukah, sarawak. J. Braz. Chem. Soc. 2007, 18, 34–40. 10.1590/s0103-50532007000100003. [DOI] [Google Scholar]
- Yang Z.; Gong L.; Ran P. Preparation of nitric humic acid by catalytic oxidation from Guizhou coal with catalysts. Int. J. Min. Sci. Technol. 2012, 22, 75–78. 10.1016/j.ijmst.2011.06.006. [DOI] [Google Scholar]
- Mae K.; Maki T.; Araki J.; Miura K. Extraction of low-rank coals oxidized with hydrogen peroxide in conventionally used solvents at room temperature. Energy Fuels 1997, 11, 825–831. 10.1021/ef960225o. [DOI] [Google Scholar]
- Romarís-Hortas H. V.; Moreda P. A.; Bermejo-Barrera P. Application of microwave energy to speed up the alkaline extraction of humic and fulvic acids from marine sediments. Anal. Chim. Acta 2007, 602, 202–210. 10.1016/j.aca.2007.09.022. [DOI] [PubMed] [Google Scholar]
- Khanna R.; Witt M.; Anwer M. K.; Agarwal S. P.; Koch B. P. Spectroscopic characterization of fulvic acids extracted from the rock exudate Shilajit. Org. Geochem. 2008, 39, 1719–1724. 10.1016/j.orggeochem.2008.08.009. [DOI] [Google Scholar]
- Yao Z.-S.; Wei X.-Y.; Lv J.; Liu F.-J.; Huang Y.-G.; Xu J.-J.; Chen F.-J.; Huang Y.; Li Y.; Lu Y.; Zong Z.-M. Oxidation of Shenfu Coal with RuO4 and NaOCl. Energy Fuels 2010, 24, 1801–1808. 10.1021/ef9012505. [DOI] [Google Scholar]
- Isoda T.; Takagi H.; Kusakabe K.; Morooka S. Structural Changes of Alcohol-Solubilized Yallourn Coal in the Hydrogenation over a Ru/Al2O3 Catalyst. Energy Fuels 1998, 12, 503–511. 10.1021/ef9701394. [DOI] [Google Scholar]
- Raposo J. C.; Villanueva U.; Olivares M.; Madariaga J. M. Determination of humic substances in sediments by focused ultrasound extraction and ultraviolet visible spectroscopy. Microchem. J. 2016, 128, 26–33. 10.1016/j.microc.2016.04.004. [DOI] [Google Scholar]
- Javed S.; Kohli K.; Ali M. Microwave-Assisted Extraction of Fulvic Acid from a Solid Dosage Form: a Statistical Approach. J. Pharm. Innov. 2013, 8, 175–186. 10.1007/s12247-013-9157-y. [DOI] [Google Scholar]
- Ding M.; Zhao Y.-P.; Dou Y.-Q.; Wei X.-Y.; Fan X.; Cao J.-P.; Wang Y.-L.; Zong Z.-M. Sequential extraction and thermal dissolution of Shengli lignite. Fuel Process. Technol. 2015, 135, 20–24. 10.1016/j.fuproc.2014.09.031. [DOI] [Google Scholar]
- Li Z.-K.; Wei X.-Y.; Yan H.-L.; Wang Y.-G.; Kong J.; Zong Z.-M. Advances in Lignite Extraction and Conversion under Mild Conditions. Energy Fuels 2015, 29, 6869–6886. 10.1021/acs.energyfuels.5b01108. [DOI] [Google Scholar]
- Yang F.; Hou Y.; Wu W.; Liu Z. The generation of benzene carboxylic acids from lignite and the change in structural characteristics of the lignite during oxidation. Fuel 2017, 203, 214–221. 10.1016/j.fuel.2017.04.096. [DOI] [Google Scholar]
- Doskočil L.; Enev V.; Pekař M.; Wasserbauer J. The spectrometric characterization of lipids extracted from lignite samples from various coal basins. Org. Geochem. 2016, 95, 34–40. 10.1016/j.orggeochem.2016.02.008. [DOI] [Google Scholar]
- Feng L.; Yuan C.; Mao L.; Yan C.; Jiang X.; Liu J.; Liu X. Water occurrence in lignite and its interaction with coal structure. Fuel 2019, 219, 288–295. 10.1016/j.fuel.2018.01.097. [DOI] [Google Scholar]
- Wang Z.; Shui H.; Pan C.; Li L.; Ren S.; Lei Z.; Kang S.; Wei C.; Hu J. Structural characterization of the thermal extracts of lignite. Fuel Process. Technol. 2014, 120, 8–15. 10.1016/j.fuproc.2013.11.017. [DOI] [Google Scholar]
- Ju Y.; Yang S.; Ding Y.; Sun C.; Gu C.; He Z.; Qin C.; He H.; Xu B. Microwave-enhanced H2O2-based process for treating aqueous malachite green solutions: Intermediates and degradation mechanism. J. Hazard. Mater. 2009, 171, 123–132. 10.1016/j.jhazmat.2009.05.120. [DOI] [PubMed] [Google Scholar]
- Ahnonkitpanit E.; Prasassarakich P. Coal desulphurization in aqueous hydrogen peroxide. Fuel 1989, 68, 819–824. 10.1016/0016-2361(89)90114-2. [DOI] [Google Scholar]
- Ponte D. G.; Prieto I. F.; Viar P. F.; Luengo J. C. G. Determination of moisture content in power station coal using microwaves. Fuel 1996, 75, 133–138. 10.1016/0016-2361(95)00250-2. [DOI] [Google Scholar]
- Guan Y.; Ma Y.; Zhang K.; Chen H.; Xu G.; Liu W.; Yang Y. Co-pyrolysis behaviors of energy grass and lignite. Energy Convers. Manage. 2015, 93, 132–140. 10.1016/j.enconman.2015.01.006. [DOI] [Google Scholar]
- Song Y.; Tahmasebi A.; Yu J. Co-pyrolysis of pine sawdust and lignite in a thermogravimetric analyzer and a fixed-bed reactor. Bioresour. Technol. 2014, 174, 204–211. 10.1016/j.biortech.2014.10.027. [DOI] [PubMed] [Google Scholar]
- Zhang Y.; Liu W.; Hu X.; Zhang A.; Ma L.; Shi Y.; Gong G. Extraction and Functional Group Characterization of Fulvic Acid from Hami Lignite. ChemistrySelect 2019, 4, 1448–1455. 10.1002/slct.201803291. [DOI] [Google Scholar]
- Gong G.; Zhao Y.; Zhang Y.; Deng B.; Liu W.; Wang M.; Yuan X.; Xu L. Establishment of a molecular structure model for classified products of coal-based fulvic acid. Fuel 2020, 267, 117210. 10.1016/j.fuel.2020.117210. [DOI] [Google Scholar]
- Zhao J.; Xi B.; Xu Q.; Zhao Y.; Wei Z.; Xu J.; Zhao X. Study on fluorescence characteristics of fulvic acid in sediments of Xingkai Lake. Spectrosc. Spect. Anal. 2013, 33, 1824–1828. 10.3964/j.issn.1000-0593(2013)07-1824-05. [DOI] [PubMed] [Google Scholar]
- Zou Y.; Lu R.; Yang J. Three-dimensional excitation emission matrix fluorescence spectroscopic characterization of dissolved organic matter in coal mine water. J. Coal Sci. Eng. 2012, 28, 174–177. [PubMed] [Google Scholar]


