Abstract
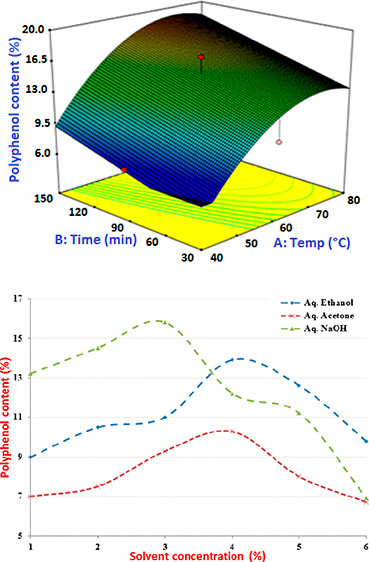
Juniper berry is an important medicinal plant used in pharmaceutical and petrochemical industries thanks to its strong antioxidant potential, which is attributed to the presence of phenolic compounds. In this study, four different solvents, namely, aqueous acetone, aqueous ethanol, aqueous NaOH, and water, were used in the extraction process with a view to optimize and determine the polyphenolic contents in the juniper berry using ultraviolet (UV) spectrophotometry. Many experiments were performed at different solvent concentrations, time, temperature, and liquid–solid ratio. The models to evaluate the effects and the optimum of these variables on the polyphenols extraction using the response surface methodology (RSM) were developed. The predicted values of the polyphenol content of juniper berry were thus highly correlated with costly measured values (SECV = 0.14 and R2 = 0.97), and the optimal conditions of extraction were determined for the different solvents. Following the numerical optimization, the maximum predicted polyphenol contents obtained under the optimum extraction conditions are as follows: 17.57% for 58 °C extraction temperature, 78.5 min extraction time, 60% acetone concentration, and 29.8 liquid–solid ratio for the aqueous ethanol extraction; 20.68% for 71.46 °C extraction temperature, 79.2 min extraction time, 21.9% ethanol concentration, and 26.4:1 liquid–solid ratio for the aqueous acetone extraction; 34.51% for 96.4 °C extraction temperature, 37.7 min extraction time, 1.48% NaOH concentration, and 15.2:1 liquid–solid ratio for the aqueous NaOH extraction; and 9.8% was obtained under the optimum extraction conditions of 69 °C extraction temperature, 126 min extraction time, and 23:1 liquid–solid ratio for the water extraction. The GC–MS analysis of the chemical composition of juniper Berry revealed 60 identified components that represent 97.43% of the sample. The predominant fraction was monoterpene representing 80.87% especially for α-pinene (39.12%), β-pinene (12. 68%), and myrcene (12.92%). In the other fraction of sesquiterpene representing 16.54%, the predominant components were β-caryophyllene (4.41%) and germacrene D (4.23%).
1. Introduction
Medicinal plants are largely used in various pharmaceutical and petrochemical industries. They are rich in bioactive compounds especially polyphenols that can contribute to improving human health. Thanks to their antioxidant properties and multiple biological activities, there is a growing interest in the research of polyphenols.1−4 Numerous studies have shown that polyphenols in the juniper berry mostly comprise of flavonoids. Such compounds have antioxidant activities, which could scavenge free radicals, prevent free-radical formation, and prevent lipid peroxidation.5−8 Many of the phenolic compounds have been determined by the liquid chromatography–mass spectrometer in the Juniperus species found in Mediterranean countries. However, relatively less information is available regarding their phenolic content.9 The major challenge affecting the juniper berry utilization for treating antioxidant production is that samples from various sources have to be analyzed for their chemical constituents each time in order to use it appropriately.10,11 The classical chemical analytical methods are time-consuming and costly; there is, therefore, the need for a rapid and inexpensive method of determination.12 In spite of the publication of numerous research reports, juniper berry has not known worldwide commercial applications, especially in the Mediterranean countries. One of the main reasons is the low extracted content of the phenolic compounds, due to inappropriate extraction technologies and the high reactivity of such compounds.13,14 A detailed literature survey showed that of the several process variables that affect the extraction of polyphenol from juniper,15,16 only a few have been studied. In such cases, a sizeable number of factors had been studied; they were varied one at a time,17 making it impossible to investigate their interaction effects.18−22 The objectives of the study were to rapidly determine the quantities of phenolics in juniper using UV–visible spectroscopy and to optimize the extraction of phenolics from juniper using the response surface methodology (RSM) and select the adequate models for the determination of the polyphenols content for the experiments performed in the research project RG-20 101.
2. Materials and Methods
The classical spectrophotometry ultraviolet (UV)–visible method is widely used to measure total phenolic content in plant materials and wastewater. This method is based on the chemical reduction of polyphenols in an alkaline medium to form a blue chromophore complex that can be quantified by visible light spectrophotometry at 760–765 nm.10,11 Many studies have been elaborated on the advantages and disadvantages of routinely using this method. Moreover, most of them seem to agree that although these methods are easy to perform, low cost, and applicable in most laboratories, they remain not sufficiently accurate.23 In addition, the reagents used in the UV–visible method do not react specifically with only polyphenols; instead, they react with any reducing substance like ascorbic acid and aromatic amines.10 Consequently, many researchers have chosen to use this method as an indicative tool of total reduction capacity and not for specific quantification. However, these methods stay considered useful for quick and prior screening of numerous samples, and for many applications, a simple measure of the total amount of polyphenols is enough.10−13 juniper berries were obtained from plantation stands. They were dried at 30 °C for 48 h in a convection oven, ground in a Wiley mill to the 100–250 μm particle size, sealed in a plastic bag, and stored at room temperature in order to ensure the minimum change or variability between samples used for extraction experiments and to avoid degradation of phenolic compounds. The chemicals used were of analytical grade (>97%) and all were procured from Sigma–Aldrich.
Two grams of dried powder of the sample was macerated in 20 mL of solvent. The extraction was carried out in a shaking incubator (ROTINA 380R centrifuge, Hettich) at 5000 rpm. The organic phases were collected for further analysis. The colorimetric reaction was monitored via UV spectrophotometry (Shimadzu) and the Folin–Ciocalteau reagent was used as an oxidizing agent.
The experimental design was divided into two major parts. First, single-factor experiments were performed to determine the appropriate range of conditions for phenolic extraction from juniper berry, namely, extraction temperature, extraction time, solvent composition, solid–liquid ratio, and a number of extraction stages. Each independent variable was varied over a range, whilst keeping the others constant. Second, the optimization of phenolic compound extraction was carried out using the RSM.24−27 For this study, the Box-Behnken factorial design of RSM was used to evaluate the optimum level and interaction effects of four major influencing factors on the content of polyphenol viz., extraction temperature (T), extraction time (t), solvent composition (C), and liquid–solid ratio (V) using aqueous acetone, aqueous ethanol, aqueous sodium hydroxide, and water extractions. The range and levels of the variables along with the experimental design observed and predicted have been represented, and a polynomial equation was adopted to evaluate the effect of each independent variable on the response.
The percentage of polyphenolic content of juniper berries is obtained from a literature review.15 The meaningful interpretation of calibration results depends greatly on the accuracy and precision of the wet chemical analysis of the samples. The polyphenol content varied from 9.2–15.4% with a mean and standard deviation of 11.82% and 1.15%, respectively.15,16
The calibration model for the polyphenol content was accurate with R2 = 0.96, and the slope of the calibration curve was close to 1.0, indicating a good calibration and prediction. This curve will be used for all experiments performed in research project RG-20 101.
3. Results and Discussion
3.1. Results from Single-Factor Extraction Experiments
At the beginning of this study, the essential factors, namely, the liquid–solid ratio, extraction temperature, solvent concentration, and time of contact, were investigated to determine the appropriate experimental ranges, which were then used for the optimization process.
3.1.1. Selection of the Solvent Concentration Range
For the efficient extraction, the polarity of the extraction solvent should closely match that of the target compounds, and mixing solvents of different polarities can be used to extract a broad range of compounds. In this study, the percentage of the phenolic compounds in the extracts increased with the increasing concentration of organic solvent in water. The phenolic content reached a maximum when the acetone and ethanol concentrations were each 60% (Figure 1).
Figure 1.
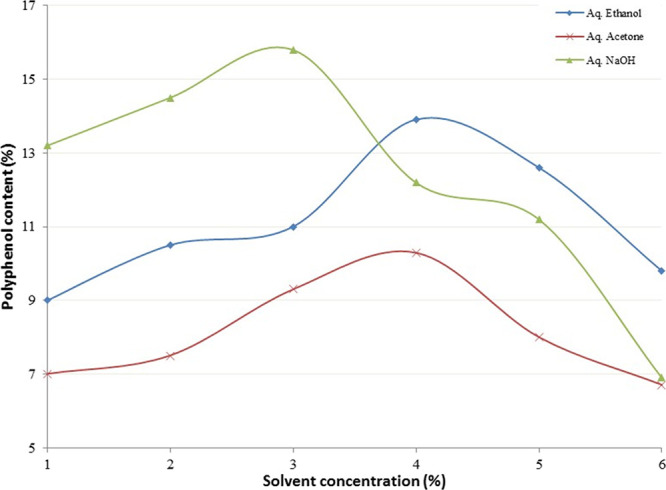
Effect of extraction solvent concentration (aq ethanol/acetone: 1 = 10%, 2 = 20%, 3 = 40%, 4 = 60%, 5 = 80%, and 6 = 100%; aq NaOH: 1 = 0.05%, 2 = 0.1%, 3 = 0.2%, 4 = 0.5%, 5 = 1.5%, and 6 = 2%) on polyphenol content.
In the industrial process, low boiling solvents like acetone and ethanol are easy to use and cheaper to recover. Consequently, 80 and 100% concentrations for both solvents were included in the optimization process. In the case of aqueous NaOH, concentrations beyond 1.5% contained lower amounts of phenolics than that obtained for the least concentrated solvent. Hence, the concentration range of 0.05 to 1.5 was selected for the optimization process.
3.1.2. Selection of Liquid–Solid Ratio Range
Using 60% aqueous ethanol as the solvent at a temperature of 80 °C for 60 min extraction time (Figure 2) showed that if ratios were chosen above 30:1, where a maximum of 14.2% polyphenol content was obtained, then the quantity of phenolic compounds extracted remained the same or fell off.
Figure 2.
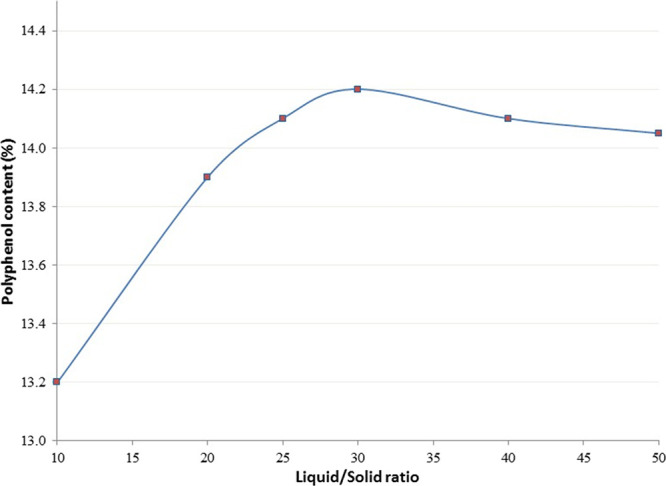
Effect of the liquid–solid ratio on polyphenol content.
The high solubility of polyphenols in hydroalcoholic solutions, especially in a glycosidic linkage, may explain the absence of significant variability at the higher ratios. As a result, the liquid–solid ratio ranging from 10 to 30 was chosen for the optimization design.
3.1.3. Selection of Extraction Time Range
Many samples can retain analytes within pores or other structures. Increasing the contact time at high temperatures can allow these compounds to diffuse into the extraction solvent. Figure 3 presents the amount of polyphenol extracted from juniper berry using different extraction times. For all the solvents except aq NaOH, an extraction time around 150 min resulted in the highest polyphenol content. However, an extraction time of 90 min was noted for aq NaOH.
Figure 3.
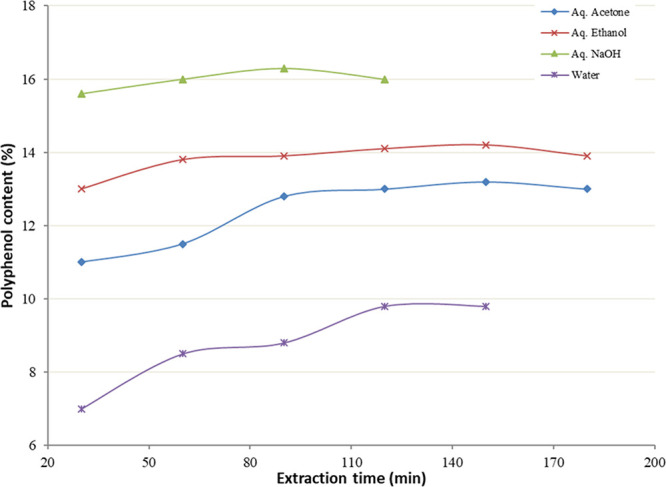
Effect of extraction time on polyphenol content.
Longer extraction time decreased the total polyphenol extracted, possibly because of some loss of phenolic compounds via oxidation and these products might polymerize into insoluble compounds. Again, Fick’s second law of diffusion estimates that final equilibrium among the solute concentrations in the solid matrix and in the bulk solution will be attained after a certain period.18−21 Therefore, the range of extraction time chosen for the optimization study was 30 to 150 min.
It must be noted that the polyphenol content from the aqueous acetone extraction was significantly higher than that of the water extraction. This could probably be due to the hydrolytic nature of water that aids the breaking of phenolic bonds and the acetone possibly being available to ensure effective contact with the phenolic compounds and extract them into solution. A similar reason could be given to aqueous ethanol, which was also found to give higher polyphenol content than water.
3.1.4. Selection of the Extraction Temperature Range
If the temperature is increased, the viscosity of the solvent is reduced, thereby increasing the ability to solubilize the target analytes; the added thermal energy also assists in breaking analyte bonds and increase diffusion to the surface. In this study, increasing the aqueous acetone and aqueous ethanol extraction temperatures to 55 and 70 °C, respectively, resulted in the maximum amount of polyphenols extracted (Figure 4). Similarly, temperatures of 90 °C resulted in the maximum amount of polyphenols in the case of water and aqueous NaOH extractions. Hence, for each solvent, the temperature range chosen for the optimization process was from the minimum temperature in the study to the temperature where the maximum polyphenol content was obtained.
Figure 4.
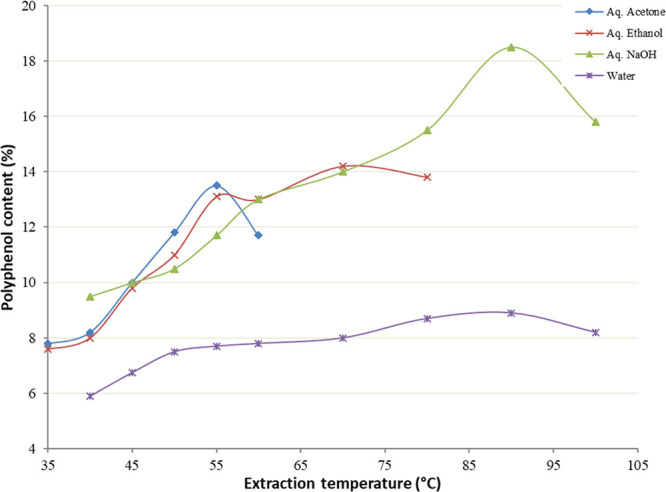
Effect of the extraction temperature on polyphenol content.
3.1.5. Selection of the Extraction Stage
Using 60% aqueous ethanol as a solvent with a liquid-to-solid ratio of 20 at a temperature of 80 °C for a 60 min extraction time, the maximum polyphenol content (18.2%) was obtained with a triple-stage extraction. This was not significantly different from the triple-stage extraction (18%) but significantly different from the single-stage extraction (13.8%) (Figure 5). Operating single-stage extractions in multiple cycles result in limited content gains but substantial increases in cost and time. In this study, repeating the single-stage extraction twice improves the extraction content from 13.8 to 17% but doubles the running time and the solvent volume. A higher extract volume increases the cost of energy used in extraction operations. Moreover, single-stage extraction was fixed for the optimization process.
Figure 5.
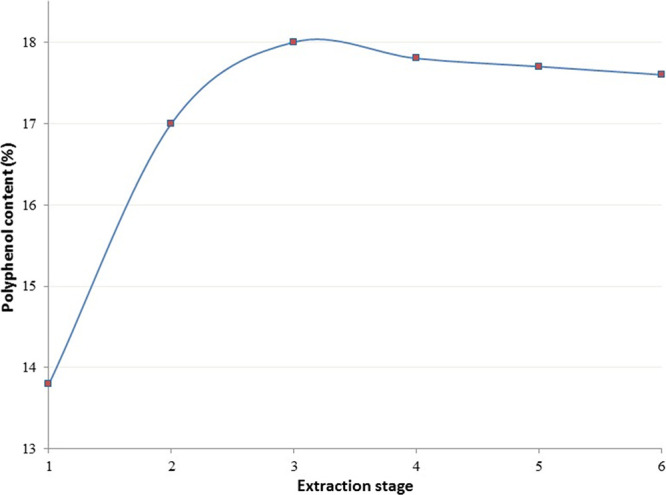
Effect of extraction stage number on polyphenol content.
3.2. Optimization of Extraction Conditions Based on Maximizing Polyphenol Content by the RSM
To analyze the process of solvent extraction of phenolic compounds and to determine the optimum operating conditions, the RSM was used to assess the optimum extraction conditions for each solvent. The range and levels of the variables along with the experimental design have been represented in Table 1.
Table 1. Codes and Actual Levels of the Independent Variables for the Design of the Experiment.
| code
levels |
||||||
|---|---|---|---|---|---|---|
| independent variables | symbols | –2 | –1 | 0 | 1 | 2 |
| extraction temperature (°C) | T | 40 | 45 | 50 | 55 | 60 |
| extraction time (min) | t | 30 | 60 | 90 | 120 | 150 |
| solvent composition (%) | C | 20 | 40 | 60 | 80 | 100 |
| liquid–solid ratio | V | 10 | 15 | 20 | 25 | 30 |
The polynomial models for the estimation of polyphenol content (Y) in terms of extraction temperature (T), extraction time (t), solvent composition (C), and liquid–solid ratio (V) using aqueous acetone, aqueous ethanol, aqueous sodium hydroxide, and water extractions were fitted as in eqs 1–4. For each extraction, the objective function was to maximize the percentage of polyphenol content.
| 1 |
| 2 |
| 3 |
| 4 |
For each of the approximating functions in eqs 1–4, the analysis of variance shows a model F value to be 4.76, 12.92, 2.81, and 5.42, respectively. The model R2 of the approximating functions were different from each other, with the Yethanol function having the highest R2 value of 0.82 followed by Ywater, Yhydroxide, and Yacetone with respective R2 values of 0.74, 0.62, and 0.45 (Table 2). This implies that each model is validated and can be used in the studied range.25
Table 2. Analysis of Variance of Optimization Models When Polyphenol Content Is Maximized Using Different Solventsa.
| solvent | source | sum of squares | df | mean square | F value | p value (prob > F) |
|---|---|---|---|---|---|---|
| aqueous ethanol | model | 286.97 | 7 | 41 | 12.92 | <0.0001 |
| S.D. | 1.78 | R2 | 0.8189 | |||
| mean | 14.36 | |||||
| CV % | 12.41 | |||||
| aqueous acetone | model | 78.17 | 4 | 19.54 | 4.76 | 0.0061 |
| S.D. | 2.03 | R2 | 0.4527 | |||
| mean | 10.45 | |||||
| CV % | 19.4 | |||||
| aqueous NaOH | model | 288.31 | 10 | 28.83 | 2.81 | 0.0296 |
| S.D. | 3.21 | R2 | 0.6227 | |||
| mean | 24.5 | |||||
| CV % | 13.08 | |||||
| water | model | 2.22 | 6 | 0.37 | 5.42 | 0.0078 |
| S.D. | 0.26 | R2 | 0.7474 | |||
| mean | 9.04 | |||||
| CV % | 2.88 |
S.D.: standard deviation; CV %: coefficient of variance; F value: Fisher’s statistical value; p value: probability value; df: degree of freedom.
The extraction design variables effect on the polyphenol content in actual and predicted values using aqueous acetone as the extraction solvent is given in Table 3. The results of the ANOVA and model coefficients are calculated and presented in Table 2. The response surface plots between the aqueous acetone extraction time and temperature are shown in Figure 6a. The content of polyphenol increased at higher extraction temperatures and time at a constant solvent concentration and liquid–solid ratio of 60% and 20:1, respectively. At a temperature of 51 °C and 96 min extraction time, the polyphenol content was 11.4%, and the maximum polyphenol content of 16% occurred at 60 °C and 149 min extraction temperature and time.
Table 3. Comparison of Experimental and Predicted Values Using Box–Behnken Design for the Four Independent Variables on the Content of Polyphenol from Aqueous Acetone Extraction.
| extraction temperature (°C) | extraction time (min) | solvent composition (%) | liquid–solid ratio | experimental value (%) | predicted value (%) | |
|---|---|---|---|---|---|---|
| test N | T | t | C | V | content | eq 1 |
| 1 | 50 | 90 | 20 | 20 | 9 | 9.61 |
| 2 | 50 | 90 | 100 | 20 | 10 | 10.23 |
| 3 | 50 | 90 | 60 | 20 | 13 | 10.11 |
| 4 | 45 | 120 | 40 | 25 | 13 | 12.57 |
| 5 | 50 | 150 | 60 | 20 | 13 | 13.57 |
| 6 | 50 | 90 | 60 | 20 | 10 | 10.23 |
| 7 | 55 | 120 | 40 | 25 | 9 | 8.61 |
| 8 | 55 | 120 | 80 | 15 | 12 | 14.19 |
| 9 | 50 | 90 | 60 | 10 | 7 | 10.11 |
| 10 | 55 | 60 | 40 | 25 | 8 | 9.61 |
| 11 | 45 | 120 | 40 | 15 | 8 | 10.23 |
| 12 | 45 | 120 | 80 | 15 | 7 | 8.52 |
| 13 | 60 | 90 | 60 | 20 | 9 | 7.90 |
| 14 | 45 | 60 | 80 | 25 | 14 | 14.19 |
| 15 | 50 | 30 | 60 | 20 | 10 | 8.52 |
| 16 | 55 | 60 | 80 | 25 | 13 | 11.11 |
| 17 | 55 | 60 | 40 | 15 | 12 | 10.23 |
| 18 | 45 | 120 | 80 | 25 | 11 | 11.73 |
| 19 | 55 | 60 | 80 | 15 | 9 | 8.61 |
| 20 | 50 | 90 | 60 | 30 | 7 | 8.73 |
| 21 | 40 | 90 | 60 | 20 | 13 | 12.69 |
| 22 | 50 | 90 | 60 | 20 | 15 | 12.69 |
| 23 | 45 | 60 | 40 | 15 | 12 | 10.23 |
| 24 | 45 | 60 | 40 | 25 | 7 | 7.02 |
| 25 | 45 | 60 | 80 | 15 | 11 | 10.23 |
| 26 | 55 | 120 | 40 | 15 | 7 | 7.02 |
| 27 | 55 | 120 | 80 | 25 | 11 | 11.11 |
| 28 | 50 | 90 | 60 | 20 | 6 | 6.90 |
Figure 6.
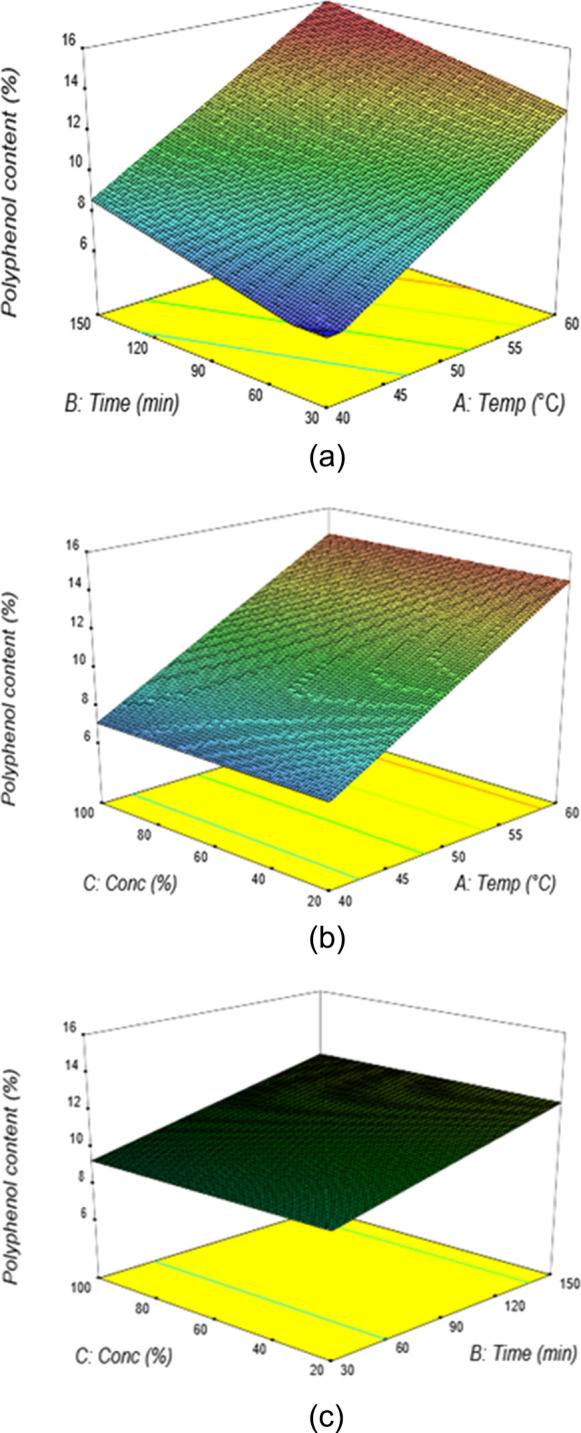
(a) Response surface plots showing the percentage of polyphenol content from aqueous acetone extraction at varying extraction temperatures and extraction times (C = 60%, V = 20). (b) Response surface plots showing the percentage of polyphenol content from aqueous acetone extraction at varying solvent concentrations and extraction temperatures (t = 90 min, V = 20). (c) Response surface plots showing the percentage of polyphenol content from aqueous acetone extraction at varying solvent concentrations and extraction times (T = 50 °C, V = 20).
The effects of acetone concentration and extraction temperature on the polyphenol content are illustrated in the response surface at the constant extraction time and liquid–solid ratio of 90 min and 20:1, respectively (Figure 6b). It showed that an increase in the acetone concentration at a high extraction temperature resulted in a gradual increase in the polyphenol content. At a solvent concentration of 52% and an extraction temperature of 54 °C, the percentage of polyphenol content was found to be 12.2%. The responses observed for the effect of the extraction time and solvent concentration at a fixed temperature of 60 °C and a liquid–solid ratio of 20 indicated that a general direction of increased time ensures maximum polyphenol content, whilst the concentration has no significant effect (Figure 6c). At a solvent concentration of 55% and extraction time of 71 min, the percentage of polyphenol content was found to be 10.3%. Using numerical optimization, the maximum predicted polyphenol content of 17.57% was obtained under the optimum extraction conditions of 58 °C extraction temperature, 78.5 min extraction time, 60% acetone concentration, and the 29.8 liquid–solid ratio. The same results are obtained in the literature review.15,25
The extraction design variables effect on the polyphenol content in actual and predicted values using aqueous ethanol as the extraction solvent is given in Table 4. The results of the ANOVA and model coefficients are presented in Table 2. The response surface plots between the aqueous ethanol extraction time and temperature are shown in Figure 7a. The percentage content of polyphenol increased at higher extraction temperatures and time at the constant solvent concentration and liquid–solid ratio of 60% and 20:1, respectively. At a temperature of 53.2 °C and 78.4 min extraction time, the polyphenol content was 12.7%, and the maximum polyphenol content of 18.9% occurred at 74 °C and 149 min extraction temperature and time, respectively. The effects of ethanol concentration and extraction temperature on the polyphenol content are illustrated in the response surface at the constant extraction time and liquid–solid ratio of 50 min and 20:1, respectively (Figure 7b). It showed that an increase in the ethanol concentration at a high extraction temperature resulted in a gradual increase in the polyphenol content. At a solvent concentration of 61.2% and an extraction temperature of 53.4 °C, the percentage of the polyphenol content was found to be 13.3%.
Table 4. Comparison of Experimental and Predicted Values Using the Box-Behnken Design for the Four Independent Variables on the Content of Polyphenol from Aqueous Ethanol Extraction.
| extraction temperature (°C) | extraction time (min) | solvent composition (%) | liquid–solid ratio | experimental value (%) | predicted value (%) | |
|---|---|---|---|---|---|---|
| test N | T | t | C | V | content | eq 2 |
| 1 | 60 | 90 | 20 | 20 | 12 | 15.15 |
| 2 | 60 | 90 | 100 | 20 | 12 | 15.47 |
| 3 | 60 | 90 | 60 | 20 | 10 | 15.31 |
| 4 | 50 | 120 | 40 | 25 | 19 | 12.58 |
| 5 | 60 | 150 | 60 | 20 | 14 | 17.77 |
| 6 | 60 | 90 | 60 | 20 | 13 | 15.31 |
| 7 | 70 | 120 | 40 | 25 | 14 | 20.16 |
| 8 | 70 | 120 | 80 | 15 | 16 | 16.31 |
| 9 | 60 | 90 | 60 | 10 | 13 | 11.90 |
| 10 | 70 | 60 | 40 | 25 | 19 | 19.50 |
| 11 | 50 | 120 | 40 | 15 | 10 | 10.97 |
| 12 | 50 | 120 | 80 | 15 | 20 | 13.53 |
| 13 | 80 | 90 | 60 | 20 | 13 | 16.89 |
| 14 | 50 | 60 | 80 | 25 | 19 | 14.48 |
| 15 | 60 | 30 | 60 | 20 | 18 | 12.85 |
| 16 | 70 | 60 | 80 | 25 | 17 | 17.26 |
| 17 | 70 | 60 | 40 | 15 | 14 | 14.29 |
| 18 | 50 | 120 | 80 | 25 | 15 | 15.14 |
| 19 | 70 | 60 | 80 | 15 | 10 | 12.05 |
| 20 | 60 | 90 | 60 | 30 | 16 | 18.72 |
| 21 | 40 | 90 | 60 | 20 | 16 | 6.53 |
| 22 | 60 | 90 | 60 | 20 | 15 | 15.31 |
| 23 | 50 | 60 | 40 | 15 | 13 | 6.71 |
| 24 | 50 | 60 | 40 | 25 | 19 | 11.92 |
| 25 | 50 | 60 | 80 | 15 | 12 | 9.27 |
| 26 | 70 | 120 | 40 | 15 | 15 | 18.55 |
| 27 | 70 | 120 | 80 | 25 | 17 | 17.92 |
| 28 | 60 | 90 | 60 | 20 | 12 | 15.31 |
Figure 7.
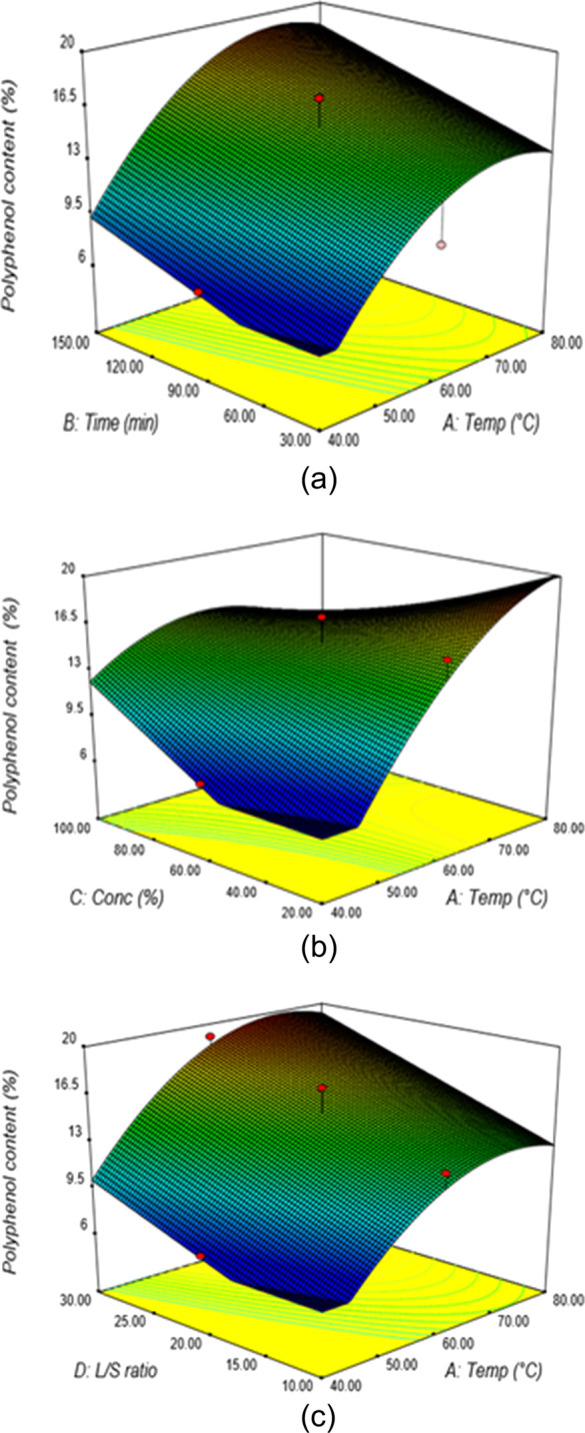
(a) Response surface plots showing the percentage of polyphenol content from aqueous ethanol extraction at varying extraction temperatures and times (C = 60%, V = 20). (b) Response surface plots showing the percentage of polyphenol content from aqueous ethanol extraction at varying solvent concentrations and extraction temperatures (t = 90 min, V = 20). (c) Response surface plots showing the percentage of polyphenol content from aqueous ethanol extraction at varying liquid–solid ratios and extraction temperatures (t = 90, C = 60%).
The responses observed for the effect of the extraction temperature and liquid–solid ratio at a fixed time of 90 min and a solvent concentration of 60% indicated that a general direction of increased temperature and liquid–solid ratio ensures maximum polyphenol content (Figure 7c). At a liquid–solid ratio of 20.3:1 and an extraction temperature of 57 °C, the percentage of the polyphenol content was found to be 14.5%. From the numerical optimization, the maximum predicted polyphenol content of 20.68% was obtained under the optimum extraction conditions of 71.46 °C extraction temperature, 79.2 min extraction time, 21.9% ethanol concentration, and the 26.4:1 liquid–solid ratio. The same results are obtained in the literature review.6
The extraction design variables impact on the polyphenol content in actual and predicted values using aqueous NaOH as the extraction solvent is given in Table 5, with the results of the ANOVA and model coefficients presented in Table 2. The response surface plots between the aqueous NaOH concentration and extraction temperature are shown in Figure 8a. The percentage content of polyphenol increased at higher concentrations and extraction temperatures at the constant extraction time and liquid–solid ratio of 52.5 min and 20:1, respectively. At a temperature of 69 °C and 1.2% solvent concentration, the polyphenol content was 25.5%, and the maximum polyphenol content of 34.5% occurred at 100 °C and 1.5% extraction temperature and concentration, respectively.
Table 5. Comparison of Experimental and Predicted Values Using the Box-Behnken Design for the Four Independent Variables on the Content of Polyphenol from Aqueous NaOH Extraction.
| extraction temperature (°C) | extraction time (min) | solvent composition (%) | liquid–solid ratio | experimental value (%) | predicted value (%) | |
|---|---|---|---|---|---|---|
| test N | T | t | C | V | content | eq 3 |
| 1 | 80 | 45 | 0.05 | 20 | 20 | 19.73 |
| 2 | 80 | 45 | 1.50 | 20 | 28 | 27.01 |
| 3 | 80 | 45 | 0.50 | 20 | 28 | 25.10 |
| 4 | 60 | 60 | 0.10 | 25 | 27 | 27.01 |
| 5 | 80 | 90 | 0.50 | 20 | 28 | 22.19 |
| 6 | 80 | 45 | 0.50 | 20 | 23 | 27.32 |
| 7 | 90 | 60 | 0.10 | 25 | 26 | 24.85 |
| 8 | 90 | 60 | 1.00 | 15 | 27 | 23.56 |
| 9 | 80 | 45 | 0.50 | 10 | 26 | 24.75 |
| 10 | 90 | 30 | 0.10 | 25 | 18 | 27.21 |
| 11 | 60 | 60 | 0.10 | 15 | 27 | 24.85 |
| 12 | 60 | 60 | 1.00 | 15 | 30 | 27.32 |
| 13 | 100 | 45 | 0.50 | 20 | 27 | 24.75 |
| 14 | 60 | 30 | 1.00 | 25 | 21 | 23.56 |
| 15 | 80 | 15 | 0.50 | 20 | 23 | 23.56 |
| 16 | 90 | 30 | 1.00 | 25 | 24 | 24.55 |
| 17 | 90 | 30 | 0.10 | 15 | 25 | 23.56 |
| 18 | 60 | 60 | 1.00 | 25 | 19 | 23.56 |
| 19 | 90 | 30 | 1.00 | 15 | 28 | 27.21 |
| 20 | 80 | 45 | 0.50 | 30 | 25 | 23.56 |
| 21 | 40 | 45 | 0.50 | 20 | 28 | 25.34 |
| 22 | 80 | 45 | 0.50 | 20 | 25 | 24.55 |
| 23 | 60 | 30 | 0.10 | 15 | 33 | 32.81 |
| 24 | 60 | 30 | 0.10 | 25 | 15 | 19.73 |
| 25 | 60 | 30 | 1.00 | 15 | 22 | 24.12 |
| 26 | 90 | 60 | 0.10 | 15 | 25 | 22.19 |
| 27 | 90 | 60 | 1.00 | 25 | 18 | 20.01 |
| 28 | 80 | 45 | 0.50 | 20 | 20 | 22.03 |
Figure 8.
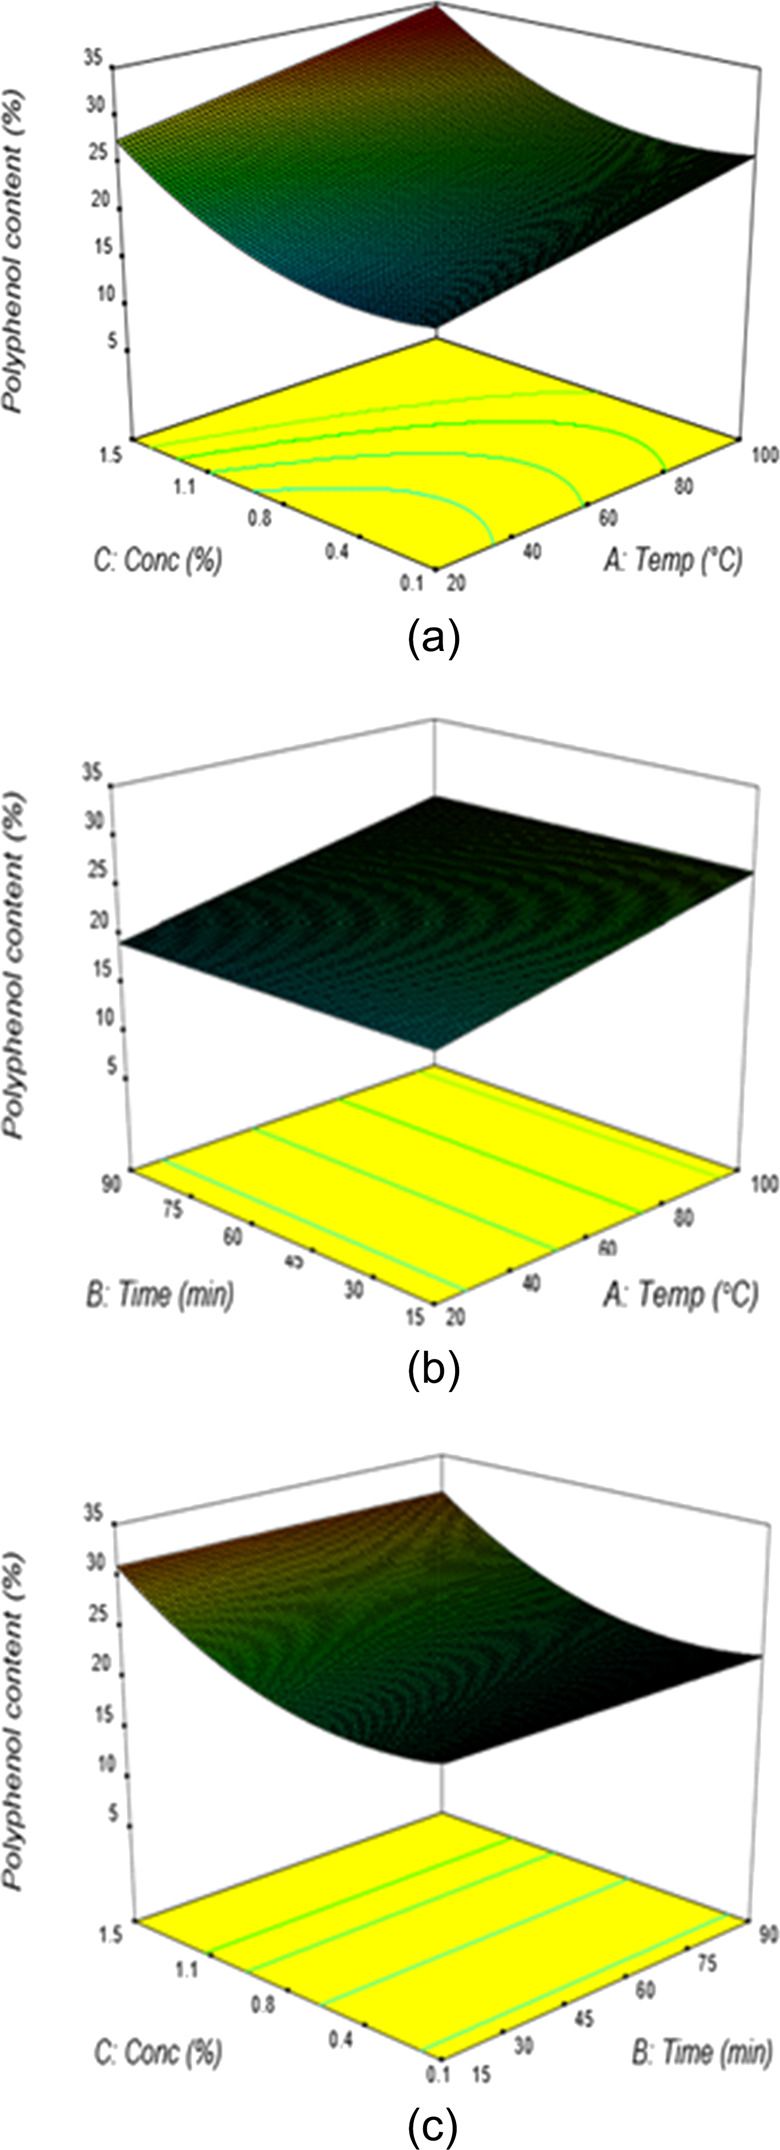
(a) Response surface plots showing the percentage of polyphenol content from aqueous NaOH extraction at varying solvent concentrations and extraction temperatures (t = 52 min, V = 20). (b) Response surface plots showing the percentage of polyphenol content from aqueous NaOH extraction at varying extraction temperatures and times (C = 0.78%, V = 20). (c) Response surface plots showing the percentage of polyphenol content from aqueous NaOH extraction at varying solvent concentrations and extraction times (T = 60 °C, V = 20).
The effects of time and extraction temperature on polyphenol content are illustrated in the response surface at the constant concentration and liquid–solid ratio of 0.78% and 20:1, respectively (Figure 8b).
It showed that the content of polyphenol was less affected by time and slightly increased by increasing the temperature when the concentration and liquid–solid ratio were kept constant at 0.78% and 20, respectively. At an extraction temperature of 31 °C and time of 41 min, the percentage of polyphenol content was found to be 20.3%. The responses observed for the effect of the extraction time and solvent concentration at a fixed temperature of 60 °C and a liquid–solid ratio of 20 indicated that a general direction of increased concentration ensures maximum polyphenol content, whilst time has less effect (Figure 8c). At an extraction time of 51 min and concentration of 1%, the percentage of polyphenol content was found to be 24.8%. From the numerical optimization, the maximum predicted polyphenol content of 34.51% was obtained under the optimum extraction conditions of 96.4 °C extraction temperature, 37.7 min extraction time, 1.48% NaOH concentration, and the 15.2:1 liquid–solid ratio. The same results are obtained in the literature review.6,26
The extraction design variables effect on the polyphenol content in actual and predicted values using water as the extraction solvent is given in Table 6. The results of the ANOVA and model coefficients are presented in Table 2. The response surface plots between the extraction time and liquid–solid ratio are shown in Figure 9a. The percentage content of polyphenol increased at higher extraction temperatures and liquid–solid ratio at the constant temperature of 70 °C. At an extraction time of 73.6 min and a 21.6:1, liquid–solid ratio, the polyphenol content was 9.1%, and the maximum polyphenol content of 10.7% occurred at 148 min and the 30:1 liquid–solid ratio.
Table 6. Comparison of Experimental and Predicted Values Using the Box-Behnken Design for the Four Independent Variables on the Content of Polyphenol from Water Extraction.
| extraction temperature (°C) | extraction time (min) | liquid–solid ratio | experimental value (%) | predicted value (%) | |
|---|---|---|---|---|---|
| test N | T | t | V | content | eq 4 |
| 1 | 80 | 90 | 20 | 9.5 | 9.83 |
| 2 | 90 | 120 | 25 | 9.5 | 9.43 |
| 3 | 80 | 90 | 10 | 9.4 | 9.19 |
| 4 | 90 | 60 | 15 | 8.6 | 8.79 |
| 5 | 90 | 90 | 30 | 8.6 | 8.65 |
| 6 | 80 | 90 | 20 | 9.4 | 9.19 |
| 7 | 90 | 60 | 25 | 8.5 | 8.57 |
| 8 | 60 | 60 | 15 | 8.9 | 8.95 |
| 9 | 100 | 90 | 20 | 8.8 | 8.89 |
| 10 | 90 | 120 | 15 | 8.8 | 8.92 |
| 11 | 80 | 30 | 20 | 9.8 | 9.46 |
| 12 | 40 | 90 | 20 | 8.4 | 8.66 |
| 13 | 60 | 120 | 15 | 9.2 | 9.03 |
| 14 | 80 | 90 | 20 | 9.4 | 9.19 |
| 15 | 60 | 120 | 25 | 9.1 | 9.22 |
| 16 | 80 | 150 | 20 | 9.4 | 9.19 |
| 17 | 80 | 90 | 20 | 9.2 | 9.27 |
| 18 | 60 | 60 | 25 | 8.6 | 8.36 |
Figure 9.
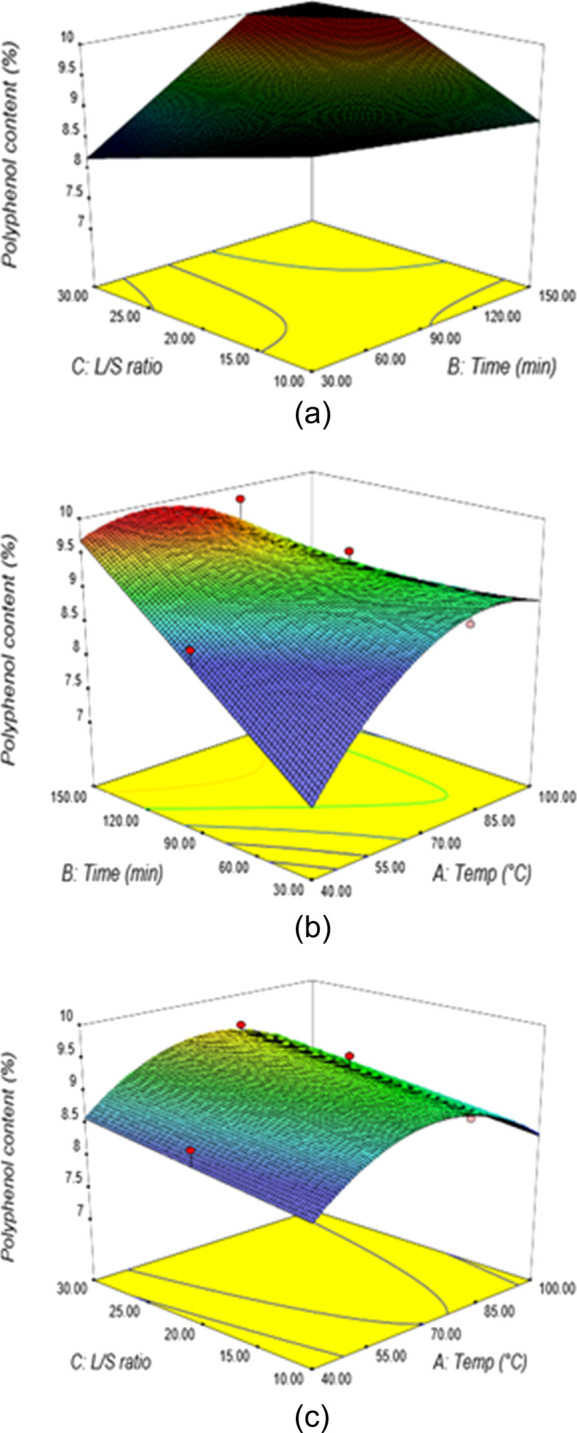
(a) Response surface plots showing the percentage of polyphenol content from water extraction at varying liquid–solid ratios and extraction times (T = 70 °C). (b) Response surface plots showing the percentage of polyphenol content from water extraction at varying extraction temperatures and times (V = 20). (c) Response surface plots showing the percentage of polyphenol content from water extraction at varying liquid–solid ratios and extraction temperatures (t = 90 min).
The effects of time and extraction temperature on the polyphenol content are illustrated in the response surface plots at the constant liquid–solid ratio of 20:1 (Figure 9b). It shows that an increase in the extraction time and temperature resulted in the increased polyphenol content. At an extraction temperature and time of 56.1 °C and 75.8 min, respectively, the polyphenol content was found to be 8.8%. The responses observed for the effect of the extraction temperature and liquid–solid ratio at a fixed time of 90 min indicated that an increase in temperature ensures maximum polyphenol content (Figure 9c). At an extraction temperature of 51.7 °C and liquid–solid ratio of 16.4:1, the polyphenol content was found to be 8.8%. From the numerical optimization, the maximum predicted polyphenol content of 9.8% was obtained under the optimum extraction conditions of 69 °C extraction temperature, 126 min extraction time, and a 23:1 liquid to solid ratio.
3.3. Identification and Quantification of the Chemical Composition by the GC–MS Analysis
The GC–MS analysis was performed utilizing a GCMS-QP2010 (Shimadzu, Japan) on a fused silica capillary column (30 m × 0.32 mm) with a bonded stationary phase (5%-diphenyl-95%-dimethyl). The film thickness of the stationary phase was 0.25 μm. The temperature program was set at 2 min at 60 °C, and then from 60 to 280 °C at 12 °C/min, the injector temperature was 280 °C. The carrier gas helium with the split ratio of 1:17 and a flow rate of 1.8 mL/min was utilized.
The components were identified by comparing their GC relative retention times (RT), linear retention indices (RI), and the MS fragmentation pattern of a single compound with those from the NIST mass spectra libraries. Furthermore, the relative contents of the sample components were computed as the average of the GC peak areas obtained in triplicate. A mixture of a homologous series of aliphatic hydrocarbons C9–C25 was directly injected into GC–MS under the abovementioned conditions to calculate the retention indices of the peaks in the chromatogram. The samples were collected from Zaghouan (Tunisia), and the standards used in the analysis were from Fisher Scientific.
By the means of the GC–MS method, the juniper berry samples were analyzed and 60 different components were identified (Table 7).
Table 7. Chemical Compositions of Juniper Berry Analyzed by GC–MS.
| pic N | identification | retention time (RT) | linear retention index (RI) | percentage (%) |
|---|---|---|---|---|
| 1 | tricyclene | 3.17 | 918 | 0.07 |
| 2 | α-thujene | 3.26 | 924 | 0.79 |
| 3 | α-pinene | 3.42 | 933 | 39.12 |
| 4 | α-fenchene | 3.63 | 946 | tr |
| 5 | camphene | 3.65 | 947 | 0.24 |
| 6 | thuja-2,4(10)-diene | 3.74 | 953 | 0.01 |
| 7 | sabinene | 4.10 | 975 | 8.87 |
| 8 | β-pinene | 4.17 | 979 | 12.68 |
| 9 | myrcene | 4.45 | 996 | 12.92 |
| 10 | α-phellandrene | 4.69 | 1009 | 0.15 |
| 11 | Δ3-carene | 4.69 | 1009 | 0.15 |
| 12 | α-terpinene | 4.87 | 1020 | 0.37 |
| 13 | para-cymene | 5.07 | 1030 | 0.16 |
| 14 | limonene | 5.10 | 1032 | 2.23 |
| 15 | β-phellandrene | 5.13 | 1034 | 0.43 |
| 16 | trans-β-ocimene | 5.46 | 1052 | 0.01 |
| 17 | γ-terpinene | 5.64 | 1062 | 0.69 |
| 18 | cis-sabinene hydrate | 6.00 | 1082 | 0.01 |
| 19 | terpinolene | 6.11 | 1088 | 0.67 |
| 20 | para-cymenene | 6.33 | 1100 | 0.02 |
| 21 | linalool | 6.65 | 1113 | 0.07 |
| 22 | α-campholenal | 7.16 | 1132 | 0.03 |
| 23 | trans-pinocarveol | 7.56 | 1147 | 0.03 |
| 24 | camphor | 7.68 | 1151 | tr |
| 25 | borneol | 8.40 | 1178 | tr |
| 26 | terpinen-4-ol | 8.68 | 1189 | 0.88 |
| 27 | para-cymen-8-ol | 9.19 | 1205 | tr |
| 28 | α-terpineol | 9.34 | 1209 | 0.12 |
| 29 | verbenone | 9.71 | 1217 | tr |
| 30 | carvacrol methyl ether | 10.81 | 1242 | 0.03 |
| 31 | bornyl acetate | 12.72 | 1285 | 0.12 |
| 32 | α-cubebene | 15.68 | 1337 | 0.39 |
| 33 | α-copaene | 17.35 | 1363 | 0.43 |
| 34 | β-elemene | 18.60 | 1382 | 0.77 |
| 35 | sibirene | 19.17 | 1391 | 0.18 |
| 36 | β-caryophyllene | 20.28 | 1407 | 4.41 |
| 37 | β-copaene | 21.10 | 1417 | 0.05 |
| 38 | γ-elemene | 21.51 | 1421 | 0.15 |
| 39 | aromadendrene | 21.51 | 1421 | 0.15 |
| 40 | cis-β-farnesene | 22.56 | 1434 | 0.07 |
| 41 | α-humulene | 22.98 | 1439 | 1.05 |
| 42 | trans-β-farnesene | 24.19 | 1454 | 0.45 |
| 43 | γ-muurolene | 24.66 | 1460 | 0.09 |
| 44 | germacrene D | 25.25 | 1467 | 4.23 |
| 45 | β-selinene | 25.76 | 1473 | 0.19 |
| 46 | α-selinene | 25.94 | 1475 | 0.08 |
| 47 | eremophilene | 27.17 | 1490 | 0.3 |
| 48 | α-muurolene | 27.31 | 1492 | 0.3 |
| 49 | γ-cadinene | 28.19 | 1502 | 0.41 |
| 50 | δ-cadinene | 28.89 | 1512 | 1.35 |
| 51 | α-cadinene | 29.94 | 1526 | 0.07 |
| 52 | germacrene B | 31.60 | 1549 | 1.34 |
| 53 | caryophyllene oxide | 33.44 | 1574 | 0.02 |
| 54 | α-cedrol | 35.17 | 1598 | tr |
| 55 | τ-cadinol | 37.28 | 1645 | 0.03 |
| 56 | τ-muurolol | 37.41 | 1648 | 0.03 |
| 57 | α-muurolol | 37.54 | 1651 | tr |
| 58 | α-cadinol | 37.65 | 1654 | tr |
| 59 | meta-camphorene | 46.74 | 1949 | 0.02 |
| 60 | para-camphorene | 47.46 | 1978 | 0.01 |
The composition was dominated by monoterpenes (α-pinene: 39.12%, sabinene: 8.87%, β-pinene: 12.68%, myrcene: 12.92%, limonene: 2.23%) and sesquiterpenes (β-caryophyllene: 4.41%, α-humulene: 1.05%, germacrene D: 4.23%, δ-cadinene: 1.35%, germacrene B: 1.34%).
The present study shows that the composition of the juniper berries is rich in monoterpenes. Comparing the composition with the results obtained from various regions in Europe and other Mediterranean countries28−30 indicates the variation in the amounts of several constituents, especially for monoterpene components. This is attributed to some factors like geographical location, degree of ripeness, age, etc.31−33
4. Conclusions
For a rapid and accurate determination of the total polyphenolic content in juniper berry, the colorimetric reaction was measured by UV spectrophotometry (model Shimadzu), and the Folin–Ciocalteau reagent was used as an oxidizing agent. It was found that the Box-Behnken design of experiments adequately represents the extraction of the polyphenols from the juniper using aqueous acetone, aqueous ethanol, aqueous NaOH, and water as the extracting solvents. A good correlation between the responses, along with the extraction design variables mainly temperature, time, solvent concentration, and liquid–solid ratio, have been studied in an attempt to optimize the polyphenol content that will be suitable for polyphenol–formaldehyde resins, pharmaceutical, and petrochemical applications. The obtained models will be used in the estimation of the polyphenol content during the different tasks of the project RG-20 101.
The predicted values of the polyphenol content of juniper were highly correlated with the costly measured values of polyphenol content (R2 = 0.97); the polyphenol content of juniper varied from 9.2–15.4% with a mean and standard deviation of 11.82 and 1.15%, respectively. Finally, the optimal conditions of extraction were determined for various solvents employed in this study.
The GC–MS analysis of the chemical composition of juniper berry revealed 60 identified components that represent 97.43% of the sample. The predominant fraction was monoterpene representing 80.87% especially for α-pinene (39.12%), β-pinene (12. 68%), and myrcene (12.92%). In the other fraction of sesquiterpene representing 16.54%, the predominant components were β-caryophyllene (4.41%) and germacrene D (4.23%).
Acknowledgments
This research has been funded by the Research Deanship of University of Ha’il, Saudi Arabia, through the Project RG-20 101.
Supporting Information Available
The Supporting Information is available free of charge at https://pubs.acs.org/doi/10.1021/acsomega.0c03396.
Actual vs predicted values for calibrations estimating polyphenol content (Figure S1) (PDF)
Author Contributions
N.E. supervised the project and conceived the study. The GC–MS analysis was performed by N.E., K.K., and B.J. The other experiment was designed through contributions of all authors. The manuscript was written by N.E., D.G., and B.J. All authors have given approval to the final version of the manuscript.
The authors declare no competing financial interest.
Supplementary Material
References
- Stavrou I. J.; Christou A.; Kapnissi-Christodoulou C. P. Polyphenols in carobs: A review on their composition, antioxidant capacity and cytotoxic effects, and health impact. Food Chem. 2018, 269, 355–374. 10.1016/j.foodchem.2018.06.152. [DOI] [PubMed] [Google Scholar]
- Caleja C.; Ribeiro A.; Barreiro M. F.; Ferreira I. C. F. R. Phenolic compounds as nutraceuticals or functional food ingredients. Curr. Pharm. Des. 2017, 23, 2787–2806. 10.2174/1381612822666161227153906. [DOI] [PubMed] [Google Scholar]
- Zhao H.; Chen W.; Lu J.; Zhao M. Phenolic profiles and antioxidant activities of commercial beers. Food Chem. 2010, 119, 1150–1158. 10.1016/j.foodchem.2009.08.028. [DOI] [Google Scholar]
- Höferl M.; Stoilova I.; Schmidt E.; Wanner J.; Jirovetz L.; Trifonova D.; Krastev L.; Krastanov A. Chemical composition and antioxidant properties of Juniper berry (juniperus communis L.) essential oil, Action of the essential oil on the antioxidant protection of saccharomyces cerevisiae model organism. Antioxidants 2014, 3, 81–98. 10.3390/antiox3010081. [DOI] [PMC free article] [PubMed] [Google Scholar]
- Gu C.; Howell K.; Dunshea F. R.; Suleria H. A. R. LC-ESI-QTOF/MS characterisation of phenolic acids and flavonoids in polyphenol-rich fruits and vegetables and their potential antioxidant activities. Antioxidants 2019, 8, 405. 10.3390/antiox8090405. [DOI] [PMC free article] [PubMed] [Google Scholar]
- Miceli N.; Trovato A.; Marino A.; Bellinghieri V.; Melchini A.; Dugo P.; Cacciola F.; Donato P.; Mondello L.; Güvenç A. Phenolic composition and biological activities of Juniperus drupacea labill. berries from Turkey. Food Chem. Toxicology 2011, 49, 2600–2608. 10.1016/j.fct.2011.07.004. [DOI] [PubMed] [Google Scholar]
- Kowalczyk D.; Świeca M.; Cichocka J.; Gawlik-Dziki U. The phenolic content and antioxidant activity of the aqueous and hydroalcoholic extracts of hops and their pellets. J. Inst. Brew. 2013, 119, 103–110. 10.1002/jib.73. [DOI] [Google Scholar]
- Sogi D. S.; Siddiq M.; Greiby I.; Dolan K. D. Total phenolics, antioxidant activity, and functional properties of ‘tommy atkins’ mango peel and kernel as affected by drying methods. Food Chem. 2013, 141, 2649–2655. 10.1016/j.foodchem.2013.05.053. [DOI] [PubMed] [Google Scholar]
- Tavares L.; McDougall G. J.; Fortalezas S.; Stewart D.; Ferreira R. B.; Santos C. N. The neuroprotective potential of phenolic-enriched fractions from four Juniperus species found in Portugal. Food Chem. 2012, 135, 562–570. 10.1016/j.foodchem.2012.05.023. [DOI] [PubMed] [Google Scholar]
- Blainski A.; Lopes G. C.; De Mello J. C. P. Application and analysis of the Folin Ciocalteu method for the determination of the total phenolic content from Limonium Brasiliense L. Molecules 2013, 18, 6852–6865. 10.3390/molecules18066852. [DOI] [PMC free article] [PubMed] [Google Scholar]
- Turkmen N.; Sari F.; Velioglu Y. S. Effects of extraction solvents on concentration and antioxidant activity of black and black mate tea polyphenols determined by ferrous tartrate and Folin-ciocalteu methods. Food Chem. 2006, 99, 835–841. 10.1016/j.foodchem.2005.08.034. [DOI] [Google Scholar]
- Šeruga M.; Novak I.; Jakobek L. Determination of polyphenols content and antioxidant activity of some red wines by differential pulse voltammetry, HPLC and spectrophotometric methods. Food Chem. 2011, 124, 1208–1216. 10.1016/j.foodchem.2010.07.047. [DOI] [Google Scholar]
- Ikawa M.; Schaper T. D.; Dollard C. A.; Sasner J. J. Utilization of Folin–Ciocalteu phenol reagent for the detection of certain nitrogen compounds. J. Agric. Food Chem. 2003, 51, 1811–1815. 10.1021/jf021099. [DOI] [PubMed] [Google Scholar]
- Everette J. D.; Bryant Q. M.; Green A. M.; Abbey Y. A.; Wangila G. W.; Walker R. B. Thorough study of reactivity of various compound classes toward the Folin–Ciocalteu reagent. J. Agric. Food Chem. 2010, 58, 8139–8144. 10.1021/jf1005935. [DOI] [PMC free article] [PubMed] [Google Scholar]
- Sasak W.; Mańkowski T.; Chojnacki T.; Daniewski W. M. Polyprenols in Juniperus communis needles. FEBS Lett. 1976, 64, 55–58. 10.1016/0014-5793(76)80247-5. [DOI] [PubMed] [Google Scholar]
- Ali A. M.; Mackeen M. M.; Intan-Safinar I.; Hamid M.; Lajis N. H.; El-Sharkawy S. H.; Murakoshi M. Antitumor-promoting and antitumour activities of the crude extract from the leaves of Juniperus chinensis. J. Ethnopharmacol. 1996, 53, 165–169. 10.1016/0378-8741(96)01434-1. [DOI] [PubMed] [Google Scholar]
- Vázquez G.; González-Alzarez J.; Freire S.; López-Suevos F.; Antorrena G. Characteristics of Pinus pinaster bark extracts obtained under different extraction conditions. Holz Roh- und Werkst. 2001, 59, 451–456. 10.1007/s00107-001-0246-0. [DOI] [Google Scholar]
- Do Q. D.; Angkawijaya A. E.; Tran-Nguyen P. L.; Huynh L. H.; Soetaredjo F. E.; Ismadji S.; Ju Y.-H. Effect of extraction solvent on total phenol content, total flavonoid content, and antioxidant activity of Limnophila aromatica. J. Food Drug Anal. 2014, 22, 296–302. 10.1016/j.jfda.2013.11.001. [DOI] [PMC free article] [PubMed] [Google Scholar]
- Uzel R. A. Effect of extraction method and extraction solvent on recovery of phenolic compounds from olive leaves in Kemalpaşa-İzmir (Turkey): Oleuropein recovery as a case example. Sep. Sci. Technol. 2018, 53, 1531–1539. 10.1080/01496395.2018.1442861. [DOI] [Google Scholar]
- Alcântara M. A.; De Lima Brito Polari I.; De Albuquerque Meireles B. R. L.; de Lima A. E. A.; da Silva Junior J. C.; de Andrade Vieira É.; dos Santos N. A.; de Magalhães Cordeiro A. M. T. Effect of the solvent composition on the profile of phenolic compounds extracted from chia seeds. Food Chem. 2019, 275, 489–496. 10.1016/j.foodchem.2018.09.133. [DOI] [PubMed] [Google Scholar]
- Bhebhe M.; Füller T. N.; Chipurura B.; Muchuweti M. Effect of solvent type on total phenolic content and free radical scavenging activity of black tea and herbal infusions. Food Anal. Methods 2016, 9, 1060–1067. 10.1007/s12161-015-0270-z. [DOI] [Google Scholar]
- Venkatesan T.; Choi Y.-W.; Kim Y.-K. Impact of Different Extraction Solvents on Phenolic Content and Antioxidant Potential of Pinus densiflora Bark Extract. BioMed Res. Int. 2019, 2019, 1. 10.1155/2019/3520675. [DOI] [PMC free article] [PubMed] [Google Scholar]
- Hossain M. B.; Rai D. K.; Brunton N. P.; Martin-Diana A. B.; Barry-Ryan C. Characterization of phenolic composition in lamiaceae spices by LC-ESI-MS/MS. J. Agric. Food Chem. 2010, 58, 10576–10581. 10.1021/jf102042g. [DOI] [PubMed] [Google Scholar]
- Elboughdiri N. Effect of Time, Solvent-Solid Ratio, Ethanol Concentration and Temperature on Extraction Yield of Phenolic Compounds From Olive Leaves. Eng. Technol. Appl. Sci. Res. 2018, 8, 2805–2808. 10.13140/RG.2.2.26002.81601. [DOI] [Google Scholar]
- Liyana-Pathirana C.; Shahidi F. Optimization of extraction of phenolic compounds from wheat using response surface methodology. Food Chem. 2005, 93, 47–56. 10.1016/j.foodchem.2004.08.050. [DOI] [Google Scholar]
- Iglesias-Carres L.; Mas-Capdevila A.; Bravo F. I.; Aragonès G.; Muguerza B.; Arola-Arnal A. Optimization of a polyphenol extraction method for sweet orange pulp (Citrus sinensis L.) to identify phenolic compounds consumed from sweet oranges. PLoS One 2019, e0211267 10.1371/journal.pone.0211267. [DOI] [PMC free article] [PubMed] [Google Scholar]
- Elboughdiri N. Olive mill wastewater phenolic compounds adsorption onto active olive stones: Equilibrium isotherms and kinetics study. Int. J. Forensic Eng. 2018, 4, 31–46. 10.1504/IJFE.2018.094042. [DOI] [Google Scholar]
- Damjanović B.; Skala D.; Baras J.; Petrović-Djakov D. Isolation of essential oil and supercritical carbon dioxide extract of Juniperus communis L. fruits from Montenegro. Flavour Fragrance J. 2006, 21, 875–880. 10.1002/ffj.1711. [DOI] [Google Scholar]
- Sela F.; Karapandzova M.; Stefkov G.; Kulevanova S. Chemical composition of berry essential oils from Juniperus communis L. (Cupressaceae) growing wild in Republic of Macedonia and assessment of chemical composition in accordance to European Pharmacopoeia. Maced. Pharm. Bull. 2011, 57, 43–51. 10.33320/maced.pharm.bull.2011.57.005. [DOI] [Google Scholar]
- Orav A.; Koel M.; Kailas T.; Müürisepp M. Comparative analysis of the composition of essential oils and supercritical carbon dioxide extracts from the berries and needles of Estonian juniper (Juniperus communis L.). Procedia Chem. 2010, 2, 161–167. 10.1016/j.proche.2009.12.023. [DOI] [Google Scholar]
- Sowndhararajan K.; Seo M.; Kim S. Comparative analysis of the composition of essential oils from the needles, twigs and berries of Juniperus chinensis L. in Korea. J. Appl. Pharm. Sci. 2016, 6, 122–126. 10.7324/JAPS.2016.60819. [DOI] [Google Scholar]
- Miceli N.; Trovato A.; Dugo P.; Cacciola F.; Donato P.; Marino A.; Bellinghieri V.; La Barbera T. M.; Güvenç A.; Taviano M. F. Comparative analysis of flavonoid profile, antioxidant and antimicrobial activity of the berries of Juniperus communis L. var. communis and Juniperus communis L. var. saxatilis Pall. from Turkey. J. Agric. Food Chem. 2009, 57, 6570–6577. 10.1021/jf9012295. [DOI] [PubMed] [Google Scholar]
- d’Alessandro L. G.; Kriaa K.; Nikov J.; Dimitrov K. Ultrasound assisted extraction of polyphenols from black chokeberry. Sep. Purif. Technol. 2012, 93, 42–47. 10.1016/j.seppur.2012.03.024. [DOI] [Google Scholar]
Associated Data
This section collects any data citations, data availability statements, or supplementary materials included in this article.


