

Abstract
In this study, cellulose was obtained from sugarcane bagasse (SCB) and treated with xylanase to remove residual noncellulosic polymers (hemicellulose and lignin) to improve its dyeability. The cellulose fibers were dyed with natural dye solutions extracted from the heart wood of Ceasalpinia sappan Linn. and Artocarpus heterophyllus Lam. Fourier-transform infrared (FTIR) spectroscopy, Raman analysis, and whiteness index (WI) indicated successful extraction of cellulose by eliminating hemicellulose and lignin. The FTIR analysis of the dyed fibers confirmed successful interaction between natural dyes and cellulose fibers. The absorption (K) and scattering (S) coefficient (K/S) values of the dyed fibers increased in cellulose treated with xylanase before dyeing. Scanning electron microscopy (SEM) analysis showed that the surface of alkaline-bleached fibers (AB-fibers) was smoother than alkaline-bleached xylanase fibers (ABX-fibers), and the presence of dye particles on the surface of dyed fibers was confirmed by energy-dispersive spectrometry (EDS) analysis. The X-ray diffraction (XRD) revealed a higher crystallinity index (CrI), and thermal gravimetric analysis (TGA) also presented higher thermal stability in the dyed fibers with good colorfastness to light. Therefore, xylanase treatment and natural dyes can enhance dyeability and improve the properties of cellulose for various industrial applications.
Introduction
Cellulose is one of the most common natural fibers. It has attracted much attention due to its renewability, wide availability, low cost, and biocompatibility with some other interesting properties such as biodegradability, high mechanical strength, and good thermal stability.1−3 The chemical structure of cellulose is made up of hydroxyl groups on the chain, which can easily interact with other compounds to create many derivatives. This leads to numerous applications of cellulose such as in drug delivery,4 polymer filler,5 fuel, consumables, food, paper manufacturing, textile, and many others.6 The modification of the physical or chemical structure of cellulose can extend the utilization of cellulose to cover more value-added products. Hitherto, various methods were used to vary certain properties of the components of cellulose such as acidification, esterification, and etherification.7 These required certain amount of chemicals to achieve successful modification, leading to an environmental problem, which has been a concerning issue in the recent years.
However, it is practically possible to improve the property of cellulose by dyeing with natural dye. The natural pigments are abundant in the environment, simple to extract, biodegradable, and couple with the absence of toxicity as an added advantage.8 It is also very interesting to know that dyeing cotton fabrics has improved their UV protection properties.9 Similarly, a study on dyed bacterial cellulose (BC) showed an improved mechanical property with an increased elongation at break compared with nondyed BC.8 However, the low affinity between anionic dye and cellulose limits the dyeability of cellulose with the natural dyes.10 In an attempt to improve the colorfastness of cellulose fibers, some heavy metal ions such as cupric and chromium have been used; these may cause serious health issues in humans as well as cause environmental pollution.11
Nowadays, the world is moving toward the use of natural mordants with various investigations in new raw materials and techniques, as well as advances in research in the utilization of cellulose from different biomass, which embrace the principles of green chemistry. This research has focused on using cellulose from sugarcane bagasse (SCB), which is a byproduct of sugar processing. SCB is generated around 20–23 million tons per year in Thailand, and each ton of sugarcane produced around 280–290 kg of SCB.2 SCB is normally used as boiler fuel, which is used to provide power for sugar production or electricity generation.12 SCB is a lignocellulosic material that is approximately 40–50% composed of cellulose as the main component.13 Therefore, it is a suitable substrate for cellulose extraction due to its high cellulose content and cheap and readily available feedstock.13,14 The utilization of cellulose from SCB required the removal of noncellulosic materials such as lignin and hemicellulose, which can be achieved via pretreatment combined with bleaching. However, this combined process may not effectively eliminate all of the noncellulosic components.
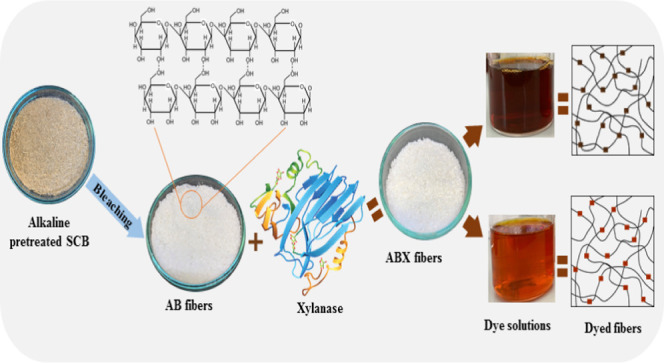
In this work, cellulose was obtained from SCB and treated with xylanase to remove residual noncellulosic polymers (hemicellulose and lignin) to improve its dyeability. Xylanase was used after cellulose extraction due to its environmental friendliness. Xylanase treatment can remove the residual noncellulosic materials (hemicellulose and lignin), resulting in the opening up of the cellulose structure, and thus may facilitate the natural dyes’ access to the cellulose structure and improve its properties. The fibers were dyed with natural dye solutions extracted from the heart wood of Ceasalpinia sappan Linn. and Artocarpus heterophyllus Lam., which are local plants in Asia and are sustainable raw materials. The fibers could be used as polymer reinforcing agents, and also in various industrial applications as biobased materials.
Results and Discussion
Properties of the Dye Solution
The properties of extracted dyes are shown in Table 1. The dye solution obtained from the heart wood of C. sappan Linn. gave a dark red colorant with a concentration of 16 mg/mL. Whereas, the dye solution extracted from A. heterophyllus Lam.’s heart wood gave a brown colorant with a concentration of 1 mg/mL. Comparing the 1,1-diphenyl-2-picrylhydrazyl (DPPH) free-radical scavenging activity of the dyes with ascorbic acid, the result showed that the dye solution from C. sappan Linn.’s heart wood had the highest IC50 value of 2.14 μg/mL followed by ascorbic acid (4.31 μg/mL) and the dye solution from A. heterophyllus Lam.’s heart wood gave a value of 7.64 μg/mL, respectively. The total phenolic content was approximately 242.25% higher in C. sappan Linn. than in A. heterophyllus Lam. dye. The total phenolic contents of C. sappan Linn. and A. heterophyllus Lam. dyes were 1069.54 ± 8.14 and 441.53 ± 14.52 μg/mg, respectively. The dye solutions, therefore, possessed an excellent antioxidant activity, which may be due to the high quantity of polyphenols especially in C. sappan Linn. dye. Since both dyes were extracted from plants, and phenolic compounds formed major components of plants, this contributed to the free-radical scavenging activity in the dyes.15 The excellent free-radical scavenging activity of the natural dyes could enhance the biological properties such as antimicrobial activity and insect repellent characteristics in the dyed fibers and subsequent durability.
Table 1. Antioxidant Activity and Total Phenolic Content (TPC) of Dye Solutions Compared with Ascorbic Acida,b.

DPPH free-radical scavenging activity expressed at IC50 in mg/mL.
Total phenolic content expressed in μg gallic acid equivalents per mg of the dried sample.
Color Measurement
The whiteness index (WI) of the fibers at each step of cellulose extraction and enzyme treatment are shown in Table 2. It was found that the WI increased with each step of the extraction process from 54.55% in SCB to 89.99% after xylanase treatment. The WI value of A-fibers was higher than SCB with WI of 57.11% due to the alkaline pretreatment, which broke the ester bond between hemicellulose and other components (cellulose and lignin) in SCB with subsequent removal of some hemicellulose and lignin. This was apparent in the L* value, where ABX- and AB-fibers showed more brightness with L* values of 92.19 and 85.47, respectively, with reduced a* and b* values than SCB and A-fibers (Table 2). After bleaching, the WI increased about 47.3% from 57.11% in A-fibers to 84.11% in AB-fibers due to the oxidization of lignin-derived chromophores by cleaving the glycosidic bond in the lignin structure.16 The highest WI of 89.99% in ABX-fibers was a result of the xylanase partial hydrolysis of the residual xylan chain in hemicellulose and removal of residual chromophores in the lignin structure.17
Table 2. Hunter Color Values (Mean Value) of the L*, a*, and b* Parameters and the Whiteness Index (WI) Functions of Fibers at Each Stage of the Extraction Process.
| color
measurement |
||||
|---|---|---|---|---|
| sample | L* | a* | b* | WI |
| SCB | 55.96 | 3.41 | 10.69 | 54.55 |
| A-fibers | 59.09 | 3.17 | 12.49 | 57.11 |
| AB-fibers | 85.47 | 0.94 | 6.37 | 84.11 |
| ABX-fibers | 92.19 | 1.24 | 6.14 | 89.99 |
Scanning Electron Microscopy (SEM)
The morphology of dyed and nondyed fibers was studied by SEM, as shown in Figure 1, to determine the effect of enzyme treatment and the dyeing process on the surface of fibers. From the result, AB-fibers (Figure 1a) presented a smooth surface, which was due to removal of some hemicellulose and lignin after alkaline pretreatment and the bleaching process.14,18 The ABX-fibers presented a rougher surface than AB-fibers due to the partial hydrolysis of the residual xylan chain in hemicellulose and removal of some lignin on the surface by xylanase treatment.2 Since xylanase can remove noncellulosic materials from the surface, it leads to an increase in the surface area of fibers for easy access of the dye solutions. Furthermore, the surface morphologies of the fibers dyed with natural dyes extracted from the heart wood of C. sappan Linn. and A. heterophyllus Lam. are shown in Figure 1b,c,e,f. It was discovered that the dyed AB- and ABX-fibers had small and peculiar particles on both samples (Figure 1b,e) after dying with extracts from the heart wood of C. sappan Linn. and A. heterophyllus Lam. Hence, energy-dispersive spectrometry (EDS) was used to investigate the adhered small particles on the surface of the dyed fibers (Table 3). It was found that the atomic percentages of carbon (C) and oxygen (O) in the position (2+) of a small particle (Figure 1c) on the AAB surface were 66.69 and 33.31%, respectively, which were similar to the values in the position (2+) on the AABX-fiber (Figure 1f) surface of 66.18 and 33.82%, and the dye powder extracted from A. heterophyllus Lam.’s heart wood (A-Lam dye powder) of 66.84 and 33.16%, respectively. These values were different from the one obtained for the position (1+). Therefore, it can be concluded that the small particles on the surface of the dyed fibers are probably the natural dyes. This is similar to the study by ref (8) who reported the presence of peculiar adhered matter on the surface of bacterial cellulose dyed with plant-based natural dyes extracted from Clitoria ternatea L. flowers and Hibiscus rosa-sinensis flowers. The marginal increase of the C content in the ABX-fibers could be due to the removal of residual noncellulosic materials by an enzyme, which resulted in the opening up of the cellulose structure with increase in the cellulose content. In addition, the natural dyes contain functional groups such as carboxylic acid (COOH),19 which could be the reason for the marginal increase in the C content of the dyed fibers in the position (1+) of AAB- and AABX-fibers.
Figure 1.

SEM images of the AB-fibers (a), CAB-fibers (b), AAB-fibers (c), ABX-fibers (d), CABX-fibers (e), and AABX-fibers (f). The positions (1+ and 2+) were used for EDS analysis.
Table 3. Atomic Percentages of C and O in the Various Fibers and Dye Powder.
| atom % |
|||
|---|---|---|---|
| sample | position | C | O |
| AB-fibers | 69.94 | 30.06 | |
| ABX-fibers | 71.76 | 28.24 | |
| AAB-fibers | 1 | 71.62 | 28.38 |
| 2 | 66.69 | 33.31 | |
| AABX-fibers | 1 | 70.42 | 29.58 |
| 2 | 66.18 | 33.82 | |
| A-Lam dye powder | 66.84 | 33.16 | |
Fourier-Transform Infrared (FTIR) Spectroscopy
Figure 2 shows the FTIR spectra of all of the fibers after each processing stage. All of the spectra showed a band in the regions of 3700–3100 cm–1 ascribed to the free O–H stretching vibration of the −OH group of the inter and intramolecular hydrogen bonds in cellulose molecules.20 The spectra in Figure 2a–d showed an absorption band around 898 cm–1, which was assigned to the glycosidic C–H stretching vibration in cellulose molecules, representing the β-glycosidic linkages and the amorphous part in the cellulose structure.21 The absorption bands around 1515 and 1732 cm–1 were related to C=C aromatic skeletal vibration of the aromatic ring in lignin and the C–O stretching vibration of hemicellulose and lignin in the structure, respectively.22,23 However, the various peaks assigned to hemicellulose and lignin, in addition to the C–H bending of the hemicellulose and lignin structures and the C=C vibration of the aromatic ring in lignin at around 1462 cm–1,24 as well as the peak at 1252 cm–1, which was ascribed to the C–O–C out-of-plane stretching vibrations of aryl-alkyl ethers in lignin,25 decreased and almost disappeared in some spectra after treatment of the cellulose fibers (Figure 2c–h). This was due to the removal of hemicellulose and lignin after alkaline, bleaching, and xylanase treatments.26−29 These spectra were not observed in the ABX-fibers except at the peak around 898 cm–1, which characterized the cellulose structure. The decrease in the peak intensity of the ABX-fibers at 1600 cm–1 indicated the removal of chromophore residues and hemicellulose after xylanase treatment. After dyeing the AB- and ABX-fibers with the natural dyes (Figure 2e–h), a mild effect was observed in the intensity of the O–H stretching vibration (3700–3100 cm–1) due to the possible interaction between the hydrogen bonds in cellulose and natural dyes.11 The OH group is present in chromophores and hemicellulose; therefore, the decreases after xylanase treatment were due to the removal of chromophore residues, hemicellulose, and its precursors, which served as a physical barrier preventing access to cellulose. The AAB and AABX showed higher absorbance of O–H stretching as compared to CAB and CABX, which may be due to the differences in the phenolic content of the dyes, as the phenolic hydroxyl group was reported in dyes by previous studies.30
Figure 2.

FTIR spectra of (a) SCB, (b) A-fibers, (c) AB-fibers, (d) ABX-fibers, (e) CAB-fibers, (f) CABX-fibers, (g) AAB-fibers, and (h) AABX-fibers.
Raman Spectroscopy
Figure 3 shows the Raman spectroscopic analysis of the pretreated fibers to show the effect of alkaline bleaching and enzyme treatment on the removal of noncellulosic components. The result revealed complete reduction in the intensity of SCB bands at 2354 and 1609 cm–1, and disappearance of the band at 1258 and 1170 cm–1 in AB-fibers, while these bands were completely removed in the ABX-fibers. However, the analysis discovered intensification of the bands at 2896, 1374, and 1092 cm–1 for AB- and ABX-fibers. The absorbance at 1092 cm–1 is associated with the symmetric and asymmetric stretching mode of C–O–C in the glycosidic bond of cellulose matrices. The presence of cellulose was further confirmed by the peak at 1374 and 2896 cm–1 of the CH stretching mode.31 The peak at 1258 cm–1 in the SCB was believed to be from the methoxy group attached to the benzene ring of a phenol moiety of lignin32 and the acetyl groups on hemicellulose.31,33 The spectrum at 1170 cm–1, which is from the glycosidic bond vibration of xylan34 in SCB disappeared after alkaline bleaching and xylanase treatment, which confirmed the removal of some hemicellulose. In a similar manner, the effect of xylanase treatment on the cellulose fibers was evident in the unidentified peaks at 2354 cm–1, which is perhaps for noncellulosic materials and C–H stretching at 2896 cm–1, which showed the disappearance and the increase in the intensity, respectively, in ABX-fibers. This was a result of the attack on an amorphous region by the enzyme during hydrolysis and the subsequent removal of noncellulosic materials from the cellulose fibers. The enzyme cleaves the glycosidic bonds in the xylan backbone by interleaving between cellulose and lignin, ensuring the removal of lignin-associated hemicelluloses in the fibers.35
Figure 3.

Raman spectra of (a) SCB-, (b) AB-, and (c) ABX-treated fibers.
Natural Dyed Fibers
The fibers obtained after dyeing AB- and ABX-fibers with natural dyes were compared with the nondyed fibers, and the images are shown in Figure 4, while the color measurement results of dyed fibers were equally tabulated and are shown in Table 4. The images in Figure 4a,d show AB- and ABX-fibers, respectively, which showed more lightness than the dyed fibers. The CAB- and CABX-fibers (Figure 4b,e) were little darker than AAB- and AABX-fibers (Figure 4c,f). The color strength studied and represented in the K/S value was used to determine the effect of xylanase on dyeability of cellulose. The nondyed ABX-fibers showed more brightness with an L* value of 92.19, followed by AB-fibers with a value of 85.47, which were higher than values reported for all of the dyed fibers (Table 4). However, the a* values in nondyed fibers were lower than the dyed ones with ABX-fibers with a value of 1.24, while AB-fibers had the least value of 0.94. The dyed CABX-fibers had the highest value of 4.23, followed by CAB-fibers, which had a value of 4.01. The higher a* values (redness) of CAB- and CABX-fibers than AAB- and AABX-fibers might have accounted for the slight difference in the color, as shown in Figure 4. Furthermore, the b* values of AAB- and AABX-fibers were higher than the other samples, with the AABX-fiber having a value of 15.00, which is higher than the AAB-fiber of 13.65, meaning they are yellowish than the other fibers. In addition, the K/S values of all dyed ABX-fibers were higher than the nondyed and dyed AB-fibers, with AABX-fibers having the highest value of 0.92. This can be attributed to the fact that the dyed ABX-fibers possess higher color strength than dyed AB-fibers (Figure 4). This is because the xylanase treatment can destruct the residual hemicellulose and lignin on the cellulose surface, which leads to the opening up of the cellulose structure,2 resulting in an efficient interaction between the dye solutions and the −OH groups on the cellulose surface to easily absorb and retain the dyes. It can be concluded that using xylanase treatment can improve dyeability of cellulose.
Figure 4.

Images of nondyed and dyed fibers: (a) AB-fibers, (b) CAB-fibers, (c) AAB-fibers, (d) ABX-fibers, (e) CABX-fibers, and (f) AABX-fibers.
Table 4. Hunter Color Values (Mean Value) of the L*, a*, and b* Parameters and the K/S Values of the Dyed Fibers with Different Natural Dyesa.
| color
measurement |
||||
|---|---|---|---|---|
| sample | L* | a* | b* | K/S values |
| AB-fibers | 85.47 | 0.94 | 6.37 | 0.11 |
| ABX-fibers | 92.19 | 1.24 | 6.14 | 0.09 |
| CAB-fibers | 70.66 | 4.01 | 7.49 | 0.51 |
| CABX-fibers | 66.26 | 4.53 | 5.67 | 0.65 |
| AAB-fibers | 75.27 | 2.12 | 13.65 | 0.77 |
| AABX-fibers | 73.63 | 2.69 | 15.00 | 0.92 |
L*: brightness, a*: (red = +ve, green = −ve), b*: (yellow = +ve, blue = −ve).
X-Ray Diffraction (XRD)
The X-ray diffraction patterns of dyed and nondyed fibers are shown in Figure 5. The diffraction peaks around 2θ = 16, 22.5, and 34° were observed in all of the diffractograms. These peaks were ascribed to the (1 1 0), (0 0 2), and (0 0 4) planes, which were the characteristic fingerprints of cellulose I in the native cellulose structure.36 In addition, the results showed that xylanase treatment and dyeing with natural dyes had a negligible effect on the crystalline structure of cellulose. The CrI of dyed and nondyed fibers are shown in Table 5. The ABX-fibers showed a higher CrI value of 39.87% than AB-fibers (35.33%) due to the removal of hemicellulose and lignin, which formed a part of the noncrystalline components after xylanase treatment.17 This resulted in an ordered structural arrangement of the crystalline region in cellulose by an intermolecular hydrogen bond.37 After the dyeing process, the crystallinity of the dyed fibers increased with the CAB- and CABX-fibers recording the highest crystallinity indices of 46.29 ± 1.14 and 45.04 ± 1.04%, respectively. However, the analysis of the dyes revealed that they have no crystal peak at the region of 26–27°; it is only present in the native SCB (Figure S1). On the other hand, the AAB- and AABX-fibers have 42.58 ± 1.22 and 43.67 ± 0.61%, respectively. The increase in the CrI values of the dyed fibers could be due to the aggregation of dye molecules in the cellulose fibers, which were obtained after drying the dyed fibers with an air dry technique. This is similar to the finding by ref (38), who reported that the crystals in dyed regenerated cellulose nanofibrils (RCNF) after the soaping step in dyeing fabrics with vat dyes resulted in an increased crystallinity of the RCNF. However, the CrI values of the dyed AB- and ABX-fibers show no significant difference in all natural dyes. The enhanced crystalline property of the dyed fibers makes them suitable and useful in coating and manufacturing of composite materials.
Figure 5.

X-ray diffractograms of (a) AB-fibers, (b) ABX-fibers, (c) CAB-fibers, (d) CABX-fibers, (e) AAB-fibers, and (f) AABX-fibers.
Table 5. Crystallinity Index of the Nondyed and Dyed Fibers.
| sample | crystallinity index (%) |
|---|---|
| AB-fibers | 35.33 ± 2.80 |
| ABX-fibers | 39.87 ± 1.44 |
| CAB-fibers | 46.29 ± 1.14 |
| CABX-fibers | 45.04 ± 1.04 |
| AAB-fibers | 42.58 ± 1.22 |
| AABX-fibers | 43.67 ± 0.61 |
Thermal Analysis
The thermal stability of each sample was examined in terms of thermogravimetric analysis (TGA) and derivative thermogravimetric (DTG) curves with the thermograph shown in Figure 6. The thermograph revealed the various phases of degradation that occurred in the samples due to the differences in the degradation temperature of each component of the fibers. As shown in Figure 6a, the initial decomposition occurred at the temperature between 50 and 120 °C as a result of the evaporation of water molecules and the low-molecular-weight components, which degraded.39 The investigated fibers became thermally stable in the range of 220–300 °C, which is associated with the starting point of thermal degradation for cellulose materials.40 The major phase of weight loss occurred from 310 to 400 °C and has been ascribed to the structural degradation of cellulose.25 The onset of thermal decomposition (Ton) and the maximum of thermal decomposition (Tmax) of all of the samples as determined from the DTG curve (Figure 6b) is shown in Table 6. It was discovered that the degradation temperature of ABX-fibers was higher with Tmax = 356 °C when compared with AB-fibers of 348 °C, and their mass losses of 60.80 and 59.58%, respectively. This is due to the removal of some hemicellulose and lignin after xylanase treatment.2 After dyeing AB-fibers, the Ton increased from 308 to 324 °C in all cases of different dyes, while the ABX-fibers slightly increased from 321 to 327 and 329 °C for CABX- and AABX-fibers, respectively. Furthermore, dyed ABX-fibers showed slightly higher Ton than dyed AB-fibers. The increase in the thermal stability of the dyed fibers may be due to the hydrogen bond between the natural dye molecules and cellulose that occurred after the dyeing process,11 as well as the removal of noncellulosic components, which could be degraded at lower temperature and increased crystalline domain. However, the Tmax of both dyed AB- and ABX-fibers was in the range of 353–355 °C, with dyed ABX-fibers having the lowest mass loss of 10.00 and 10.71%. The thermal stability in this work is better than those reported in related studies such as using ultrasonic-assisted treatment41 and steam explosion.42 This demonstrates that dyeing the fibers with natural dyes can improve their thermal stability as a valuable biobased material.
Figure 6.
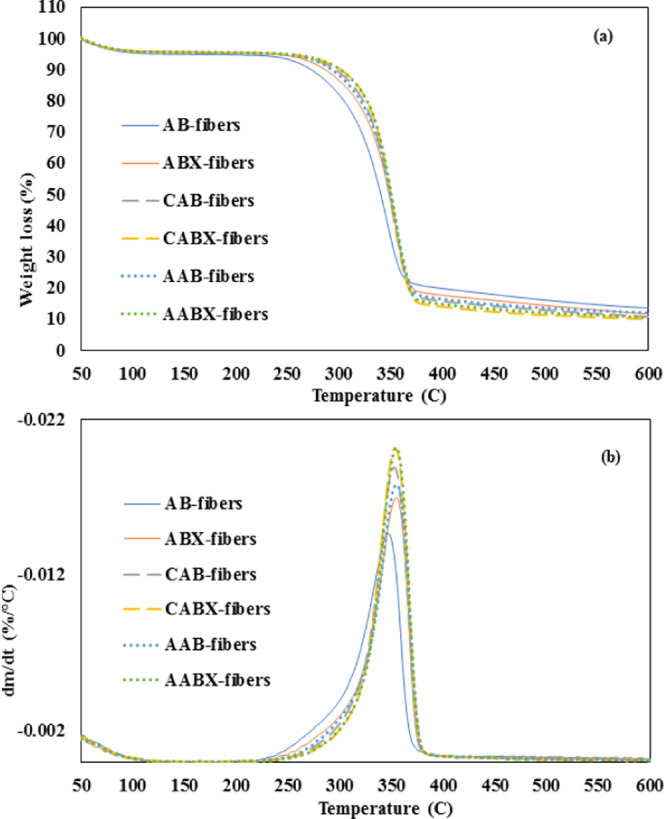
TGA (a) and DTG (b) curves of nondyed and dyed fibers.
Table 6. Degradation Temperature of Each Fiber at Different Processing Stages.
| sample | Ton (°C) | mass loss (%) | Tmax (°C) | mass loss (%) | residual at 600 °C (%) |
|---|---|---|---|---|---|
| AB-fibers | 308 | 21.08 | 348 | 59.58 | 13.80 |
| ABX-fibers | 321 | 21.69 | 356 | 60.80 | 11.97 |
| CAB-fibers | 324 | 20.16 | 353 | 57.08 | 10.81 |
| CABX-fibers | 327 | 20.27 | 353 | 56.75 | 10.00 |
| AAB-fibers | 324 | 21.65 | 355 | 58.17 | 12.12 |
| AABX-fibers | 329 | 21.42 | 355 | 57.82 | 10.71 |
Colorfastness to Light
The colorfastness to light of the fibers was done and rated on the basis of the class from 1 to 5 as follows: class 5—no fading, class 4—slight fading, class 3—noticeable fading, class 2—considerable fading, and class 1—much fading. The results, as shown in Table 7, revealed no differences in the colorfastness to light of dyed and nondyed fibers, which shows real fixation of natural dye on treated fibers. All of the fibers presented fastness in the class of 4, which represents slight fading to light by the fibers.9 The value is an indication that neither xylanase treatment nor natural dye had an effect on the fibers with regards to lightfastness. A similar report was given by ref (43), who found that enzyme treatment and natural dyes had no effect on lightfastness of dyed fibers. This result also correlates with previous studies by refs (44, 45). The result indicated real fixation of the dye on fibers via the nucleophilic substitution reaction and covalent bonding with the cellulose through anchimeric assistance between dye molecules and hydroxyl groups in cellulose.46,47
Table 7. Rate of the Color Change of Nondyed and Natural Dyed Fibers.
| sample | colorfastness to light |
|---|---|
| AB-fibers | 4 |
| ABX-fibers | 4 |
| CAB-fibers | 4 |
| CABX-fibers | 4 |
| AAB-fibers | 4 |
| AABX-fibers | 4 |
Conclusions
In summary, cellulose was successfully obtained from SCB using alkaline pretreatment, bleaching, and xylanase treatment. The FTIR spectroscopy, Raman spectroscopy, and WI studies confirmed the removal of noncellulosic materials (hemicellulose and lignin) during these processes. The WI values of ABX-fibers were higher than AB-fibers; this indicated that xylanase treatment can improve the purity of cellulose by destroying the residual hemicellulose and lignin. Xylanase treatment also enhanced the CrI and thermal stability of ABX-fibers compared with AB-fibers. The natural dyes extracted from the heart wood of C. sappan Linn. and A. heterophyllus Lam. showed high antioxidant activities. The dyed ABX-fibers showed higher coloration, and the K/S value, which represents the color strength of the dyed fabric, also showed that the dyed ABX-fibers were superior to dyed AB-fibers. This demonstrates the efficiency of xylanase treatment in improving dyeability of cellulose, and the dyed fibers presented better CrI and thermal stability with good colorfastness to light. Therefore, dyeing cellulose with natural dyes can improve the properties of cellulose for industrial applications in the manufacturing of composite materials.
Experimental Section
Materials
SCB was obtained from Mitr Phol sugar factory (Chaiyaphum Province, Thailand). Xylanase (enzyme activities of 866.19 units/mL) was supplied by the National Center for Genetic Engineering and Biotechnology (BIOTEC, Thailand). C. sappan Linn. and A. heterophyllus Lam. were purchased from a local market. All chemical reagents were of analytical grade and used as received.
Extraction of Cellulose from SCB
Cellulose was extracted from SCB using an alkaline pretreatment followed by bleaching. Briefly, the SCB was treated with a 4 wt % sodium hydroxide (NaOH) solution with a fiber-to-liquid ratio of 1:20 for 2 h at 55 °C under constant agitation to obtain “alkaline-pretreated fibers” (A-fibers). The A-fibers were bleached with a 1.4 wt % sodium chlorite (NaClO2) solution with the fiber-to-liquid ratio of 1:20, and the pH was adjusted to 4.0 with glacial acetic acid at 70 °C. Fresh sodium chlorite and acetic acid were added at the same loading ratio to the reaction every 1 h until fibers became white and were labeled as “alkaline-bleached fibers” (AB-fibers). The samples were washed with distilled water until the water reached a neutral pH, and were dried in an oven at 55 °C for 24 h.17
Xylanase Treatment
The alkaline-bleached xylanase fibers (ABX-fibers) were obtained after treating alkaline-bleached fibers (AB-fibers) with 200 U/g of xylanase (fiber-to-liquid ratio of 1:20) under continuous stirring at 50 °C for 1 h (1 unit of xylanase (U) was defined as the quantity of the enzyme required to liberate 1 μmol xylose equivalent per min at 50 °C). The samples were washed with distilled water and dried in an oven at 55 °C for 24 h.
Extraction of Dye Solutions
Dye solutions were extracted from local plant materials using a conventional process. The heart wood of C. sappan Linn. and A. heterophyllus Lam. were extracted using distilled water with a solid-to-liquid ratio of 1:10, at 80 °C for 2 h. After filtering the solid, a two-third of the dye solutions was removed by evaporation at 80 °C to obtain clear dye solutions.
Dyeing Process
The cellulose fibers obtained from each treatment (AB-fibers and ABX-fibers) were then dyed with natural dyes at a fiber-to-dye ratio of 1:40. To accelerate the reaction of the dye with the cellulose fibers, the dye solutions prepared as described in the Extraction of Dye Solutions section were heated to 90 °C.8 The impregnation of the cellulose fibers with the dye solutions was operated as a batch process. The prepared fibers were submerged in the heated dye solutions for 120 min under continuous stirring with a magnetic stirrer. After dyeing, the fibers were washed with distilled water until the water became clear and dried in a circulation oven at 55 °C for 24 h. The dyed AB- and ABX-fibers were thereafter referred to as CAB-fibers and CABX-fibers, for C. sappan Linn. dyed, and AAB-fibers and AABX-fibers for A. heterophyllus Lam. dyed fibers. The first letter of the samples referred to the first letter of the scientific name of each plant (Table 8).
Table 8. List of the Fibers Obtained at Each Processing Stage.
| sample | conditions |
|---|---|
| AB | alkaline pretreatment + bleaching |
| ABX | alkaline pretreatment + bleaching + xylanase |
| CAB | alkaline pretreatment + bleaching +C. sappanLinn. |
| CABX | alkaline pretreatment + bleaching + xylanase + C. sappanLinn. |
| AAB | alkaline pretreatment + bleaching + A. heterophyllusLam. |
| AABX | alkaline pretreatment + bleaching + xylanase + A. heterophyllusLam. |
1,1-Diphenyl-2-picrylhydrazyl (DPPH) Radical Scavenging Assay and Total Phenolic Content (TPC)
The free-radical scavenging antioxidant capacities of the dye solutions were evaluated by the 1,1-diphenyl-2-picrylhydrazyl (DPPH) radical scavenging assay. The samples were diluted to optimal concentrations, and 1 mL of each diluted sample was mixed with 1 mL of a 0.1 mmol DPPH solution (sample-to-DPPH ratio of 1:1) and incubated for 30 min in the dark at room temperature. The reduction of the DPPH was measured in triplicate at 517 nm to determine the half-minimum inhibition concentrations (IC50) for the free radical scavenging. The total phenolic contents of dye solutions were determined using the Folin–Ciocalteu reagent (FCR), as described by ref (48) with modifications. In brief, 125 μL of the diluted sample, 500 μL of distilled water, and 125 μL of FCR were mixed in the initial step. After 6 min, 1.25 mL of 7% (w/v) sodium carbonate was added to the reaction and mixed before incubation for 90 min at room temperature. The UV-1601 spectrophotometer (GENESYS 10S UV-Vis Thermo) was used to measure the absorbance at 760 nm. Standard solutions of gallic acid (20–200 μg/mL) were used for standard curve preparation, and the total phenolic content was expressed as microgram (μg) of gallic acid equivalents per milligram (mg) of the dried sample.
Characterization
Fourier-Transform Infrared (FTIR) Spectroscopy
A Fourier-transform infrared spectrometer (Bruker Tensor 27 spectrometer) was used to obtain the FTIR spectra of the fibers. All spectra were recorded in the region of 4000–500 cm–1 at a resolution of 4 cm–1.
Raman Spectroscopy Analysis
The Raman spectra of native, alkaline-bleached, and enzyme-treated SCB were recorded via NTEGRASpectra (NTMDT model, Russia) using the 473 nm laser as an excitation source with a 100× objective. To confirm the removal of noncellulosic component in the pretreatment process, the samples were passed through a laser power of approximately 2 mW, and the scattered light was detected by a charge-coupled device (CCD) system. The Raman spectra of the samples were acquired in the time frame of 120 s in the region of 3000–800 cm–1.
Color Measurement
A spectrophotometer (Datacolor 650, NJ) was used to determine the concentration of the color in both dyed and nondyed fibers. The instrument was calibrated with a white standard plate (L = 100, a = 0, and b = 0) before measuring the L* (lightness), a* (−a* = green; +a* = red), and b* (−b* = blue; +b* = yellow) values. All measurements were performed in triplicate, and the whiteness index (WI) was calculated using eq 1.(49) The K/S value, which measures the depth of the color of a dyed fabric, was also recorded to obtain the color strength to study the effect of xylanase treatment on dyeability of cellulose.
| 1 |
Scanning Electron Microscopy (SEM)
The morphology and atomic percentage of the fibers were determined by scanning electron microscopy (SEM) and energy-dispersive spectrometry (EDS) on a microscope (QUANTA 450, Thermo Fisher Scientific). The fibers were coated with gold before observing with an accelerating voltage of 10–15 kV.
X-Ray Diffraction (XRD)
X-ray diffraction analysis on a Bruker d8 Advance was used to determine the crystallinity of all samples. X-ray diffraction patterns of each sample were recorded in the region of 2θ angle from 5 to 40° with a scanning rate of 5°/min. The crystallinity index (CrI) was calculated using Segal’s method50 by the following equation
| 2 |
where I002 describes the intensity of maximum diffraction of the crystalline regions [2θ = 22.5° (0 0 2 plane) in cellulose I; 2θ = 21.9° (0 0 2 plane) in cellulose II] and Iam describes the intensity of the amorphous region between the (0 0 2) and (1 1 0) planes (2θ = 18°).
Thermogravimetric Analysis (TGA)
The thermal stability of each sample was studied by thermogravimetric analysis (TGA) and derivative thermogravimetric analysis (DTG) on a thermal gravimetric analyzer (Mettler Toledo, Model TGA2, Switzerland). The samples were pyrolyzed from 50 to 600 °C with a heating rate of 10 °C/min under a nitrogen atmosphere with a 20 mL/min flow rate.
Colorfastness to Light
The colorfastness to light of the fibers was tested according to the AATCC TM 16.3: 2014 standard method (Atlas Xenon Arc Weather Ometer model Ci 3000+). The gray scale for color change was used for the color-changing evaluation of their fastness. The values were rated on the basis of a class from 1 to 5.
Acknowledgments
This study was funded by the National Science and Technology Development Agency (NSTDA) under the Young Scientist and Technologist Program (YSTP) (Grant Number SCA-CO-2562-9997-TH). The authors would like to acknowledge the support provided by the Department of Biotechnology in the Faculty of Agro-Industry at Kasetsart University and the National Center for Genetic Engineering and Biotechnology (BIOTEC), Thailand.
Supporting Information Available
The Supporting Information is available free of charge at https://pubs.acs.org/doi/10.1021/acsomega.0c03837.
XRD diffractograms (SCB, Ceasalpinia sappan Linn. and Artocarpus heterophyllus Lam dyes) (PDF)
The authors declare no competing financial interest.
Supplementary Material
References
- Geng H.; Yuan Z.; Fan Q.; Dai X.; Zhao Y.; Wang Z.; Qin M. Characterisation of cellulose films regenerated from acetone/water coagulants. Carbohydr. Polym. 2014, 102, 438–444. 10.1016/j.carbpol.2013.11.071. [DOI] [PubMed] [Google Scholar]
- Saelee K.; Yingkamhaeng N.; Nimchua T.; Sukyai P. An environmentally friendly xylanase-assisted pretreatment for cellulose nanofibrils isolation from sugarcane bagasse by high-pressure homogenization. Ind. Crops Prod. 2016, 82, 149–160. 10.1016/j.indcrop.2015.11.064. [DOI] [Google Scholar]
- Wang S.; Lu A.; Zhang L. Recent advances in regenerated cellulose materials. Prog. Polym. Sci. 2016, 53, 169–206. 10.1016/j.progpolymsci.2015.07.003. [DOI] [Google Scholar]
- Wsoo M. A.; Shahir S.; Mohd Bohari S. P.; Nayan N. H. M.; Razak S. I. A. A review on the properties of electrospun cellulose acetate and its application in drug delivery systems: A new perspective. Carbohydr. Res. 2020, 491, 107978 10.1016/j.carres.2020.107978. [DOI] [PubMed] [Google Scholar]
- Niazi M. B. K.; Jahan Z.; Berg S. S.; Gregersen Ø. W. Mechanical, thermal and swelling properties of phosphorylated nanocellulose fibrils/PVA nanocomposite membranes. Carbohydr. Polym. 2017, 177, 258–268. 10.1016/j.carbpol.2017.08.125. [DOI] [PubMed] [Google Scholar]
- Gupta P. K.; Raghunath S. S.; Prasanna D. V.; Venkat P.; Shree V.; Chithananthan C.; Choudhary S.; Surender K.; Geetha K.. An Update on Overview of Cellulose, Its Structure and Applications. In Cellulose; IntechOpen, 2019. [Google Scholar]
- Cui X.; Honda T.; Asoh T.-A.; Uyama H. Cellulose modified by citric acid reinforced polypropylene resin as fillers. Carbohydr. Polym. 2020, 230, 115662 10.1016/j.carbpol.2019.115662. [DOI] [PubMed] [Google Scholar]
- de Costa A. F. S.; de Amorim J. D. P.; Almeida F. C. G.; de Lima I. D.; de Paiva S. C.; Rocha M. A. V.; Vinhas G. M.; Sarubbo L. A. Dyeing of bacterial cellulose films using plant-based natural dyes. Int. J. Biol. Macromol. 2019, 121, 580–587. 10.1016/j.ijbiomac.2018.10.066. [DOI] [PubMed] [Google Scholar]
- dos Santos Silva P. M.; Fiaschitello T. R.; de Queiroz R. S.; Freeman H. S.; da Costa S. A.; Leo P.; Montemor A. F.; da Costa S. M. Natural dye from Croton urucurana Baill. bark: Extraction, physicochemical characterization, textile dyeing and color fastness properties. Dyes Pigm. 2020, 173, 107953 10.1016/j.dyepig.2019.107953. [DOI] [Google Scholar]
- Syrine L.; Jabli M.; Abdessalem S. B.; Almalki S. G. FT-IR spectroscopy and morphological study of functionalized cellulosic fibers: Evaluation of their dyeing properties using biological Pistacia vera hulls by-product extract. Int. J. Biol. Macromol. 2020, 145, 1106–1114. 10.1016/j.ijbiomac.2019.09.204. [DOI] [PubMed] [Google Scholar]
- Ren Y.; Fu R.; Fang K.; Chen W.; Hao L.; Xie R.; Shi Z. Dyeing cotton with tea extract based on in-situ polymerization: An innovative mechanism of coloring cellulose fibers by industrial crop pigments. Ind. Crops Prod. 2019, 142, 111863 10.1016/j.indcrop.2019.111863. [DOI] [Google Scholar]
- Dantas G. A.; Legey L. F. L.; Mazzone A. Energy from sugarcane bagasse in Brazil: An assessment of the productivity and cost of different technological routes. Renewable Sustainable Energy Rev. 2013, 21, 356–364. 10.1016/j.rser.2012.11.080. [DOI] [Google Scholar]
- Sun J. X.; Sun X. F.; Zhao H.; Sun R. C. Isolation and characterization of cellulose from sugarcane bagasse. Polym. Degrad. Stab. 2004, 84, 331–339. 10.1016/j.polymdegradstab.2004.02.008. [DOI] [Google Scholar]
- Mandal A.; Chakrabarty D. Isolation of nanocellulose from waste sugarcane bagasse (SCB) and its characterization. Carbohydr. Polym. 2011, 86, 1291–1299. 10.1016/j.carbpol.2011.06.030. [DOI] [Google Scholar]
- Moussi K.; Nayak B.; Perkins L. B.; Dahmoune F.; Madani K.; Chibane M. HPLC-DAD profile of phenolic compounds and antioxidant activity of leaves extract of Rhamnus alaternus L.. Ind. Crops Prod. 2015, 74, 858–866. 10.1016/j.indcrop.2015.06.015. [DOI] [Google Scholar]
- Ko C.-H.; Lin Z.-P.; Tu J.; Tsai C.-H.; Liu C.-C.; Chen H.-T.; Wang T.-P. Xylanase production by Paenibacillus campinasensis BL11 and its pretreatment of hardwood kraft pulp bleaching. Int. Biodeterior. Biodegrad. 2010, 64, 13–19. 10.1016/j.ibiod.2009.10.001. [DOI] [Google Scholar]
- Vanitjinda G.; Nimchua T.; Sukyai P. Effect of xylanase-assisted pretreatment on the properties of cellulose and regenerated cellulose films from sugarcane bagasse. Int. J. Biol. Macromol. 2019, 122, 503–516. 10.1016/j.ijbiomac.2018.10.191. [DOI] [PubMed] [Google Scholar]
- Chandel A. K.; Antunes F. A. F.; Anjos V.; Bell M. J. V.; Rodrigues L. N.; Polikarpov I.; de Azevedo E. R.; Bernardinelli O. D.; Rosa C. A.; Pagnocca F. C.; da Silva S. S. Multi-scale structural and chemical analysis of sugarcane bagasse in the process of sequential acid–base pretreatment and ethanol production by Scheffersomyces shehatae and Saccharomyces cerevisiae. Biotechnol. Biofuels 2014, 7, 63 10.1186/1754-6834-7-63. [DOI] [PMC free article] [PubMed] [Google Scholar]
- Pargai D.; Jahan S.; Gahlot M.. Functional Properties of Natural Dyed Textiles. In Chemistry and Technology of Natural and Synthetic Dyes and Pigments; IntechOpen, 2020. [Google Scholar]
- Mandal A.; Chakrabarty D. Studies on the mechanical, thermal, morphological and barrier properties of nanocomposites based on poly(vinyl alcohol) and nanocellulose from sugarcane bagasse. J. Ind. Eng. Chem. 2014, 20, 462–473. 10.1016/j.jiec.2013.05.003. [DOI] [Google Scholar]
- Szymanska-Chargot M.; Chylinska M.; Kruk B.; Zdunek A. Combining FT-IR spectroscopy and multivariate analysis for qualitative and quantitative analysis of the cell wall composition changes during apples development. Carbohydr. Polym. 2015, 115, 93–103. 10.1016/j.carbpol.2014.08.039. [DOI] [PubMed] [Google Scholar]
- Costa L. A. S.; de Assis D. J.; Gomes G. V.; da Silva J. B.; Fonsêca A. F.; Druzian J. I. Extraction and characterization of nanocellulose from corn stover. Mater. Today Proc. 2015, 2, 287–294. 10.1016/j.matpr.2015.04.045. [DOI] [Google Scholar]
- Danial W. H.; Abdul Majid Z.; Mohd Muhid M. N.; Triwahyono S.; Bakar M. B.; Ramli Z. The reuse of wastepaper for the extraction of cellulose nanocrystals. Carbohydr. Polym. 2015, 118, 165–169. 10.1016/j.carbpol.2014.10.072. [DOI] [PubMed] [Google Scholar]
- Rosa M. F.; Medeiros E. S.; Malmonge J. A.; Gregorski K. S.; Wood D. F.; Mattoso L. H. C.; Glenn G.; Orts W. J.; Imam S. H. Cellulose nanowhiskers from coconut husk fibers: Effect of preparation conditions on their thermal and morphological behavior. Carbohydr. Polym. 2010, 81, 83–92. 10.1016/j.carbpol.2010.01.059. [DOI] [Google Scholar]
- Yang H.; Yan R.; Chen H.; Lee D. H.; Zheng C. Characteristics of hemicellulose, cellulose and lignin pyrolysis. Fuel 2007, 86, 1781–1788. 10.1016/j.fuel.2006.12.013. [DOI] [Google Scholar]
- Lam N. T.; Chollakup R.; Smitthipong W.; Nimchua T.; Sukyai P. Characterization of Cellulose Nanocrystals Extracted from Sugarcane Bagasse for Potential Biomedical Materials. Sugar Tech 2017, 19, 539–552. 10.1007/s12355-016-0507-1. [DOI] [Google Scholar]
- Beg Q.; Kapoor M.; Mahajan L.; Hoondal G. Microbial xylanases and their industrial applications: a review. Appl. Microbiol. Biotechnol. 2001, 56, 326–338. 10.1007/s002530100704. [DOI] [PubMed] [Google Scholar]
- Peng F.; Peng P.; Xu F.; Sun R.-C. Fractional purification and bioconversion of hemicelluloses. Biotechnol. Adv. 2012, 30, 879–903. 10.1016/j.biotechadv.2012.01.018. [DOI] [PubMed] [Google Scholar]
- Penjumras P.; Rahman R. B. A.; Talib R. A.; Abdan K. Extraction and characterization of cellulose from durian rind. Agric. Agric. Sci. Procedia 2014, 2, 237. 10.1016/j.aaspro.2014.11.034. [DOI] [Google Scholar]
- Taleb F.; Ammar M.; Mosbah M. B.; Salem R. B.; Moussaoui Y. Chemical modification of lignin derived from spent coffee grounds for methylene blue adsorption. Sci. Rep. 2020, 10, 11048 10.1038/s41598-020-68047-6. [DOI] [PMC free article] [PubMed] [Google Scholar]
- Chylińska M.; Szymańska-Chargot M.; Zdunek A. Imaging of polysaccharides in the tomato cell wall with Raman microspectroscopy. Plant Methods 2014, 10, 14 10.1186/1746-4811-10-14. [DOI] [PMC free article] [PubMed] [Google Scholar]
- Bock P.; Gierlinger N. Infrared and Raman spectra of lignin substructures: Coniferyl alcohol, abietin, and coniferyl aldehyde. J. Raman Spectrosc. 2019, 50, 778–792. 10.1002/jrs.5588. [DOI] [PMC free article] [PubMed] [Google Scholar]
- Zeng Y.; Yarbrough J. M.; Mittal A.; Tucker M. P.; Vinzant T. B.; Decker S. R.; Himmel M. E. In situ label-free imaging of hemicellulose in plant cell walls using stimulated Raman scattering microscopy. Biotechnol. Biofuels 2016, 9, 256 10.1186/s13068-016-0669-9. [DOI] [PMC free article] [PubMed] [Google Scholar]
- Kačuráková M.; Wellner N.; Ebringerová A.; Hromádková Z.; Wilson R.; Belton P. Characterisation of xylan-type polysaccharides and associated cell wall components by FT-IR and FT-Raman spectroscopies. Food Hydrocolloids 1999, 13, 35–41. 10.1016/S0268-005X(98)00067-8. [DOI] [Google Scholar]
- Ding J.; Yoo C. G.; Pu Y.; Meng X.; Bhagia S.; Yu C.; Ragauskas A. J. Cellulolytic enzyme-aided extraction of hemicellulose from switchgrass and its characteristics. Green Chem. 2019, 21, 3902–3910. 10.1039/C9GC00252A. [DOI] [Google Scholar]
- Klemm D.; Heublein B.; Fink H.-P.; Bohn A. Cellulose: Fascinating Biopolymer and Sustainable Raw Material. Angew. Chem., Int. Ed. 2005, 44, 3358–3393. 10.1002/anie.200460587. [DOI] [PubMed] [Google Scholar]
- Chen X.; Yu J.; Zhang Z.; Lu C. Study on structure and thermal stability properties of cellulose fibers from rice straw. Carbohydr. Polym. 2011, 85, 245–250. 10.1016/j.carbpol.2011.02.022. [DOI] [Google Scholar]
- Khatri M.; Ahmed F.; Shaikh I.; Phan D.-N.; Khan Q.; Khatri Z.; Lee H.; Kim I. S. Dyeing and characterization of regenerated cellulose nanofibers with vat dyes. Carbohydr. Polym. 2017, 174, 443–449. 10.1016/j.carbpol.2017.06.125. [DOI] [PubMed] [Google Scholar]
- Lu Q.; Cai Z.; Lin F.; Tang L.; Wang S.; Huang B. Extraction of cellulose nanocrystals with a high yield of 88% by simultaneous mechanochemical activation and phosphotungstic acid hydrolysis. ACS Sustainable Chem. Eng. 2016, 4, 2165–2172. 10.1021/acssuschemeng.5b01620. [DOI] [Google Scholar]
- Kulpinski P.; Erdman A.; Namyslak M.; Fidelus J. D. Cellulose fibers modified by Eu3+-doped yttria-stabilized zirconia nanoparticles. Cellulose 2012, 19, 1259–1269. 10.1007/s10570-012-9704-6. [DOI] [Google Scholar]
- Liu C.-F.; Ren J.-L.; Xu F.; Liu J.-J.; Sun J.-X.; Sun R.-C. Isolation and Characterization of Cellulose Obtained from Ultrasonic Irradiated Sugarcane Bagasse. J. Agric. Food Chem. 2006, 54, 5742–5748. 10.1021/jf060929o. [DOI] [PubMed] [Google Scholar]
- Camargo L.; Pereira S.; Correa A.; Farinas C.; Marconcini J.; Mattoso L. Feasibility of manufacturing cellulose nanocrystals from the solid residues of second-generation ethanol production from sugarcane bagasse. BioEnergy Res. 2016, 9, 894–906. 10.1007/s12155-016-9744-0. [DOI] [Google Scholar]
- Sricharussin W.; Ree-iam P.; Phanomchoeng W.; Poolperm S. Effect of enzymatic treatment on the dyeing of pineapple leaf fibres with natural dyes. ScienceAsia 2009, 35, 31–36. 10.2306/scienceasia1513-1874.2009.35.031. [DOI] [Google Scholar]
- Bukhari M. N.; Shahid ul I.; Shabbir M.; Rather L. J.; Shahid M.; Singh U.; Khan M. A.; Mohammad F. Dyeing studies and fastness properties of brown naphtoquinone colorant extracted from Juglans regia L. on natural protein fiber using different metal salt mordants. Text. Cloth. Sustainability 2017, 3, 3 10.1186/s40689-016-0025-2. [DOI] [Google Scholar]
- Khatri M.; Ahmed F.; Shaikh I.; Phan D.-N.; Khan Q.; Khatri Z.; Lee H.; Kim I. S. Dyeing and characterization of regenerated cellulose nanofibers with vat dyes. Carbohydr. Polym. 2017, 174, 443–449. 10.1016/j.carbpol.2017.06.125. [DOI] [PubMed] [Google Scholar]
- Stamm O. A. Mechanisms of Reaction of Reactive Dyes with Cellulosic and other Fibres. J. Soc. Dyers Colour. 1964, 80, 416–422. 10.1111/j.1478-4408.1964.tb02603.x. [DOI] [Google Scholar]
- Wang M.; Wang X.; Guo C.; Zhao T.; Li W. A Feasible Method Applied to One-Bath Process of Wool/Acrylic Blended Fabrics with Novel Heterocyclic Reactive Dyes and Application Properties of Dyed Textiles. Polymers 2020, 12, 285 10.3390/polym12020285. [DOI] [PMC free article] [PubMed] [Google Scholar]
- Wolfe K.; Wu X.; Liu R. H. Antioxidant Activity of Apple Peels. J. Agric. Food Chem. 2003, 51, 609–614. 10.1021/jf020782a. [DOI] [PubMed] [Google Scholar]
- Ghanbarzadeh B.; Almasi H.; Entezami A. A. Physical properties of edible modified starch/carboxymethyl cellulose films. Innovative Food Sci. Emerging Technol. 2010, 11, 697–702. 10.1016/j.ifset.2010.06.001. [DOI] [Google Scholar]
- Segal L.; Creely J.; Martin A. Jr.; Conrad C. An empirical method for estimating the degree of crystallinity of native cellulose using the X-ray diffractometer. Text. Res. J. 1959, 29, 786–794. 10.1177/004051755902901003. [DOI] [Google Scholar]
Associated Data
This section collects any data citations, data availability statements, or supplementary materials included in this article.