

Abstract
In 2017, an estimated 17,000 individuals were diagnosed with esophageal adenocarcinoma (EAC) and less than 20% will survive 5 years. PET-avidity is indicative of high glucose utilization and is nearly universal in EAC. TXNIP blocks glucose uptake and exhibits pro-apoptotic functions. Higher expression in EAC has been associated with improved disease-specific survival, lack of lymph node involvement, reduced perineural invasion, and increased tumor differentiation. We hypothesized that TXNIP may act as a tumor suppressor that sensitizes EAC cells to standard chemotherapeutics.
EAC cell lines and a Barrett’s epithelial cell line were used. qRT-PCR, immunoblot, and immunofluorescence techniques evaluated gene expression. TXNIP was stably over-expressed or knocked down using lentiviral RNA transduction techniques. Murine xenograft methods examined growth following over-expression of TXNIP. Apoptosis and DNA damage were measured by Annexin V and ɣH2AX assays. Activation of the intrinsic apoptosis was quantitated with green fluorescence protein-caspase 3 reporter assay.
In cultured cells and an esophageal tissue array, TXNIP expression was higher in Barrett’s epithelia and normal tissue compared to EAC. Constitutive over-expression of TXNIP decreased proliferation, clonogenicity, and tumor xenograft growth. TXNIP overexpression increased whereas knockdown abrogated DNA damage and apoptosis following cisplatin treatment. An HDAC-inhibitor, entinostat (currently in clinical trials), upregulated TXNIP and synergistically increased cisplatin-mediated DNA damage and apoptosis.
TXNIP is a tumor suppressor that is down-regulated in EACC. Its re-expression dramatically sensitizes these cells to cisplatin. Our findings support phase I/II evaluation of ‘priming’ strategies to enhance the efficacy of conventional chemotherapeutics in EAC.
Keywords: TXNIP, Esophageal Adenocarcinoma, HDAC inhibitor
INTRODUCTION
Esophageal cancer ranks among the top causes of cancer-related mortality worldwide. Squamous cell cancers predominate in Asia, South America, and endemic areas in the Middle East and Africa. Adenocarcinoma is the dominant subtype of esophageal cancer in the United States, presently accounting for approximately 17,000 malignancies annually with an average yearly incidence increasing 6%.(1) Despite intensive efforts to improve diagnosis and treatment of esophageal adenocarcinomas (EAC), 5-year survival rates remain less than 20%.(2) These observations highlight the urgent need for novel and more efficacious therapeutic strategies for EAC.
Altered energy metabolism or ‘deregulating cellular energetics’ is a relatively recently accepted hallmark of cancer that was first described by Dr. Warburg nearly a century ago.(3, 4) Warburg observed that cancer cells generate ATP not through oxidative phosphorylation (OXPHOS) in the mitochondria, but rather through aerobic glycolysis even under normal oxygen conditions. This ‘Warburg effect’ which decreases ATP production (2 vs 36 per mole glucose) and increases lactate production appears counterintuitive; however, these metabolic alterations facilitate biosynthesis of macromolecules such as proteins, nucleotides, and lipids through the mitochondria.(5) (6) Therefore, glycolysis does not maintain energy demands secondary to defective mitochondria; rather, mitochondrial alterations such as substrate oxidation, ROS production, or mitochondrial DNA mutations are necessary cellular adaptations for malignant transformation.(7, 8) (9)
In clinical settings, intra-tumoral glucose utilization is measured by positron emission tomography (PET) which quantifies uptake of the radiolabeled tracer 2-deoxy-2-[18F]fluoro-D-glucose (FDG).(10) PET-avidity is nearly universal in patients with EAC indicating high glucose utilization; however, bioenergetic demands require additional nutrients to sustain rapid tumor growth. Increased rates of glycolysis result in the accumulation of pyruvate which is converted to acetyl-CoA - a major substrate for the tricarboxylic acid (Krebs) cycle. This process enables both NADPH production and macromolecule biosynthesis.(11–13) As substrates for these pathways are extracted, glutamine is converted to alpha-ketoglutarate which replenishes the Krebs Cycle to maintain NADPH production – a process termed ‘glutamine anapleurosis’.(14) Nutrient deprivation studies have demonstrated that some cancer types become dependent on glutamine as a mitochondrial fuel to maintain anapleurosis.(12) This ‘glutamine addiction’ though present in many cancer types, is not universal to all malignancies.(15) To date, the role of glutamine in EAC has not been explored.(5)
Thioredoxin-interacting protein (TXNIP) functions as a metabolic regulator in normal and malignant cells.(16–22) Glucose increases expression of TXNIP which in turn inhibits further glucose uptake. In contrast, glutamine inhibits TXNIP expression, thus facilitating glucose uptake. As such, TXNIP appears to link glucose utilization and glutamine anapleurosis. In addition, by mechanisms that have not been fully elucidated, TXNIP appears to function as a tumor suppressor in multiple cancers.(17, 23, 24) TXNIP expression in EAC has been associated with higher tumor differentiation, lack of lymph node metastases, and reduced perineural invasion. High TXNIP expression also correlated with improved disease-specific survival in EAC patients receiving anthracycline-based chemotherapy prior to esophagectomy.(25, 26)
We hypothesized that glutamine is essential for EAC growth and represses TXNIP expression. Additionally, we hypothesized that TXNIP acts as a tumor suppressor in EAC that, if re-expressed, could sensitize EAC to standard therapy.
MATERIALS AND METHODS
Cell culture
NCI-SB-Esc1, -Esc2, and -Esc3 are EAC cell (EACC) lines established in the laboratory of Dr. David S. Schrump. EACC lines OE33 (JROECL33) and Flo-1 were purchased from European Collection of Authenticated Cell Cultures via Sigma. CP-C (CP-94251) is an hTERT-immortalized Barrett’s line from ATCC. All cell lines were authenticated yearly with human leukocyte antigen (HLA) analysis by NIH-HLA laboratory (Supplemental Table S1) and tested for mycoplasma contamination every six months. Cells were cultured in RPMI (ThermoFisher 11875–093) supplemented with 10% fetal calf serum (Omega #FB-12) and 1% penicillin/streptomycin (Gibco #15140–122). Glucose and glutamine withdrawal experiments were conducted using DMEM (ThermoFisher A1443001). Ten mM glucose was diluted from 45% D-(+)-Glucose solution (Sigma G8769). Two mM glutamine was diluted from 200 mM L-glutamine solution (Gibco 25030–081).
Cell proliferation
Cell proliferation assays were performed using the CyQUANT Cell Proliferation Assay Kit (Life Technologies #C7026) using a fluorescence spectrophotometer (Biotek Synergy H1 Microplate Reader).
Immunohistochemistry
Immunohistochemical stains for TXNIP (rabbit monoclonal, clone EPR14774, Abcam, Cambridge, MA, USA, catalog #ab188865, 1:500 dilution) using standard immunohistochemical techniques for normal esophageal and adenocarcinoma specimens were fixed with paraformaldehyde, paraffin-embedded, and cut to 5 microns (US BioMax, Rockville, MD, catalog #’s HuFPT041 and HuCat041, respectively). Sequential xylenes deparaffinized histopathologic specimens. Sequential ethanols rehydrated specimens. Antigen retrieval was performed at 110°C for 10 min employing Decloaking Chamber (BioCare Medical, Concord, CA, USA). Endogenous peroxidases were quenched using 6% hydrogen peroxide for 10 min. The primary antibody was incubated for 60 min. For detection, the Vector ABC kit (Vector Labs, Burlingame, CA, USA) was used with diaminobenzidine as chromogen (Vector Labs). Counterstaining was accomplished using Harris hematoxylin (Sigma-Aldrich, St. Louis, MO, USA).
Immunoblotting
5 μg of fractionated or immunoprecipitated proteins were resolved in 4–20% SDS-polyacrylamide gels, electrotransferred onto nitrocellulose membranes, and blocked for 1 h at 25°C in PBS containing 5% nonfat dry milk and 0.1% Tween. Blots were incubated with antibodies (Supplemental Table 2) for 1 h at room temperature or 4⁰C overnight, washed three times with PBS containing 0.05% Tween, and incubated with horseradish peroxidase-conjugated secondary antibodies for 1 h at room temperature. The blots were washed 5–6 times in PBS containing 0.05% Tween and the immunocomplexes were detected using the SuperSignal® West Femto Maximum Sensitivity Substrate (Thermo #34095). Western blot quantification and normalization to actin following user guide by Image Lab.
RNA Extraction and Quantitative RT-PCR
RNA was isolated using the RNeasy minikit (Qiagen, #74104) and reverse transcribed with the iScript Bio-Rad iScript cDNA Synthesis kit (Bio-Rad #1708890). Gene expression was evaluated via quantitative reverse transcription PCR with QuantStudio™ 6 Flex Real-Time PCR System (ThermoFisher #4485697) in comparative Ct mode (primers: Supplemental Table 2).
Generation of Stable Cells
Cells were transduced with commercially validated lentiviral shRNA targeting TXNIP (Sigma #SHCLNV-NM_006472), TXNIP (Sigma # SHCLND_006472.3–946s21c1), or sham sequences (Sigma #SHC002V) (Supplemental Figure 1). To overexpress genes, cells were transduced with high titer lentivirus containing pLenti-GIII-CMV TXNIP (ABM #LVP349505) or Lenti-III-Blank Lentivirus (ABM #LVP587). Cells were transfected with caspase 3 reporter plasmid. Stable pools were expanded under puromycin (Sigma #P9620–10ML) selection at 1ug/mL concentration.
Murine Xenografts
Esc2 cells transfected with Lenti-III-Blank Lentivirus control and pLenti-GIII-CMV TXNIP were suspended in phosphate-buffered saline (PBS) at 1 × 10⁶ cells/100 μL for flank injections. TXNIP-transduced or vector cells were injected subcutaneously into female, athymic, nude mice. The same number of cells with control vectors were injected in the other flank (10 mice / 20 flanks per experiment). Tumor size was measured every other day for tumor volumes (V = ½ × L × W2 (L - length (longest dimension); W - width (shortest dimension))). Mice were euthanized at 25–30 days and evaluated for tumor take and mass. Animal procedures were approved by the National Cancer Institute Animal Care and Use Committee.
Seahorse Extracellular Flux Analysis
Oxygen consumption rates (OCR) and extracellular acidification rates (ECAR) of live cells were measured using a Seahorse Bioscience XF96 Extracellular Flux Analyzer as described. Seahorse programing consisted of 4 3-min baseline measurements with 1-min intervals which were repeated after each injection. All values were normalized to DNA content of each well to account for growth differences.
Glucose Uptake, Glutamate Production, and Lactate Production
Cells were seeded in triplicate with corresponding triplicate wells containing media only in 24-well plates. 24 h after seeding media was removed, 500 uL of experimental media was added to the blank and cell containing wells. After 3 to 5 days, 300 uL of media was removed and placed into 1.5 mL tubes. The YSI 2950D Biochemistry Analyzer (YSI #52760) measured glucose, glutamine, lactate, and glutamate content. All values were normalized to DNA content.
Anchorage-Independent Growth
Cells were trypsinized to generate a single-cell suspension and seeded in 6 well plates with under-layers of 0.70% agarose in RPMI medium with 10% FCS. Soft-agar plates tested capacity for colony growth. Cells were plated in triplicate at densities of 1×10⁴ in 1 ml of 0.35% agarose over agar base. Cultures were fed every 7 days. After 3 weeks, media was removed, cells rinsed with PBS, and 1 ml 1% crystal violet was added for 1 h staining. >50 cell colonies were counted.
Drug Treatments
L-Glutamic acid γ-(p-nitroanilide) hydrochloride (GPNA) from Sigma-Aldrich (SKU G6133) was diluted in DMSO to 500 mM. 96-hour cell treatments with media changes after 48 h were performed in 2 mM in RPMI. Treatments with cisplatin (APP Pharmaceuticals NDC 63323-103-65) were conducted at dilutions from 0.35 to 6 ug/mL for 48 h. Entinostat (Alternate name: MS-275 (N-(2-Aminophenyl)-4-[N-(pyridin-3-ylmethoxycarbonyl)aminomethyl]benzamide) / Selleckchem / S1053) at 10 mM/1mL DMSO stock concentration was diluted to 1 uM.(27) Combination experiments were performed concurrently for 48 h. Apoptosis of control and biochemically or pharmacologically manipulated cells was quantitated using the Annexin V Apoptosis Assay (Takara cat# 630109) with a Calibur Flow Cytometer.
ɣH2AX
DNA double strand breaks were assessed by ɣH2AX innunofluorescence techniques as described with minor modifications. Briefly, cells were grown and treated on 18-mm glass coverslips then fixed using 5% paraformaldahyde, permeabilised using 0.5% Triton X-100, and counter-stained with Hoechst 33342 (Sigma #14533) at 10 nM. Fixed cell were then incubated for 1 h with a ɣH2AX antibody (Cell Signaling #54285; 1:200 dilution) followed by incubation for 1 h at room tempature with secondary anti-rabbit AF555 antibody (Invitrogen #A-11034; 5 μg/ml) before counter staining. Images were captured with a Zeiss LSM710 confocal microscope.
Chromatin immunoprecipitation (ChIP).
Cells were crosslinked with 1% formaldehyde, lysed and sonicated on ice to generate DNA fragments with an average length of 200–800 bp. After pre-clearing, 1% of each sample was saved as input fraction. Immunoprecipitation was performed using antibodies specifically recognizing H3K27ac (ab177178, Abcam), H3K27me3 (ab6002, Abcam), and H3K4me3 (ab8580, Abcam), or IgG control (Upstate). DNA was eluted and purified from complexes, followed by PCR amplification of the target promoters using primers listed in Supplementary Table 2 and conditions as described.
Statistical Analysis
All experiments were conducted in triplicate with quantitative data presented as means ± SEM. p-values were calculated with two-tailed student t tests. Results with P < 0.05 were considered statistically significant (*). Analysis performed with GraphPad Prism 6.0.
RESULTS
Glutamine is Required for Proliferation and Represses TXNIP
Initial experiments were performed to evaluate proliferation of EAC and Barrett’s cells cultured in the presence or absence of glucose, glutamine, or both. Glucose depletion had relatively limited growth inhibitory effects (Figure 1A). In contrast, glutamine depletion significantly decreased proliferation regardless of the presence or absence of glucose. Next, we asked whether blocking glutamine uptake would have effects similar to glutamine withdrawal. GPNA, an inhibitor of the cell membrane glutamine transporter, SLC1A5, decreased proliferation in manner similar to glutamine withdrawal (Figure 1B).
Figure 1. Glutamine is Required for Proliferation EACC. TXNIP is higher in esophageal adenocarcinoma samples and is repressed by glutamine.
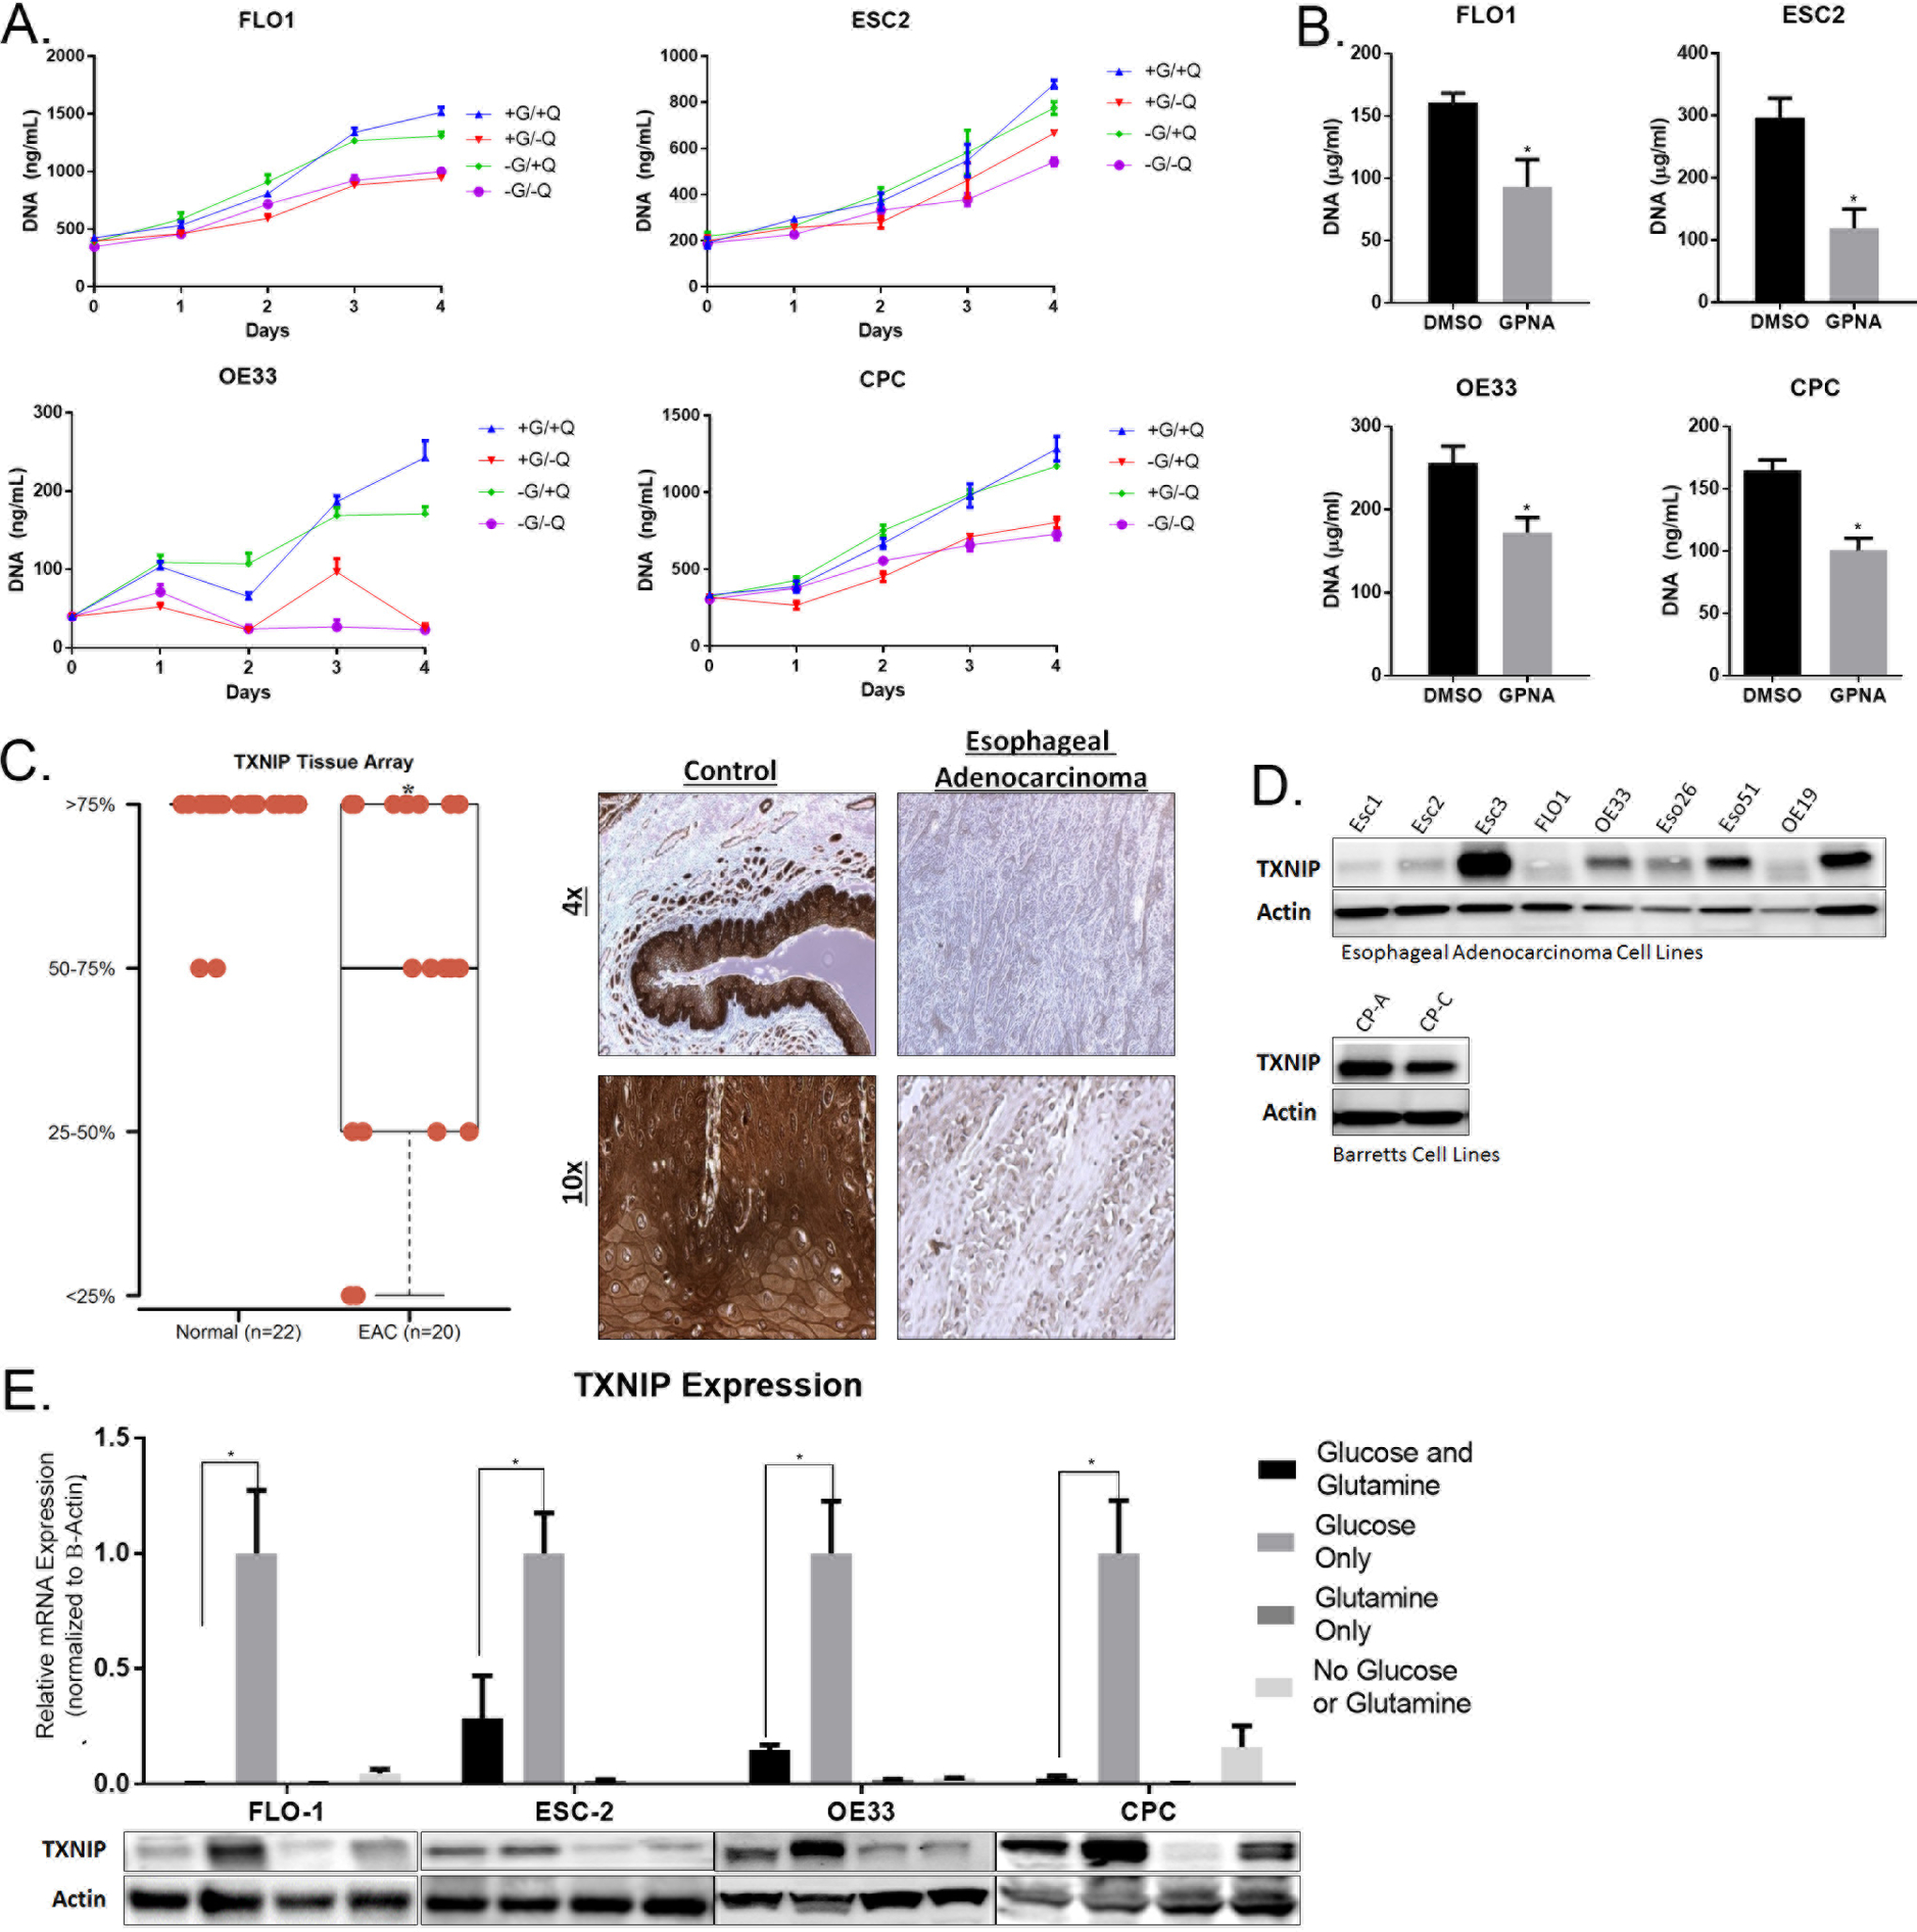
A. Flo-1, Esc2, OE33, and CP-C were cultured in DMEM with 1mM pyruvate. 10 mM glucose (G) and / or 2 mM glutamine (Q) are added as indicated. Cells were grown in 96-well plates; proliferation was measured using Cyquant DNA quantification kits.
B. Flo-1, Esc2, OE33, and CP-C were treated for 72 hours with L-Glutamic acid γ-(p-nitroanilide) hydrochloride (GPNA). Cells were grown in 96-well plates and proliferation was measured using Cyquant DNA quantification kits at day 5.
C. Samples were categorized into 4 levels of expression patterns. 22 normal esophageal tissue were compared to 20 EAC samples from a US Biomax microarray. The brown staining indicates TXNIP expression in a representative sample. The top row is magnified by 4x and the bottom row by 10x.
D. Immunoblot of TXNIP in EACC lines and Barrett’s Esophageal cell lines.
E. qRT-PCR and immunoblot normalized to b-actin measured TXNIP mRNA and protein expression after proliferation with glucose only, glutamine only, or both.
Given that EAC exhibit high glucose uptake in patients, yet EACC appear more dependent on glutamine, we asked whether glutamine impacts the utilization of glucose. Based on previous studies, we tested whether TXNIP linked glutamine dependence to glucose uptake in EACC. Initially, we utilized a tissue micro-array and immunohistochemistry techniques to examine TXNIP expression in normal esophageal tissues and EAC specimens. TXNIP expression was significantly decreased in 13 of 20 (65%) of primary EAC (Figure 1C; representative IHC results depicted in right panel). Immunoblot experiments demonstrated reduced TXNIP protein levels in 6 of 9 (66%) EACC relative to immortalized Barrett’s epithelial cell lines (Figure 1D). Next, we examined the effects of glucose and glutamine on TXNIP expression in EACC. As expected, glucose induced TXNIP expression in these cells (Figure 1E). However, glutamine almost completely abrogated glucose-mediated induction of TXNIP. These changes were consistent with epigenetic activation and repression marks at the TXNIP promoter (Supplemental Figure 1). Consistent with these findings, GPNA also increased TXNIP levels in EACC (Supplemental Figure 2).
TXNIP Was Associated with Modest Glycolytic Inhibition
Additional experiments were performed to examine the effects of TXNIP expression on glycolysis in EACC. TXNIP was either constitutively over-expressed or knocked down. Extracellular acidification rates (ECAR) and oxygen consumption rates (OCR) were evaluated using the SeaHorse techniques. Preliminary qRT-PCR and immunoblot experiments confirmed over-expression or knockdown of TXNIP. Over-expression of TXNIP decreased ECAR in Flo-1 but not Esc2 (Figure 2A). Additionally, knockdown of TXNIP in Esc2 did not alter ECAR (Supplemental Figure 3). Consistent with results of SeaHorse experiments, TXNIP over-expression significantly (albeit relatively modestly) decreased glucose uptake in Flo-1 but not Esc2 cells (Supplemental Figure 4). However, TXNIP expression decreased lactate secretion in Flo-1 and Esc2 cells indicating a global decrease in glycolysis (Figure 2B). Despite changes in lactate secretion, the expression levels of the rate-limiting enzyme in glycolysis, hexose kinase 2, and the lactate producing enzyme, lactate dehydrogenase-A (LDH-A), were unchanged (Supplemental Figure 5). These results suggest that TXNIP decreases glycolysis in EACC, but the effects are relatively modest and cell line dependent.
Figure 2. TXNIP Overexpression Was Associated with Modest Glycolytic Inhibition.
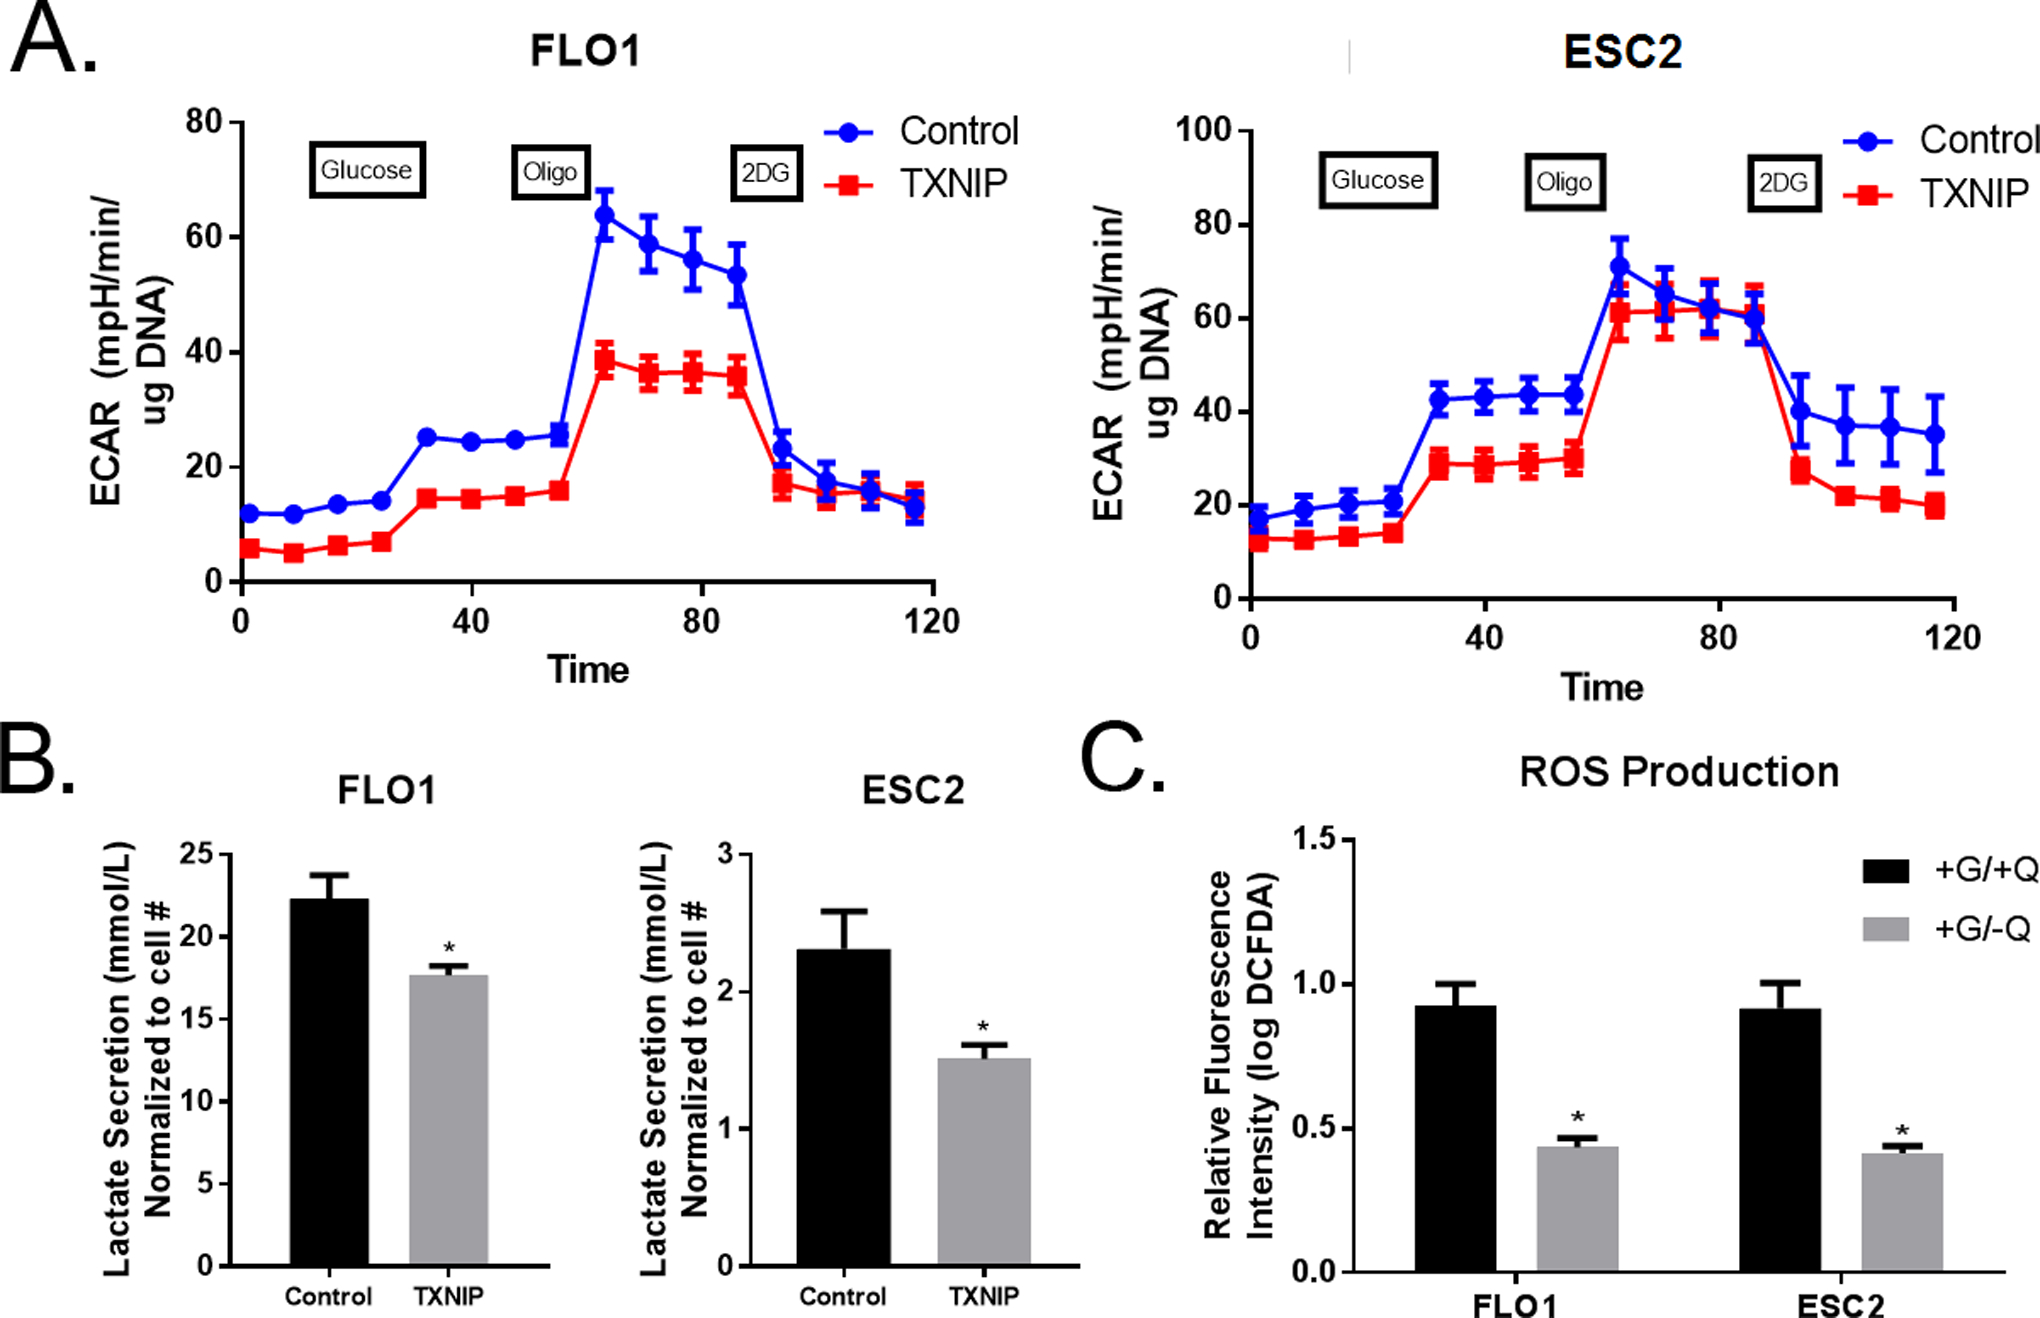
A. Realtime Seahorse extracellular flux analysis of extracellular acidification rate (ECAR) measures glycolytic activity based on sequential glucose, oligomycin (oligo), and 2-DG injections at the time points indicated. ECAR is measured in Flo-1 and Esc2 with TXNIP overexpressing cells versus controls.
B. YSI analyzer measured lactate secretion over a 5-day period in Flo-1 and Esc2 with overexpression of TXNIP.
C. Reactive Oxygen Species (ROS) production was measured using DCFDA kit with a Calibur flow cytometer after glutamine withdrawal.
Additional SeaHorse experiments were performed to examine the effects of TXNIP on mitochondrial respiration in EACC. Over-expression of TXNIP had no effect on OCR in Flo-1, Esc2, and OE33-cells (Supplemental Figure 6). Additionally, knockdown of TXNIP in Esc2 did not alter OCR (Supplemental Figure 7). Since TXNIP is an inhibitor of thioredoxin (Trx), the oxidative stress mediator that scavenges ROS, we evaluated the effects of TXNIP on ROS production. As anticipated, glutamine withdrawal significantly lowered ROS production in EACC (Figure 2C).
TXNIP as a Tumor Suppressor
Given that glutamine markedly represses TXNIP expression and significantly inhibits EACC proliferation, we asked whether TXNIP acts primarily as a tumor suppressor rather than a metabolic regulator in EACC. TXNIP over-expression significantly inhibited proliferation and decreased soft agar colony formation in EACC (Figure 3A and 3B). The antiproliferative effects of TXNIP were particularly dramatic in Esc2 cells. In contrast, knockdown of TXNIP had no effect on proliferation of Esc2 cells (Supplemental Figure 8). Clonogenicity assays using Esc2 cells were not performed because previous experiments had demonstrated that these EACC do not form colonies.
Figure 3. TXNIP Acts As a Tumor Suppressor in EACC.
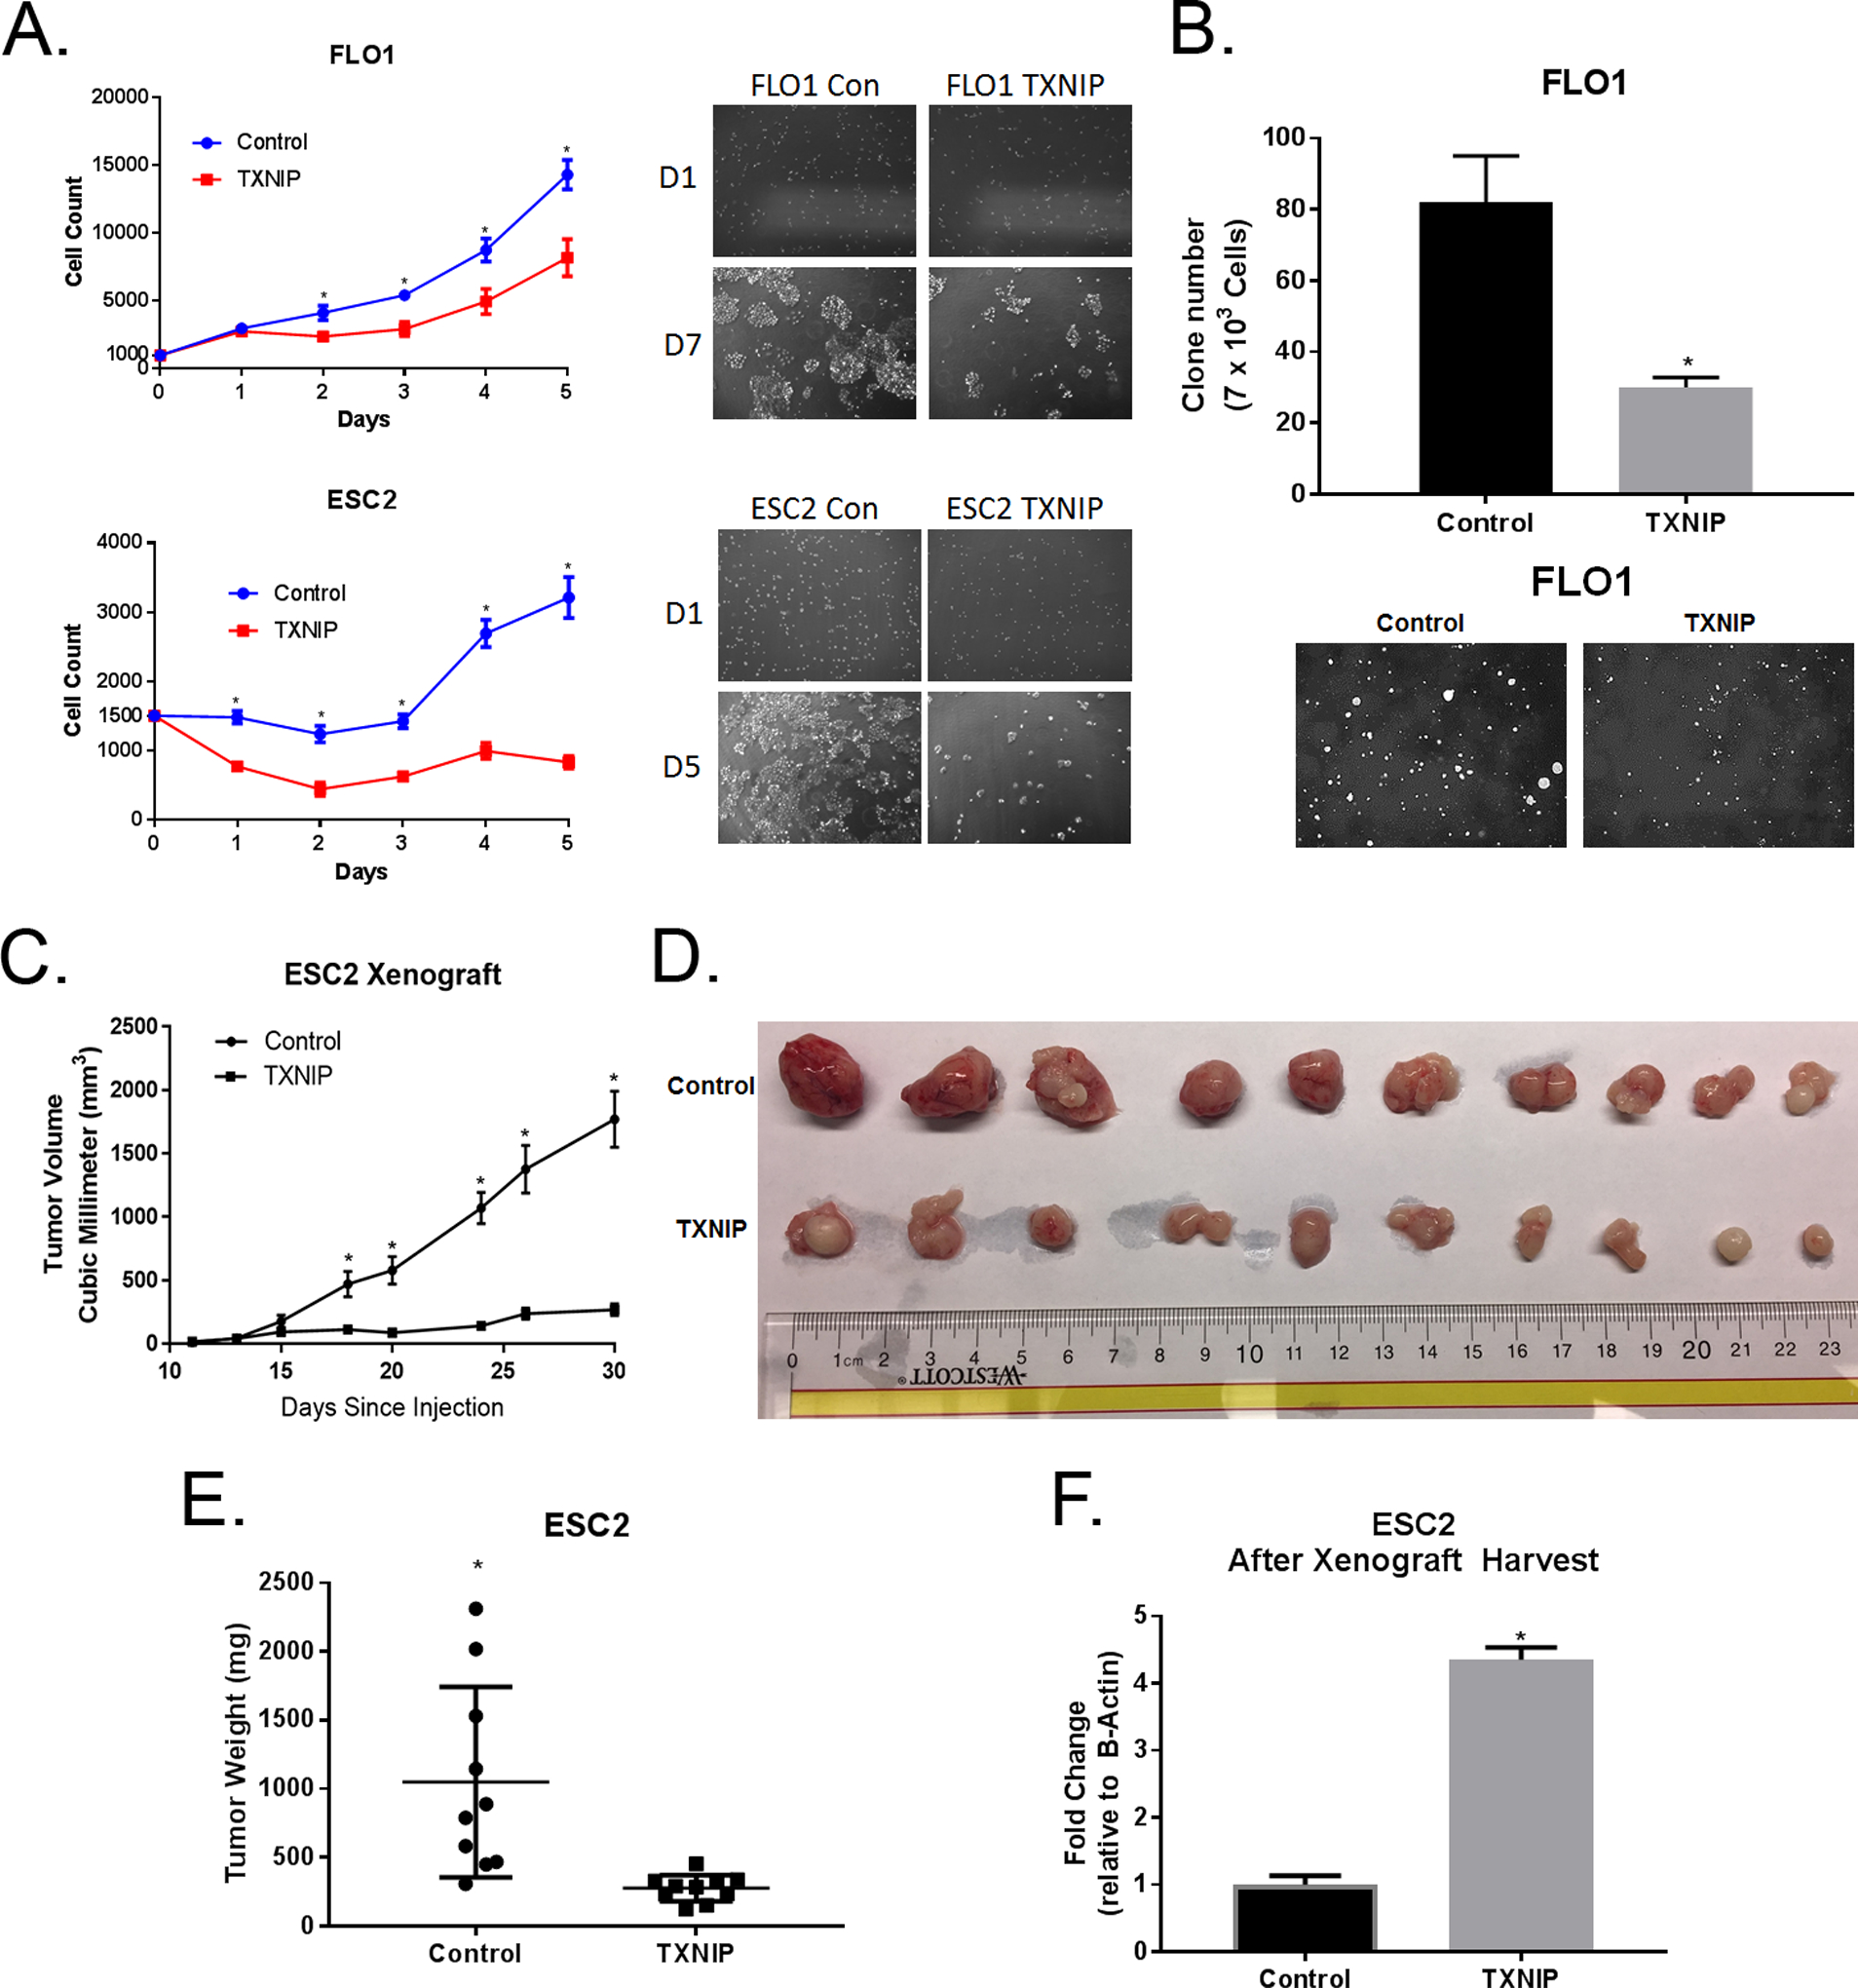
A. After selection, EACC overexpressing TXNIP were grown in non-puromycin growth media for 5 days and proliferation was quantified using Cyquant DNA measurement kits. DNA measurements were translated into cell numbers by a standard curve. Flo-1and Esc2 cells were seeded at 1,500 and 1,000 cells per well, respectively.
B. Colonies of EACC overexpressing TXNIP in soft agar were stained with crystal violet, photographed, and counted (mean ± SD).
C. Esc2 overexpressing TXNIP versus control cells were injected subcutaneously into flanks of nude mice (10 mice / 20 flanks per experiment). Tumor growth curve in nude mice were measured by caliper (mean ± SEM).
D. Mice were sacrificed and tumors harvested 30 days after injection. Photographs of each harvested tumors derived from both groups are displayed. The upper row is tumors from control cells and the bottom row is tumors from cells overexpressing TXNIP.
E. Tumor weight was measured (mean ± SEM).
F. RNA was extracted from emulsified fragments of each tumor and TXNIP mRNA expression was quantified using qRT-PCR normalized to β-actin.
Because Flo-1 cells normally exhibit low tumorigenicity in athymic nude mice, we evaluated the effects of TXNIP on growth of EACC in-vivo using Esc2 cells. Esc2 had previously shown reliably to form xenografts. As shown in Figures 3 C, D and E, volumes and masses of subcutaneous xenografts established from Esc2 overexpressing TXNIP were significantly smaller than tumors derived from vector control cells. qRT-PCR analysis confirmed high level TXNIP expression were maintained in xenografts (Figure 3F).
Given that even low levels of ROS can induce phenotypic changes we tested proliferation and clonogenicity in Esc2 and Flo-1 cells overexpressing TXNIP, respectively, when treated with N-acetyl-cysteine (NAC) (Supplemental Figure 9). NAC did not affect phenotypic changes associated with TXNIP which suggest that although TXNIP has been reported to block removal of ROS by Trx, the effects of TXNIP on ROS in EACC are minimal at best. Given that EAC can grow under hypoxia conditions, we tested proliferation, clonogenicity, and lactate secretion in EACC cells in 5% O2 and noted that the effects of TXNIP occurred in both normoxic and hypoxic conditions (Supplemental Figures 10, 11, 12). Finally, we performed transcriptomic analysis of differentially regulated genes in Flo-1 and Esc2 presented in Supplemental Tables 3 and 4.
TXNIP Expression Increases Effectiveness of Platinum-Based Chemotherapy
In light of observations that TXNIP expression in gastroesophageal carcinomas has been associated with improved survival in patients treated with induction chemotherapy prior to esophagectomy, we queried whether standard therapy modulated the expression of TXNIP. Because platinum-based chemotherapy is first line treatment for the vast majority of esophageal cancer patients in the United States, our experiments focused on the effects of cisplatin (CDDP) on TXNIP expression in EACC. Briefly, EACC (all of which are p53 mutant) were cultured in absence or presence of CDDP at varying doses for 72 h and harvested for analysis. The dosages were established based on IC50 of CDDP in the various EACC. CDDP mediated a dose-dependent induction of TXNIP mRNA levels in Flo-1, Esc2, and OE33 (Figure 4A). CDDP also increased TNXIP protein levels in EACC. Additional qRT-PCR experiments demonstrated that CDDP significantly up-regulated TXNIP expression even further in EACC constitutively expressing TXNIP (Figure 4B). Additionally, knock-down of TXNIP significantly attenuated CDDP-mediated induction of TXNIP in EACC (Figure 4C). These findings show that cisplatin robustly induces TXNIP regardless of its baseline expression in EACC.
Figure 4. Platinum-Based Chemotherapy Increased TXNIP Expression and Overexpression of TXNIP Enhanced the Effectiveness of this Therapy.
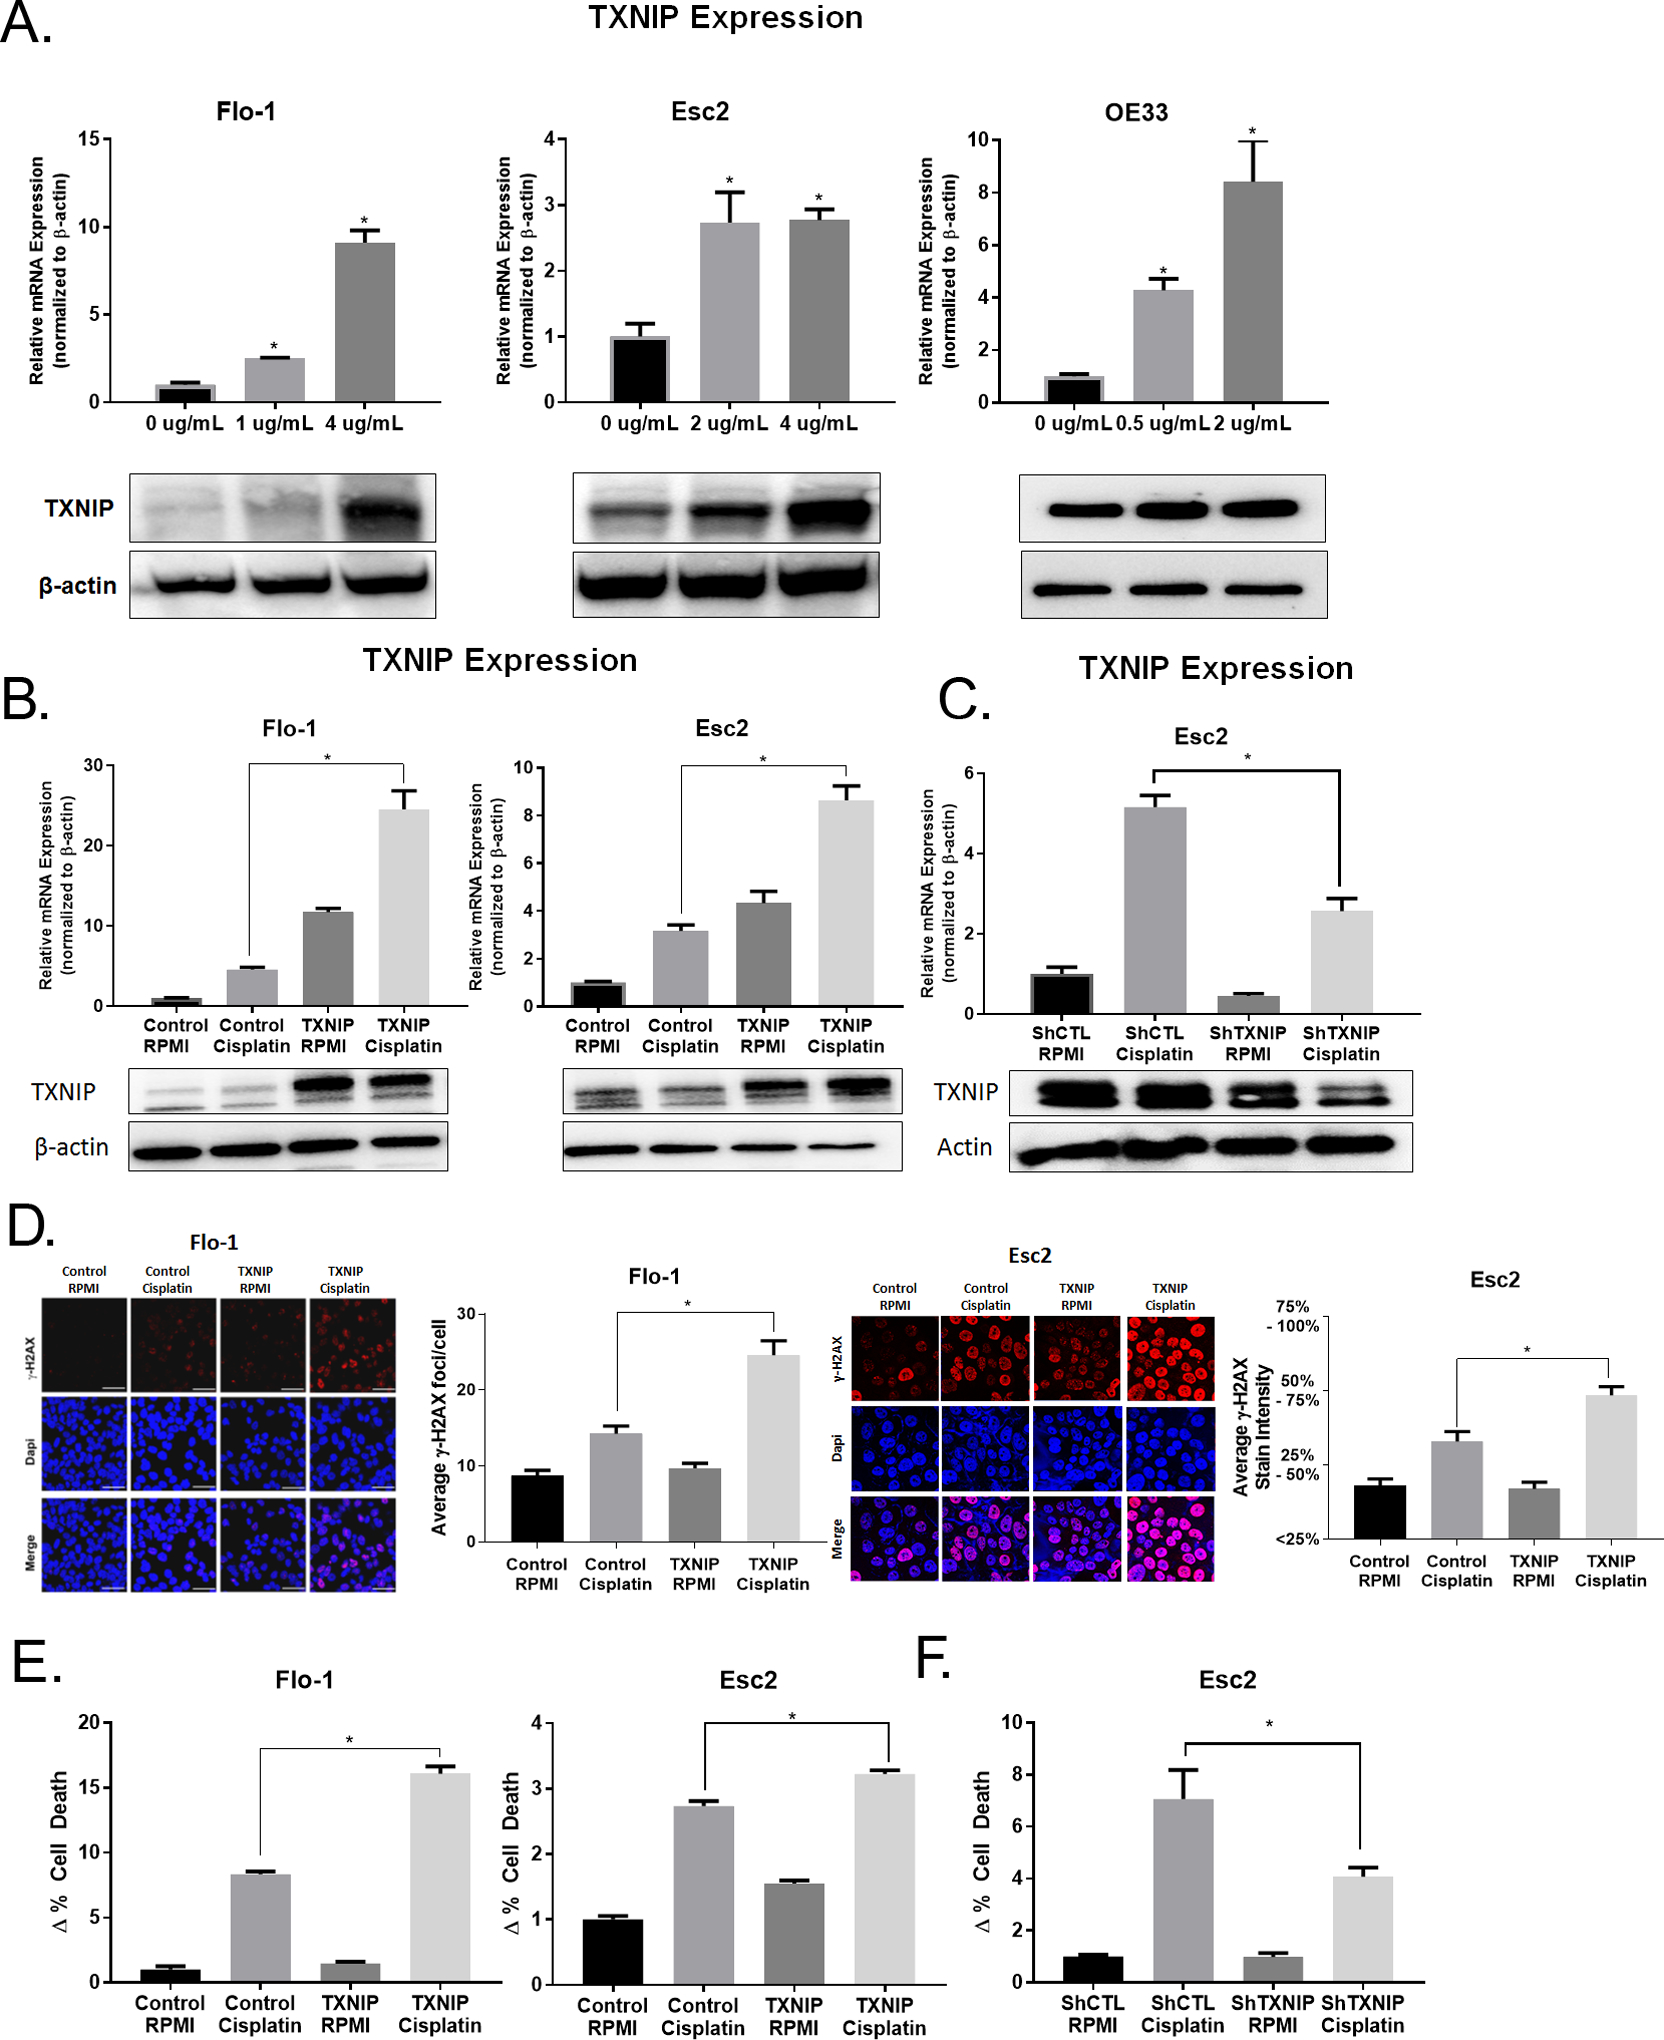
A. Cells were treated with cisplatin for 72 h at the concentrations indicated. qRT-PCR and immunoblots of TXNIP expression were normalized with β-actin.
B. Flo-1 overexpressing TXNIP were treated with 4 ug/mL of cisplatin and Esc2 overexpressing TXNIP were treated with 1.0 ug/mL of cisplatin for 24 h. qRT-PCR and immunoblots of TXNIP expression were normalized with β-actin.
C. Esc2 cells with lentiviral shRNA knockdown of TXNIP were treated with 1.5 ug/mL of cisplatin for 24 h. qRT-PCR and immunoblots of TXNIP expression were normalized with β-actin.
D. Cell lines were treated with the same time and concentrations as in (B.), after which, γH2AX immunofluorescent staining was performed. In Flo-1, puncts were counted in 50 cells from each group. Esc2 had very high γH2AX uptake and so levels were categorized based on percent staining intensity.
E. - F. Annexin V apoptosis assay was performed after cisplatin treatment as described in (B.).
Given recent observations that TXNIP expression enhances sensitivity of pancreatic cancer cells to CDDP, we asked whether TXNIP expression increases CDDP-mediated toxicity in EACC. γH2AX assays demonstrated that as anticipated, CDDP induced DNA damage. TXNIP expression alone did not induce DNA damage. However, TXNIP over-expression significantly increased DNA double strand breaks induced by CDDP in EACC (Figure 4D). The effects were so robust in Esc2 that the scale of average ɣH2AX foci/cell had to be changed to staining intensity because of the dense and overlapping foci in Esc2 cells preventing counting of individual foci. Additionally, annexin V assays demonstrated that TXNIP over-expression alone did not increase apoptosis in EACC. However, TXNIP over-expression significantly sensitized EACC to CDDP-mediated apoptosis (Figure 4E). Consistent with these observations, knockdown of TXNIP markedly attenuated CDDP-mediated apoptosis in EACC (Figure 4F).
Combined Entinostat and Cisplatin Treatment Is Associated with TXNIP Induction and Increased Apoptosis
Results described thus far demonstrate that EACC are dependent on glutamine, and that glutamine represses TXNIP expression in these cells. TXNIP expression is decreased in a significant percentage of cultured EACC and primary EAC. Restoration of TXNIP expression markedly inhibits growth of EACC in-vitro and in-vivo, and sensitizes these cells to CDDP-mediated DNA damage and apoptosis. Given that targeting the glutamine pathway is difficult, and that transduction of TXNIP is not practical in EAC patients, we sought a clinically actionable method to recapitulate our laboratory findings. TXNIP expression has been shown previously to be modulated by opposing actions of histone acetyltransferases and histone deacetylases, therefore, we examined whether entinostat, an HDAC inhibitor (HDACi) currently in clinical trials, could recapitulate the findings of TXNIP overexpression in EACC. qRT-PCR and immunoblot experiments (Figure 5A) demonstrated that entinostat alone had minimal effects on TXNIP expression; however, entinostat markedly enhanced CDDP-mediated up-regulation of TXNIP in EACC. Consistent with these findings, treatment of EACC with cisplatin and entinostat synergistically increased DNA damage (Figure 5B) and apoptosis (Figure 5C and Supplemental Figure 13). Given the fact entinostat by itself did not induce TXNIP, yet appeared to augment TXNIP upregulation and cytotoxicity mediated by CDDP, additional experiments were performed to examine whether the pro-apoptotic effects of entinostat-CDDP were TXNIP dependent. Indeed, knockdown of TXNIP significantly abrogated the induction of apoptosis by the combination of CDDP and entinostat (Figure 5D and Supplemental Figure 14). These results are consistent with increases in the activation mark, H3K27Ac, at the TXNIP promoter when treated with the combination of drugs (Supplemental Figure 15).
Figure 5. Combined Entinostat and Cisplatin Treatment Is Associated with TXNIP Induction and Increased DNA Damage and Apoptosis.
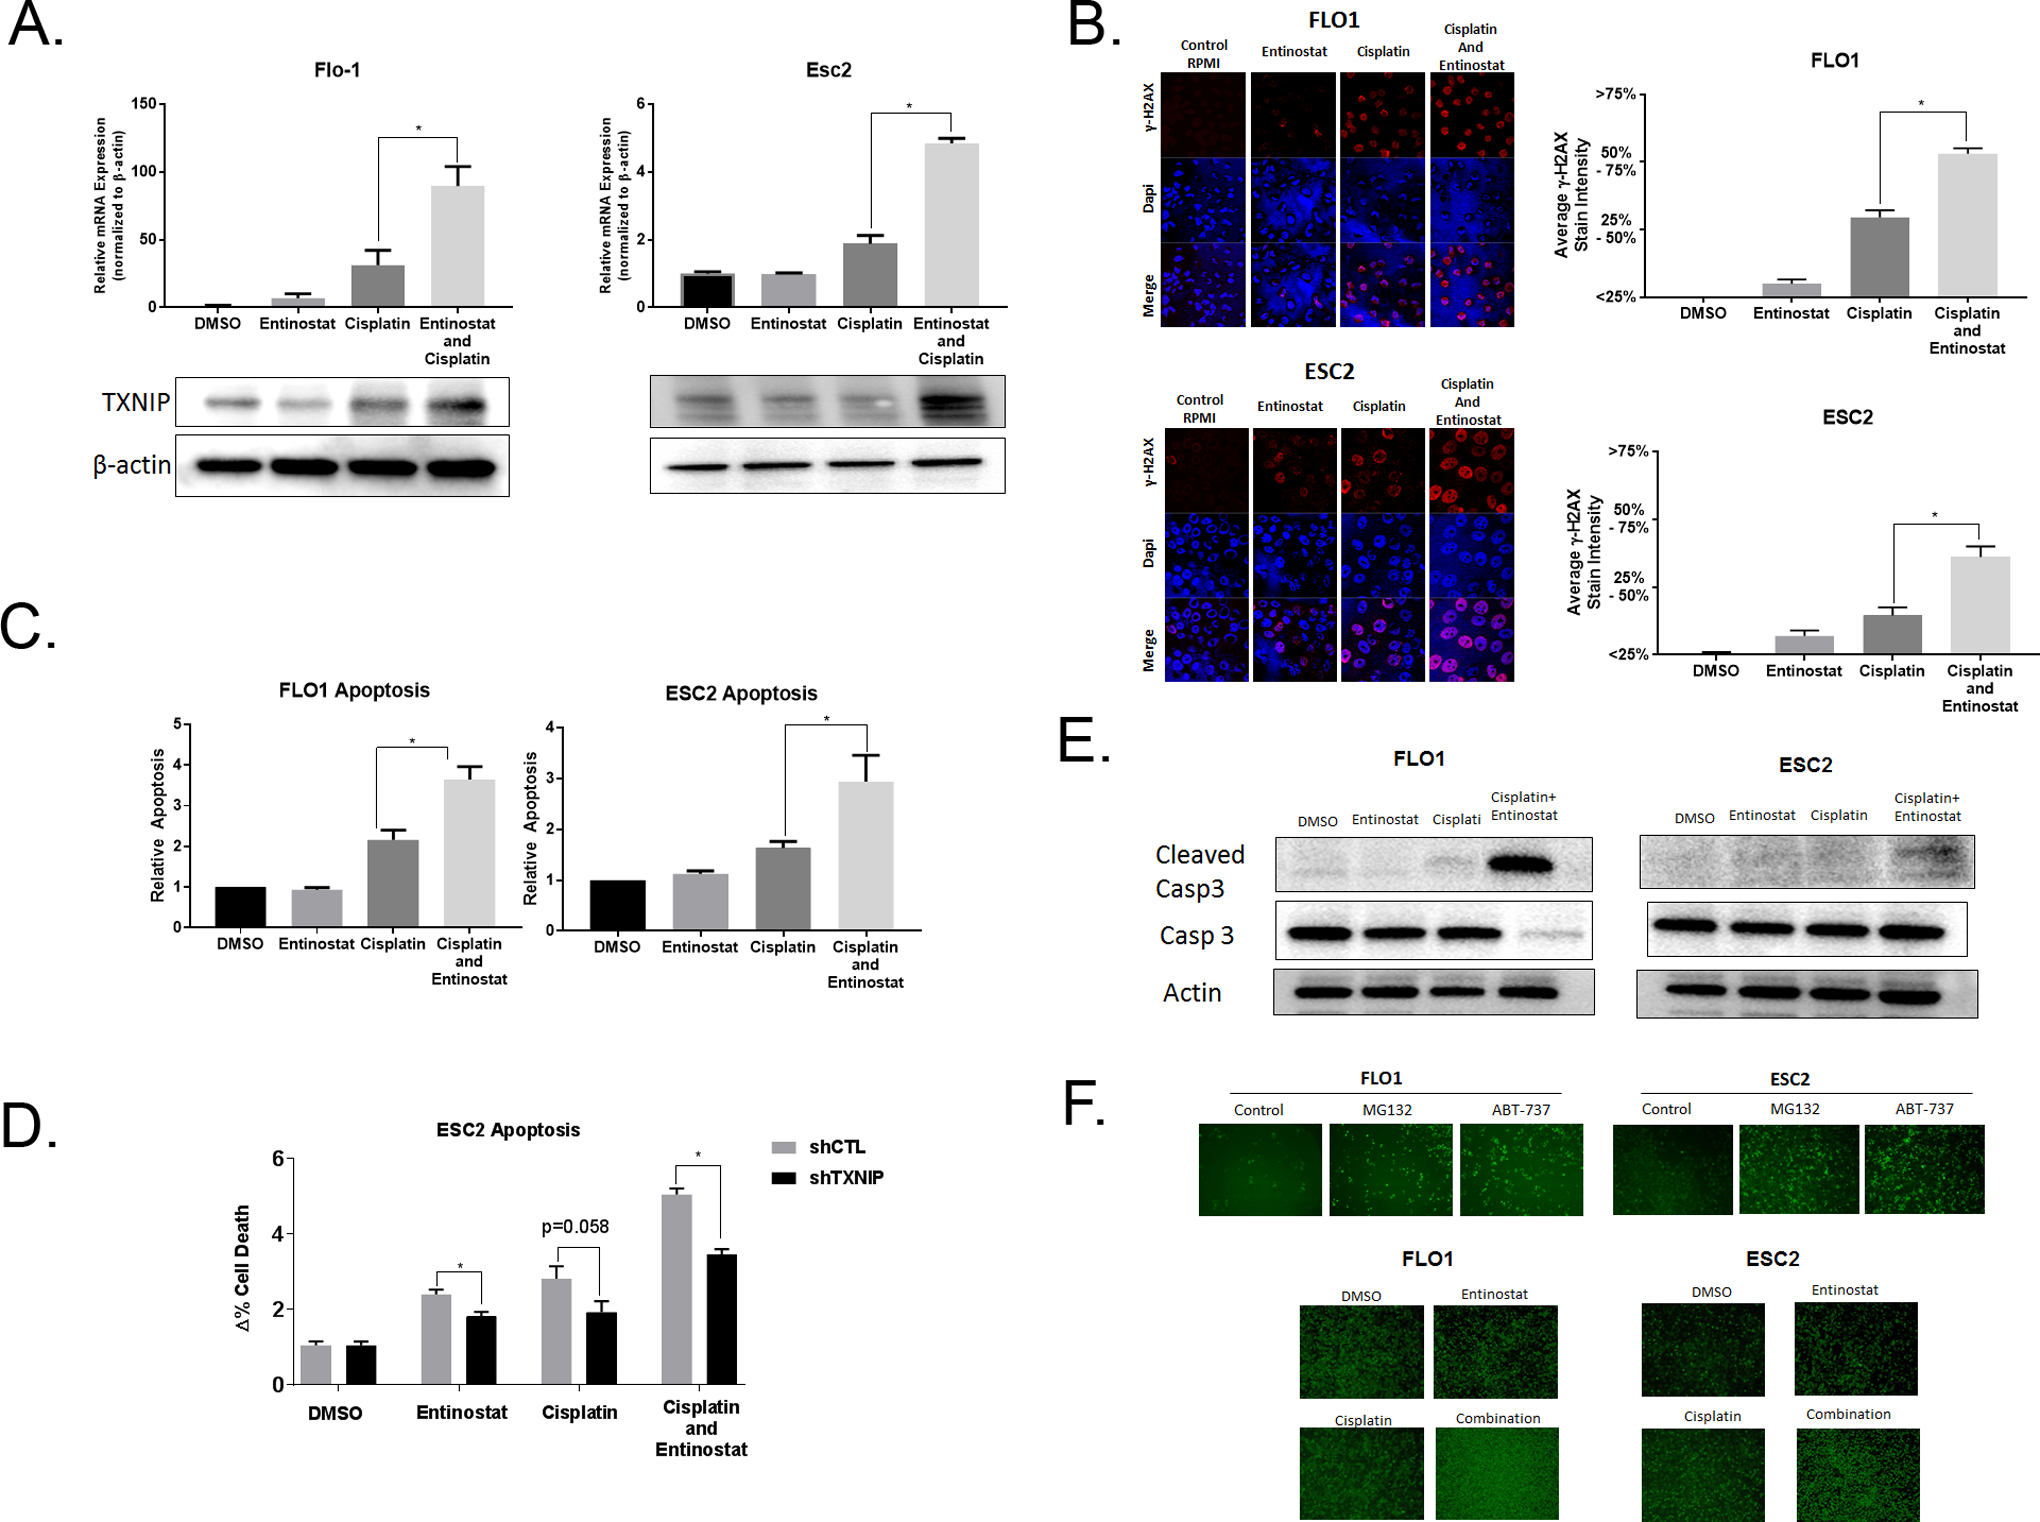
A. Flo-1 cells were treated with 1 uM entinostat and 1 ug/mL cisplatin for 48 hours. Esc2 cells were treated with 1 uM entinostat and 0.35 ug/mL cisplatin for 48 hours. qRT-PCR and immunoblots of TXNIP expression were normalized with β-actin.
B. After treatment conditions as described in (A.), γH2AX immunofluorescent staining was performed. γH2AX levels were categorized based on percent staining intensity.
C. After treatment conditions as described in (A.), cellular apoptosis was analyzed with annexin V assays.
D. After treatment conditions as described in (A.), cellular apoptosis was analyzed with annexin V assays for Esc2 cells with lentiviral shRNA knockdown of TXNIP versus controls.
E. After treatment conditions as described in (A.), caspase 3 and cleaved caspase 3 levels were quantified based by immunoblot.
F. Flo-1 cells were treated with the proteasome inhibitor, MG132, and the anti-bcl-2 drug, ABT-137, as positive controls. A cleaved caspase 3 GFP reporter assay was generated with cells transfected with a GFP-labeled reporter attached to a ubiquitin domain by a caspase 3 site. Cells were treated in conditions as described in (A.). Pictures were obtained with a fluorescent microscope at 4x magnification.
We examined whether CDDP and entinostat activated the intrinsic (mitochondrial) pathway of apoptosis, and therefore ‘primed’ the mitochondria for apoptosis. We observed that the induction of cleaved-caspase 3 was minimal with either cisplatin or entinostat alone, however, the combination resulted in robust induction (Figure 5E). The results were more robust for Flo-1 than Esc2, therefore, we transfected a construct that links a ubiquitin (Ubi) domain to a green fluoresce protein (GFP) by a caspase 3 cleavage site. When the site is not cleaved, the Ubi domain results in proteasome degradation of GFP, whereas, if caspase 3 site is cleaved, then GFP will not be degraded and is detectable. As expected, controls with the proteasome inhibitor, MG132, and with a drug that blocks an anti-apoptotic protein, ABT-137, both increased GFP detection (Figure 5F). We observed that the combination of entinostat and cisplatin significantly increased GFP compared to either treatment alone. These results indicate that the combined effect of CDDP and entinostat induce DNA damage and apoptosis through the mitochondrial apoptotic pathway. This data provides a strong rationale for the utilization of epigenetic agents to prime EAC.
DISCUSSION
The last decade has seen rapid advancements in targeting specific oncogenic drivers in multiple cancers. However, a single, targetable mutation or driver such as a tyrosine kinase receptor or a rearranged fusion protein is not present in many cancers. Even when present, development of resistance is a nearly universal phenomenon. Additionally, cancers such as EAC acquire thousands of somatic mutations prior to frank tumor development, therefore, targeting one mutation or pathway is often overcome by bypass pathways and additional mutations rendering targeted therapy ineffective.(28) In contrast, tumor-associated changes in ‘cellular energetics’ may not initiate carcinogenesis, but may be critical to sustain energy demands required for a growing tumor.(3) Additionally, these pathways may be targetable independent of mutational burden. ‘Cellular energetics’ are tightly linked to the mitochondria and glycolysis as originally noted by Dr. Warburg.(4) Moreno-Sanchez et al. observed that mitochondrial impairment does not seem to apply in nonhypoxic, oxidative tumors, rather, the mitochondria fulfills other requirements such as macromolecule synthesis.(9) When glucose is utilized by glycolysis such as in highly PET-avid EAC, the mitochondria often requires glutamine to sustain macromolecule synthesis. Indeed, we noted that EACC were critically dependent on glutamine. Therefore, we asked whether exploring glutamine utilization would reveal potentially targetable energetic pathways and noted that TXNIP was highly regulated by glutamine.
TXNIP has been reported as both a negative regulator of glycolysis, glucose uptake, and glycolytic gene expression as well as a tumor suppressor in multiple cancers.(29–31) Consistent with observations of TXNIP in breast and prostate cancer cell lines, we noted modulation of TXNIP by both glucose and glutamine which indicating that glycolysis and OXPHOS are tightly linked in EAC.(16–18, 32, 33) Ji and colleagues demonstrated that overexpression of TXNIP reduced both glycolysis and OXPHOS in pancreatic cancer cell lines PANC-1 and SW1990.(34) We noted a decrease in glycolysis and lactate secretion, but no effects on OXPHOS or the glycolytic enzymes. Given that the metabolic effects were not particularly robust in EACC, we explored whether TXNIP functioned more as a tumor suppressor in EAC.
Kwon and colleagues reported that TXNIP was decreased in over 60% of 19 patients with hepatocellular carcinoma (HCC).(35) They also observed an increase in chemically-induced HCC in TXNIP knock-out mice. Butler and colleagues noted that higher TXNIP levels were associated with longer metastasis-free survival among 788 patients with node-negative breast cancer.(36) Additionally, they found that overexpression of TXNIP in the breast cell line, MCF-7, induced senescence. Woolson and colleagues reported that higher TXNIP was associated with improved disease-specific survival among 228 patients with gastroesophageal carcinoma.(26) These results were consistent with the expression data from our esophageal tissue array that revealed significantly lower TXNIP in EAC versus normal esophagus. We also observed that overexpression of TXNIP significantly decreased proliferation, clonogenicity, and tumorigenicity suggesting that TXNIP functions as a tumor suppressor in EACC. Given that TXNIP acted as strong tumor suppressor in EACC, we asked whether TXNIP sensitized EACC to chemotherapy. We found that cisplatin alone increased expression of TXNIP in parental EACC and further augmented its levels in EACC stably over-expressing TXNIP. Furthermore, TXNIP overexpression was associated with both increased DNA damage and apoptosis whereas knockdown of TXNIP was protective against apoptosis. These results suggest that TXNIP sensitizes EACC to cisplatin.
Next, we asked whether a clinically feasible strategy could induce TXNIP to serve as a chemotherapeutic sensitizer. Kaadige and colleagues report that glutamine inhibits transcription of TXNIP by recruitment of a histone deacetylase-dependent corepressor.(17) Malone and colleagues reported that the HDACi, vorinostat, in combination with mTOR inhibitors synergistically killed malignant peripheral nerve sheath tumors and KRAS-mutant non-small cell lung cancer (NSCLC).(37) Importantly, transcriptional profiles of cells treated with the combination of HDACi and mTOR inhibitor significantly upregulated TXNIP. They ablated the TXNIP gene by using CRISPR/cas9 system. Loss of TXNIP prevented cell death from the combination therapy, suggesting that TXNIP upregulation is critical for cell death. Vendetti and colleagues demonstrated that in NSCLC, epigenetic priming with entinostat prior to irinotecan sensitized A549 xenografts and enhanced tumor response in a patient-derived xenograft model.(38, 39) We evaluated entinostat in EACC since it is currently in non-EAC clinical trials and feasibly could be introduced in EAC trials.(40–42) We noted that entinostat in combination with cisplatin induced TXNIP expression much more robustly than cisplatin or entinostat alone. Furthermore, entinostat sensitized EACC to cytolytic therapy with cisplatin as noted by increased DNA damage and apoptosis. This sensitization was at least partially mediated through TXNIP given that knock-down of TXNIP abrogated the synergistic apoptotic effects. Additionally, the combination significantly increased caspase activity which implies that apoptosis occurred through the intrinsic pathway of the mitochondria, therefore, entinostat primed the mitochondrial of EACC for treatment with standard therapy.
We provide evidence that glutamine is required for EACC proliferation and that glutamine suppresses TXNIP. In EACC, we report that TXNIP acts as a tumor suppressor and can sensitize these cells to chemotherapeutics. The HDACi, entinostat, phenocopied the effects of TXNIP overexpression. Our findings support a phase I/II evaluation of entinostat to test whether it can synergistically increase the efficiency of chemotherapy in patients with EAC. Further work with entinostat is underway in preparation for an early-phase clinical trial.
Supplementary Material
Acknowledgements:
The authors thank Dr. Chuan-Yuan Li, Duke University, for the kind gift of the caspase 3 reporter plasmid.
The authors thank Zhuwen Wang, University of Michigan, for excellent technical assistance.
The authors thank Dr. Rhonda F. Souza, Baylor Scott and White Dallas, for review of the manuscript.
Financial Information:
Funding provided through the Intramural Research Program of the National Cancer Institute/CCR, NIH.
Project Number: ZIA BC 011630.
Project Title: Targeting Glutamine Metabolism and Mitochondria in Esophageal Cancer Cells.
Project Recipient: R. T. Ripley, M.D., Principal Investigator.
Footnotes
The authors declare no potential conflicts of interest.
REFERENCES
- 1.Hur C, Miller M, Kong CY, Dowling EC, Nattinger KJ, Dunn M, et al. Trends in esophageal adenocarcinoma incidence and mortality. Cancer. 2013;119(6):1149–58. [DOI] [PMC free article] [PubMed] [Google Scholar]
- 2.van Hagen P, Hulshof MC, van Lanschot JJ, Steyerberg EW, van Berge Henegouwen MI, Wijnhoven BP, et al. Preoperative chemoradiotherapy for esophageal or junctional cancer. N Engl J Med. 2012;366(22):2074–84. [DOI] [PubMed] [Google Scholar]
- 3.Hanahan D, Weinberg RA. Hallmarks of cancer: the next generation. Cell. 2011;144(5):646–74. [DOI] [PubMed] [Google Scholar]
- 4.Warburg O On the origin of cancer cells. Science. 1956;123(3191):309–14. [DOI] [PubMed] [Google Scholar]
- 5.Abbassi-Ghadi N, Kumar S, Huang J, Goldin R, Takats Z, Hanna GB. Metabolomic profiling of oesophago-gastric cancer: a systematic review. European journal of cancer (Oxford, England : 1990). 2013;49(17):3625–37. [DOI] [PubMed] [Google Scholar]
- 6.Koppenol WH, Bounds PL, Dang CV. Otto Warburg’s contributions to current concepts of cancer metabolism. Nat Rev Cancer. 2011;11(5):325–37. [DOI] [PubMed] [Google Scholar]
- 7.Smolkova K, Plecita-Hlavata L, Bellance N, Benard G, Rossignol R, Jezek P. Waves of gene regulation suppress and then restore oxidative phosphorylation in cancer cells. Int J Biochem Cell Biol. 2011;43(7):950–68. [DOI] [PubMed] [Google Scholar]
- 8.Moreno-Sanchez R, Rodriguez-Enriquez S, Saavedra E, Marin-Hernandez A, Gallardo-Perez JC. The bioenergetics of cancer: is glycolysis the main ATP supplier in all tumor cells? Biofactors. 2009;35(2):209–25. [DOI] [PubMed] [Google Scholar]
- 9.Moreno-Sanchez R, Rodriguez-Enriquez S, Marin-Hernandez A, Saavedra E. Energy metabolism in tumor cells. FEBS J. 2007;274(6):1393–418. [DOI] [PubMed] [Google Scholar]
- 10.Kinahan PE, Fletcher JW. PET/CT Standardized Uptake Values (SUVs) in Clinical Practice and Assessing Response to Therapy. Seminars in ultrasound, CT, and MR. 2010;31(6):496–505. [DOI] [PMC free article] [PubMed] [Google Scholar]
- 11.Wise DR, DeBerardinis RJ, Mancuso A, Sayed N, Zhang X-Y, Pfeiffer HK, et al. Myc regulates a transcriptional program that stimulates mitochondrial glutaminolysis and leads to glutamine addiction. Proceedings of the National Academy of Sciences. 2008;105(48):18782–7. [DOI] [PMC free article] [PubMed] [Google Scholar]
- 12.DeBerardinis RJ, Lum JJ, Hatzivassiliou G, Thompson CB. The biology of cancer: metabolic reprogramming fuels cell growth and proliferation. Cell metabolism. 2008;7(1):11–20. [DOI] [PubMed] [Google Scholar]
- 13.DeBerardinis RJ, Mancuso A, Daikhin E, Nissim I, Yudkoff M, Wehrli S, et al. Beyond aerobic glycolysis: transformed cells can engage in glutamine metabolism that exceeds the requirement for protein and nucleotide synthesis. Proc Natl Acad Sci U S A. 2007;104(49):19345–50. [DOI] [PMC free article] [PubMed] [Google Scholar]
- 14.Ochoa-Ruiz E, Diaz-Ruiz R. Anaplerosis in cancer: Another step beyond the warburg effect. American Journal of Molecular Biology. 2012;Vol.02No.04:13. [Google Scholar]
- 15.Klimberg VS, McClellan JL. Glutamine, cancer, and its therapy. The American journal of surgery. 1996;172(5):418–24. [DOI] [PubMed] [Google Scholar]
- 16.Abcouwer SF, Schwarz C, Meguid RA. Glutamine deprivation induces the expression of GADD45 and GADD153 primarily by mRNA stabilization. The Journal of biological chemistry. 1999;274(40):28645–51. [DOI] [PubMed] [Google Scholar]
- 17.Kaadige MR, Looper RE, Kamalanaadhan S, Ayer DE. Glutamine-dependent anapleurosis dictates glucose uptake and cell growth by regulating MondoA transcriptional activity. Proc Natl Acad Sci U S A. 2009;106(35):14878–83. [DOI] [PMC free article] [PubMed] [Google Scholar]
- 18.Pan T, Gao L, Wu G, Shen G, Xie S, Wen H, et al. Elevated expression of glutaminase confers glucose utilization via glutaminolysis in prostate cancer. Biochemical and biophysical research communications. 2015;456(1):452–8. [DOI] [PubMed] [Google Scholar]
- 19.Baldan F, Mio C, Lavarone E, Di Loreto C, Puglisi F, Damante G, et al. Epigenetic bivalent marking is permissive to the synergy of HDAC and PARP inhibitors on TXNIP expression in breast cancer cells. Oncol Rep. 2015;33(5):2199–206. [DOI] [PubMed] [Google Scholar]
- 20.Hong SY, Hagen T. 2-Deoxyglucose induces the expression of thioredoxin interacting protein (TXNIP) by increasing O-GlcNAcylation - Implications for targeting the Warburg effect in cancer cells. Biochemical and biophysical research communications. 2015;465(4):838–44. [DOI] [PubMed] [Google Scholar]
- 21.Hong SY, Yu FX, Luo Y, Hagen T. Oncogenic activation of the PI3K/Akt pathway promotes cellular glucose uptake by downregulating the expression of thioredoxin-interacting protein. Cell Signal. 2016;28(5):377–83. [DOI] [PubMed] [Google Scholar]
- 22.Chai TF, Hong SY, He H, Zheng L, Hagen T, Luo Y, et al. A potential mechanism of metformin-mediated regulation of glucose homeostasis: inhibition of Thioredoxin-interacting protein (Txnip) gene expression. Cell Signal. 2012;24(8):1700–5. [DOI] [PubMed] [Google Scholar]
- 23.Ahrens TD, Timme S, Ostendorp J, Bogatyreva L, Hoeppner J, Hopt UT, et al. Response of esophageal cancer cells to epigenetic inhibitors is mediated via altered thioredoxin activity. Laboratory investigation; a journal of technical methods and pathology. 2016;96(3):307–16. [DOI] [PubMed] [Google Scholar]
- 24.Chen D, Dang BL, Huang JZ, Chen M, Wu D, Xu ML, et al. MiR-373 drives the epithelial-to-mesenchymal transition and metastasis via the miR-373-TXNIP-HIF1alpha-TWIST signaling axis in breast cancer. Oncotarget. 2015;6(32):32701–12. [DOI] [PMC free article] [PubMed] [Google Scholar]
- 25.Shen L, O’Shea JM, Kaadige MR, Cunha S, Wilde BR, Cohen AL, et al. Metabolic reprogramming in triple-negative breast cancer through Myc suppression of TXNIP. Proc Natl Acad Sci U S A. 2015;112(17):5425–30. [DOI] [PMC free article] [PubMed] [Google Scholar]
- 26.Woolston CM, Madhusudan S, Soomro IN, Lobo DN, Reece-Smith AM, Parsons SL, et al. Thioredoxin interacting protein and its association with clinical outcome in gastro-oesophageal adenocarcinoma. Redox biology. 2013;1:285–91. [DOI] [PMC free article] [PubMed] [Google Scholar]
- 27.Suzuki T, Ando T, Tsuchiya K, Fukazawa N, Saito A, Mariko Y, et al. Synthesis and histone deacetylase inhibitory activity of new benzamide derivatives. J Med Chem. 1999;42(15):3001–3. [DOI] [PubMed] [Google Scholar]
- 28.Lawrence MS, Stojanov P, Polak P, Kryukov GV, Cibulskis K, Sivachenko A, et al. Mutational heterogeneity in cancer and the search for new cancer-associated genes. Nature. 2013;499(7457):214–8. [DOI] [PMC free article] [PubMed] [Google Scholar]
- 29.Wu N, Zheng B, Shaywitz A, Dagon Y, Tower C, Bellinger G, et al. AMPK-dependent degradation of TXNIP upon energy stress leads to enhanced glucose uptake via GLUT1. Mol Cell. 2013;49(6):1167–75. [DOI] [PMC free article] [PubMed] [Google Scholar]
- 30.Yoshihara E, Masaki S, Matsuo Y, Chen Z, Tian H, Yodoi J. Thioredoxin/Txnip: redoxisome, as a redox switch for the pathogenesis of diseases. Front Immunol. 2014;4:514. [DOI] [PMC free article] [PubMed] [Google Scholar]
- 31.Zhou J, Chng WJ. Roles of thioredoxin binding protein (TXNIP) in oxidative stress, apoptosis and cancer. Mitochondrion. 2013;13(3):163–9. [DOI] [PubMed] [Google Scholar]
- 32.Zhou J, Yu Q, Chng WJ. TXNIP (VDUP-1, TBP-2): a major redox regulator commonly suppressed in cancer by epigenetic mechanisms. Int J Biochem Cell Biol. 2011;43(12):1668–73. [DOI] [PubMed] [Google Scholar]
- 33.Yu FX, Chai TF, He H, Hagen T, Luo Y. Thioredoxin-interacting protein (Txnip) gene expression: sensing oxidative phosphorylation status and glycolytic rate. The Journal of biological chemistry. 2010;285(33):25822–30. [DOI] [PMC free article] [PubMed] [Google Scholar]
- 34.Ji S, Qin Y, Liang C, Huang R, Shi S, Liu J, et al. FBW7 (F-box and WD Repeat Domain-Containing 7) Negatively Regulates Glucose Metabolism by Targeting the c-Myc/TXNIP (Thioredoxin-Binding Protein) Axis in Pancreatic Cancer. Clin Cancer Res. 2016;22(15):3950–60. [DOI] [PubMed] [Google Scholar]
- 35.Kwon HJ, Won YS, Suh HW, Jeon JH, Shao Y, Yoon SR, et al. Vitamin D3 upregulated protein 1 suppresses TNF-alpha-induced NF-kappaB activation in hepatocarcinogenesis. J Immunol. 2010;185(7):3980–9. [DOI] [PubMed] [Google Scholar]
- 36.Butler LM, Zhou X, Xu WS, Scher HI, Rifkind RA, Marks PA, et al. The histone deacetylase inhibitor SAHA arrests cancer cell growth, up-regulates thioredoxin-binding protein-2, and down-regulates thioredoxin. Proc Natl Acad Sci U S A. 2002;99(18):11700–5. [DOI] [PMC free article] [PubMed] [Google Scholar]
- 37.Malone CF, Emerson C, Ingraham R, Barbosa W, Guerra S, Yoon H, et al. mTOR and HDAC Inhibitors Converge on the TXNIP/Thioredoxin Pathway to Cause Catastrophic Oxidative Stress and Regression of RAS-Driven Tumors. Cancer Discov. 2017;7(12):1450–63. [DOI] [PMC free article] [PubMed] [Google Scholar]
- 38.Vendetti FP, Rudin CM. Epigenetic therapy in non-small-cell lung cancer: targeting DNA methyltransferases and histone deacetylases. Expert Opin Biol Ther. 2013;13(9):1273–85. [DOI] [PubMed] [Google Scholar]
- 39.Vendetti FP, Topper M, Huang P, Dobromilskaya I, Easwaran H, Wrangle J, et al. Evaluation of azacitidine and entinostat as sensitization agents to cytotoxic chemotherapy in preclinical models of non-small cell lung cancer. Oncotarget. 2015;6(1):56–70. [DOI] [PMC free article] [PubMed] [Google Scholar]
- 40.Ahrens TD, Timme S, Hoeppner J, Ostendorp J, Hembach S, Follo M, et al. Selective inhibition of esophageal cancer cells by combination of HDAC inhibitors and Azacytidine. Epigenetics. 2015;10(5):431–45. [DOI] [PMC free article] [PubMed] [Google Scholar]
- 41.Huang XP, Li X, Situ MY, Huang LY, Wang JY, He TC, et al. Entinostat reverses cisplatin resistance in esophageal squamous cell carcinoma via down-regulation of multidrug resistance gene 1. Cancer Lett. 2017;414:294–300. [DOI] [PubMed] [Google Scholar]
- 42.Sabnis GJ, Goloubeva O, Chumsri S, Nguyen N, Sukumar S, Brodie AM. Functional activation of the estrogen receptor-alpha and aromatase by the HDAC inhibitor entinostat sensitizes ER-negative tumors to letrozole. Cancer Res. 2011;71(5):1893–903. [DOI] [PMC free article] [PubMed] [Google Scholar]
Associated Data
This section collects any data citations, data availability statements, or supplementary materials included in this article.