Abstract
COVID-19, which is caused by a novel coronavirus known as SARS-CoV-2, has spread rapidly around the world, and it has infected more than 29 million individuals as recorded on 16 September 2020. Much effort has been made to stop the virus from spreading, and there are currently no approved pharmaceutical products to treat COVID-19. Here, we apply an in silico approach to investigate more than 3800 FDA approved drugs on the viral RBD S1-ACE2 interface as a target. The compounds were investigated through flexible ligand docking, ADME property calculations and protein–ligand interaction maps. Molecular dynamics (MD) simulations were also performed on eleven compounds to study the stability and the interactions of the protein–ligand complexes. The MD simulations show that bagrosin, chidamide, ebastine, indacaterol, regorafenib, salazosulfadimidine, silodosin and tasosartan are relatively stable near the C terminal domain (CTD1) of the S1 subunit of the viral S protein. The relative MMGBSA binding energies show that silodosin has the best binding to the target. The constant velocity steered molecular dynamics (SMD) simulations show that silodosin preferentially interacts with the RBD S1 and has potential to act as an interfering compound between viral spike–host ACE2 interactions.
Communicated by Ramaswamy H. Sarma
Keywords: SARS-CoV-2, COVID-19, potential inhibitors, binding energy, molecular dynamics, steered molecular dynamics, docking
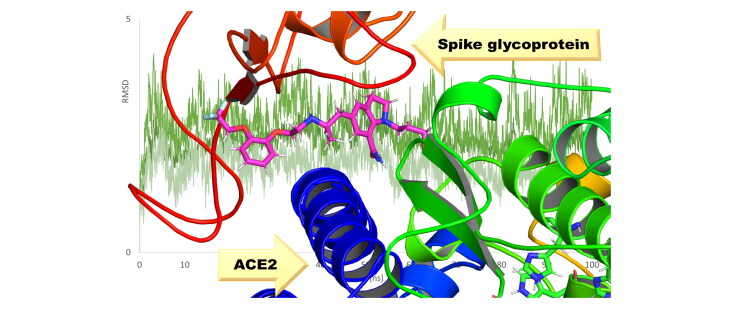
Graphical Abstract
Introduction
A recent coronavirus pandemic leading to COVID-19 caused by a coronavirus called severe acute respiratory syndrome coronavirus-2 (SARS-CoV-2) emerged in Wuhan, China, and has led to thousands of fatalities across the globe (Huang et al., 2020). As the world races against time in search of coronavirus therapeutics and prophylactics, no effective vaccine or antiviral therapeutic agents have been approved for COVID-19 to date. So far, more than 29 million cases have been confirmed with more than 940 thousand deaths all over the world (Coronavirus disease, 2019).
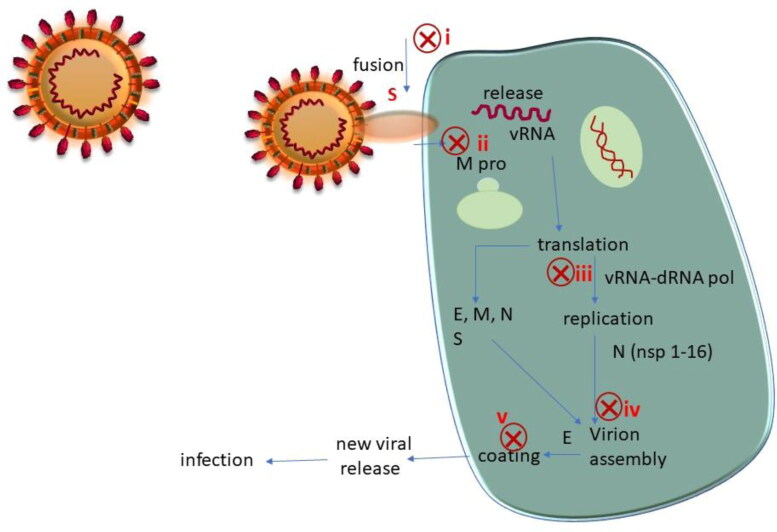
The SARS-CoV-2 virus uses human angiotensin converting enzyme 2 (ACE2) to enter our cells, replicate and spread efficiently (Babadaei et al., 2020; Hoffmann et al., 2020). A quick look at the structure of the virus and its replication and infection cycle reveals several points of intervention (see Figure 1) (Astuti, 2020).
Figure 1.
SARS-CoV-2 structure and its infection cycle. Potential intervention points are shown as red crosses.
The spike glycoprotein (S) is comprised of two functional subunits, S1 and S2, that are responsible for binding of the virus to the host cell receptor (Bosch et al., 2003; Ou et al., 2020; Shang et al., 2020), the S1 subunit contains the receptor-binding domain (RBD) that binds to the host cell receptor, and S2 contains the fusion machinery (Tortorici & Veesler, 2019). An obvious strategy in the design of therapeutics is to block the binding of S1 to human ACE2 or to block the fusion machinery of S2. The fusion of viral and host membranes is triggered by proteolysis of S2′, a site within S2 containing heptad repeat region (HR1) and second heptad repeat region (HR2). Proteolysis of S2′ that is followed by conformational changes in HR1 and HR2 facilitates fusion and release of the viral genome into the host cell (Kirchdoerfer et al., 2018). Before this detailed understanding of the fusion machinery came to light, Simmons et al demonstrated that endosomal proteolysis of the S glycoprotein of SARS-CoV is required for fusion of the virus and its subsequent infection. Based on this information they developed cathepsin L inhibitors which prevented SARS-CoV infection (Simmons et al., 2005). Amin and coworkers reported a computational comparative study between both SARS-CoV and SARS-CoV-2. They concluded that the S protein of SARS-CoV-2 has a higher affinity to the ACE2 human cell receptor than of SARS-CoV (Amin et al., 2020).
In a recent study, a series of lipopeptides based on the pan-coronavirus fusion inhibitor peptide EK1 were generated and demonstrated that the derived lipopeptide EK1C4 was the most potent fusion inhibitor against SARS-CoV-2 S (Xia et al., 2020). Many therapeutic options are being considered to combat COVID-19; more information about ongoing clinical trials has been summarized by Tu et al (Tu et al., 2020). Whisenant and Burgess (Whisenant & Burgess, 2020) have highlighted possible strategies that utilize the availability of the crystal structure of S and of human ACE2, and also indicated the possibility of human defensin proteins protecting the human GI tract from infection. In silico approach is still revolutionizing the drug discovery development (Aminpour et al., 2019; Macalino et al., 2015; Njogu et al., 2016). Han and Kral (Han & Král, 2020) have designed, computationally, peptide inhibitors of S derived from the interacting region of the ACE2 receptor. Moreover, Wei et al performed a virtual screening for FDA-approved drugs and natural compounds that may target viral spike proteins (Wei et al., 2020). Ahuja and coworkers also implemented a virtual screening approach for identifying possible antiviral compounds that can target the spike protein, main protease and the SARS-CoV-2 RBD-ACE2 complex (Panda et al., 2020). Senathilake et al (Senathilake et al., 2020) performed a virtual screening for FDA approved drugs and they show that zorubicin, aclarubicin and food dye E 115 were predicted to be potent inhibitors of the RBD–ACE2 interaction. Trezza and coworkers (Trezza et al., 2020) combined docking, molecular dynamics and steered molecular dynamic simulations to show that simeprevir and lumacaftor could be potential initial inhibitors of the RBD of the spike protein.
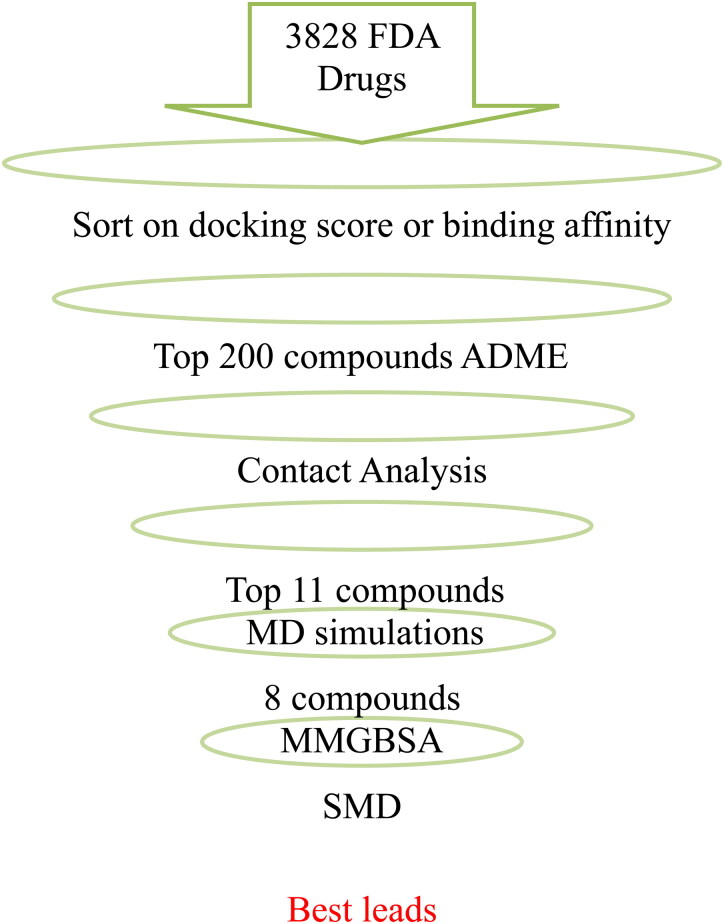
In this paper, we discuss a virtual high-throughput screening of known drug databases to identify lead compounds that could interrupt the viral RBD S1-ACE2 interface. We utilized the reported X-ray crystal structure of the spike glycoprotein complexed with the ACE2 human receptor (PDB ID: 6LZG) to perform a flexible ligand docking on more than three thousand previously known drugs (Wang et al., 2020). The top 200 compounds with the best docking scores were taken for ADME property calculations. MD simulations were further employed to study the dynamical behavior and stability of the ligands between the S and ACE2 protein and to understand the pharmacophoric features of the ligands.
Ligand-RBD-ACE2 interactions were analyzed in detail for the best 190 hits. Interacting residues from RBD and ACE2 were identified. We filtered the top eleven compounds with good ADME properties and good contacts with S and ACE2. The interactions and binding of the eleven best molecules were further studied with MD simulations. The one-average molecular mechanics energies with the generalized Born and surface area continuum solvation (MMGBSA) was used to rescore the binding energy of the ligand-RBD-ACE2 interactions. This study aims to provide insights to find potential inhibitors that may block the RBD S1 subunit of the viral S protein, and therefore, prevent the viral infection. The overall filtering procedure is shown in Figure 2.
Figure 2.
Strategy for virtual screening of compounds against SARS-CoV-2 spike protein.
Methods
Ligands and protein preparation
Several structures of the SARS-CoV-2 spike glycoprotein interacting with the human ACE2 are available. A recent high-resolution X-ray crystal structure of the RBD S protein (Wang et al., 2020), PDBID:6LZG, was taken as a target. The SMILES of FDA approved drugs and some of the compounds under trial for COVID-19 treatment were obtained from the drugcentral (Ursu et al., 2017) and drugbank (Wishart et al., 2006) databases. A total of 3828 compounds (in SMILES format) were converted to 3 D coordinates using OpenBabel (O’Boyle et al., 2011) followed by geometry optimization using the MMFF94 force field (Halgren, 1996a, 1996b, 1996c, 1996d Halgren & Nachbar, 1996). The proteins (viral spike and human ACE2) were prepared using AutoDock tools (ADT) (Morris et al., 2009). The zinc ions, unrelated complexes and waters were removed from the protein and polar hydrogens were added. Kollman United Atom charges were assigned for the protein and Gasteiger charges for the ligands.
Molecular docking
The ligands were prepared for docking using ADT. The backbone and amide bonds were rendered flexibility by allowing them to be rotatable. The prepared protein and ligand structures were saved as PDBQT file format. The flexible ligand docking was performed using AutoDock Vina (Trott & Olson, 2009). The grid was generated at RBD near the C terminal domain (CTD1) of the S1 subunit. After grid generation, the different conformations of the compounds were docked one by one to generate the best five docking score poses; the exhaustiveness parameter was set to 10, to increase the probability of finding the minimum binding affinity pose.
Protein–ligand interactions
The active residues of protein interactions with the top 190 docking score ligands were analyzed using LigPlot+ (Laskowski & Swindells, 2011). The 2 D and 3 D ligand-protein interaction diagrams were generated using the ligand interaction diagram script as implemented in Maestro and the desktop PyMOL 2.4, respectively (DeLano, 2002; Maestro, 2020).
MD simulations
MD simulations were performed using the nanoscale molecular dynamics (NAMD) package (Phillips et al., 2005) and the CHARMM36 force field (Best et al., 2012; Klauda et al., 2010). The system was solvated using the TIP3P water model (Mark & Nilsson, 2001) and neutralized by a 0.15 molar concentration of NaCl to mimic the physiological conditions. The energy minimization was performed for 1 ns. The system was then subjected to annealing and equilibration for 10 ns followed by a production run of 100 ns at 300 K using the Langevin thermostat (Grest & Kremer, 1986) with a damping frequency of 1 ps−1. The isothermal-isobaric (NPT) ensemble was used for all MD simulations. The pressure was maintained at 1 atm using the Nose–Hoover barostat (Martyna et al., 1994). Long-range interactions were treated using the particle-mesh Ewald (PME) method (Darden et al., 1993) with a grid spacing of 1.0 Å. For all simulations, a 12.0 Å cutoff distance for the Coulomb and van der Waals interactions was set, and a 10.0 Å cutoff was set for a switching function. The equations of motion were integrated using the r-RESPA multiple time-step schemes (Tuckerman et al., 1992) to update short-range interactions for every step and long-range electrostatic interactions for every two steps. The time step of integration was chosen to be 2 fs. The root-mean-square deviation (RMSD) of all heavy atoms with respect to the initial frame was analyzed to determine the stability of the complex over time. In addition, the average deviation of the protein residues were analyzed by the root-mean-square fluctuations (RMSF) over the simulation time.
The relative binding energies
The binding affinity between the ligand and protein can be determined by the binding energy, ΔGbind. To estimate the relative binding energies, the molecular mechanics generalized Born surface areas (MMGBSA) were calculated from the MD trajectories using one trajectory scheme, ΔGMMGBSA (Genheden & Ryde, 2015),
| (1) |
where, GPL, GP and GL are the Gibbs energies of the protein–ligand complex (GPL), protein (GP) and ligand (GL), respectively. The G values can be estimated as below,
| (2) |
The Ebond, Eelec and EvdW are standard molecular mechanics (MM) energy terms of bonded, electrostatic and van der Waals interactions. Ebond is canceled in the case of one trajectory scheme. Gpolar is the polar contributions obtained by using the generalized Born (GB) model. Gnonpolar is the non-polar contributions obtained from the linear relation with the solvent accessible surface area (SASA) using the NAMD package (Phillips et al., 2005).
| (3) |
In the last term of Equation (2), T is the temperature, and S is the entropy of the system, which is computed by a normal mode analysis. This term is not computed because we are interested in the relative binding energies and also due to the large computational cost (Sun et al., 2018).
To compute the MMGBSA, 5000 frames of 100 ns MD simulations were evenly extracted from MD trajectories. These trajectories were converted to three subsets of protein–ligand, protein and ligand by removing the water, ions and unnecessary atoms. The generalized Born implicit solvent mode was applied and the SASA was turned on. A solvent dielectric constant of 78.5 was used. The surface tension was assigned to 0.021 kJ/mol/Å, and the alpha-cutoff parameter was set to 11. The ΔGMMGBSA values were calculated by taking the averages over the simulations.
Steered molecular dynamics
The constant velocity steered molecular dynamics (SMD) (Izrailev et al., 1999) approach was used to compare the interaction of the S protein with ACE2 in presence and lack of ligand and also to give an overview of the interaction between the ligand and the SARS-CoV-2 S protein and between the ligand and ACE2. The protein and the ligand were prepared as described above in the MD simulations section. The system was then solvated using the TIP3P water model with a 15 Å buffer around the protein and then extended to 50 Å in the direction of pulling axis. The system was then neutralized with NaCl. The system was minimized, subjected to annealing, equilibration and then MD simulations for 10 ns. The α carbon atoms of residues HSE519, THR333, ASN360, CYS525, LYS386 and LEU517 are positionally restrained to prevent the SARS-CoV-2 S protein from pulling under the applied force. The restrained force constant is 347.4 pN/Å in only the pulling axis direction. The SMD force constant of the virtual spring between the dummy atom and the center of mass for all α carbon atoms of ACE2 was 486.4 pN/Å. The pulling was performed at a velocity of 0.005 Å/ps. The SMD simulations were carried out for 10 ns.
Results and discussion
All the compounds from the aforementioned drugbanks were prepared for docking. The compounds were docked one by one into the RBD of the SARS-CoV-2 S protein. The ADME properties of the compounds with the top 200 docking scores were estimated utilizing molinspiration websever (Molinspiration Cheminformatics, 2020). Although all compounds taken from drugbanks have moderate ADME properties, we have chosen the top eleven compounds with zero Lipinski violations (except for ebastine, which has one violation) in our further studies. The top-rank drugs are silodosin, ebastine, salazosulfadimidine, indacaterol, chidamide, regorafenib, tasosartan, bagrosin, lumacaftor, risperidone and sitagliptin. Results of docking scores and some of their ADME properties are collected in Table 1.
Table 1.
List of the top docking scored ligands and some of their ADME properties.
| Best docking score kJ/mol | Lipinski's rule of fivea |
|||
|---|---|---|---|---|
| Ligand | TPSAb | miLogPc | Hydrogen bonds (acceptor/donor) | |
| Silodosin | –33.47 | 97.06 | 2.91 | 7 / 4 |
| Ebastine | –32.64 | 29.45 | 6.56 | 3 / 0 |
| Salazosulfadimidine | –32.64 | 154.41 | 3.86 | 10 / 3 |
| Indacaterol | –34.31 | 85.34 | 3.64 | 5 / 4 |
| Chidamide | –32.22 | 97.11 | 2.22 | 6 / 4 |
| Regorafenib | –34.31 | 92.35 | 4.85 | 7 / 3 |
| Tasosartan | –33.89 | 100.56 | 2.48 | 8 / 1 |
| Bagrosin | –32.64 | 58.2 | 3.3 | 4 / 2 |
| Lumacaftor | –33.05 | 97.76 | 4.96 | 7 / 2 |
| Risperidone | –32.64 | 64.17 | 2.96 | 6 / 0 |
| Sitagliptin | –32.64 | 77.05 | 2.06 | 6 / 2 |
All given compounds are with zero Lipinski violations.
TPSA: topological polar surface area of a molecule.
miLogP: molinspiration’s octanol–water partition coefficient.
A detailed list of the interactions for the top eleven ligands with both the ACE2 residues and the viral spike RBD are shown in Table 2.
Table 2.
Ligand interactions with ACE2 (chain A) and SARS-CoV-2 spike RBD (chain B) within 3.9 Å obtained using the best docking scored pose.
| Ligand | Number of interactions | Residues |
|---|---|---|
| Silodosin | 10 | A-ASP38, A-GLU37, A-HIS34, B-ARG403, B-GLN493, B-GLU406, B-GLY496, B-SER494, B-TYR453, B-TYR495 |
| Ebastine | 15 | A-ARG393, A-ASN33, A-ASP38, A-GLU37, A-HIS34, B-ARG403, B-GLN493, B-GLU406, B-GLY496, B-LEU492, B-LYS417, B-SER494, B-TYR449, B-TYR453, B-TYR505 |
| Salazosulfadimidine | 9 | A-ASP38, A-GLU35, A-GLU37, A-HIS34, A-LYS353, B-GLN493, B-SER494, B-TYR453, B-TYR505 |
| Indacaterol | 11 | A-ASP38, A-GLU35, A-GLU37, A-HIS34, B-ARG403, B-GLN493, B-GLU406, B-GLY496, B-SER494, B-TYR449, B-TYR453 |
| Chidamide | 8 | A-ASN33, A-ASP38, A-HIS34, B-ARG403, B-GLN493, B-GLY496, B-SER494, B-TYR449 |
| Regorafenib | 11 | A-ASN33, A-ASP38, A-HIS34, B-ARG403, B-GLN493, B-GLY496, B-SER494, B-TYR449 |
| Tasosartan | 8 | A-ASN33, A-GLU37, A-HIS34, A-PRO389, B-ARG403, B-TYR453, B-TYR495, B-TYR505 |
| Bagrosin | 6 | A-ASN33, A-GLU37, A-HIS34, A-PRO389, B-ARG403, B-TYR453, B-TYR495, B-TYR505 |
| Lumacaftor | 5 | A-GLU35, A-LEU79, A-PHE28, B-GLN493, B-TYR489 |
| Risperidone | 7 | A-GLU35, A-LEU79, A-PHE28, B-GLN493, B-TYR489 |
| Sitagliptin | 4 | A-GLU37, A-HIS34, B-LYS417, B-TYR453 |
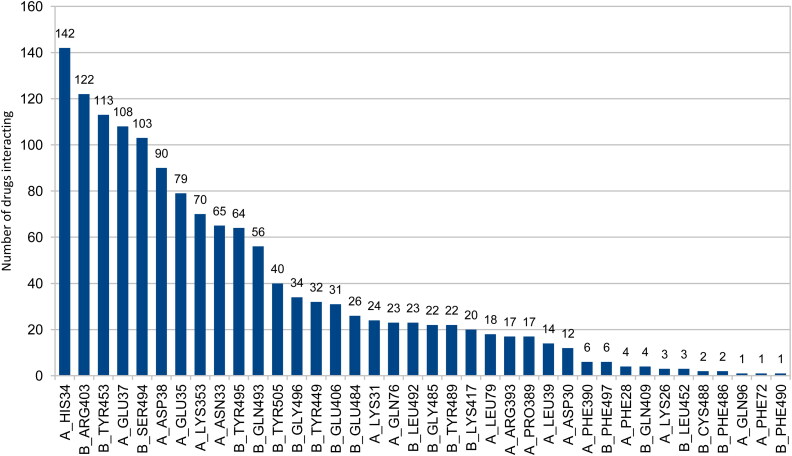
Supporting information Figure S1 shows the best docking score poses and their respective ligand interaction 2 D maps for some of the compounds with the top docking scores. Although these compounds interact efficiently with S protein RBD and ACE2 residues within 3.9 Å; they would still leave some interface of S protein and ACE2 open to interact. Figure 3 shows compounds (out of the top 190 docked compounds) interacting with the active site residues of the 6LZG protein within 3.9 Å.
Figure 3.
Number of drugs interacting out of the top 190 docking score ligands and the active site residues of the 6LZG protein within 3.9 Å. Chain a) stands for ACE2 and chain b) stands for the S protein of SARS-CoV-2.
As shown in Figure 3, His34, Glu37, Asp38 and Glu35 residues of ACE2 and Arg403, Tyr453, Ser494 and Tyr495 residues of the S protein RBD are the residues with the most interactions and hold the compound in between the two proteins disrupting the viral spike-host interactions.
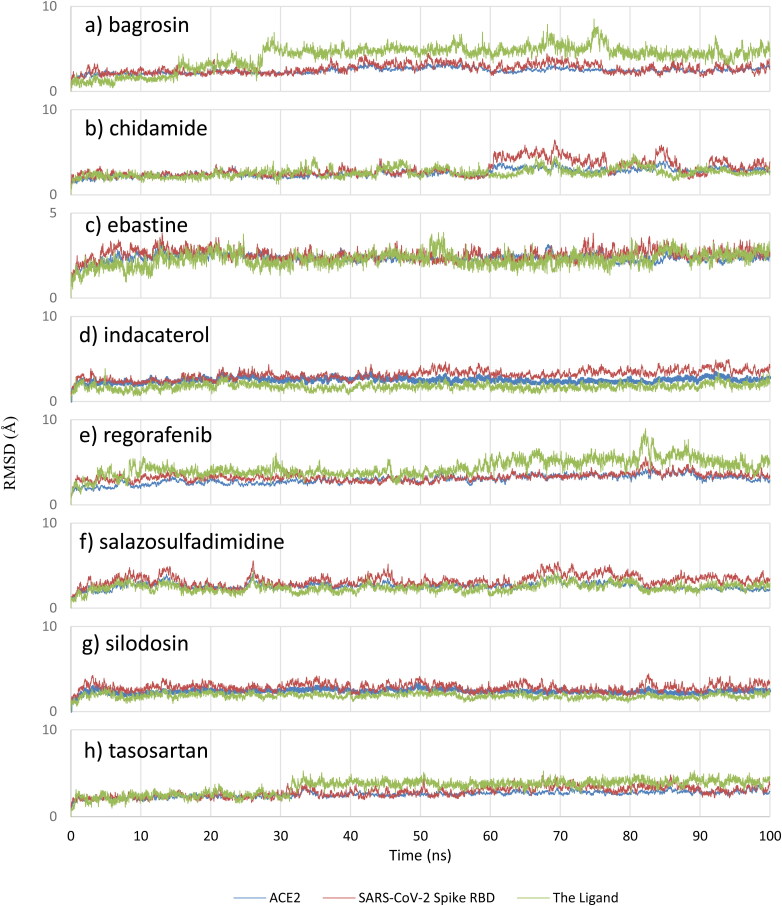
Classical MD simulations were performed for the protein with and without the eleven filtered drugs to understand the stability of the complex over time and its dynamical behavior. Undoubtedly, the RMSD results of bagrosin, chidamide, ebastine, indacaterol, regorafenib, salazosulfadimidine, silodosin and tasosartan indicate the positional stability of these compounds during the simulations (see Figure 4).
Figure 4.
RMSD analysis for a) bagrosin, b) chidamide, c) ebastine, d) indacaterol, e) regorafenib, f) salazosulfadimidine, g) silodosin and h) tasosartan. The light green represents the ligand, blue color represents ACE2, and red color represents the SARS-CoV-2 Spike RBD.
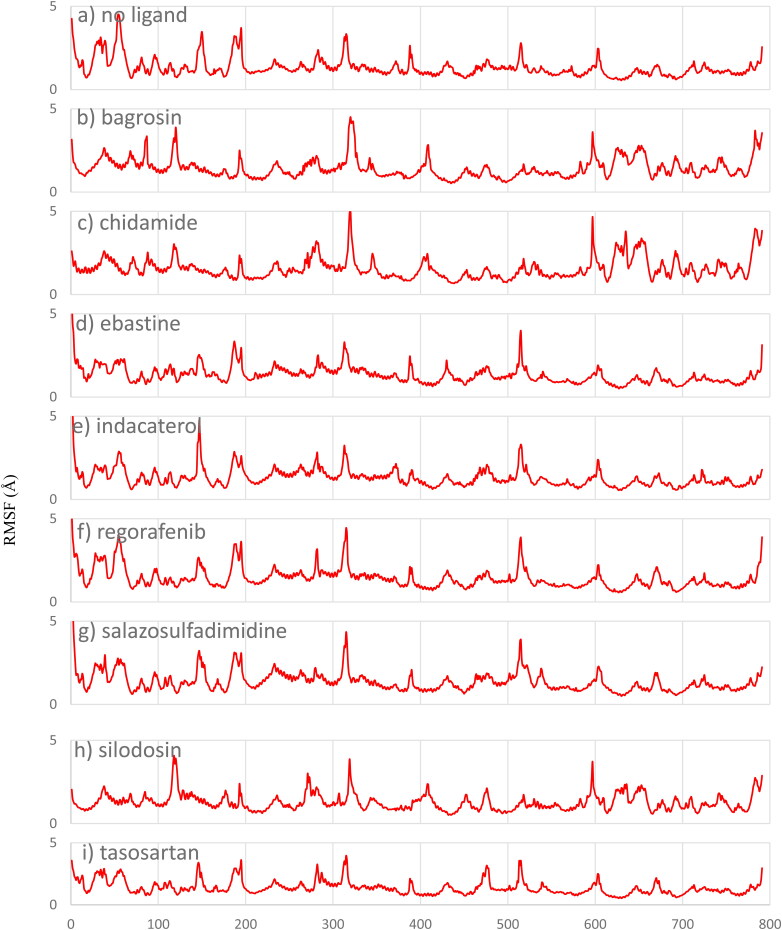
In contrast, the RMSD results for lumacaftor, risperidone and sitagliptin indicate that these three drugs are not positionally stable between the S protein and ACE2 since they moved away from their initial positions; the RMSD for sitagliptin, risperidone and lumacaftor are provided in the supporting information (supporting information Figure S2). The RMSF for these compounds were computed with respect to the α carbon atom of each protein residue to study the local structural stability and flexibility of the protein. As given in Figure 5, the RMSF plots show that the protein residues are stable in the presence of these drugs and the overall structure of the viral protein and host ACE2 is maintained with the drug obstructing their interactions.
Figure 5.
RMSF analysis for a) 6LZG without ligand, b) bagrosin, c) chidamide, d) ebastine, e) indacaterol, f) regorafenib, g) salazosulfadimidine, h) silodosin and i) tasosartan.
The relative MMGBSA binding energies were computed for the stable compounds from the MD simulations, and the results are given in Table 3. Silodosin shows the best relative binding energy while bagrosin depicts the worst relative binding energy.
Table 3.
The relative MMGBSA binding energies (kJ/mol).
| Ligand | MMGBSA |
|---|---|
| Silodosin | –171.42 |
| Ebastine | –132.72 |
| Salazosulfadimidine | –106.40 |
| Indacaterol | –102.63 |
| Chidamide | –96.61 |
| Regorafenib | –95.06 |
| Tasosartan | –86.73 |
| Bagrosin | –53.93 |
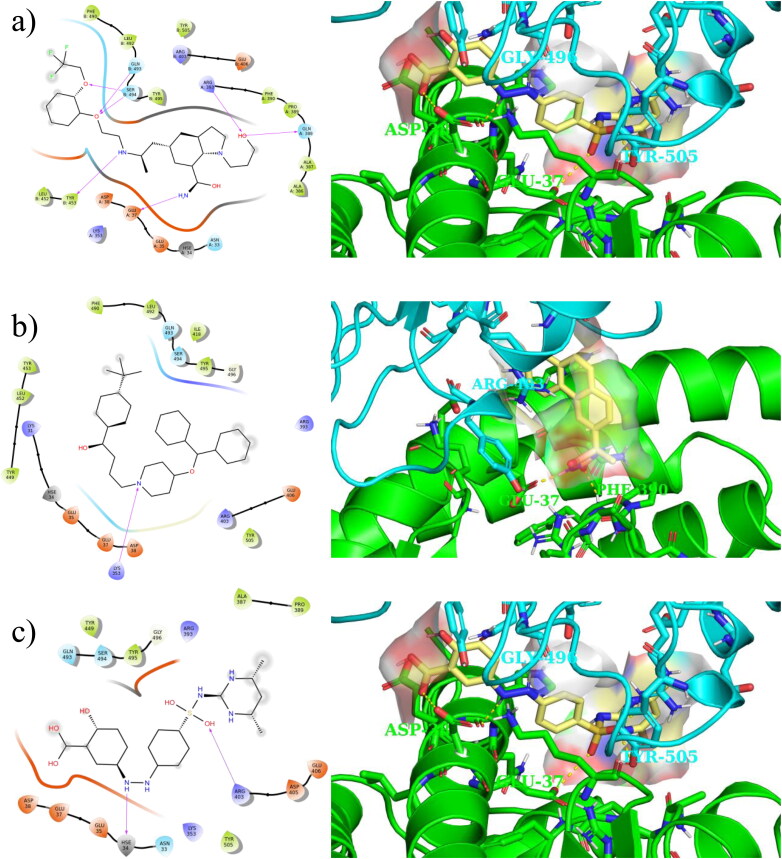
Figure 6 shows 2 D and 3 D interactions of the three compounds with the best relative binding energy (i.e. silodosin, ebastine and salazosulfadimidine) with both ACE2 and SARS-CoV-2 S obtained using the last frame of the MD simulations. Supporting information Figure S4 depicts polar histograms for some of orientation torsion angles for silodosin, ebastine and salazosulfadimidine during the MD simulations.
Figure 6.
Ligand interaction 2 D (left) and 3 D (right) maps of the top three compounds based on the relative binding energies: a) silodosin b) ebastine and c) salazosulfadimidine obtained using the last frame of 100 ns MD simulations.
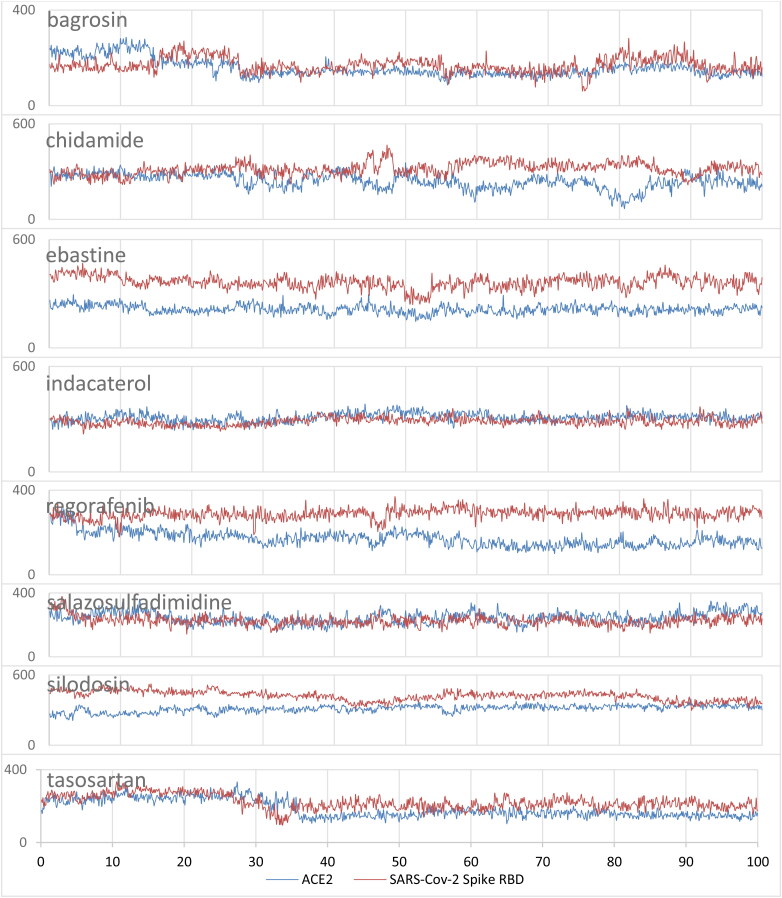
To investigate the non-covalent interactions between the top eight compounds with both ACE2 and SARS-CoV-2 S, the contact areas were computed based on the surface area of the hits exposed to both ACE2 and SARS-CoV-2 S during the MD simulations. Figure 7 depicts the time evolution of contact areas of these compounds with ACE2 and SARS-CoV-2 S. Table 4 summarizes the average contact areas and represents the best three contact residues and the average contact area coming from the residue of both ACE2 and SARS-CoV-2 spike with the top eight compounds during the MD simulations.
Figure 7.
Contact surface area (Å2) for a) bagrosin, b) chidamide, c) ebastine, d) indacaterol, e) regorafenib, f) salazosulfadimidine, g) silodosin and h) tasosartan with ACE2 and SARS-Cov-2 spike RBD. The blue represents the contact area with ACE2, and red color represents the contact area with SARS-Cov-2 spike RDB.
Table 4.
Averaged contact area (Å2) and the best three contact residues of both ACE2 and SARS-CoV-2 spike with the top eight filtered compounds during the 100 ns MD simulations.
| Molecule | Interaction with ACE2 |
Interaction with SARS-CoV-2 spike |
||
|---|---|---|---|---|
| Average area (Å2) | Residue (f)a | Average area (Å2) | Residue (f)a | |
| Bagrosin | 157.73 | HSE34 (51.43), PRO389 (29.37), GLU37 (27.99) |
170.26 | ARG403 (39.62), TYR505 (23.91), GLU406 (16.90) |
| Chidamide | 240.81 | HSE34 (74.46), LYS353 (36.16), ASP38 (32.94) |
317.48 | TYR505 (38.65), ARG403 (29.69), GLN493 (22.50) |
| Ebastine | 214.10 | LYS353 (49.94), HSE34 (44.54), ASP38 (30.96) |
363.57 | TYR505 (61.99), ARG403 (41.07), TYR449 (39.31) |
| Indacaterol | 310.42 | HSE34 (48.33), ASP38 (47.47), GLU35 (34.42) |
287.00 | TYR505 (59.21), TYR449 (47.15), ARG403 (36.54) |
| Regorafenib | 171.05 | HSE34 (58.86), ASP38 (47.15), LYS353 (33.46) |
287.95 | SER494 (41.91), TYR505 (29.32), GLN493 (28.86) |
| Salazosulfadimidine | 244.63 | LYS353 (71.23), HSE34 (42.39), ASP38 (38.94) |
226.13 | ARG403 (45.09), TYR505 (29.70), GLN493 (22.16) |
| Silodosin | 312.42 | HSE34 (79.42), GLU35 (60.51), ASP38 (35.35) |
421.91 | TYR505 (50.09), ARG403 (33.40), SER494 (33.28) |
| Tasosartan | 185.79 | ALA387 (54.72), HSE34 (45.51), PRO389 (33.67) |
222.36 | TYR505 (56.31), ARG403 (39.98), GLU406 (21.23) |
f is the average contact area coming from the residue. Only the best three contact residues are reported.
As shown in Figure 7 and Table 4, the average contact areas for bagrosin, chidamide, ebastine, regorafenib, silodosin and tasosartan with SARS-CoV-2 S are larger than the average contact areas with ACE2, which shows that the non-covalent interactions for these compounds are mainly with SARS-CoV-2 spike. Table 4 illustrates that most of the compounds share the same contact residues; HSE34, PRO389, ASP38, LYS353, GLU37, GLU35, and ALA387 of ACE2, and ARG403, TYR505, GLU406, GLN493, TYR449, and SER494 of SARS-CoV-2 spike.
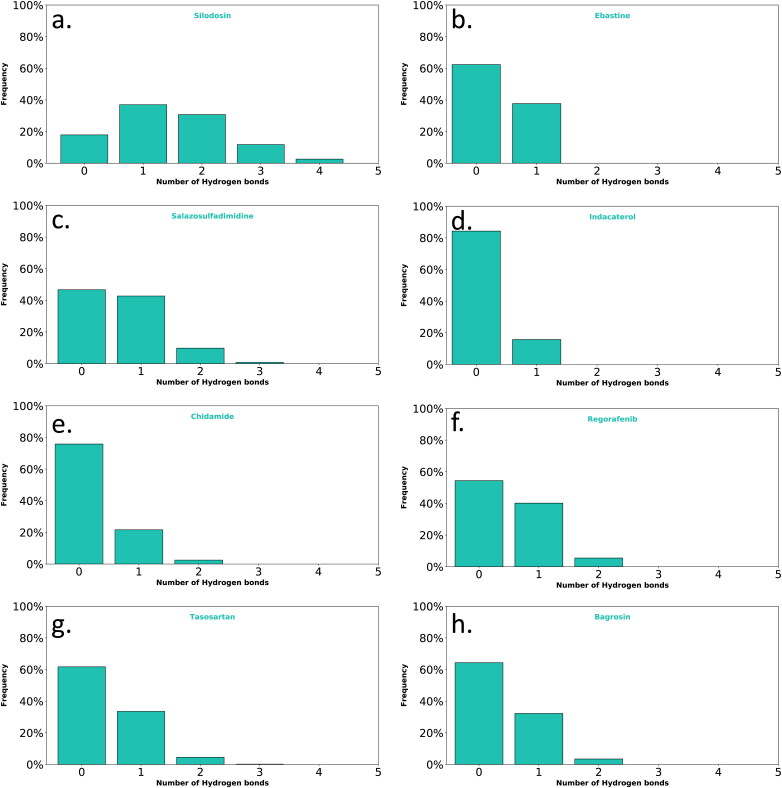
In addition, hydrogen bond interactions of the top eight filtered compounds with ACE2 and SARS-Cov-2 spike RBD were also analyzed during the 100 ns NPT ensemble. An analysis of the hydrogen bonds interaction of the top 8 compounds revealed that silodosin had the highest number of hydrogen bonds during the MD simulations. Silodosin formed hydrogen bonds mainly with GLU37, ARG393, SER494 and GLN493 with 51%, 31%, 27% and 18% occupancy, respectively. It should be mentioned that not all the top ligands formed a high occupancy of hydrogen bonds on S1-RBD interface during the simulation. For instance, indacaterol formed hydrogen bonds interactions with LI41with 15.2% occupancy and chidamide formed hydrogen bonds with LI31 and GLY496 with 9.1% and 4.0% occupancy, respectively. The ligands that do not form many hydrogen-bonds, the main force holding them may be due to the electrostatic interactions with ionized residues.
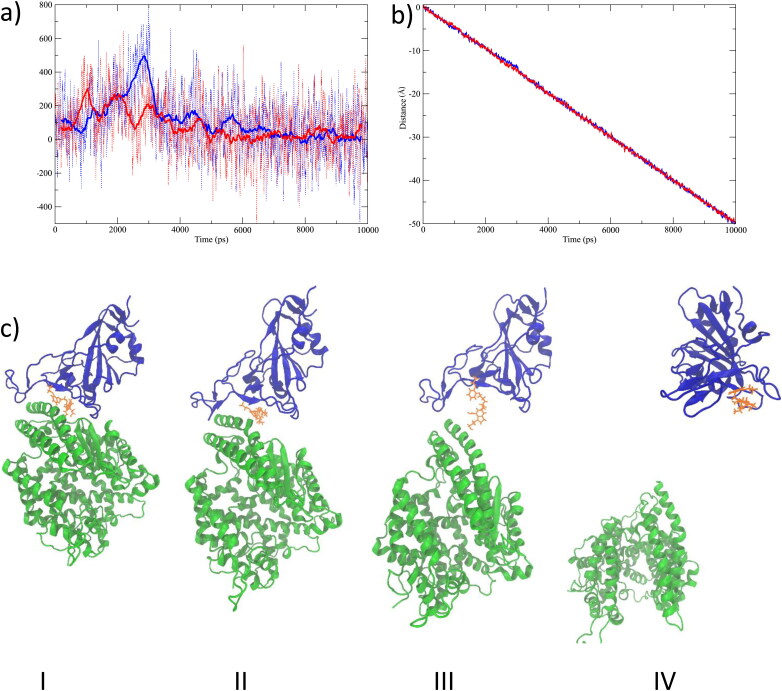
We performed constant velocity SMD simulations to study the extent of the interactions between silodosin and SARS-CoV-2 S protein and between silodosin and the ACE2. SMD forces were applied on the center of mass of the α carbon atoms of ACE2, no constraints were applied on the silodosin, and positional restraint was used only in the pulling axis direction on six α carbon atoms at the end of SARS-CoV-2 S protein. Similarly, we performed another constant velocity SMD simulation for the protein in absence of the ligand. The SMD results are given in Figure 8. The force vs. time for the SMD simulations is given in Figure 8a. The position of the center of mass of ACE2 during the SMD simulations is shown in Figure 8b. Snapshots of SMD simulations are given in Figure 8c. Interestingly, the study shows that the drug silodosin preferentially remains interacting with the SARS-CoV-2 S protein as opposed to ACE2. Figure 8a shows that the force needed for breaking the RBD S1-ACE2 interface is lower in the presence of silodosin. Silodosin has a large binding energy with many hydrogen bonds interactions, a high positional stability during the MD simulation, and the lower force in SMD analysis suggests silodosin to be a promising candidate for the inhibition of SARS-CoV-2.
Figure 8.
SMD results as applied to ACE2 of the 6LZG protein and in the presence of the silodosin ligand. a) The dash lines represent the force vs. time for the SMD simulations, and the continuous lines represent the running average of the force vs. time taken over 50 ps windows. The blue lines show the 6LZG protein without ligand, and red lines show the 6LZG protein in the presence of silodosin. b) Position of center of mass of ACE2 during the SMD simulations. c) Snapshots during the SMD simulations at I) 0 ps, II) 2200 ps, III) 4000 ps and IV) 10000 ps. The blue new-cartoon represents SARS-CoV-2 S RBD, the green new-cartoon represents the ACE2 receptor, and the yellow molecule represents silodosin.
Figure 7.
Hydrogen bond interactions of a) silodosin, b) ebastine, c) salazosulfadimidine, d) indacaterol, e) chidamide, f) regorafenib, g) tasosartan and h) bagrosin with ACE2 and SARS-Cov-2 spike RBD during 100 ns MD simulations.
Conclusions
While writing this manuscript, several repurposing studies that target the S subunit of spike or ACE2 were published (Calligari et al., 2020; Cavasotto & Di Filippo, 2020; Celı̇K et al., 2020; Krishnasamy et al., 2020; Senathilake et al., 2020; Trezza et al., 2020); herein, we are targeting the RBD S1-ACE2 interface. The structure-based docking screening, MD and SMD simulations, and binding energy calculations were conducted on the viral RBD S1-ACE2 as a drug target. From our results, the known drugs, bagrosin, chidamide, ebastine, indacaterol, regorafenib, salazosulfadimidine, silodosin and tasosartan are shown to be potential candidates for interrupting the viral RBD S1–ACE2 interface. Among these drugs, silodosin shows the best binding energy and has the greatest number of hydrogen bonding interactions during the MD simulation. The relative binding energy, the positional stability and hydrogen bond interactions between the silodosin and spike on S1-RBD interface, altogether, are suggested as a possible mechanism of action. Silodosin may therefore successfully disrupt the viral spike and host ACE2 interactions.
Supplementary Material
Acknowledgements
We gratefully acknowledge Compute Canada for computer time. R.A.P. is grateful to the Natural Sciences and Engineering Council of Canada (NSERC) for financial support. A.A.A. thanks Chen Graduate Scholarship and the School of Graduate Studies of Memorial University for funding. A.Y. thanks Science and Engineering Research Board, New Delhi, for research grant number EMR/2016/000769. A.Y. is grateful to University Institute of Engineering and Technology, CSJM University, Kanpur, India, for infrastructural support.
Glossary
Abbreviations
- ACE2
angiotensin converting enzyme 2
- HR1
heptad repeat region
- HR2
second heptad repeat region
- MD
molecular dynamic
- MMGBSA
molecular mechanics energies with the generalized Born and surface area continuum solvation
- RBD
receptor-binding domain
- SMD
steered molecular dynamics
- ADT
autodock tools
- MMFF
Merck molecular force field
- RMSD
root-mean-square deviation
- RMSF
root-mean-square fluctuation
Funding Statement
The Natural Sciences and Engineering Council of Canada (NSERC).
Author contributions
I.E.A.: conceptualization, performing the computations, analysis, investigation, writing – original draft; A.A.A.: presenting ideas, review and editing; S.S.: preparing Figures 1 and 2; A.Y.: conceptualization, writing – review and editing, supervision; R.A.P.: conceptualization, review and editing, supervision, project administration and funding acquisition.
Disclosure statement
The authors declare no competing financial interest.
References
- Amin, M., Sorour, M. K., & Kasry, A. (2020). Comparing the binding interactions in the receptor binding domains of SARS-CoV-2 and SARS-CoV. The Journal of Physical Chemistry Letters, 11(12), 4897–4900. 10.1021/acs.jpclett.0c01064 [DOI] [PubMed] [Google Scholar]
- Aminpour, M., Montemagno, C., & Tuszynski, J. A. (2019). An overview of molecular modeling for drug discovery with specific illustrative examples of applications. Molecules, 24(9), 1693. 10.3390/molecules24091693 [DOI] [PMC free article] [PubMed] [Google Scholar]
- Astuti, I. Y. (2020). Severe acute respiratory syndrome coronavirus 2 (SARS-CoV-2): An overview of viral structure and host response. Diabetes & Metabolic Syndrome: Clinical Research and Reviews, 14(4), 407–412. 10.1016/j.dsx.2020.04.020 [DOI] [PMC free article] [PubMed] [Google Scholar]
- Babadaei, M. M. N., Hasan, A., Bloukh, S. H., Edis, Z., Sharifi, M., Kachooei, E., & Falahati, M. (2020). The expression level of angiotensin-converting enzyme 2 determines the severity of COVID-19: Lung and heart tissue as targets. Journal of Biomolecular Structure and Dynamics 1–7. 10.1080/07391102.2020.1767211. [DOI] [PMC free article] [PubMed] [Google Scholar]
- Best, R. B., Zhu, X., Shim, J., Lopes, P. E. M., Mittal, J., Feig, M., & MacKerell, A. D. (2012). Optimization of the additive CHARMM all-atom protein force field targeting improved sampling of the backbone φ, ψ and side-chain χ(1) and χ(2) dihedral angles. Journal of Chemical Theory and Computation, 8(9), 3257–3273. 10.1021/ct300400x [DOI] [PMC free article] [PubMed] [Google Scholar]
- Bosch, B. J., van der Zee, R., de Haan, C. A. M., & Rottier, P. J. M. (2003). The coronavirus spike protein is a Class I virus fusion protein: Structural and functional characterization of the fusion core complex. Journal of Virology, 77(16), 8801–8811. 10.1128/jvi.77.16.8801-8811.2003 [DOI] [PMC free article] [PubMed] [Google Scholar]
- Calligari, P., Bobone, S., Ricci, G., & Bocedi, A. (2020). Molecular investigation of SARS–CoV-2 proteins and their interactions with antiviral drugs. Viruses, 12(4), 445. 10.3390/v12040445 [DOI] [PMC free article] [PubMed] [Google Scholar]
- Cavasotto, C. N., & Di Filippo, J. I. (2020). In Silico drug repurposing for COVID‐19: Targeting SARS‐CoV‐2 proteins through docking and consensus ranking. Molecular Informatics, minf.202000115. 10.1002/minf.202000115. [DOI] [PubMed] [Google Scholar]
- Celı̇K, I., Onay-Besı̇Kcı̇, A., & Ayhan-Kilcigı̇L, G., (2020). Approach to the mechanism of action of hydroxychloroquine on SARS-CoV-2: A molecular docking study. Journal of Biomolecular Structure and Dynamics 1–7. 10.1080/07391102.2020.1792993. [DOI] [PMC free article] [PubMed] [Google Scholar]
- Coronavirus disease. (2019). https://www.who.int/emergencies/diseases/novel-coronavirus-2019 (accessed Jun 14, 2020).
- Darden, T., York, D., & Pedersen, L. (1993). Particle mesh Ewald: An N·log(N) method for Ewald sums in large systems. Journal of Chemical Physics, 98(12), 10089–10092. 10.1063/1.464397 [DOI] [Google Scholar]
- DeLano, W. L. (2002). PyMOL.
- Genheden, S., & Ryde, U. (2015). The MM/PBSA and MM/GBSA methods to estimate ligand-binding affinities. Expert Opinion on Drug Discovery, 10(5), 449–461. Informa Healthcare May 1, pp . 10.1517/17460441.2015.1032936 [DOI] [PMC free article] [PubMed] [Google Scholar]
- Grest, G. S., & Kremer, K. (1986). Molecular dynamics simulation for polymers in the presence of a heat bath. Physical Review. A, General Physics, 33(5), 3628–3631. 10.1103/physreva.33.3628 [DOI] [PubMed] [Google Scholar]
- Halgren, T. A. (1996. a). Merck molecular force field. I. Basis, form, scope, parameterization, and performance of MMFF94. Journal of Computational Chemistry, 17(5–6), 490–519. . [DOI] [Google Scholar]
- Halgren, T. A. (1996. b). Merck molecular force field. II. MMFF94 van Der Waals and electrostatic parameters for intermolecular interactions. Journal of Computational Chemistry, 17(5–6), 520–552. [Google Scholar]
- Halgren, T. A. (1996. c). Merck molecular force field. III. Molecular geometries and vibrational frequencies for MMFF94. Journal of Computational Chemistry, 17(5–6), 553–586. [Google Scholar]
- Halgren, T. A. (1996. d). Merck molecular force field. V. Extension of MMFF94 using experimental data, additional computational data, and empirical rules. Journal of Computational Chemistry, 17(5–6), 616–641. [Google Scholar]
- Halgren, T. A., & Nachbar, R. B. (1996). Merck molecular force field. IV. Conformational energies and geometries for MMFF94. Journal of Computational Chemistry, 17(5–6), 587–615. [Google Scholar]
- Han, Y., & Král, P. (2020). Computational design of ACE2-based peptide inhibitors of SARS-CoV-2. ACS Nano, 14(4), 5143–5147. 10.1021/acsnano.0c02857 [DOI] [PMC free article] [PubMed] [Google Scholar]
- Hoffmann, M., Kleine-Weber, H., Schroeder, S., Krüger, N., Herrler, T., Erichsen, S., Schiergens, T. S., Herrler, G., Wu, N. H., Nitsche, A., Müller, M. A., Drosten, C., & Pöhlmann, S. (2020). SARS-CoV-2 cell entry depends on ACE2 and TMPRSS2 and is blocked by a clinically proven protease inhibitor. Cell, 181(2), 271–280.e8. 10.1016/j.cell.2020.02.052 [DOI] [PMC free article] [PubMed] [Google Scholar]
- Huang, C., Wang, Y., Li, X., Ren, L., Zhao, J., Hu, Y., Zhang, L., Fan, G., Xu, J., Gu, X., Cheng, Z., Yu, T., Xia, J., Wei, Y., Wu, W., Xie, X., Yin, W., Li, H., Liu, M., … Cao, B. (2020). Clinical features of patients infected with 2019 novel coronavirus in Wuhan, China. The Lancet, 395(10223), 497–506. 10.1016/S0140-6736(20)30183-5. [DOI] [PMC free article] [PubMed] [Google Scholar]
- Izrailev, S., Stepaniants, S., Isralewitz, B., Kosztin, D., Lu, H., Molnar, F., Wriggers, W., & Schulten, K. (1999). Steered molecular dynamics. Springer, pp 39–65. 10.1007/978-3-642-58360-5_2. [DOI] [Google Scholar]
- Kirchdoerfer, R. N., Wang, N., Pallesen, J., Wrapp, D., Turner, H. L., Cottrell, C. A., Corbett, K. S., Graham, B. S., McLellan, J. S., & Ward, A. B. (2018). Stabilized coronavirus spikes are resistant to conformational changes induced by receptor recognition or proteolysis . Scientific Reports, 8(1), 1-11. 10.1038/s41598-018-34171-7. [DOI] [PMC free article] [PubMed] [Google Scholar]
- Klauda, J. B., Venable, R. M., Freites, J. A., O'Connor, J. W., Tobias, D. J., Mondragon-Ramirez, C., Vorobyov, I., MacKerell, A. D., & Pastor, R. W. (2010). Update of the CHARMM all-atom additive force field for lipids: Validation on six lipid types. The Journal of Physical Chemistry. B, 114(23), 7830–7843. 10.1021/jp101759q [DOI] [PMC free article] [PubMed] [Google Scholar]
- Krishnasamy, R. T., A., Baba, M., Bharath, M. V., Phuntsho, J., Arunachalam, D. K., V., Natarajan, K., & Ramasamy, M. (2020). In silico analysis of active compounds from siddha herbal infusion of Ammaiyar Koondhal Kudineer (Akk) against SARS-CoV-2 spike protein and its ACE2 receptor complex. Social Science Research Network (SSRN) Electronic Journal. 10.2139/ssrn.3578294. [DOI] [Google Scholar]
- Laskowski, R. A., & Swindells, M. B. (2011). LigPlot+: Multiple ligand-protein interaction diagrams for drug discovery. Journal of Chemical Information and Modeling, 51(10), 2778–2786. 10.1021/ci200227u [DOI] [PubMed] [Google Scholar]
- Macalino, S. J. Y., Gosu, V., Hong, S., & Choi, S. (2015). Role of computer-aided drug design in modern drug discovery. Archives of Pharmacal Research, 38(9), 1686–1701. Pharmaceutical Society of Korea September 22, pp . 10.1007/s12272-015-0640-5 [DOI] [PubMed] [Google Scholar]
- Mark, P., & Nilsson, L. (2001). Structure and dynamics of the TIP3P, SPC, and SPC/E water models at 298 K. The Journal of Physical Chemistry A, 105(43), 9954–9960. 10.1021/jp003020w [DOI] [Google Scholar]
- Martyna, G. J., Tobias, D. J., & Klein, M. L. (1994). Constant pressure molecular dynamics algorithms. Journal of Chemical Physics, 101(5), 4177–4189. 10.1063/1.467468 [DOI] [Google Scholar]
- Molinspiration Cheminformatics (2020). https://www.molinspiration.com/ (accessed Jun 14).
- Morris, G. M., Ruth, H., Lindstrom, W., Sanner, M. F., Belew, R. K., Goodsell, D. S., & Olson, A. J. (2009). Software news and updates AutoDock4 and AutoDockTools4: Automated docking with selective receptor flexibility. Journal of Computational Chemistry, 30(16), 2785–2791. 10.1002/jcc.21256 [DOI] [PMC free article] [PubMed] [Google Scholar]
- Njogu, P. M., Guantai, E. M., Pavadai, E., & Chibale, K. (2016). Computer-aided drug discovery approaches against the tropical infectious diseases malaria, tuberculosis, trypanosomiasis, and leishmaniasis. ACS Infectious Diseases, 2(1), 8–31. American Chemical Society January 8, pp . 10.1021/acsinfecdis.5b00093 [DOI] [PubMed] [Google Scholar]
- O’Boyle, N. M., Banck, M., James, C. A., Morley, C., Vandermeersch, T., & Hutchison, G. R. (2011). Open Babel: An open chemical toolbox. Journal of Cheminformatics, 3(10), 33. 10.1186/1758-2946-3-33. [DOI] [PMC free article] [PubMed] [Google Scholar]
- Ou, X., Liu, Y., Lei, X., Li, P., Mi, D., Ren, L., Guo, L., Guo, R., Chen, T., Hu, J., Xiang, Z., Mu, Z., Chen, X., Chen, J., Hu, K., Jin, Q., Wang, J., & Qian, Z. (2020). Characterization of spike glycoprotein of SARS-CoV-2 on virus entry and its immune cross-reactivity with SARS-CoV. Nature Communications, 11(1), 1–12. 10.1038/s41467-020-15562-9. [DOI] [PMC free article] [PubMed] [Google Scholar]
- Panda, P. K., Arul, M. N., Patel, P., Verma, S. K., Luo, W., Rubahn, H.-G., Mishra, Y. K., Suar, M., & Ahuja, R. (2020). Structure-based drug designing and immunoinformatics approach for SARS-CoV-2. Science Advances, 6(28), eabb8097. 10.1126/sciadv.abb8097 [DOI] [PMC free article] [PubMed] [Google Scholar]
- Phillips, J. C., Braun, R., Wang, W., Gumbart, J., Tajkhorshid, E., Villa, E., Chipot, C., Skeel, R. D., Kalé, L., & Schulten, K. (2005). Scalable molecular dynamics with NAMD. Journal of Computational Chemistry, 26(16), 1781–1802. John Wiley and Sons Inc. pp. 10.1002/jcc.20289 [DOI] [PMC free article] [PubMed] [Google Scholar]
- Maestro (2020). Schrödinger, LLC, NewYork, NY. [Google Scholar]
- Senathilake, K., Samarakoon, S., & Tennekoon, K. (2020). Virtual Screening of Inhibitors Against Spike Glycoprotein of 2019 Novel Corona Virus: A Drug Repurposing Approach. 10.20944/PREPRINTS202003.0042.V1. [DOI]
- Shang, J., Wan, Y., Luo, C., Ye, G., Geng, Q., Auerbach, A., & Li, F. (2020). Cell entry mechanisms of SARS-CoV-2. Proceedings of the National Academy of Sciences of the United States of America, 117(21), 11727–11734. 10.1073/pnas.2003138117 [DOI] [PMC free article] [PubMed] [Google Scholar]
- Simmons, G., Gosalia, D. N., Rennekamp, A. J., Reeves, J. D., Diamond, S. L., & Bates, P. (2005). Inhibitors of cathepsin L prevent severe acute respiratory syndrome coronavirus entry. Proceedings of the National Academy of Sciences of the United States of America, 102(33), 11876–11881. 10.1073/pnas.0505577102 [DOI] [PMC free article] [PubMed] [Google Scholar]
- Sun, H., Duan, L., Chen, F., Liu, H., Wang, Z., Pan, P., Zhu, F., Zhang, J. Z. H., & Hou, T. (2018). Assessing the performance of MM/PBSA and MM/GBSA methods. 7. Entropy effects on the performance of end-point binding free energy calculation approaches. Physical Chemistry Chemical Physics: PCCP, 20(21), 14450–14460. 10.1039/c7cp07623a [DOI] [PubMed] [Google Scholar]
- Tortorici, M. A., & D, Veesler (2019). Structural insights into coronavirus entry. In Advances in virus research (pp. 93–116). Academic Press Inc., Vol. 105. 10.1016/bs.aivir.2019.08.002. [DOI] [PMC free article] [PubMed] [Google Scholar]
- Trezza, A., Iovinelli, D., Santucci, A., Prischi, F., & Spiga, O. (2020). An integrated drug repurposing strategy for the rapid identification of potential SARS-CoV-2 viral inhibitors. Scientific Reports, 10(1), 1–8. 10.1038/s41598-020-70863-9. [DOI] [PMC free article] [PubMed] [Google Scholar]
- Trott, O., & Olson, A. J. (2009). AutoDock Vina: Improving the speed and accuracy of docking with a new scoring function, efficient optimization, and multithreading. Journal of Computational Chemistry, 31(2), 455–461. 10.1002/jcc.21334 [DOI] [PMC free article] [PubMed] [Google Scholar]
- Tu, Y. F., Chien, C. S., Yarmishyn, A. A., Lin, Y. Y., Luo, Y. H., Lin, Y. T., Lai, W. Y., Yang, D. M., Chou, S. J., Yang, Y. P., Wang, M. L., & Chiou, S. H. (2020). A review of Sars-Cov-2 and the ongoing clinical trials. International Journal of Molecular Sciences, 21(7), 2657. MDPI AG April . 10.3390/ijms21072657 [DOI] [PMC free article] [PubMed] [Google Scholar]
- Tuckerman, M., Berne, B. J., & Martyna, G. J. (1992). Reversible multiple time scale molecular dynamics. Journal of Chemical Physics, 97(3), 1990–2001. 10.1063/1.463137 [DOI] [Google Scholar]
- Ursu, O., Holmes, J., Knockel, J., Bologa, C. G., Yang, J. J., Mathias, S. L., Nelson, S. J., & Oprea, T. I. (2017). DrugCentral: Online drug compendium. Nucleic Acids Research, 45(D1), D932–D939. 10.1093/nar/gkw993 [DOI] [PMC free article] [PubMed] [Google Scholar]
- Wang, Q., Zhang, Y., Wu, L., Niu, S., Song, C., Zhang, Z., Lu, G., Qiao, C., Hu, Y., Yuen, K. Y., Wang, Q., Zhou, H., Yan, J., & Qi, J. (2020). Structural and functional basis of SARS-CoV-2 entry by using human ACE2. Cell, 181(4), 894–904.e9. 10.1016/j.cell.2020.03.045 [DOI] [PMC free article] [PubMed] [Google Scholar]
- Wei, T. z., Wang, H., Wu, X., Qing, Lu, Y., Guan, S. h., Dong, F. q., Dong, C. l., Zhu, G. l., Bao, Y. z., Zhang, J., Wang, G. y., Li, H. & Ying, (2020). In silico screening of potential spike glycoprotein inhibitors of SARS-CoV-2 with drug repurposing strategy. Chinese Journal of Integrative Medicine, 26(9), 663–669. 10.1007/s11655-020-3427-6 [DOI] [PMC free article] [PubMed] [Google Scholar]
- Whisenant, J., & Burgess, K. (2020). Blocking coronavirus 19 infection via the SARS-CoV-2 spike protein: Initial steps. ACS Medicinal Chemistry Letters, 11(6), 1076–1078. American Chemical Society . 10.1021/acsmedchemlett.0c00233 [DOI] [PMC free article] [PubMed] [Google Scholar]
- Wishart, D. S., Knox, C., Guo, A. C., Shrivastava, S., Hassanali, M., Stothard, P., Chang, Z., & Woolsey, J. (2006). DrugBank: A comprehensive resource for in silico drug discovery and exploration. Nucleic Acids Research, 34(Database issue), D668–D672. 10.1093/nar/gkj067 [DOI] [PMC free article] [PubMed] [Google Scholar]
- Xia, S., Liu, M., Wang, C., Xu, W., Lan, Q., Feng, S., Qi, F., Bao, L., Du, L., Liu, S., Qin, C., Sun, F., Shi, Z., Zhu, Y., Jiang, S., & Lu, L. (2020). Inhibition of SARS-CoV-2 (Previously 2019-nCoV) infection by a highly potent pan-coronavirus fusion inhibitor targeting its spike protein that harbors a high capacity to mediate membrane fusion . Cell Research, 30(4), 343–355. 10.1038/s41422-020-0305-x [DOI] [PMC free article] [PubMed] [Google Scholar]
Associated Data
This section collects any data citations, data availability statements, or supplementary materials included in this article.


