

Abstract
Objective
The aim of this study was to investigate the effect of a financial incentive on the number of daily walking steps among community-dwelling adults in Japan.
Study design
Two-arm, parallel-group randomised controlled trial.
Setting/participants
We recruited physically inactive community-dwelling adults from Sendai city, Japan. Eligible participants were randomly allocated to an intervention or a wait list control group. Pedometers were used to assess the mean number of daily steps in three periods: baseline (weeks 1–3), intervention (weeks 4–6) and follow-up (weeks 7–9).
Intervention
The intervention group was offered a financial incentive (shopping points) to meet the target number of increased daily steps in the intervention period.
Main outcome measures
The primary outcome was an increase in the mean number of daily steps in the intervention and follow-up periods compared with baseline.
Results
Seventy-two participants (69.4% women; mean age, 61.2±16.2 years; mean number of daily steps at baseline, 6364±2804) were randomised to the intervention (n=36) and control groups (n=36). During the intervention period, the increase in mean daily steps was significantly higher in the intervention group (1650, 95% CI=1182 to 2119) than in the control group (514, 95% CI=136 to 891; p<0.001). However, the difference between groups was not significant at follow-up after the incentives were removed (p=0.311). In addition, compared with controls, a significantly higher proportion of participants in the intervention group showed an increase in mean daily steps of ≥1000 (69.4% vs 30.6%, respectively; OR=5.17, 95% CI=1.89 to 14.08). There were no adverse effects from the intervention.
Conclusions
The present results suggest that financial incentives are effective in promoting short-term increases in physical activity.
Trial registration number
UMIN000033276.
Keywords: financial incentive, walking steps, randomised controlled trial, Japan
Strengths and limitations of this study.
This study is unique in offering financial incentives in the form of local shopping points.
The financial incentive was a fairly small amount.
The intervention involved only one type of financial incentive.
Only the effect of a short-term intervention (over 3 weeks) was evaluated.
Introduction
Physical inactivity is a serious problem all around the world. According to the Global Action Plan on Physical Activity 2018–2030,1 one in four adults (1.4 billion people worldwide) do not meet the WHO recommendations for physical activity levels. According to reports from the USA,2 3 a failure to meet the recommended physical activity levels is associated with approximately US$117 billion in annual healthcare costs and 10% of all premature deaths. Therefore, physical inactivity imposes a substantial burden on healthcare costs and longevity. To help solve these problems, the WHO and national governments have developed various policies to promote higher levels of physical activity.1–5 Walking is a popular and major source of physical activity worldwide.1 2 6In the Japanese National Health Promotion Movement (‘Health Japan 21’), a higher number of daily walking steps is a target for physical activity as follows: 9000 and 8500 steps in men and women aged <65 years, respectively, and 7000 and 6000 steps in men and women aged ≥65 years, respectively.7
A systematic review (meta-analysis) has suggested that financial incentives are effective in promoting health behaviours such as smoking cessation, vaccinations and participation in cancer screening.8 Mitchell et al 9 conducted a systematic review of randomised controlled trials (RCTs) on the effects of financial incentives on physical activity and reported the results of a meta-analysis of studies promoting changes in daily walking steps. However, these studies did have methodological differences in terms of incentives (eg, cash, charity, lottery or team incentives) and target populations (eg, overweight and obese adults). Only one study from Asia (Singapore) was included in this meta-analysis.
Although walking is a major source of physical activity in daily life for Japanese people, the national average number of daily walking steps for Japanese adults (aged ≥20 years) has been decreasing, from 7655 in 2000 to 6322 in 2017.10 Considering the rapid ageing of the population and escalating healthcare costs, more effective measures aimed at promoting walking at the population level need to be established. Therefore, the aim of this study was to examine the effects of a financial incentive on the number of daily walking steps among community-dwelling adults in Japan.
Methods
Study design
The protocol of this study has been reported in detail elsewhere.11 Briefly, this was a single-centre, single-blind, parallel-group RCT in which participants were randomly assigned to an intervention or a control group.
Written informed consent was obtained from all participants. This study was also registered in the University Hospital Medical Information Network.
Participants
In August 2018, leaflets were distributed to each house in the Nakayama area of Aoba-ku in Sendai city, Japan. Applicants who met the inclusion criteria could apply through an online application, fax, or telephone.
Inclusion and exclusion criteria
Individuals could apply for participation in this study if they met all of the following inclusion criteria: (1) adult (aged ≥20 years) living in the Nakayama area, (2) possession of a community development integrated circuit (IC) card in the Nakayama area (Nakayama Machi-dukuri IC Card) and (3) ability to walk unaided without using a cane, walker or wheelchair.
Individuals who met any of the following exclusion criteria could not participate in the study: (1) physical activity restricted by a physician, (2) history of heart attack or stroke within the last 6 months, (3) blood pressure exceeding 180 mm Hg systolic or 110 mm Hg diastolic or (4) already habitually exercising (task of ≥4 metabolic equivalents) more than twice per week.
Shopping points are added to an IC card when the customer purchases goods or participates in community activities in the Nakayama area. Customers can redeem their points during payment transactions while shopping. For example, customers can get 1 point when they purchase goods worth 200 JPY (≈US$2). IC cards are also intended to enhance social interaction among locals.
Power and sample size
Based on a previous study carried out in 2013,12 we assumed that an average difference of 1302 steps would be achieved in the intervention period (weeks 4–6) by offering a financial incentive of 2000 JPY (≈US$18 at the time of the study in 2018) and setting the SD at 1711. In addition, our previous study reported that an increase of 1000 steps was associated with a reduced medical costs of 1300 JPY (≈US$12) per month,13 and another study reported that an increase of 1000 steps had some impact on health at the population level because it contributes to a 3.2% reduction in the average relative risk of non-communicable diseases, dementia, joint-musculoskeletal impairment and mortality.4 When an α error of 0.05 and a statistical power of 0.90 were applied, the minimum sample size was 74 persons (37 persons per group). When an α error of 0.05 and a statistical power of 0.80 were applied with this sample size, a mean difference of ≥1130 steps was considered statistically significant.
Study procedure
The flow of the study procedure is shown in figure 1. In a briefing session held in September 2018, the researchers rechecked the inclusion and exclusion criteria for each applicant. All the selected participants provided informed consent to participate in the study. At the briefing session, each participant was provided with a pedometer (FS-800; Estera, Saitama, Japan) containing a three-axis acceleration sensor. To maintain the accuracy of the pedometer, all participants received an explanation that they should wear the pedometer close to their waist because steps will not be counted correctly when worn on a different location, when placed in a handbag, or when set in any other position that results in irregular movements. The number of daily walking steps at baseline was measured in the first 3 weeks of the study period (weeks 1–3) for all the participants.
Figure 1.
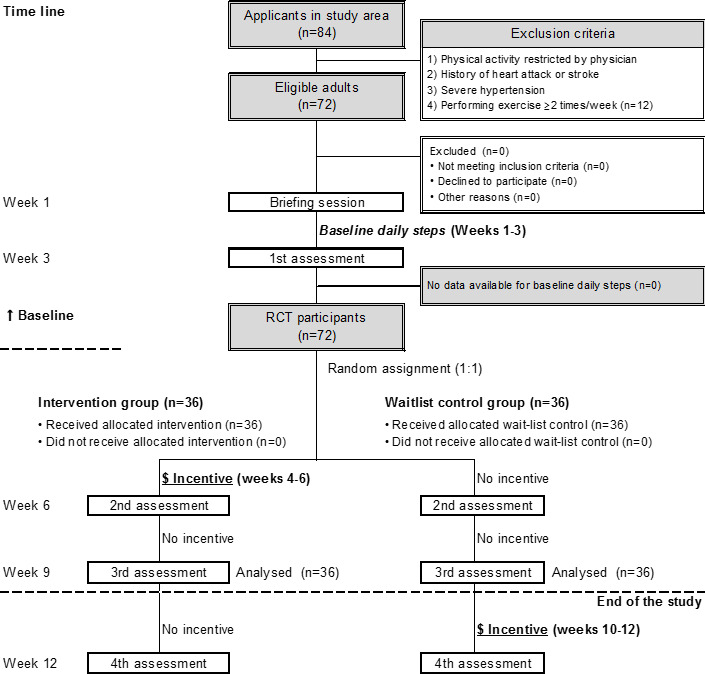
Consort flowchart of the study procedure. RCT, randomised controlled trial.
Randomisation
After completing the 3-week baseline period, participants were randomised to one of the two groups (1:1 allocation) based on the permuted block method by computer-generated randomisation. The allocation sequence was managed by two experienced random assignment researchers.
Blinding
The assignment data could only be accessed by random assignment researchers; all other staff were blinded to random assignments. The assignment information was kept in a password-protected storage device. The researchers involved exclusively in the random assignment notified the participants about their own assignment in a closed room separated from other examination locations. During the notification process, these random assignment researchers warned the participants not to talk about their assignment with anyone else. In addition, the data analyst was blinded to the assignments. The random assignment researchers were not involved in statistical analyses.
Intervention
The intervention was a financial incentive in the form of shopping points that could be redeemed at 14 stores in the study area. The following two kinds of financial incentives were offered:
If the mean number of daily walking steps in the intervention period was ≥6000, shopping points worth 1000 JPY were awarded.
If the mean number of daily walking steps during the intervention period increased by ≥1000 from baseline, shopping points worth 1000 JPY were awarded.
Based on the exchange rate on 31 August 2018, 2000 JPY was equivalent to US$18. Participants in the intervention group who achieved their daily step goals during the intervention period (weeks 4–6) were rewarded with shopping points worth 1000 JPY or 2000 JPY on their IC card at that time (after the end of the trial, that is, week 12). And then, their incentive was removed for the follow-up period (weeks 7–9). We did not specify how the shopping points could be used, so it is possible that they might have used the points for unhealthy purchases (eg, cigarettes).
Wait list control group
The wait list control group had no incentives all the way through the end of the follow-up period. It was only after the study was complete that they were offered the same incentives as the intervention group during weeks 10–12. All conditions except timing were the same as those for the intervention group.
Measurements
The participants’ baseline characteristics were assessed at the date of the briefing session. Interviews with trained interviewers were conducted to obtain information regarding medical history, frailty (the Kihon Checklist),14–18 physical activity level,19 20 transportation when going out, education level,21 work, subjective economic status, time affluence (having spare time),22 body height, weight, pain and falling. Blood pressure was also measured using an automated sphygmomanometer (HEM-1040; Omron, Kyoto, Japan).
Transportation when going out was assessed by asking the question ‘What kinds of transportation have you used more than twice per week when going out in the last month? The participants were asked to choose one of the following eight responses: ‘walking’, ‘bicycle’, ‘motorbike’, ‘car’, ‘train’, ‘bus’, ‘taxi’ and ‘other’.
Economic affluence was assessed by asking the question ‘How do you feel about your current household situation?’ The participants were asked to choose one of the following five answers: ‘most affluent’, ‘more affluent’, ‘neither more nor less’, ‘less affluent’ and ‘non-affluent’. We classified the first three answers as ‘affluent’ and the last two as ‘non-affluent’.
Time affluence (having spare time) was assessed by asking the question ‘Do you have enough time available to take rest or enjoy leisure in daily life?’ The participants were asked to choose one of the following four answers: ‘more affluent’, ‘little affluent’, ‘less affluent’ and ‘non-affluent’. We classified the first two answers as ‘affluent’ and the last two as ‘non-affluent’.
Incident falls were assessed based on the question ‘Have you fallen in the past 3 weeks?’ The participants were asked to answer either ‘yes’ or ‘no’. Incident pain was assessed based on the question ‘How much pain have you experienced during the past 3 weeks?’ The participants were asked to choose one of the following six answers: ‘none’, ‘very mild’, ‘mild’, ‘moderate’, ‘severe’ and ‘very severe’.
Outcome measurements
The participants were asked to visit the study centre every 3 weeks, and evaluations of individual daily steps were carried out during each visit. For each visit, we transferred data on the number of daily steps to a computer and asked the participants whether they had experienced any pain or falls in the 3-week period. All participants were instructed to wear the pedometer while awake every day during the study period.
The primary outcome was the mean increase in the number of daily steps during the intervention period (weeks 4–6) compared with that at baseline.
The secondary outcomes were (1) an increase in the number of daily steps by ≥1000 at weeks 4–6 or weeks 7–9 from baseline, (2) incident falls at weeks 4–6 or weeks 7–9 and (3) incident pain at weeks 4–6 or weeks 7–9.
Statistical analyses
Regarding the primary outcome, the t-test was applied to examine whether the mean increases and rate of change in the number of daily steps at weeks 4–6 and weeks 7–9 from baseline differed significantly between the intervention and control groups.
Regarding the secondary outcomes, logistic regression models were applied to examine whether the proportions of participants with an increase of ≥1000 steps were significantly different and to assess the probabilities of incident falls and incident pain. ORs and 95% CIs were also estimated.
In addition, stratified analyses were conducted to check for any differences in the number of daily steps in terms of sex, age, frailty, physical activity level, transportation when going out, education level, work, subjective economic status, time affluence and obesity.
All analyses were performed using IBM SPSS Statistics V.25 (IBM SPSS).
Patient and public involvement
Patients or the public were not involved in the design, or conduct, or reporting, or dissemination plans of our trial.
Results
The mean age (SD) of the participants (69.4% women) was 61.2 (16.2) years, and 30.6% had an undergraduate or graduate degree.
At baseline, the mean numbers of daily steps (SD) in the intervention and control groups were 6859 (3223) and 5869 (2249), respectively; this difference was not significant (p=0.135) (table 1). Participants in the intervention group were significantly more likely to have pain than those in the control group (p=0.011). No significant differences in age, sex, blood pressure, history of disease, frailty, physical activity level, transportation, educational level, employment, subjective household economic status, subjective time affluence or body mass index were found between the two groups.
Table 1.
Baseline characteristics of the study participants (n=72)
| Characteristics | Intervention (n=36) | Control (n=36) | P value |
| Female, % | 69.4 | 69.4 | 1.000 |
| Age, years (mean±SD) | 62.0±16.5 | 60.4±16.1 | 0.671 |
| Blood pressure, mm Hg (mean±SD) | |||
| Systolic blood pressure | 130.7±20.7 | 125.5±18.5 | 0.264 |
| Diastolic blood pressure | 79.0±11.4 | 76.7±10.8 | 0.378 |
| History of disease, % | |||
| Stroke | 2.8 | 0.0 | 0.314 |
| Hypertension | 25.0 | 30.6 | 0.599 |
| Myocardial infarction | 0.0 | 5.6 | 0.151 |
| Diabetes | 8.3 | 8.3 | 1.000 |
| Arthritis | 2.8 | 5.6 | 0.555 |
| Osteoporosis | 5.6 | 0.0 | 0.151 |
| Cancer | 16.7 | 8.3 | 0.285 |
| Frailty, % | 5.6 | 19.4 | 0.075 |
| Physical activity, MET (mean±SD) | 35.8±8.5 | 36.1±5.3 | 0.822 |
| Transportation, % | |||
| Motorbike or car | 61.1 | 80.6 | 0.070 |
| Educational attainment, % | |||
| High school or less | 52.8 | 47.2 | 0.820 |
| College/university | 16.7 | 22.2 | |
| Undergraduate or graduate degree | 30.6 | 30.6 | |
| Employment, % | |||
| ≥4 days/week | 27.8 | 36.1 | 0.546 |
| <4 days/week | 19.4 | 11.1 | |
| Not working | 52.8 | 52.8 | |
| Subjective household economic status | |||
| Affluent | 80.6 | 86.1 | 0.527 |
| Non-affluent | 19.4 | 13.9 | |
| Subjective time affluence | |||
| Affluent | 72.2 | 77.8 | 0.586 |
| Non-affluent | 27.8 | 22.2 | |
| Pain | |||
| Absent | 22.2 | 44.4 | 0.011 |
| Present | 5.6 | 2.8 | |
| Body mass index, kg/m2 (mean±SD) | 22.1±3.0 | 23.2±4.6 | 0.250 |
| Baseline number of steps/day (mean±SD) | 6859±3223 | 5869±2249 | 0.135 |
MET, metabolic equivalent.
All 72 participants completed the intervention (weeks 4–6) and follow-up periods (weeks 7–9). Comparisons of steps between the baseline and intervention or follow-up periods in the intervention and control groups are shown in figure 2. The mean increases in the numbers of daily steps from baseline to the intervention period in the intervention and control groups were 1650 (95% CI=1182 to 2119) and 514 (95% CI=136 to 891), respectively, indicating a significant difference between groups (p<0.001). The mean increase rate in the number of daily steps from baseline to the intervention period was significantly higher in the intervention group than in the control group (31.0% vs 9.1%, respectively; p<0.001) (online supplemental table 1). The mean increase in the number of daily steps from baseline to the follow-up period was larger in the intervention group (933, 95% CI=312 to 1555) than in the control group (556, 95% CI=136 to 976) (figure 2); however, no significant difference was observed between groups (p=0.311). Regarding the mean increase rate in the number of daily steps from baseline to the follow-up period, no significant difference was found between groups (p=0.270) (online supplemental table 2).
Figure 2.
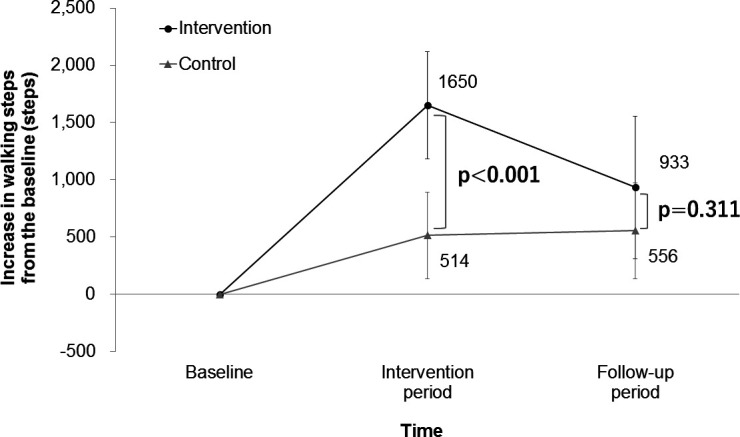
Changes in the number of daily walking steps during the intervention and follow-up periods (means and 95% CIs).
bmjopen-2020-037303supp001.pdf (23.4KB, pdf)
A comparison of the proportion of participants who increased the mean number of daily steps by ≥1000 from baseline to the intervention period is shown in table 2. The proportion in the intervention group was 69.4% (n=25) and that in the control group was 30.6% (n=11). The proportion was significantly higher in the intervention group than in the control group (OR=5.17; 95% CI=1.89 to 14.08).
Table 2.
Comparison of the proportions of participants with an increase in the number of daily steps of ≥1000 from baseline to the intervention period (weeks 4–6) (n=72)
| Intervention period (weeks 4–6) | ||||
| n | Proportion* | OR† | 95% CI | |
| Intervention | 36 | 69.4 | 5.17 | 1.89 to 14.08 |
| Control | 36 | 30.6 | 1.00 | Reference |
*Proportions of participants who increased the number of daily steps by ≥1000 from baseline.
†Logistic regression analysis.
Table 3 shows the results of the analyses stratified by baseline characteristics. The subgroup analyses showed a significant increase in the number of daily steps among participants with a lower (<6000) than those with a higher (≥6000) baseline step count (p interaction=0.012).
Table 3.
Subgroup analysis: comparison of increases in the number of steps from baseline to the intervention period (weeks 4–6) (n=72)
| Intervention period (weeks 4–6) | ||||||
| Subgroup | n | Mean | 95% CI | P value* | P interaction* | |
| Sex | ||||||
| Male | Intervention | 11 | 2199 | 783 to 3615 | 0.021 | 0.140 |
| Control | 11 | 401 | –331 to 1134 | |||
| Female | Intervention | 25 | 1409 | 1054 to 1765 | 0.005 | |
| Control | 25 | 563 | 91 to 1036 | |||
| Age (years) | ||||||
| <65 | Intervention | 17 | 1650 | 780 to 2519 | 0.006 | 0.245 |
| Control | 17 | 148 | –475 to 771 | |||
| ≥65 | Intervention | 19 | 1651 | 1127 to 2175 | 0.019 | |
| Control | 19 | 841 | 390 to 1292 | |||
| Baseline number of steps | ||||||
| <6000 | Intervention | 16 | 2193 | 1331 to 3056 | <0.001 | 0.012 |
| Control | 18 | 264 | –183 to 712 | |||
| ≥6000 | Intervention | 20 | 1216 | 745 to 1687 | 0.229 | |
| Control | 18 | 763 | 130 to 1397 | |||
| Physical activity | ||||||
| Low | Intervention | 19 | 1796 | 1060 to 2531 | 0.001 | 0.116 |
| Control | 17 | 181 | –286 to 648 | |||
| High | Intervention | 17 | 1488 | 856 to 2121 | 0.107 | |
| Control | 19 | 812 | 223 to 1400 | |||
| Body mass index (kg/m2) | ||||||
| ≥25 | Intervention | 4 | 1433 | –1262 to 4127 | 0.333 | 0.701 |
| Control | 8 | 577 | –435 to 1590 | |||
| <25 | Intervention | 32 | 1678 | 1184 to 2172 | 0.001 | |
| Control | 28 | 496 | 65 to 926 | |||
| Time affluence | ||||||
| Non-affluent | Intervention | 10 | 998 | 338 to 1658 | 0.054 | 0.926 |
| Control | 8 | –236 | –1550 to 1077 | |||
| Affluent | Intervention | 26 | 1901 | 1311 to 2492 | 0.001 | |
| Control | 28 | 728 | 390 to 1066 | |||
| Frailty | ||||||
| Yes | Intervention | 2 | 1692 | –10 558 to13 941 | 0.043 | 0.166 |
| Control | 7 | –599 | –1637 to 438 | |||
| No | Intervention | 34 | 1648 | 1158 to 2138 | 0.007 | |
| Control | 29 | 783 | 421 to 1144 | |||
| Educational level | ||||||
| High | Intervention | 17 | 1697 | 869 to 2525 | 0.022 | 0.964 |
| Control | 19 | 569 | –5 to 1142 | |||
| Low | Intervention | 19 | 1609 | 1035 to 2182 | 0.004 | |
| Control | 17 | 453 | –92 to 997 | |||
| Employment status | ||||||
| Working | Intervention | 17 | 1286 | 770 to 1802 | 0.015 | 0.661 |
| Control | 17 | 285 | –363 to 932 | |||
| Not working | Intervention | 19 | 1977 | 1201 to 2752 | 0.006 | |
| Control | 19 | 719 | 257 to 1180 | |||
| Economic affluence | ||||||
| Affluent | Intervention | 29 | 1670 | 1112 to 2228 | 0.002 | 0.698 |
| Control | 31 | 572 | 156 to 988 | |||
| Non-affluent | Intervention | 7 | 1569 | 591 to 2547 | 0.043 | |
| Control | 5 | 154 | –1118 to 1425 | |||
*t-Test
Incident falls were reported in two participants (5.7%) in the intervention group and in one participant (2.9%) in the control group, and the incident rate was not significantly different (p=0.555). Incident pain was reported in four participants (14.3%) in the intervention group and in one participant (4.2%) in the control group, and the incident rate was not significantly different (p=0.217).
Discussion
The present RCT examined the effects of a financial incentive (shopping points) on the number of daily walking steps among community-dwelling Japanese adults. The increase in the number of daily steps was significantly larger in the intervention group than in the control group, with a particularly substantial increase in those with low physical activity levels at baseline. However, caution is required when interpreting the present findings because the intervention period was as short as 3 weeks and the increased number of daily steps was not maintained after receiving the incentive. Whether the incentive needs to be continued so that the participants maintain their increased number of daily steps remains unclear.
Although most of the study participants might be considered more health-conscious than average because they volunteered to participate in this RCT and were classified as economically affluent, the present results are considered to be generalisable to the community-dwelling adult population in Japan because the mean number of daily steps among the study participants at baseline was similar to the nationwide average (6364 vs 6322, respectively).10 The study area was safe for walking and has sidewalks that are favourable for pedestrians, which is typical in local communities in Japan.
Previous studies have reported that socioeconomic status, which includes occupation and education and income levels, is associated with health inequality.23 24 However, the results of this study demonstrated that offering a financial incentive to increase the number of daily walking steps was not affected by economic affluence or education level. Walking has considerable health benefits25 and does not require any special training or substantial additional costs. This could be the reason why the financial incentive resulted in an increase in the number of daily walking steps, regardless of the socioeconomic status.
Previous studies aiming to increase physical activity levels have used cash as a financial incentive.12 26–28 In this study, we chose to use shopping points (a non-cash incentive) that could only be redeemed at stores in the study area because we believed that it would cause the participants to patronise local stores in the community more frequently. Therefore, a unique aspect of this study is that it aimed to promote both health and economic activities in the local community. In fact, local stores in the study area chose to resume the financial incentive programme after this RCT was completed.
This study had several notable strengths. First, all of the participants completed each programme during the trial period. Second, to our knowledge, this study is unique in offering financial incentives in the form of local shopping points. Third, the financial incentive offered in this study was a fairly low amount compared with other financial incentive studies involving physical activity. Although most of study participants were classified as affluent in terms of their economic status, the relatively small financial incentive was still effective for increasing the number of daily walking steps. Fourth, the present results are considered to be generalisable to the community-dwelling adult population in Japan because the mean number of daily walking steps among the study participants at baseline was similar to the nationwide average.10
Limitations
This study also had several limitations. First, the intervention involved only one type of financial incentive; therefore, the effects of changes in the corresponding financial incentive or its application (eg, donations) are unclear. Second, only the effect of a short-term intervention (over 3 weeks) was evaluated; whether an intervention involving a financial incentive would be effective for maintaining an increase in the number of daily walking steps over the long term is unclear. Third, the study participants were all Japanese adults; therefore, the present results may not generalisable to non-Japanese populations. Fourth, the possibility of overestimation due to the small sample size cannot be ruled out. However, the sample size set at the start of the study was almost achieved.
Conclusions
The results of this study indicated that offering a financial incentive was effective for increasing the number of daily walking steps among Japanese community-dwelling adults, even though the intervention period was as short as 3 weeks. The difference between the intervention and control groups was not significant at follow-up after the incentives were removed. Future research should explore whether the continuation of financial incentives can maintain an increased number of daily steps over the long term.
Supplementary Material
Acknowledgments
The most important acknowledgement is to the participants.
Footnotes
Contributors: IT supervised this study and is the guarantor. FT, YT and IT were involved in the design. FT and IT prepared draft manuscript. SA, SM, YK, DN, KM, YLi, SZ, YLu, YS, SB, TY, TO and TS revised the manuscript. SZ carried out the statistical analyses. All authors approved submission of this manuscript.
Funding: This work was supported by TERUMO Foundation for Life Sciences and Arts.
Competing interests: None declared.
Patient consent for publication: Not required.
Ethics approval: The study protocol was reviewed and approved by the Ethics Committee of Tohoku University Graduate School of Medicine (No. 2018-1-171).
Provenance and peer review: Not commissioned; externally peer reviewed.
Data availability statement: Data are available upon reasonable request.
Supplemental material This content has been supplied by the author(s). It has not been vetted by BMJ Publishing Group Limited (BMJ) and may not have been peer-reviewed. Any opinions or recommendations discussed are solely those of the author(s) and are not endorsed by BMJ. BMJ disclaims all liability and responsibility arising from any reliance placed on the content. Where the content includes any translated material, BMJ does not warrant the accuracy and reliability of the translations (including but not limited to local regulations, clinical guidelines, terminology, drug names and drug dosages), and is not responsible for any error and/or omissions arising from translation and adaptation or otherwise.
References
- 1. World Health Organization Global action plan on physical activity 2018-2030. more active people for a healthier world. Geneva: World Health Organization, 2018. [Google Scholar]
- 2. Piercy KL, Troiano RP, Ballard RM, et al. The physical activity guidelines for Americans. JAMA 2018;320:2020–8. 10.1001/jama.2018.14854 [DOI] [PMC free article] [PubMed] [Google Scholar]
- 3. US Department of Health and Human Services Physical activity guidelines for Americans. Washington, DC: U.S. Department of Health and Human Services, 2018. [Google Scholar]
- 4. Miyachi M, Tripette J, Kawakami R, et al. "+10 min of Physical Activity per Day": Japan Is Looking for Efficient but Feasible Recommendations for Its Population. J Nutr Sci Vitaminol 2015;61 Suppl:S7–9. 10.3177/jnsv.61.S7 [DOI] [PubMed] [Google Scholar]
- 5. Nishi N. Monitoring obesity trends in health Japan 21. J Nutr Sci Vitaminol 2015;61 Suppl:S17–19. 10.3177/jnsv.61.S17 [DOI] [PubMed] [Google Scholar]
- 6. Althoff T, Sosič R, Hicks JL, et al. Large-Scale physical activity data reveal worldwide activity inequality. Nature 2017;547:336–9. 10.1038/nature23018 [DOI] [PMC free article] [PubMed] [Google Scholar]
- 7. Ministry of Health, Labour and Welfare Health Japan 21, 2012. Available: https://www.mhlw.go.jp/bunya/kenkou/dl/kenkounippon21_01.pdf
- 8. Giles EL, Robalino S, McColl E, et al. The effectiveness of financial incentives for health behaviour change: systematic review and meta-analysis. PLoS One 2014;9:e90347. 10.1371/journal.pone.0090347 [DOI] [PMC free article] [PubMed] [Google Scholar]
- 9. Mitchell MS, Goodman JM, Alter DA, et al. Financial incentives for exercise adherence in adults: systematic review and meta-analysis. Am J Prev Med 2013;45:658–67. 10.1016/j.amepre.2013.06.017 [DOI] [PubMed] [Google Scholar]
- 10. The Ministry of Health, Labor and Welfare in Japan National health and nutrition survey. Available: https://www.mhlw.go.jp/bunya/kenkou/kenkou_eiyou_chousa.html [in Japanese]
- 11. Tomata Y, Tanji F, Nurrika D, et al. Randomised controlled trial of a financial incentive for increasing the number of daily walking steps: study protocol. BMJ Open 2019;9:e026086. 10.1136/bmjopen-2018-026086 [DOI] [PMC free article] [PubMed] [Google Scholar]
- 12. Harkins KA, Kullgren JT, Bellamy SL, et al. A trial of financial and social incentives to increase older adults' walking. Am J Prev Med 2017;52:e123–30. 10.1016/j.amepre.2016.11.011 [DOI] [PubMed] [Google Scholar]
- 13. Tsuji I, Takahashi K, Nishino Y, et al. Impact of walking upon medical care expenditure in Japan: the Ohsaki cohort study. Int J Epidemiol 2003;32:809–14. 10.1093/ije/dyg189 [DOI] [PubMed] [Google Scholar]
- 14. Arai H, Satake S. English translation of the Kihon checklist. Geriatr Gerontol Int 2015;15:518–9. 10.1111/ggi.12397 [DOI] [PubMed] [Google Scholar]
- 15. Fukutomi E, Okumiya K, Wada T, et al. Relationships between each category of 25-item frailty risk assessment (Kihon checklist) and newly certified older adults under long-term care insurance: a 24-month follow-up study in a rural community in Japan. Geriatr Gerontol Int 2015;15:864–71. 10.1111/ggi.12360 [DOI] [PubMed] [Google Scholar]
- 16. Satake S, Senda K, Hong Y-J, et al. Validity of the Kihon checklist for assessing frailty status. Geriatr Gerontol Int 2016;16:709–15. 10.1111/ggi.12543 [DOI] [PubMed] [Google Scholar]
- 17. Sewo Sampaio PY, Sampaio RAC, Yamada M, et al. Validation and translation of the Kihon checklist (frailty index) into Brazilian Portuguese. Geriatr Gerontol Int 2014;14:561–9. 10.1111/ggi.12134 [DOI] [PubMed] [Google Scholar]
- 18. Tomata Y, Hozawa A, Ohmori-Matsuda K, et al. [Validation of the Kihon Checklist for predicting the risk of 1-year incident long-term care insurance certification: the Ohsaki Cohort 2006 Study]. Nihon Koshu Eisei Zasshi 2011;58:3–13. [PubMed] [Google Scholar]
- 19. Fujii H, Yamamoto S, Takeda-Imai F, et al. Validity and applicability of a simple questionnaire for the estimation of total and domain-specific physical activity. Diabetol Int 2011;2:47–54. 10.1007/s13340-011-0025-z [DOI] [Google Scholar]
- 20. Sasai H, Nakata Y, Murakami H, et al. Simultaneous validation of seven physical activity questionnaires used in Japanese cohorts for estimating energy expenditure: a doubly labeled water study. J Epidemiol 2018;28:437–42. 10.2188/jea.JE20170129 [DOI] [PMC free article] [PubMed] [Google Scholar]
- 21. Ministry of Internal Affairs and Communications Population census, 1996. Available: http://www.stat.go.jp/english/data/kokusei/index.html
- 22. Tomata Y, Tanno K, Zhang S, et al. Subjective household economic status and obesity in toddlers: a cross-sectional study of daycare centers in Japan. J Epidemiol 2019;29:33–7. 10.2188/jea.JE20170081 [DOI] [PMC free article] [PubMed] [Google Scholar]
- 23. Mackenbach JP, Stirbu I, Roskam A-JR, et al. Socioeconomic inequalities in health in 22 European countries. N Engl J Med 2008;358:2468–81. 10.1056/NEJMsa0707519 [DOI] [PubMed] [Google Scholar]
- 24. Nurrika D, Zhang S, Tomata Y, et al. Education level and incident functional disability in elderly Japanese: the Ohsaki cohort 2006 study. PLoS One 2019;14:e0213386. 10.1371/journal.pone.0213386 [DOI] [PMC free article] [PubMed] [Google Scholar]
- 25. Hakim AA, Petrovitch H, Burchfiel CM, et al. Effects of walking on mortality among nonsmoking retired men. N Engl J Med 1998;338:94–9. 10.1056/NEJM199801083380204 [DOI] [PubMed] [Google Scholar]
- 26. Finkelstein EA, Brown DS, Brown DR, et al. A randomized study of financial incentives to increase physical activity among sedentary older adults. Prev Med 2008;47:182–7. 10.1016/j.ypmed.2008.05.002 [DOI] [PubMed] [Google Scholar]
- 27. Patel MS, Asch DA, Rosin R, et al. Framing financial incentives to increase physical activity among overweight and obese adults: a randomized, controlled trial. Ann Intern Med 2016;164:385–94. 10.7326/M15-1635 [DOI] [PMC free article] [PubMed] [Google Scholar]
- 28. Patel MS, Asch DA, Rosin R, et al. Individual versus team-based financial incentives to increase physical activity: a randomized, controlled trial. J Gen Intern Med 2016;31:746–54. 10.1007/s11606-016-3627-0 [DOI] [PMC free article] [PubMed] [Google Scholar]
Associated Data
This section collects any data citations, data availability statements, or supplementary materials included in this article.
Supplementary Materials
bmjopen-2020-037303supp001.pdf (23.4KB, pdf)