

Abstract
Theoretical investigations on the molecular geometry, vibrational and electronic environment of (2E)-1-(4-aminophenyl)-3-(4-benzyloxyphenyl)-prop-2-en-1-one (APBPP) are presented for the first time. The vibration frequencies simulated were thoroughly analysed employing DFT/B3LYP using 6-311++G(d,p) basis set and compared with experimental FT- Raman and FT- IR data which showed good agreement vice-versa. Optimised molecular equilibrium geometry of the title compound was carried out. Vibrational assignments of wave numbers with PED (potential energy distribution) was done using VEDA software and the quantum chemical calculations of the molecular geometry were scaled using quantum mechanics. The title molecule showcased excellent results on HOMO - LUMO energies, NMR chemical shifts, 3.73 eV band gap, electronegativity (χ), chemical potential (μ), softness (S), global hardness (η). The low softness value (0.261) and thehigh value of electrophilicity index (4.0323) explains the biological activity of the title molecule. The reactive sites of APBPP were thoroughly investigated by Mulliken charges, MEP (Molecular electrostatic Potential) and Fukui functions. Thermo dynamical environment of the title compound for different temperatures were studied which reveals the correlations between entropy (S), heat capacity (C) and enthalpy changes (H) with temperatures. The title compound was docked into the reactive sites of antiviral (SARS-CoV-1,2) and anticancer protein using molecular docking tool and it showed excellent results compared to the ongoing clinical trials. The paper explains the experimental analysis which are in line with the quantum calculations and presents an optimistic evidence via Molecular docking studies. The synthesized compound against various panels of microorganism projects its ability to be the most potential drug to treat various pathologies in pharmacy Industry.
Keywords: DFT; FT-IR; FT- Raman; Fukui functions; COVID-19, Docking
1. Introduction
The outbreak of the global pandemic human coronavirus COVID-19 is severe acute respiratory syndrome [1]. The severity of the virus COVID-19 which originated from China can vary from asymptomatic to several fatal diseases. At present, there are no registered therapies for treating the infected patients. In order to aid the available antiviral drugs, there are many ongoing trials across the globe, and most of them are yet to exhibit efficacy. Recently in a clinical trial, ritonavir, and erlotinib an antiviral drug was used to inhibit the action of RNA polymerase and was observed to reduce the recovery record in some positive cases. However limited information is available for the safety and effectiveness of the drug [2]. The title compound is of curcumin origin and is biologically active for many diseases the present investigation is focussed on acute respiratory syndrome-like non-small cell lung cancer (NSCLC) and antiviral SARS-CoV-1 docking as an attempt to evaluate the inhibitory activity of chalcones against SARS-COVID 19.
Historically Chalcones have widespread applications in clinical chemistry, so it has induced vast interest among the researchers. Chalcone abundances in nature and their origin being flavonoid makes them to display anticancer [3], antibacterial [4], antiviral [5], antifungal [6] and many other activities. Amino Chalcones has been reported to be an effective antibacterial drug [7].Thorough literature survey revealed that hardly any work on Density Functional studies has been done for the title compound there were and no reports on the antiviral action of amino chalcones against COVID 19. Hence the present study was carried out to report an elaborative analysis of the title compound usingB3LYP/6-311++G(d,p) basis set. Spectroscopic analysis likeFT-IR and FT-Raman were performed using the same. Structure of APBPP was optimised using Gaussian 09 W. Properties like HOMO LUMO, Molecular electrostatic potential, thermodynamics and vibrational characteristics shows the information about transfer of charge within the title molecule. From Mulliken and Fukui function studies the biological activity of APBPP was confirmed. Lung cancer is most commonly spreading cancer worldwide and 80 to 85% percent cases are affected with NSCLC. The patients affected with Lung cancer and those affected with the SARS virus will have the acute respiratory syndrome. Since these pathologies suits symptoms of the current ongoing pandemic caused due to coronavirus (COVID-19) an attempt was made with Molecular docking to understand the reactive sites of Amino Phenyl Benzyloxy Phenyl chalcone to be an effective drug for various respiratory diseases. It was interesting to note that the title compound was better than the standard drugs and thus kindles the interest of many researchers in drug design.
2. Experimental details
The sample was re-crystallised with ethanol by slow evaporation method to get single crystals. The title compound was characterized by analytical methods using Perkin Elmer FT-IR spectrometer in the range 4000–400 cm−1 with 1.0 cm−1 resolution under KBr pellet technique. FT- Raman was recorded on Brucker RFS 27:FT-Raman spectrometer in the range from 4000 to 50 cm−1 using Nd-YAG 1064 nm laser. All the experiments were done at IIT (SAIF) Chennai, India.
3. Computational details
The structure of the molecule has been optimized at B3LYP/6-31++G(d,p) level and B3LYP is well known to reproduce the experimental results of an organic molecule to a greater extent [8]. The present work explains the frequency calculation to confirm the optimized geometry corresponding to the ground state with the lowest energy on the potential energy surface and the optimized structure shows all real frequencies. Introduction to the scaling factor was employed to rectify small errors in the resultant frequencies. Veda software [9] was used to study vibrational assignments and PED calculations. UV–Vis spectra investigation by TD-DFT method with 6-311++G(d,p) basis set for the gas phase have been done. The 1H and 13C NMR chemical shift were calculated with gauge-including atomic orbital (GIAO) approach by applying B3LYP/6-311++G(d,p) method of the title molecule. To have a greater understanding of APBPP, Frontier molecular orbital's (FMO) analysis has been done at the same level. To gain further insights into the UV– visible absorption spectrum, Time- Dependent Density Functional Theory (TDDFT) calculation was carried out. The Polarisable continuum model (PCM) implemented in Gaussian was utilized to include solvation during TDDFT calculations. All the calculations have been performed using G09 software [10]. Further investigations on chemical reactivity of the title compound along with its reactive sites were analysed using HOMO LUMO energies and the reactive descriptors like hardness, softness, electrophilicity and electro negativity index. Auto dock tools (ADT) 4.2.6 [11] were used to investigate the docking nature of the title compound.
4. Results and discussion
4.1. Computational geometry
The B3LYP optimized ground state geometry is given in Fig. 1 and the computed bond parameters are given in Table1 . From the table is found that computed bond parameters are compared with that of the synthesized crystal structure by the author [12] and it is clear that there is an excellent agreement between the crystal structure and the optimized geometry. The computed bond lengths suggest that APBPP shows excellent delocalization throughout the molecule. The title molecule adopts itself to P21/n space group and its melting point is 140 °C. For instance, the C–C bond lengths are found to occur between their single (∼1.54 Å) and double (∼1.32 Å) bond limits. Thus, this APBPP molecule shows partial double bond character. Also, the optimized geometry indicates that the benzyloxy moiety is not coplanar with the central benzylidene moiety. The computed bond parameters show a slight variation with the experimental results. This is due to intermolecular interaction under the influence of the solid phase environment which was absent in optimized geometry (gas phase).
Fig. 1.

Optimized geometric structure of APBPP with atom numbering.
Table 1.
Computed Bond Lengths and Bond Angles of APBPP for selected atoms at B3LYP/6-31++G(d,p) level.
| S.No. | Parameter | Crystal Structure* | Optimized Geometry |
|---|---|---|---|
| A | Bond Length (A°) | ||
| 1 | C1-C2 | 1.3845 | 1.4096 |
| 2 | C1-O9 | 1.3729 | 1.4066 |
| 3 | C1-N27 | 1.3696 | 1.3882 |
| 4 | C11-O26 | 1.2281 | 1.2335 |
| 5 | C21-O28 | 1.3317 | 1.3617 |
| 6 | C14-C12 | 1.3191 | 1.3493 |
| 7 | C5-C6 | 1.3963 | 1.3915 |
| B | Bond Angle (°) | ||
| 1 | C1-C2-C4 | 120.8224 | 120.4598 |
| 2 | N27-C1-C2 | 120.463 | 120.7084 |
| 3 | O25-C11-C12 | 120.055 | 120.629 |
| 4 | C12-C14-C16 | 128.3883 | 128.2524 |
| 5 | C21-O28-C29 | 112.8236 | 118.6031 |
* Taken from Ref [12]
4.2. Vibrational analysis
The Fourier Transform Infra Red spectra and Fourier Transform Raman spectra for a molecule explains the various spectral bands at specified wave numbers. In this section vibrational analysis aims at predicting the exact vibrational modes and its corresponding observed bands. The title APBPP consists of 44 atoms and 126 normal modes of vibration.
A comparative graphical representation of the experimental and theoretical FTIR and FT-Raman spectra at B3LYP/6-311++G(d,p) is presented in Fig. 2 . The computed vibrational frequencies for the title molecule with unscaled B3LYP/6-311++G(d,p) is found to be slightly higher than the experimental results. A scaling factor of 0.961 was adopted as compensation to errors occurring due to incompleteness of basis set and vibrational anharmonicity and also to match the experimental and theoretical values. The experimental and scaled frequencies are tabulated in Table 2 . Using VEDA software relative intensity for theoretical frequencies were calculated. The detailed assignment on the fundamental modes of the title molecule were proposed using vibrational concept and is presented.
Fig. 2.

Comparative spectrum of FT- Raman and FT-IR.
Table 2.
Vibrational Assignments of the title compound using PED.
| Modes | Frequencies(cm-1) | IR intensity | Raman Activity | VibrationalAssignments | |||||
|---|---|---|---|---|---|---|---|---|---|
| Experimental | Theoretical | ||||||||
| FTIR | FT-Raman | Unscaled | Scaled* | Relative | Absolute** | Relative | Absolute | ||
| 126 | 3558 | – | 3703 | 3558 | 23 | 4 | 90 | 1 | υNH (1 0 0) |
| 125 | 3469 | – | 3590 | 3450 | 65 | 11 | 566 | 6 | υNH (1 0 0) |
| 124 | – | – | 3224 | 3098 | 18 | 3 | 164 | 2 | υCH (95) |
| 123 | – | – | 3222 | 3097 | 20 | 3 | 103 | 1 | υCH (93) |
| 122 | – | – | 3217 | 3092 | 8 | 1 | 67 | 1 | υCH (96) |
| 121 | 3086 | – | 3213 | 3088 | 3 | 1 | 74 | 1 | υCH (95) |
| 120 | 3080 | 3080 | 3208 | 3082 | 19 | 3 | 379 | 4 | υCH (92) |
| 119 | – | 3078 | 3203 | 3078 | 1 | 0 | 47 | 0 | υCH (84) |
| 118 | – | 3074 | 3198 | 3073 | 29 | 5 | 55 | 1 | υCH (90) |
| 117 | – | 3070 | 3194 | 3070 | 7 | 1 | 21 | 0 | υCH (90) |
| 116 | – | 3065 | 3188 | 3064 | 9 | 2 | 118 | 1 | υCH (87) |
| 115 | 3060 | 3061 | 3184 | 3060 | 10 | 2 | 77 | 1 | υCH (94) |
| 114 | – | 3055 | 3179 | 3055 | 3 | 0 | 100 | 1 | υCH (92) |
| 113 | – | 3053 | 3176 | 3052 | 6 | 1 | 13 | 0 | υCH (1 0 0) |
| 112 | – | 3051 | 3174 | 3051 | 33 | 6 | 147 | 2 | υCH (93) |
| 111 | – | 3049 | 3174 | 3050 | 17 | 3 | 179 | 2 | υCH (97) |
| 110 | 3036 | 3040 | 3165 | 3041 | 1 | 0 | 23 | 0 | υCH (98) |
| 109 | 2949 | 3069 | 2949 | 22 | 4 | 38 | 0 | υCH (1 0 0) | |
| 108 | 2857 | 2869 | 3021 | 2903 | 34 | 6 | 25 | 0 | υCH (1 0 0) |
| 107 | – | 1625 | 1713 | 1646 | 13 | 2 | 56 | 1 | υOC (48) + υCC(23) |
| 106 | 1619 | – | 1669 | 1604 | 5 | 1 | 14 | 0 | βHNH (57) |
| 105 | 1595 | – | 1660 | 1595 | 24 | 4 | 53 | 1 | υCC (22) + βHNH(11) |
| 104 | – | – | 1660 | 1595 | 24 | 4 | 53 | 1 | υCC (29) |
| 103 | – | – | 1656 | 1592 | 0 | 0 | 87 | 1 | υCC (19) + βHNH (16) |
| 102 | – | – | 1656 | 1592 | 0 | 0 | 87 | 1 | υCC (49) + βCCC(10) |
| 101 | – | 1582 | 1650 | 1585 | 420 | 71 | 356 | 4 | υOC (22) + υCC (20) |
| 100 | 1555 | 1583 | 1650 | 1585 | 420 | 71 | 356 | 4 | υCC (34) |
| 99 | – | 1572 | 1635 | 1572 | 1 | 0 | 16 | 0 | υCC (18) |
| 98 | 1572 | 1570 | 1634 | 1570 | 441 | 75 | 9548 | 100 | βHCC (48) + βCCC (12) |
| 97 | 1546 | 1545 | 1608 | 1545 | 45 | 8 | 58 | 1 | βHCC (49) |
| 96 | – | 1540 | 1605 | 1542 | 165 | 28 | 2199 | 23 | βHCC (63) |
| 95 | 1489 | 1488 | 1551 | 1490 | 11 | 2 | 282 | 3 | βHCH (84) |
| 94 | 1486 | – | 1547 | 1486 | 252 | 43 | 14 | 0 | υCC (10) + βHCC (28) |
| 93 | 1422 | – | 1535 | 1475 | 2 | 0 | 0 | 0 | υCC (43) + βHCC (28) |
| 92 | 1455 | – | 1518 | 1459 | 46 | 8 | 11 | 0 | υCC (43) + βHCC (13) |
| 91 | 1422 | 1421 | 1490 | 1431 | 6 | 1 | 2 | 0 | τHCOC (65) |
| 90 | – | – | 1472 | 1415 | 26 | 4 | 98 | 1 | βHCC (30) |
| 89 | 1383 | – | 1462 | 1405 | 57 | 10 | 307 | 3 | υCC (54) + βHNC(11) |
| 88 | 1345 | 1351 | 1411 | 1356 | 64 | 11 | 113 | 1 | υCC(13) + βHCC (30) |
| 87 | 1325 | – | 1380 | 1326 | 115 | 19 | 163 | 2 | υCC (22) + βHCC (61) |
| 86 | – | 1299 | 1374 | 1321 | 12 | 2 | 8 | 0 | υCC (33) + βHCC(10) |
| 85 | 1290 | 1300 | 1361 | 1308 | 1 | 0 | 246 | 3 | υCC (11) + βHCC (47) |
| 84 | – | – | 1360 | 1307 | 1 | 0 | 3 | 0 | βHCC (16) |
| 83 | – | – | 1359 | 1306 | 0 | 0 | 5 | 0 | υNC (17) + βHCC (23) |
| 82 | – | – | 1342 | 1289 | 132 | 22 | 50 | 1 | υNC (28) + βHCC (14) |
| 81 | 1274 | – | 1325 | 1273 | 67 | 11 | 124 | 1 | υCC (14) + υOC(43) |
| 80 | 1269 | – | 1325 | 1273 | 4 | 1 | 3 | 0 | βHCO (75) |
| 79 | – | 1250 | 1320 | 1268 | 217 | 37 | 8 | 0 | υCC(31) |
| 78 | 1242 | 1232 | 1282 | 1232 | 515 | 87 | 208 | 2 | υCC (28) |
| 77 | – | 1199 | 1247 | 1199 | 4 | 1 | 7 | 0 | υCC (11) + βHCC (36) |
| 76 | 1167 | 1194 | 1244 | 1195 | 260 | 44 | 163 | 2 | βHCC (51) |
| 75 | – | 1190 | 1240 | 1191 | 144 | 24 | 79 | 1 | βHCC(26) |
| 74 | – | 1173 | 1235 | 1187 | 31 | 5 | 370 | 4 | βHCC (29) |
| 73 | – | 1159 | 1205 | 1158 | 19 | 3 | 87 | 1 | βHCC (77) |
| 72 | – | 1157 | 1205 | 1158 | 52 | 9 | 98 | 1 | υCC (24) + βHCC (52) |
| 71 | – | 1148 | 1196 | 1149 | 591 | 100 | 488 | 5 | υCC (24) + βHCC (62) |
| 70 | 1132 | – | 1185 | 1139 | 0 | 0 | 4 | 0 | υCC (33) + βHCC(38) |
| 69 | 1103 | – | 1153 | 1108 | 50 | 8 | 18 | 0 | υCC (14) + βHNC (53) |
| 68 | 1094 | – | 1140 | 1096 | 10 | 2 | 21 | 0 | υCC(43) + βCCC(11) + βHCC(11) |
| 67 | – | 1073 | 1113 | 1070 | 3 | 1 | 0 | 0 | υCC (53) |
| 66 | 1024 | 1026 | 1077 | 1035 | 11 | 2 | 47 | 0 | υOC (57) |
| 65 | – | 1016 | 1052 | 1011 | 1 | 0 | 30 | 0 | τHCC(90) |
| 64 | – | – | 1044 | 1003 | 172 | 29 | 409 | 4 | υOC(12) + βCCC(53) + βCCO(10) |
| 63 | 988 | 997 | 1029 | 989 | 134 | 23 | 20 | 0 | βCCC (70) |
| 62 | – | – | 1024 | 984 | 26 | 4 | 4 | 0 | υCC (21) + βCCC(61) |
| 61 | – | – | 1023 | 983 | 17 | 3 | 6 | 0 | τHCOC(54) |
| 60 | 970 | – | 1019 | 979 | 54 | 9 | 115 | 1 | τHCCC(71) |
| 59 | – | – | 1016 | 977 | 9 | 2 | 75 | 1 | τHCCC(59) + τHCCN(21) |
| 58 | – | – | 1004 | 965 | 6 | 1 | 2 | 0 | τHCCC (45) + τHCCC(39) + τCCCC(10) |
| 57 | – | – | 1004 | 965 | 2 | 0 | 0 | 0 | tHCCC (34) + τCCCC(14) |
| 56 | 956 | 956 | 996 | 957 | 0 | 0 | 0 | 0 | τHCCC (54) + τCCCC(13) |
| 55 | – | – | 982 | 944 | 0 | 0 | 0 | 0 | τHCCC(58) + τCCCC(18) |
| 54 | – | – | 973 | 935 | 1 | 0 | 0 | 0 | τHCCC (76) |
| 53 | – | – | 952 | 915 | 0 | 0 | 1 | 0 | βCCC (24) |
| 52 | 910 | – | 947 | 910 | 1 | 0 | 0 | 0 | τHCC(57) + μOCCC(13) |
| 51 | – | – | 938 | 902 | 31 | 5 | 3 | 0 | βOCC (14) |
| 50 | – | 887 | 905 | 870 | 1 | 0 | 65 | 1 | τHCCC (99) |
| 49 | 846 | 845 | 880 | 846 | 0 | 0 | 12 | 0 | τHCCN (24) |
| 48 | – | – | 876 | 842 | 40 | 7 | 17 | 0 | βCCC(15) |
| 47 | – | – | 858 | 824 | 0 | 0 | 1 | 0 | τHCCC (46) + τHCCN(20) |
| 46 | 816 | – | 851 | 817 | 3 | 0 | 7 | 0 | βCCC(13) |
| 45 | 814 | 813 | 847 | 814 | 3 | 0 | 9 | 0 | τHCCC (57) + τHCCN(11) |
| 44 | 800 | – | 839 | 806 | 91 | 15 | 2 | 0 | τHCCC (74) |
| 43 | 794 | 790 | 826 | 794 | 2 | 0 | 50 | 1 | υCC (23) + βHCC (11) |
| 42 | 788 | 788 | 820 | 788 | 0 | 0 | 1 | 0 | τCCCC (11) + μOCCC(25) + μNCCC(10) |
| 41 | 782 | – | 816 | 785 | 26 | 4 | 1 | 0 | τHCCC (36) |
| 40 | 695 | – | 782 | 751 | 3 | 1 | 7 | 0 | τCCCC (47) + μCCOC(13) |
| 39 | 732 | – | 759 | 729 | 3 | 1 | 8 | 0 | τHCCC (33) + τCCCC(16) |
| 38 | – | – | 751 | 722 | 54 | 9 | 5 | 0 | τCCCC (13) + μ(31) + μNCCC(10) |
| 37 | 638 | 700 | 722 | 694 | 1 | 0 | 0 | 0 | βCCC (55) |
| 36 | 681 | – | 708 | 681 | 35 | 6 | 0 | 0 | βCCC (33) |
| 35 | 662 | – | 684 | 657 | 5 | 1 | 0 | 0 | βHCC (33) + βCCC (11) |
| 34 | – | 631 | 652 | 626 | 1 | 0 | 7 | 0 | βHCC (79) |
| 33 | 594 | 631 | 651 | 626 | 9 | 2 | 24 | 0 | βOCC (21) |
| 32 | – | – | 637 | 612 | 10 | 2 | 14 | 0 | βOCC (10) βCCC (41) |
| 31 | – | – | 634 | 609 | 0 | 0 | 5 | 0 | τCCCC (14) + τCCCO (13) + μCCOC(33) |
| 30 | – | – | 609 | 585 | 63 | 11 | 6 | 0 | μCCCC (18) |
| 29 | 539 | 520 | 547 | 526 | 14 | 2 | 30 | 0 | μNCCC (27) + μ CCCC (11) |
| 28 | 514 | – | 528 | 508 | 21 | 4 | 3 | 0 | βCCC (19) + μNCCC (11) |
| 27 | 500 | – | 527 | 506 | 2 | 0 | 8 | 0 | tHNCC (80) |
| 26 | 496 | 494 | 515 | 494 | 39 | 7 | 24 | 0 | tHCCC (20) + τCCCC (18) + τCCCO |
| 25 | 490 | 490 | 510 | 490 | 2 | 0 | 10 | 0 | βCCO(14) + βCCC(11) |
| 24 | 442 | 442 | 459 | 441 | 473 | 80 | 67 | 1 | τHCCC (14) + τCCCC(54) |
| 23 | 418 | 419 | 428 | 411 | 1 | 0 | 0 | 0 | τCCC (36) |
| 22 | 409 | 408 | 425 | 408 | 32 | 5 | 2 | 0 | τCCCC (25) |
| 21 | – | – | 418 | 402 | 2 | 0 | 1 | 0 | βNCC(43) |
| 20 | 388 | 389 | 415 | 399 | 3 | 0 | 2 | 0 | tCCCC (46) + μCCOC(10) |
| 19 | 390 | 390 | 414 | 398 | 5 | 1 | 5 | 0 | βCCC (29) + τHNCC(51) |
| 18 | 367 | 367 | 382 | 367 | 1 | 0 | 4 | 0 | βCCC (37) + τHNCC(38) |
| 17 | 364 | 365 | 379 | 364 | 0 | 0 | 1 | 0 | τCCCC(40) + μCCCC(17) |
| 16 | 335 | 336 | 349 | 335 | 9 | 2 | 0 | 0 | τCCCC (31) + μCCCC(13) |
| 15 | 335 | 334 | 348 | 335 | 6 | 1 | 0 | 0 | βOCC (12) + τ CCCC (12) |
| 14 | – | 298 | 293 | 282 | 4 | 1 | 7 | 0 | βCCC (24) + βCOC(11) |
| 13 | – | 283 | 288 | 277 | 9 | 2 | 4 | 0 | τCCCO (33) + τCCCC(14) |
| 12 | – | 250 | 270 | 259 | 0 | 0 | 3 | 0 | βCCC (28) |
| 11 | – | 223 | 210 | 202 | 0 | 0 | 3 | 0 | τCCCC (47) |
| 10 | – | 197 | 207 | 199 | 0 | 0 | 1 | 0 | βCOC (12) + μ CCCC (10) |
| 9 | – | 97 | 103 | 99 | 3 | 0 | 1 | 0 | τCCOC (57) + τCCCC(10) |
| 8 | – | 87 | 91 | 87 | 1 | 0 | 0 | 0 | τCCCC (57) + μCCCC (11) |
| 7 | – | 64 | 67 | 64 | 0 | 0 | 1 | 0 | τCCOC (14) + τCCCC(33) + τCOCC(22) |
| 6 | – | 60 | 64 | 61 | 0 | 0 | 0 | 0 | βCOC (13) + βCCC(22) + βOCC(20) + μCCCC(21) |
| 5 | – | 27 | 29 | 28 | 1 | 0 | 3 | 0 | βCCC (12) + τCCCC(22) + τCOCC(17) |
| 4 | – | _ | 27 | 26 | 1 | 0 | 4 | 0 | βCCC (11) + τCOCC (22) + τOCCC(11) |
| 3 | – | _ | 25 | 24 | 1 | 0 | 5 | 0 | τCCCC (35) + τOCCC (50) |
| 2 | – | _ | 15 | 15 | 0 | 0 | 6 | 0 | τCCCC (21) + τCCOC (11) + τCOCC 13) + τOCCC(25) |
| 1 | – | _ | 13 | 13 | 0 | 0 | 4 | 0 | τCCCC(67) |
* Scaling factor 0.958 for B3LYP/6-311++G(d,p), υ-stretching, β-in plane bending, μ -out plane bending, τ- torsion.
** Normalized to 100.
4.2.1. N–H vibrations
Aromatic amines absorbs in the range 3500–3000 cm−1. A strong vibrational N–H stretching band appears in the range 3390 ± 60 cm−1 [13]. Amino group frequencies for N–H stretching appear near 3500–3300 cm−1 and the frequencies near 1700–1600 cm−1 for scissoring and 1150–900 cm−1 for rocking deformations [14]. In the present work the elevation of the spectral lines of N–H stretching due to the hydrogen bond, is the indication of N–H bond dependency towards protonation. The excellent agreement between the experimental and scaled frequency with broad bands and 100% of PED contribution at 3558 and 3450 cm−1 for the title compound shows that it is a complete stretching mode. The title compound also shows bending vibrations in 1619 /1595 cm−1 in FT-IR and in 1604/1592 cm−1 theoretically.
4.2.2. C–H vibrations
The nature of C–H vibrations are highly polarized and they tend to appear in highly strong Raman intensive regions they are also found in the range of 3100–3000 cm−1 for most of the heterocyclic amines [15]. In APBPP C-H stretching are observed at 3080 cm−1 in FT-Raman and FT-IR spectrum. The peak representing the C–H stretching band is observed in the region 3098 to 2903 cm-1for APBPP by theoretical method with high PED contributes to a pure stretching band. Unlike other amine derivatives the C–H in plane bending and out of plane bending are depicted around 1300–1000 cm−1 and 800–710 cm−1 respectively. In the present case the bending vibrations show fairly good agreement with literature survey and experimental results and are seen in 1489 cm -1 (FT-IR) and 1488 cm−1.
4.2.3. C–O vibrations
C–O Vibrations occurs in the range of 1870–1540 cm−1 based on the physical and electronic environment with hydrogen bonds [16]. In the present study C-O vibrations are foundat 1646/1035 cm−1 theoretically with PED value 48% and at 1625/1026 cm-1 in FT-Raman, 1024 cm−1 in FT-IR with PED value 57% respectively. The bending O–C–C vibrations of APBPP has been noticed at 594, 335 cm−1 for FT -IR and 631, 334 cm-1 for FT -Raman with its theoretical wave number of 626, 335 cm−1. Further the present case exhibits C-O-C bending mode at 298, 197 cm−1 for FT-Raman with its B3LYP wave number as 282,199 cm-1. The above results of experimental and B3LYP are in line with literature survey. The PED contributions are tabulated in Table 2
4.2.4. C-C and C–C–C–C vibrations
The influence of C–C Vibrations on aromatic rings are in the range from 1650−1400 cm−1. The C-C ring stretching frequency for heterocyclic alkenes are expected to lie in the range of 1300–800 cm−1 [17]. APBPP molecule exhibits C–C stretching of various intensities at 1585, 1572, 1268, 1232, 1070, 984 cm−1 by theoretical method. Experimental values of FT-Raman lie in the range of 1583, 1572, 1351, 1250, 1232, 1073 cm−1 for APBPP. IR bands were observed at 1555, 1345, 1242, 1094 cm−1. From the results it is well noted that the scaled and experimental values lie in the same line with a maximum PED contribution of C-C stretching is 53%. Bending vibrations were also seen in APBPP molecule.
C–C–C modes for the presentcompound in FT-IR has been predicted at 1094, 988, 816, 638, 681, 662, 514, 490, 390 cm-1 and the prominent FT-Raman vibrations are ascribed at 997,700, 490, 390, 250 cm−1 with its corresponding theoretical values of 1096, 989, 817, 694, 681,657, 508, 490, 398, 282, 259 cm−1. The usage of appropriate scaling factor maintains a good agreement between the B3LYP values and the experimental wave numbers along with PED and is presented in the Table 2.
4.2.5. Torsion and other vibrations
In APBPP Chalcone, out vibrations with moderate PED values are also produced. In the title Chalcone the H-C–C torsion vibrations are estimated at 1016, 1011 cm−1 in FT-Raman spectrum and based on normal co-ordinates calculation method the theoretical values were noted at 1011, 870 cm−1 with a high PED contributions of 90%, 99% respectively. C–C-C torsion vibrations were assigned at 418/419/411 cm-1in FT-IR/FT-Raman/theoretical spectrum with 36% PED. H-C–C–C torsion wave numbers is found in the region 970, 956, 814, 800, 782, 732, 496 cm−1 at FT- IR spectra and 956, 813, 494 cm−1 at FT-Raman and its equivalent B3LYP values is 979, 957, 814, 806, 785, 729, 494 cm−1 along with its PED values as listed in the Table 2. Torsion vibrations for H-C–C-N and H-N-C–C appears in the region of 846, 500 cm−1 at FT-IR spectra and 845 cm−1 at FT-Raman spectra and 846,506 cm−1 for B3LYP with 24%,80% PED contributions respectively. The assigned out vibrations of APBPP O-C–C–C atoms are listed at 910, 788, 695 cm-1in FT-IR and 947, 788 cm−1 in FT-Raman with its theoretical predictions at 910, 788, 751 cm−1 andlow PED values. Mixed vibrations of C-C–C–C (torsion + out) were also found in the title molecule. The above experimental results and B3LYP values of APBPP are in good compliance.
4.3. Thermodynamical properties
In thermodynamics partition function plays a key role in interlinking Quantum Thoery and spectroscopy. The investigations on thermal nature of a compound plays a vital role in designing of functional materials under the conditions of high pressure and temperature. Using Thermo.pl software [18] and B3LYP/6-311++G(d,p) level the thermodynamical functions such as entropy (S), enthalpy (dH) and heat capacity (Cp) for the title compound was found to be increasing with increase in temperature from 100 K to 1000 K. Fig. 3 shows that the title compound has more stability and storage capacity and also an accreditation to the enhancement of spectroscopic vibrational intensities. The correlation equations of temperatures verses entropy, enthalpy and heat capacity are studied and the fitting factors (R2) were found to be.
Fig. 3.
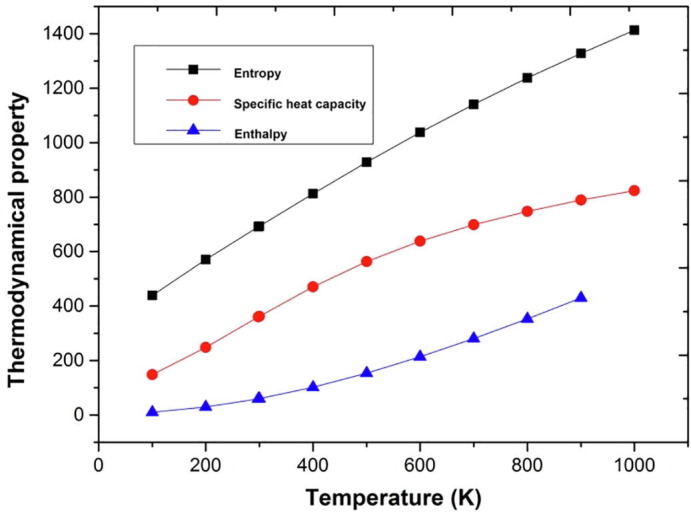
Graphs representing the effect of temperature on entropy, specific heat capacity and enthalpy.
S = 301.79479 + 1.39375 T-2.81681 × 10⁻⁴ T2(R2 = 0.99998)
Cp = 1.87833 + 1.39845–5.7889 × 10⁻⁴ T2 (R2 = 0.99865)
H = −9.87912 + 0.11799 + 4.1737681 × 10⁻⁴ T2 (R2 = 0.99946).
According to the second law of thermodynamics [19] the above inferences are used to evaluate the thermodynamic energies and proximate directions of thermo chemical reactions with thermodynamic parameters.
4.4. MEP (Molecular Electrostatic Potential)
Molecular Electrostatic Potential (MEP) is a three dimensional visual methodology in analysing the charge distributions at the surface and around the molecule. It is an excellent descriptor to study molecular structure, electrophilic and nucleophilic reactive sites, nature of hydrogen bond interactions and also about the interaction of the molecule with neighbour [20]. The various colours ranging from −6.19 × 10⁻²eV to 6.19 × 10⁻²eV indicates the distinct electrostatic potentials; red indicates the most negative electrophilic regions of the electrostatic potential, white and blue indicates the most positive nucleophilic regions of the electrostatic potential. Green indicates neutral potential. In the present study as seen in Fig. 4 negative regions shows strong attraction over O and N atoms. The positive regions shows repulsion over H atoms. These analysis predicts that APBPP could be biologically active.
Fig. 4.

Molecular Electrostatic Potential (MEP) of APBPP using Gauss View.
4.5. Frontier molecular orbital
The opto-electronic parameters of the structure of the title compound were obtained using Frontier theory at the B3LYP/6-31++G(d,p) basis set. Frontier Molecular Orbital's (FMOs) such as highest occupied molecular orbital (HOMO) and lowest unoccupied molecular orbital (LUMO) is used to draw useful information on the optoelectronic properties of various organic molecules [21]. The electron donors will be present in HOMO and the innermost orbital unoccupied by the electrons performs as the electron acceptor. EHOMO has the electron-donating capability of the molecule. The greater the HOMO energy the more will be the electron donating capability. The energy gap between the HOMO, and LUMO orbital's indicates the reactivity and stable structure of APBPP. Therefore, the FMOs including HOMO−1, HOMO, LUMO and LUMO + 1 are obtained from the optimized geometry and are shown in Fig. 5 . HOMO and LUMO predominantly occupy the central benzylidene and p-amino benzylic moieties leaving the benzyloxymoiety. However, it is interesting to look into the LUMO + 1 of the molecule where benzyloxy unit contributes a lot towards the stabilization of LUMO + 1. The parameters obtained using quantum chemical calculations for the title compound APBPP at B3LYP/6-31++G(d,p) are tabulated in Table 3 . From the FMO study, it is evident that the compound exhibits good transfer of charge within the molecule and from the values of electron affinity we understand the electro nuclear attraction of APBPP. Low softness value reveals that the title compound is less toxic and high electrophilicity index highlights the biological activity of the compound [22].
Fig. 5.
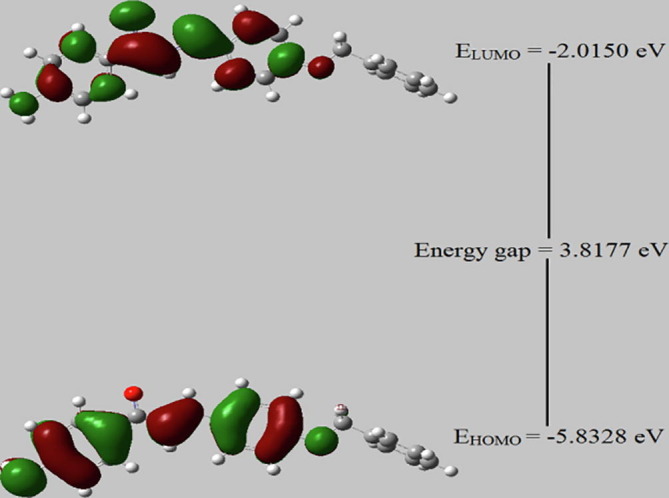
Frontier Molecular Orbital for APBPP.
Table 3.
Calculated energy values of APBPP using B3LYP/6-311++G(d,p).
| Parameter | Value |
|---|---|
| EHOMO (eV) | −5.8328 |
| ELUMO (eV) | −2.879 |
| Ionization Potential | 5.8328 |
| Electron Affinity | 2.879 |
| Energy gap(eV) | 3.8178 |
| Electronegativity | 3.9234 |
| Chemical Potential | −3.9234 |
| Chemical Hardness | 1.9089 |
| Chemical Softness | 0.2619 |
| Electrophilcity Index | 4.0323 |
4.5.1. UV–visible spectral analysis
Theoretical UV–visible spectrum of the title molecule is shown in Fig. 6 . From the graph, it is observed that the electron absorption corresponds to transition to the first excited state from the ground state [23]. It explains the electronic excitation from the highest occupied molecular orbital (HOMO) to the lowest (LUMO) with 96% contribution and is referred to as π to π* transition. The calculated electronic transition energies, absorption wavelength and oscillator strength were calculated by the TD-DFT method with 6-311++G(d,p) basis set. All the calculations were done assuming the title compound was in liquid phase with ethanol as solvent. The calculated results of UV–Visible spectral data were listed in Table 4 . The band gap energy calculated from TD-DFT method is 3.73 eV and is comparable with many other bioactive compounds [24].
Fig. 6.
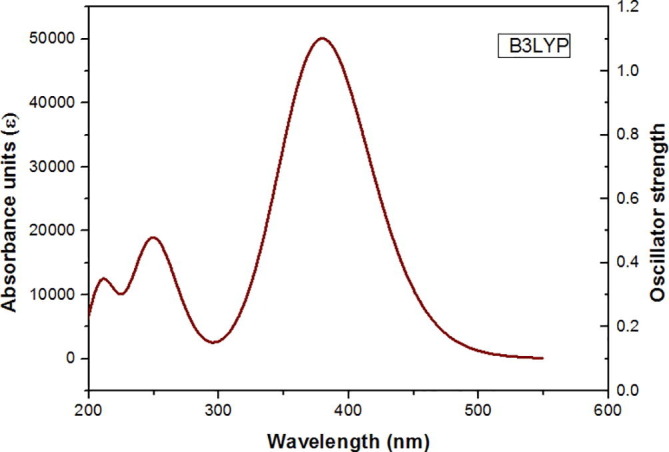
UV spectrum of APBPP.
Table 4.
Calculated absorption Maxima , Electronic Transition Energies (ΔE, eV), and Oscillator Strength (f) of Cross Linked Polymer in Ethanol Solvent Calculated Using TD-DFT Method.
| λmax(nm) | eV | f0 | Assignment |
|---|---|---|---|
| 380.23 | 3.6441 | 0.1641 | HOMO-1 → LUMO (96%) |
| 252.04 | 4.7314 | 0.1335 | HOMO → LUMO + 1 (68%) |
4.6. NMR analysis
The Nuclear Magnetic Resonance spectrum is used in the analysis of structure of organic compounds. The chemical shift analysis of title compound is presented in Table 5 . It is one of the frequently used tools to identify the reactive organic species. The theoretical carbon (13C) and proton (1H) NMR chemical shifts are calculated using the B3LYP/6-311++G(2d,p) GIAO method [25] with ethanol as a solvent and is shown in Fig. 7 . Gauge Invariant Atomic Orbital method is one of the most important techniques to calculate isotropic nuclear magnetic shielding tensors [24]. The chemical shifts are tabulated relative to the internal standard reference TMS, δppm = 0 ppm. Usually, for an organic molecule, the chemical shift range is above 100 [26]. Mostly highly shielded atoms are found near downfield and vice versa. The chemical shift values of protons on carbon belonging to a methyl group was expected to be in the range 2–5 ppm [26]. The observed theoretical chemical shift of 1H is from 3.81 − 9.92 ppm and are in line with the reported values. The signals at 5.55 and 5.96 ppm are due to the amino group in the title compound.
Table 5.
Theoretical chemical shifts of 1H and 13C NMR.
| Atoms | Chemical shifts | Atoms | Chemical shifts |
|---|---|---|---|
| 26-H | 9.926 | 1-C | 165.611 |
| 42-H | 9.702 | 8-C | 150.145 |
| 31-H | 9.470 | 22-C | 142.741 |
| 39-H | 9.047 | 3-C | 132.732 |
| 27-H | 8.677 | 13-C | 129.894 |
| 29-H | 8.637 | 19-C | 126.580 |
| 38-H | 8.541 | 24-C | 124.101 |
| 35-H | 8.429 | 6-C | 122.113 |
| 28-H | 8.369 | 5-C | 121.059 |
| 34-H | 8.353 | 18-C | 120.523 |
| 36-H | 8.335 | 21-C | 120.477 |
| 40-H | 8.304 | 14-C | 120.154 |
| 41-H | 8.284 | 16-C | 119.708 |
| 30-H | 7.946 | 23-C | 110.159 |
| 32-H | 5.963 | 10-C | 117.599 |
| 33-H | 5.557 | 2-C | 110.159 |
| 44-H | 4.999 | 7-C | 106.637 |
| 43-H | 4.932 | 12-C | 66.705 |
Fig. 7.

NMR spectrum of 13C and 1H.
The carbon attached to the oxygen will have a maximum chemical shift and is found at 165.61 ppm in the title compound. The carbons of the Phenyl ring lies in the range 120.15–150.14 ppm and the range from 106.83−119.93is due to C C environment for the title compound. The singlet at 66.70 ppm corresponds to the carbon present in the CH2 group because it has a more electronegative atom attached.
4.7. Charge distribution analysis
The analysis on the natural atomic charge distribution on the title molecule using Mullikan Population Analysis (MPA) plays a vital role in the complete understanding of the atomic environment of the molecule like chemical and ionization potential and further to analyze the influence individual charge on every atom present in the title molecule, the electronic structure, polarizability, dipole moment and various other molecular characteristics of the system [27]. The bar graph depicts the corresponding charge distribution in Fig. 8 . From the graph it is evident that all hydrogen atoms show positive charge. The highest positive charge is due to (C19) than all other atoms in the compound may be due to negatively charged (N25) and (C20) atoms. Similarly the highest negative charge is due to (C24). Least positive charge is shared by (H26 and C18) which may be due to the methyl group of APBPP. Additionally the presence of negatively charged (O4,O11) atom act as donor and the transfer of charge takes place from the two oxygen atoms to the neighbouring sites of carbon atoms.
Fig. 8.
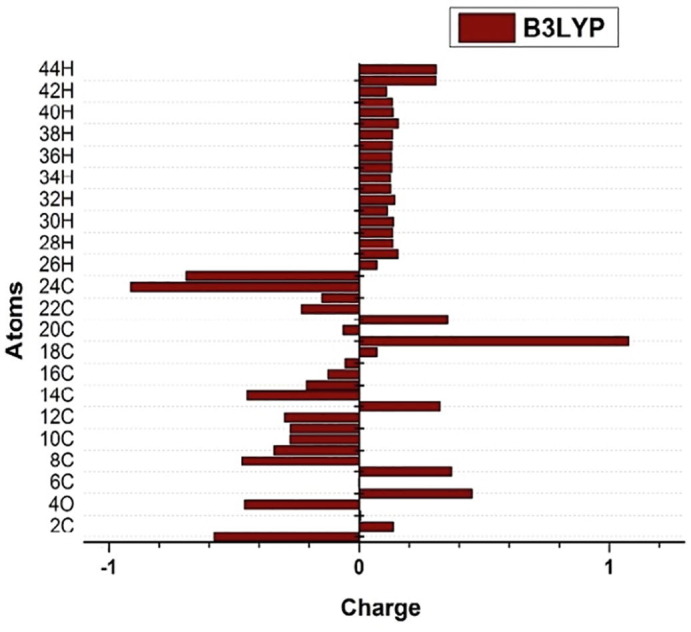
Bar Graph of Mulliken Charge distribution.
One of the most extensively used DFT descriptor to understand the chemical reactivity of a chemical system is Fukui functions. This plays a vital role in interpreting the most prone atom to undergo an electron density based electrophilic or nucleophilic attack. According to Parr and Yang [28] Fukui functions can also be defined as
f r - = q r (N)-q r (N-1)
f r + = q r (N + 1)-qr (N)
f r 0 = 1/2 [q r (N + 1)-q r (N −1)]
The signs −, +, 0 show electrophilic, nucleophilic and radial attack in that order. where q r is the charge of an atom (from Mullikan Charges)in the rthsite and N (neutral), N-1 (cationic), N + 1 (anionic) within the system. The differentiation of an atom as electrophile or nucleophile for selected atoms is tabulated in the Table [6]. In the title molecule the nucleophilic sites are 2C,7C,11O,17C,21C,30H,43H,44H and the electrophilic sites are 1C,4O,10C,14C,18C,22C,25 N,31H,42H. From the results it is observed that APBPP shows change in density against electron alteration in the preferred regions and exhibits chemical reactivity [29] Table 6 .
Table 6.
Mulliken Charges , Fukui Functions and Local softness for APBPP.
| Atoms | Mulliken atomic charges |
Fukui Functions |
Local Softness |
|||||||
|---|---|---|---|---|---|---|---|---|---|---|
| (N) | (N-1) | (N + 1) | fr + | fr - | fr 0 | sr + fr+ | sr-fr- | sr0 fr0 | ||
| 1C | 0.256 | −0.235 | −0.267 | −0.523 | 0.491 | −0.016 | −1.014 | −0.141 | 0.129 | −0.004 |
| 2C | −0.194 | 0.241 | 0.058 | 0.252 | −0.435 | −0.092 | 0.687 | 0.068 | −0.114 | −0.024 |
| 4O | −0.346 | −0.419 | −0.571 | −0.225 | 0.073 | −0.076 | −0.298 | −0.060 | 0.019 | −0.020 |
| 7C | −0.137 | 0.442 | 0.386 | 0.523 | −0.579 | −0.028 | 1.102 | 0.141 | −0.152 | −0.007 |
| 10C | −0.049 | −0.579 | −0.576 | −0.527 | 0.53 | 0.001 | −1.057 | −0.142 | 0.139 | 0.000 |
| 11O | −0.344 | −0.209 | −0.297 | 0.047 | −0.135 | −0.044 | 0.182 | 0.013 | −0.035 | −0.012 |
| 14C | −0.053 | −0.335 | −0.302 | −0.249 | 0.282 | 0.017 | −0.531 | −0.067 | 0.074 | 0.004 |
| 17C | −0.092 | 0.034 | 0.001 | 0.093 | −0.126 | −0.016 | 0.219 | 0.025 | −0.033 | −0.004 |
| 18C | −0.058 | −0.44 | −0.431 | −0.373 | 0.382 | 0.004 | −0.755 | −0.100 | 0.100 | 0.001 |
| 21C | −0.08 | 0.197 | 0.157 | 0.237 | −0.277 | −0.020 | 0.514 | 0.064 | −0.073 | −0.005 |
| 22C | 0.132 | −0.162 | −0.119 | −0.251 | 0.294 | 0.022 | −0.545 | −0.067 | 0.077 | 0.006 |
| 25 N | −0.471 | −0.419 | −0.559 | −0.088 | −0.052 | −0.070 | −0.036 | −0.024 | −0.014 | −0.018 |
| 30H | 0.105 | 0.188 | 0.126 | 0.021 | −0.083 | −0.031 | 0.104 | 0.006 | −0.022 | −0.008 |
| 31H | 0.088 | 0.089 | 0.068 | −0.020 | −0.001 | −0.010 | −0.019 | −0.005 | 0.000 | −0.003 |
| 42H | 0.086 | 0.061 | 0.049 | −0.037 | 0.025 | −0.006 | −0.062 | −0.010 | 0.007 | −0.002 |
| 43H | 0.212 | 0.329 | 0.277 | 0.065 | −0.117 | −0.026 | 0.182 | 0.017 | −0.031 | −0.007 |
| 44H | 0.213 | 0.342 | 0.291 | 0.078 | −0.129 | −0.026 | 0.207 | 0.021 | −0.034 | −0.007 |
4.8. Molecular docking procedure
Molecular docking studies is a search algorithm for the best orientation of the small molecules known as ligand which perfectly fits in to the target protein's cavity and therefore plays a vital role in drug design and therapy. It is also used to analyze the affinity and binding orientation of the molecule with the target. In this present study a graphical tool known as Auto Dock suite 1.5.6 (ADT) is used to predict how the ligand bind with a receptor in 3D.
4.8.1. Protein setup
The crystal structures of (PDB ID: 2W2G) [30], (PDB ID: 6LU7) [31], and (PDB ID: 1M17) [32] were obtained from the RCSB Protein Data Bank [34]. All the water, non-interacting ions and the co-crystallized inhibitors were removed. AutoDockTools (Version 1.5.6) was used to prepare the proteins for molecular docking. Polar hydrogens were added, Gasteiger charges and Kollman charges were calculated to examine its minimum binding energy and the generated PDBQT files were saved. Centers were constructed using grid box parameters in AutoDockTools.
4.8.2. Ligand setup
The 3D structure of APBPP was prepared by Chemdraw Pro12.0 software. [Chemical Structure Drawing Standard: Cambridge Soft Corporation, USA (2010)]. The title compound was selected as ligand and the docking studies were done to the proteins and a comparative study has been done for the title compound against the standard drug used for antiviral (SARS-CoV-1,2) and NSCLC lung cancer treatment. The structures of the two FDA-approved protease drugs (ritonavir, and erlotinib) were obtained from the Drug bank database RCSB [33]. All the ligand structures were optimized using PASS an online tool [34] and converted to PDB format using Open Babel software. Auto Dock tools were used to dock, the ligand into the active sites. The title compound acting as a ligand was computed with partial charges by the Geistenger method. The ligand was added with torsion information depending on which torsions need to be rotated during docking and was saved as PDBQT format.
4.8.3. Docking against antiviral and anticancer proteins
The docking parameters namely binding energy (kcal/mol), inhibition constant (μm), and intermolecular energy (kcal/mol) of the APBPP molecule with respect to the target proteins are compared with the standard drug and is tabulated in Table 7 . The best-docked conformation was analyzed by the minimum binding energy of APBPP molecule with different residues of the proteins of antiviral (2W2G-SARS, 6LU7- COVID-19) and anticancer (1M17-LUNG CANCER) against the standard drug ritonavir [2], [36] and erlotinib [35] are presented in Fig. 9 . The chalcone fits tightly into the inhibition site of the 6LU7 COVID-19 protein [31] forming four hydrogen bonds (H-bonds) with residues GLU16, ALA2, and VAL3, LEU4, and also in 1M17 NSCLC protein, four hydrogen bonds were formed (GLY772, THR766, LEU764, ALA719). Interestingly APBPP is found to be a stronger inhibitor of COVID-19 than ritonavir as it exhibits a larger negative binding energy and better inhibition constant than ritonavir, which is an inhibitor drug that is in the clinical trials for COVID-19 [2]. APBPP is better than a standard drug-like erlotinib used for lung cancer. Though APBPP forms four hydrogen bonds and is comparable with erlotinib it shows higher binding energy and inhibition constant than erlotinib.The benzyloxy oxygen, the carbonyl oxygen, and the nitrogen of the amino group act as H-bond acceptors for the active-site residues. From the binding structures, it is noted that atoms O2, O4, O11 and H22, H36, H43, H44, N25 were undergoing hydrogen bonds with the protein residues in the title compound. The least value of the inhibition constant gives the minimum value for binding energy which indicates the increase in biological activity and hence lower dosage of the drug for clinical trials [37].The binding energies of the present work is compared with that of standard drugs [38], [39], and the amino acid residues such as MET165 and VAL2 are also observed in APBPP as in the literature. These results highlight that a stable complex is formed from the docked ligand with the target proteins and hence makes the title compound to be a suitable drug for various acute respiratory syndrome specially SARS-CoV-2 virus and lung cancer treatment. Further experimental analysis is required to validate this point.
Table 7.
Docking Parameters of APBPP.
| Protien PDB | Bonded Residues | Hydrogenbonds | Bond length (Å) | Binding enegy (Kcal/mol) | Inhibition constant(ki) |
|---|---|---|---|---|---|
| 2W2G-SARS-CoV-1 (APBPP) | LYS505 CYS39 |
2 | 1.79 2.16 |
−4.79 | 309.30 μmol |
| 2W2G-Ritonavir | GLU 52 ARG 628 |
2 | 2.53 1.84 |
−4.38 | 1.38 μmol |
| 6LU7 -Covid19 (APBPP) | GLU16 ALA2 VAL3 LEU4 |
4 | 1.98 2.59 1.84 1.96 |
−9.47 | 632.98 nmol |
| 1M17-Lung cancer (APBPP) | THR766 ALA719 LEU764 GLY772 |
4 | 2.68 2.33 2.49 2.93 |
−8.53 | 3.32 mmol |
| 1 M17-Erlotinib | LEU654 GLY678 GLY684 THR759 |
4 | 2.53 2.82 2.87 2.71 |
−7.11 | 2.67 mmol |
Fig. 9.

Docking conformations of APBPP (ligand) a) 2W2G,6LU7, Erlotinib,1M17,Ritonavir.
5. Conclusion
In the present study a proper vibrational assignments for a novel (2E)-1-(4-aminophenyl)-3-(4-benzyloxyphenyl)-prop-2-en-1-one Chalcone derivative has been reported from FT-IR and FT-Raman, UV and NMR spectral analysis. A comparative study on experimental and theoretical investigations on the optimized structure was found to be in good agreement for the title molecule. The significant variation in HOMO -LUMO energies supports polarization within the molecule and further the high electrophilicity index and least value of softness confirms the that APBPP is biologically active. MEP and Fukui calculations reveals the positive and negative sites within the molecule. Thermodynamical properties for APBPP Chalcone and its correlation for various temperatures are reported and can be used for further research on the title compound in the context of its thermodynamic properties and also to estimate the direction of chemical reaction. Molecular docking for the title molecule on three different proteins related to respiratory syndrome was done and compared with standard drug using Auto Dock suite software. These results show that title Chalcone can be used as an effective respiratory drug in pharmaceutical industry due to its optimistic blend with anticancer and antiviral SARS -CORONA proteins and economical to synthesize. This is a unique observation on APBPP as a potential drug. Hence the title compound paves its way for the clinical chemists to proceed further research in chalcone drug design.
Declaration of Competing Interest
The authors declare that they have no known competing financial interests or personal relationships that could have appeared to influence the work reported in this paper.
Acknowledgements
The author acknowledges SAIF,IIT-M towards instrumentation facilities. The author also acknowledges Dr.D.Reuben Jonathan, Department of Chemistry, Madras Christian College, Chennai - 600 059, India. and Fathima Rizwana B, Department of Physics, Research Scholar, Madras Christian College, Chennai - 600 059, India.
References
- 1.Sanche S., Lin Y.T., Xu C., Romero-Severson E., Hengartner N., Ke R. Emerg. Infect. Dis. 2020 doi: 10.3201/eid2607.200282. [DOI] [PMC free article] [PubMed] [Google Scholar]
- 2.Cao B., Wang Y., Wen D., Liu W., et al. N. Engl. J. Med. 2020;382:1787–1799. doi: 10.1056/NEJMoa2001282. [DOI] [PMC free article] [PubMed] [Google Scholar]
- 3.De Vincenzo R., Seambla G., Panici P., Benedess, Remelletti F.O. AnticancerDrug Des. 1995;10(6):481–490. [Google Scholar]
- 4.Bowden K., Dal P.A., Shah C.K. J. Chem. Res. Synop. 1990;12:2801. [Google Scholar]
- 5.Gaurav V.M., Ingle D.B. Indian J. Chem. 1986;25B(8):868. [Google Scholar]
- 6.Mishra S.S., Kushwaha S.C. J. Indian Chem. Soc. 1977;64:640. [Google Scholar]
- 7.Katsori, Anna-Maria, and Dimitra Hadjipavlou-Litina, Recent progress in therapeuticapplications of chalcones 10(2011) : 575-1596. [DOI] [PubMed]
- 8.Shyamala D., Rathikha R., Gomathi K. International J Pure and Applied Physics. 2016;12:35. [Google Scholar]
- 9.Jamroz M.H. Warasaw; Poland: 2004. Vibrational Energy Distribution Analysis. VEDA 4 program. [Google Scholar]
- 10.Frisch M.J., Trucks G.W., Schlegel H.B., Scuseria G.E., Robb M.A., Cheeseman J.R., Scalmani G., Barone V., Mennucci B., Petersson G.A., Nakatsuji H., Caricato M., Li X., Hratchian H.P., Izmaylov A.F., Bloino J., Zheng G., Sonnenberg J.L., Hada M., Ehara M., Toyota K., Fukuda R., Hasegawa J., Ishida M., Nakajima T., Honda Y., Kitao O., Nakai H., Vreven T., Montgomery J.A., Jr., Peralta J.E., Ogliaro F., Bearpark M., Heyd J.J., Brothers E., Kudin K.N., Staroverov V.N., Kobayashi R., Normand J., Raghavachari K., Rendell A., Burant J.C., Iyengar S.S., Tomasi J., Cossi M., Rega N., Millam J.M., Klene M., Knox J.E., Cross J.B., Bakken V., Adamo C., Jaramillo J., Gomperts R., Stratmann R.E., Yazyev O., Austin A.J., Cammi R., Pomelli C., Ochterski J.W., Martin R.L., Morokuma K., Zakrzewski V.G., Voth G.A., Salvador P., Dannenberg J.J., Dapprich S., Daniels A.D., Farkas Ö., Foresman J.B., Ortiz J.V., Cioslowski J., Fox D.J. Gaussian Inc; Wallingford CT: 2009. Gaussian 09. [Google Scholar]
- 11.Morris, G.M. Goodsell, D.S. Halliday, R.S. Huey, R. Hart, W.E. Belew, R.K. Olson, A.J. Automated Docking Using aLamarkian Genetic Algorithm and Empirical Binding Free Energy Function, J. Comput. Chem. 19 (1998) 1639-1662.N
- 12.HannahClara T., Prasana J., Reuben Jonathan D., Revathi B., Usha G. IUCrData. 2016;1 [Google Scholar]
- 13.B.Fathima Rizwana , Johanan Christian Prasanaa, S. Muthub, Christina Susan Abraham Computational biology and chem.,78(2019) 9-17. [DOI] [PubMed]
- 14.G.Socrates, Infrared and Raman characteristics Group frequencies , Tables and charts,third ed.,Chichester, 2001
- 15.S. Gunasekaran, R. Thilak Kumar,S. Ponnuswamy, Spectrochemica Acta A 65(2006) 1041 [DOI] [PubMed]
- 16.Karabacak Mehmet, Bilgili Sibel, Atac Ahmet. Spectrochimica Acta Part A. 2015;134:598. doi: 10.1016/j.saa.2014.07.027. [DOI] [PubMed] [Google Scholar]
- 17.Surisseau C., Marvell P. J. Raman Spectroscopy. 1994;25:447. [Google Scholar]
- 18.Irikura K.K., Thermo P.L. National Institute of Standards and Technology. 2002 [Google Scholar]
- 19.Ayers P.W., Parr R.G. J. Am. Chem. Soc. 2000;122:2010. [Google Scholar]
- 20.Sebastien S., Sundaraganesan N. Spectrochimica Acta. 2010;A75:941. doi: 10.1016/j.saa.2009.11.030. [DOI] [PubMed] [Google Scholar]
- 21.Fleming I. John Wiley and Sons; 1976. Frontier Orbitals and Oraganic chemical Reactions. [Google Scholar]
- 22.R. Parthasarathi, J. Padmanaban, M. Elango, V. Subramanian, P.K. Chattaraj, Chemical physics letters, 394 (2004) 225-23
- 23.Rajamani T., Muthu S., Karabacak M. Spectrochim. ActaA. 2013;108:186–196. doi: 10.1016/j.saa.2013.01.090. [DOI] [PubMed] [Google Scholar]
- 24.Muthu S., Rajamani T., Karabacak M., Asiri A.M. Spectrochim. Acta Part A. 2014;122:1–14. doi: 10.1016/j.saa.2013.10.115. [DOI] [PubMed] [Google Scholar]
- 25.Muthu S., Ramachandran G. Spectrochim. Acta Part A. 2012;93:214–222. doi: 10.1016/j.saa.2012.02.107. [DOI] [PubMed] [Google Scholar]
- 26.Socrates G. John Wiley Interscience; New York: 1980. Infrared Characteristic Group Frequencies. [Google Scholar]
- 27.Parr Yang R.G. Oxford University Press; NewYork: 1989. Functional Theory of atoms and molecules. [Google Scholar]
- 28.Parr R.G., Yang W.J. Am. Chem. Soc. 1984;106:4049–4050. [Google Scholar]
- 29.S. Renuga, M. Karthikesan, S. Muhu, SpectrochemicaActa A127(2014) 439e453. [DOI] [PubMed]
- 30.Tan, J., Vonrhein, C., Smart, O.S., Bricogne, G., Bollati, M., Kusov, Y., Hansen, G., Mesters, J.R.,Schmidt., C.L.,Hilgenfeld PLOSpathogens 5,(2009) 5. [DOI] [PMC free article] [PubMed]
- 31.Jin, Zhenming, Xiaoyu Du, Yechun Xu, Yongqiang Deng, Meiqin Liu, Yao Zhao, Bing Zhang et al. Nature (2020): 1-5.
- 32.Stamos Jennifer, Sliwkowski Mark X., Eigenbrot Charles. J. of Biological Chemistry. 2002;277(48):46265–46272. doi: 10.1074/jbc.M207135200. [DOI] [PubMed] [Google Scholar]
- 33.www.rscb.org
- 34.Lagunin A., Stepanchikora A., Fillimonor D., Porolkor V. PASS: Bioinformatics. 2000;16:747–748. doi: 10.1093/bioinformatics/16.8.747. [DOI] [PubMed] [Google Scholar]
- 35.Pal A.S., Bains M., Agredo A., Kasinski A.L. Biochem. Pharmacol. 2020 doi: 10.1016/j.bcp.2020.114154. [DOI] [PMC free article] [PubMed] [Google Scholar]
- 36.Zhu, Zhen, Zhaohui Lu, Tianmin Xu, Cong Chen, Gang Yang, Tao Zha, and Yuan Xue. J. of Infection (2020) [DOI] [PMC free article] [PubMed]
- 37.Thamarai A., Vadamalar R., Raja M., Muthu S., Narayana B., Ramesh P., Sevvanthi S., Aayisha S. J. Mol. Struct. 2020;1202 doi: 10.1016/j.saa.2019.117609. [DOI] [PubMed] [Google Scholar]
- 38.Wei D.-Q., Zhang R., Du Q.-S., Gao W.-N., Li Y., Gao H., Wang S.-Q., et al. Amino Acids. 2006;31(1):73–80. doi: 10.1007/s00726-006-0361-7. [DOI] [PMC free article] [PubMed] [Google Scholar]
- 39.Subhani Syed, Jayaraman Archana, Jamil Kaiser. Biomed. Pharmacother. 2015;71:37–45. doi: 10.1016/j.biopha.2015.02.009. [DOI] [PubMed] [Google Scholar]