KEY POINT:
Nonparametric statistical tests can be a useful alternative to parametric statistical tests when the test assumptions about the data distribution are not met.
In this issue of Anesthesia & Analgesia, Wang et al1 report results of a trial of the effects of preoperative gum chewing on sore throat after general anesthesia with a supraglottic airway device. The authors used the Mann-Whitney U test—a nonparametric test—to compare numerical rating scale pain scores between the groups.
The majority of statistical methods—namely, parametric methods—is based on the assumption of a specific data distribution in the population from which the data were sampled. This distribution is characterized by ≥1 parameters, such as the mean and the variance for the normal (Gaussian, “bell shaped”) distribution. Parametric methods commonly seek to estimate population parameters and to test hypotheses on these parameters—for example, on means and mean differences between groups. In contrast, though the exact definition varies in literature, nonparametric methods generally do not assume a specific probability distribution. While other nonparametric methods exist, we focus here on the widely used rank-based nonparametric tests. These methods use the ranks of the data instead of their actual values and can basically be used for all data that can be ranked, including ordinal data, discrete data (like counts), and continuous data.
Nonparametric methods are commonly used when data distribution assumptions of parametric tests are not met. In practice, researchers often assess whether the outcome variable is overall normally distributed and use a nonparametric test when it is not. It is worth noting, however, that rank-based nonparametric tests:
usually have slightly less power than parametric tests when the underlying distributional assumptions of the parametric test are actually met,
often focus on hypothesis testing rather than estimation of parameters of interest, and
may not be available when more complex analyses than simple within- or between-group comparisons are required.
It can thus be useful to consider whether a parametric test can be used despite apparently non-normally distributed outcome data. First, the normality assumption does not necessarily apply to the dependent variable itself but, for example, to the residuals in a linear regression model. Second, some parametric tests like the t test can be relatively robust against non-normality when the sample size is large. Third, data transformations to approximate a normal distribution can be considered. Fourth, when data follow some other well-defined distribution (eg, Poisson distribution for count data), researchers can take advantage of parametric methods designed for these specific distributions.2
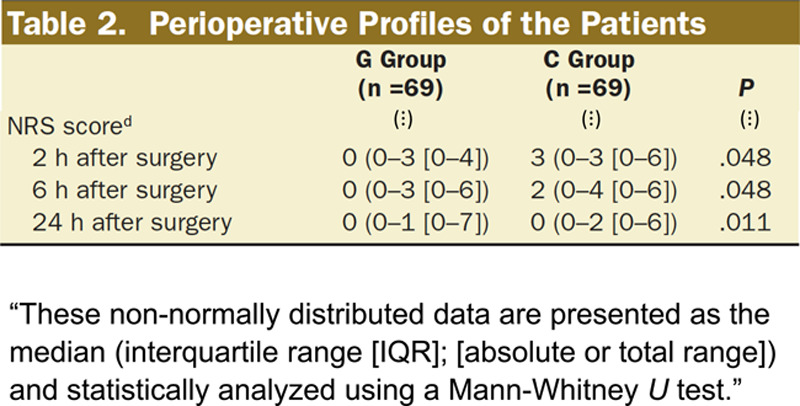
The Mann-Whitney U test (also known as the Wilcoxon rank-sum test or Wilcoxon-Mann-Whitney test) used by Wang et al1 (Figure) is the nonparametric equivalent to the 2-sample t test to compare 2 independent groups. It tests the null hypothesis that both groups come from populations with the same distribution, specifically, whether randomly drawn observations from one group are more likely to be higher (or lower) than randomly drawn observations from the other group.3 Contrary to common belief, the Mann-Whitney U test does not compare the medians between groups. This is only true under the assumption that the distribution has the same shape in both groups and differs only by its location. For >2 groups, the Kruskal–Wallis test can be used as a nonparametric alternative to 1-way analysis of variance (ANOVA).
Figure.

Adapted text excerpt from the statistical methods section of Wang et al1 and their Table 2. These authors used Mann-Whitney U tests to compare patient self-reported NRS pain scores (the secondary outcome), which were not normally distributed, between their chewing gum group (G Group) and the control group (C Group). NRS indicates numeric rating scale.
The Wilcoxon signed rank test is used to compare 2 paired (nonindependent) groups or 2 repeated within-subject measurements, and this test assumes that the distribution of the between-group differences is symmetric. The Friedman test is the nonparametric equivalent to 1-way repeated-measures ANOVA for comparisons of >2 paired groups.4 For a nonparametric correlation analysis, Spearman rank correlation is commonly used.5
REFERENCES
- 1.Wang T, Wang Q, Zhou H, Huang S. Effects of preoperative gum chewing on sore throat after general anesthesia with a supraglottic airway device: a randomized controlled trial. Anesth Analg. 2020;131:1864–1871. [DOI] [PubMed] [Google Scholar]
- 2.Vetter TR, Schober P. Regression: the apple does not fall far from the tree. Anesth Analg. 2018;127:277–283. [DOI] [PubMed] [Google Scholar]
- 3.Divine G, Norton HJ, Hunt R, Dienemann J. Statistical grand rounds: a review of analysis and sample size calculation considerations for Wilcoxon tests. Anesth Analg. 2013;117:699–710. [DOI] [PubMed] [Google Scholar]
- 4.Schober P, Vetter TR. Repeated measures designs and analysis of longitudinal data: if at first you do not succeed-try, try again. Anesth Analg. 2018;127:569–575. [DOI] [PMC free article] [PubMed] [Google Scholar]
- 5.Schober P, Vetter TR. Correlation analysis in medical research. Anesth Analg. 2020;130:332. [DOI] [PubMed] [Google Scholar]


