

Abstract
BACKGROUND:
Blood donors receiving testosterone replacement therapy (TRT) often require therapeutic phlebotomy due to erythrocytosis. Red blood cells (RBCs) donated by eligible TRT donors are approved for collection and transfusion. This study was aimed at defining the prevalence and demographic determinants of TRT donors at a large USA blood service organization.
STUDY DESIGN:
Donation data from TRT donors and matched controls was collected from a de-identified electronic donor database across 16 blood centers in 2017–2018. Demographic determinants included race, sex, age, hemoglobin (Hb), body mass index (BMI), mean arterial pressure (MAP), and the frequency of donations in the 2-year period.
RESULTS:
TRT donors comprised 1.6% of the donor population and produced 2.2% of RBC units during 2018. TRT donors were likely to be middle-aged white or Hispanic men, with high prevalence of obesity (50.8% of TRT donors had BMI ≥30 kg/m2 compared with 36.2% in controls) and intensive donation frequency (1 to 29 donations in 2 years vs. 1 to 12 in controls). TRT donors had significantly (p < 0.0001) higher MAP and Hb compared with controls (MAP 99.9 ± 9.81 vs. 96.5 ± 10.1 mmHg; Hb 17.8 ± 1.44 vs. 15.6 ± 1.37 g/dL). One year of donations was associated with significant decreases in MAP and Hb for TRT donors.
CONCLUSIONS:
TRT is associated with high prevalence of erythrocytosis and obesity that may explain the intensive donation frequency, high MAP, and Hb. Frequent phlebotomies had a moderately positive effect on blood pressure and Hb levels. Potential implications of TRT on the quality of the RBC products require further evaluation.
Testosterone replacement therapy (TRT) is commonly prescribed for medical conditions involving hypogonadism among aging men1 or as part of sex reassignment treatments in transgender men. TRT may also be prescribed to postmenopausal women for treatment of sexual disorders.2 The growing popularity of TRT among men has resulted in a four-fold increase in testosterone prescriptions since early 2000,1,3,4 and current estimates suggest that about 4% of cis and transgender men in the USA receive exogenous testosterone. The safety and long-term benefits of TRT have not been established; however, polycythemia and erythrocytosis secondary to testosterone are major risks factors associated with this practice.5,6 These conditions may result in significant increases in red blood cell (RBC) mass and hemoglobin (Hb)7 that can be mitigated by therapeutic phlebotomy. The rise in TRT prescriptions in the general population coincides with increased numbers of unique blood donations by these patients, who often present at local blood banks for therapeutic phlebotomy. In 2018, the US Food and Drug Administration allowed RBC components derived from therapeutic phlebotomies by blood donors with erythrocytosis secondary to TRT to be used for allogeneic transfusion.8
Current evaluations of the prevalence of TRT among blood donors including contribution to the blood supply and potential impact on the quality of RBC components are limited to a small number of studies. A recent report from Canada that evaluated blood donations from 39 TRT patients observed an association between TRT and elevated Hb levels (17.3 g/dL) likely due to erythrocytosis. Repeated donations in this cohort had limited efficacy in reducing Hb or hematocrit levels, which remained above the normal range for the general blood donor population.9 A blood bank in Louisiana reported that nearly 10% of its blood supply is donated by TRT donors. This study identified unique donor characteristics associated with TRT including high rates of polycythemia (44%), higher blood pressure, higher donation frequency, and higher Hb levels as compared with non-TRT donors.10 The quality of RBC components derived from TRT donors is another aspect that requires further evaluation. Our previous studies in humans and mice suggested that sex differences in RBC biology and hemolysis are partially mediated by testosterone, and that TRT promotes changes in RBC metabolism and susceptibility to hemolysis.11,12 For example, stored RBCs from TRT donors exhibited higher levels of spontaneous and osmotic hemolysis, lower ATP, higher glycolysis end products (lactate), and changes in membrane phospholipid metabolism. These actions of testosterone may contribute to donor-specific differences in RBC storage stability and transfusion efficacy.
In light of the growing number of donations by TRT donors, the purpose of this study was to define the prevalence and demographic characteristics of TRT in a large USA blood collection system. We demonstrate that on average, TRT donors are likely to be white middle-aged men with high prevalence of obesity, high blood pressure, high Hb levels, and intensive donation frequency. We further suggest that frequent therapeutic phlebotomies may be beneficial in mitigating the effects of erythrocytosis secondary to testosterone.
MATERIALS AND METHODS
Prevalence of RBC donations by TRT donors in one calendar year
Blood donors who visited one of sixteen USA blood donation centers during 2018 were considered for this study. Donors that visited more than once were not counted multiple times when calculating TRT prevalence. As part of routine donor screening, donors are asked if they are taking prescription testosterone. TRT status in this study was determined by donor response to this question. Based on this information, we determined the number of TRT donors and their percentage of the total donor population. The number of RBC units resulting from TRT donors was calculated from the number of whole blood donations (W) and double RBC donations (R): RBC units = W + 2R. The percentage of all units resulting from TRT donors in 2018 was calculated.
Evaluation of TRT donor characteristics and selection criteria for matched controls
We queried the eProgesa data warehouse of whole blood donations that took place at 16 regional USA blood donation centers in 15 states (Arizona, California, Colorado, Idaho, Louisiana, Mississippi, Montana, Nevada, New Mexico, North Dakota, South Dakota, Tennessee, Texas, Washington, and Wyoming) from January 1, 2017 to December 31, 2018. Centers not on the eProgesa software management system were excluded. We selected donors who self-identified as being on testosterone therapy at any donation visit during that time period. Demographic evaluation of TRT donors included all subjects who were registered at least one time during the study period as TRT (termed as full TRT cohort), whereas comparison studies with non-TRT donors were conducted on subjects who were consistently on TRT during the entire study period (termed as consistent TRT cohort, Fig. 1). This group provided insights into donors that received testosterone consistently throughout the entire study period, thus eliminating variability from donors who started or stopped treatment during the study period. For matching purposes, each consistent TRT subject who donated a whole blood unit was matched with up to five independent, randomly selected controls without hereditary hemochromatosis. Additional matching criteria included sex, age (five-year bins), self-reported race/ethnicity, and total number of donations during the study period (bins as follows: 1, 2–3, 4–5, 6–9, 10+). Age matching was based on the first donation of each donor. Double RBC donations were excluded from the comparison analyses as they are a minor component of the catchment period, and because they would have introduced confounding factors stemming from differences in manufacturing procedures (standard single unit whole blood donations vs. machine-based RBC collections in double RBCs) and the numbers of RBC units produced per visit (one unit in whole blood vs. two in double RBCs), which would also impact the amount of blood withdrawn per visit.
Fig. 1.
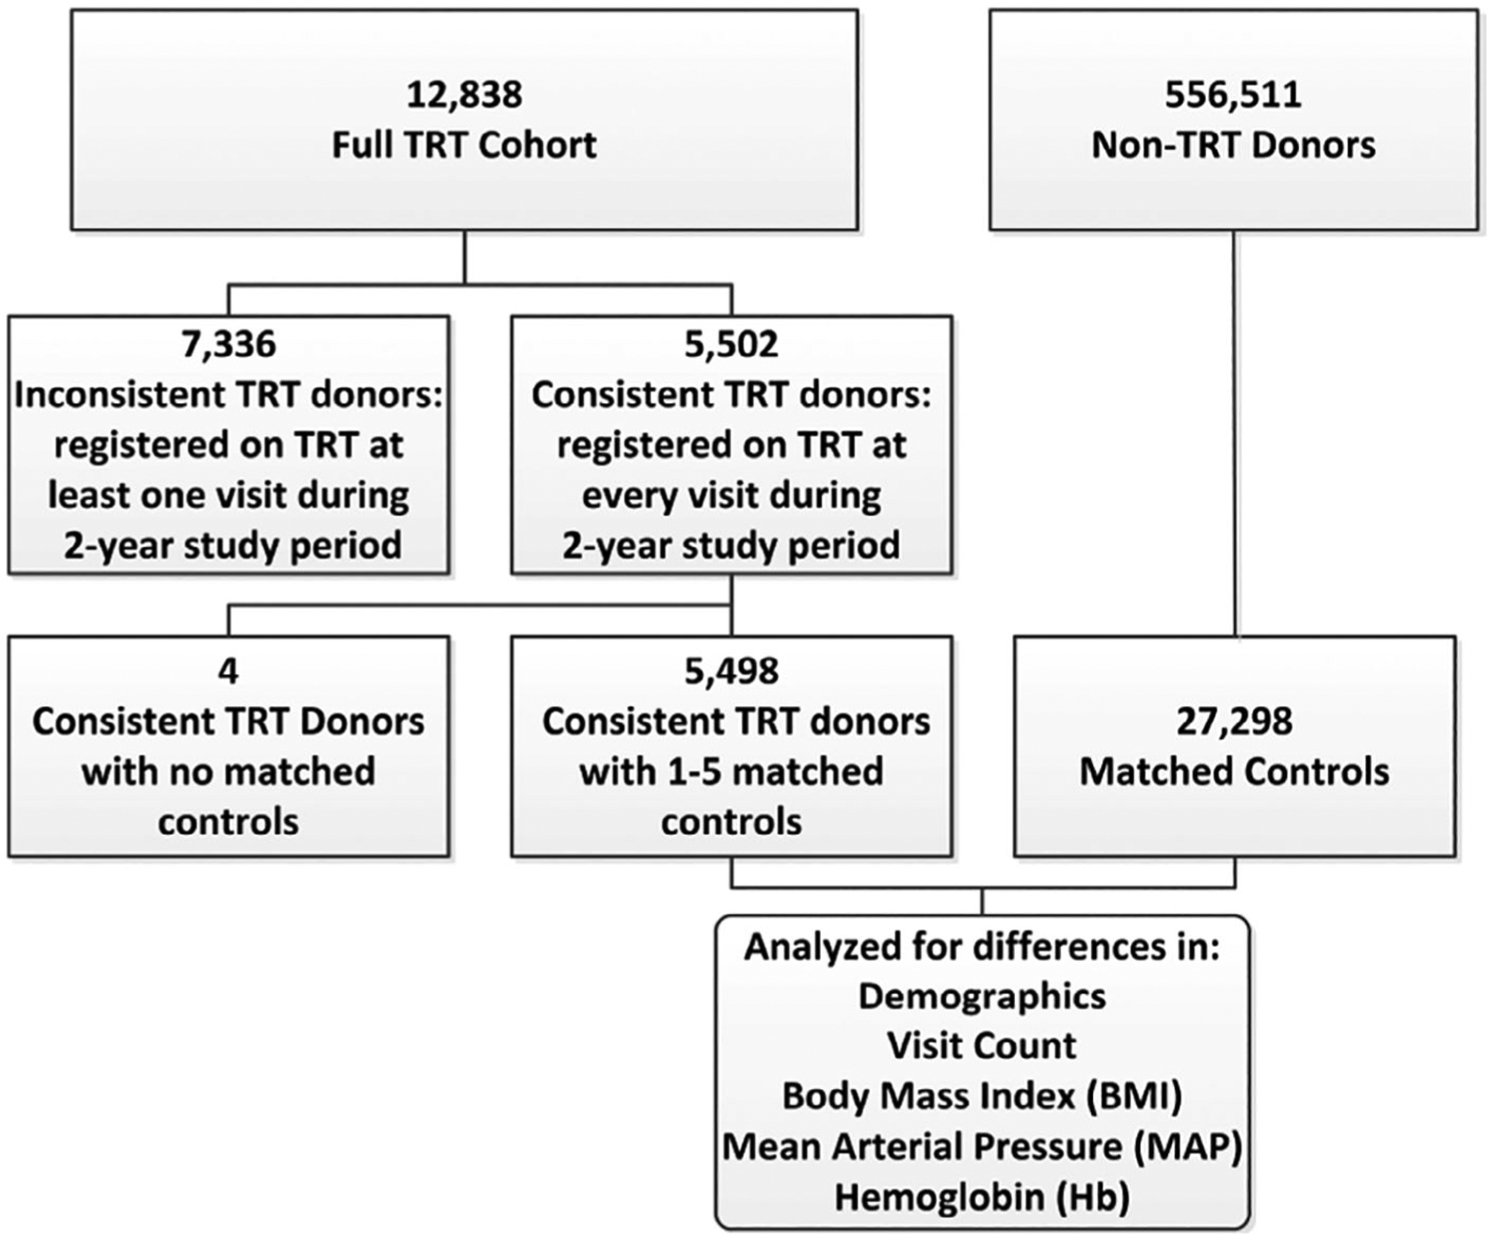
Flowchart of the study design including participating cohorts and the numbers of donors whose demographic information was used in the analyses. TRT = testosterone replacement therapy.
Donor demographic variables
Demographic determinants of TRT and matched control donors included sex, age, race/ethnicity, inter-donation intervals, Hb levels (g/dL), body mass index (BMI, kg/m2), and mean arterial pressure (MAP, mmHg). Inter-donation interval was calculated as the difference in days between each successful donation for donors with two or more visits during the study period. BMI was calculated from self-reported height (inches) and weight (pounds) at each donation visit (703 × weight (lbs)/[height (in)]2). MAP was calculated using eProgesaʼs database of donor systolic blood pressure (SBP) and diastolic blood pressure (DBP) at the time of each donation: MAP = ⅓(SBP−DPB) + DBP.13
Statistical analysis
Differences in demographic characteristics (BMI, MAP, Hb) between TRT donors and matched controls were determined by unpaired t-tests using GraphPad Prism version 8.0.0 (GraphPad Software). The effect of the frequency of donation on Hb concentration or MAP was evaluated using linear mixed models (PROC MIXED, SAS v9.4, SAS Institute) over 365-day intervals from the first donation in the study period. Donors with only a single donation in the interval were eliminated from the analysis (control = 15,001 and TRT = 2901), leaving 2597 evaluable TRT donors with 12,297 matched controls. The overall mean-intervals were calculated for control and TRT arms. Intervals and mean-intervals were used as independent variables in the regressions. Separately, donor Hb and MAP at each visit was regressed against fixed effects of study arm, BMI, study arm x mean-interval, and study arm x inter-donation interval with study arm, mean-interval, and interval as random effects with matched groups as subject (i.e., paired by TRT donor and matched controls). Full models including all interactions were evaluated and reduced to the final models based on the effects on goodness of fit using Akaikeʼs Information Criteria. The final models were evaluated by examining Pearsonʼs residuals over the range of independent variables. Hypotheses tests were conducted with 2-sided tests at p < 0.05 without adjustment for multiple tests. The estimated Hb and MAP for each arm were calculated using the final models for specific time points over the 365 days at the mean-intervals and mean-BMI for each arm.
RESULTS
TRT prevalence and contribution to the blood supply
We determined the prevalence of TRT blood donations and contribution to the blood inventory in one calendar year (2018). Of the 511,555 blood donors who presented at the studied blood centers in 2018, 8368 were registered as receiving TRT. While the proportion of TRT donors varied widely among blood centers (0.1% to 3.8%), TRT donors represented an average of 1.6% of donors (Table 1). A total of 882,333 blood units were donated at these centers in 2018, of which 19,577 (2.2%) were from TRT donors (Table 1). The proportion of TRT blood units exceed the TRT fraction of the total donor base, indicating that TRT donors are more likely to donate multiple times in a year than average donors. Furthermore, some donation centers were enriched for TRT units, with one center exceeding 6%. Given the prevalence of units derived from TRT donors, we delved into this population to ascertain if there were distinguishing characteristics of the group.
TABLE 1.
The prevalence of TRT donors at 16 USA blood centers and the resulting red blood cell (RBC) units in calendar year 2018. Data derived from electronic database (eProgesa) in each center
| Center | Total donors | TRT donors | %TRT donors | Total RBC units donated | RBC units from TRT donors | % RBC units from TRT donors |
|---|---|---|---|---|---|---|
| 1 | 23,075 | 888 | 3.8% | 38,201 | 2431 | 6.4% |
| 2 | 31,227 | 1060 | 3.4% | 54,984 | 2489 | 4.5% |
| 3 | 15,133 | 491 | 3.2% | 24,586 | 933 | 3.8% |
| 4 | 94,869 | 2741 | 2.9% | 169,565 | 6784 | 4.0% |
| 5 | 21,193 | 435 | 2.1% | 33,987 | 1097 | 3.2% |
| 6 | 20,821 | 361 | 1.7% | 40,303 | 870 | 2.2% |
| 7 | 32,664 | 504 | 1.5% | 60,052 | 1231 | 2.0% |
| 8 | 42,996 | 586 | 1.4% | 58,488 | 838 | 1.4% |
| 9 | 23,149 | 259 | 1.1% | 34,907 | 473 | 1.4% |
| 10 | 25,020 | 190 | 0.8% | 46,543 | 504 | 1.1% |
| 11 | 26,717 | 202 | 0.8% | 49,495 | 482 | 1.0% |
| 12 | 19,515 | 116 | 0.6% | 36,722 | 248 | 0.7% |
| 13 | 48,462 | 274 | 0.6% | 74,085 | 616 | 0.8% |
| 14 | 29,735 | 157 | 0.5% | 48,296 | 344 | 0.7% |
| 15 | 12,645 | 52 | 0.4% | 23,589 | 124 | 0.5% |
| 16 | 44,334 | 52 | 0.1% | 88,530 | 113 | 0.1% |
| Overall | 511,555 | 8368 | 1.6% | 882,333 | 19,577 | 2.2% |
TRT donor demographics and characteristics
Between January 1, 2017, and December 31, 2018, a total of 12,838 donors were registered as TRT during at least one donation (full TRT cohort) and of whom, 5502 were consistent TRT donors (i.e., registered as TRT on each visit). A total of 27,298 control donors were matched to the consistent TRT donors as described under Materials and Methods. Of the 5502 consistent TRT donors, 4 donors were unable to be matched to at least one control and were excluded from the analysis, resulting in the inclusion of 5498 consistent TRT donors. Over 98% of TRT donors had five matched controls. Our evaluations revealed that the vast majority of donors within the full TRT cohort were white (80%), male (97%), and 40 years of age or older (83%, Table 2). More than half of all TRT donors had more than one donation during the 2-year study period (56%), and many of them had 10 or more visits during that time (4.4%). Importantly, 145 TRT donors (about 1%) donated more than 13 times during the 2 years. This frequency requires donations less than 56 days apart, which is outside of eligibility criteria for non-TRT donors.
TABLE 2.
Demographic determinants of TRT blood donors and their matched controls at 16 USA blood centers. Data were collected over a 2-year period (2017–2018) and represent count and distribution of donor age, sex, race/ethnicity, and donation frequency stratified by TRT status. Full TRT cohort represents blood donors who received TRT at least one time during the study period. Consistent TRT donors represent blood donors who were registered as TRT at all visits during the study period
| Full TRT cohort | Consistent TRT donors | Matched controls | ||||
|---|---|---|---|---|---|---|
| Variable | n | % | n | % | n | % |
| Total donors | 12,838 | 100.0 | 5498 | 100.0 | 27,298 | 100.0 |
| Age | ||||||
| 15–19 | 31 | 0.2 | 18 | 0.3 | 90 | 0.3 |
| 20–29 | 310 | 2.4 | 148 | 2.7 | 740 | 2.7 |
| 30–39 | 1847 | 14.4 | 878 | 16.0 | 4379 | 16.0 |
| 40–49 | 3853 | 30.0 | 1752 | 31.9 | 8614 | 31.6 |
| 50–59 | 3759 | 29.3 | 1582 | 28.8 | 7880 | 28.9 |
| 60–69 | 2232 | 17.4 | 845 | 15.4 | 4221 | 15.5 |
| 70–93 | 806 | 6.3 | 275 | 5.0 | 1374 | 5.0 |
| Sex | ||||||
| Male | 12,495 | 97.3 | 5331 | 97.0 | 26,463 | 97.0 |
| Female | 343 | 2.7 | 167 | 3.0 | 835 | 3.0 |
| Race/ethnicity | ||||||
| White | 10,255 | 79.9 | 4446 | 80.9 | 22,079 | 80.9 |
| Black | 227 | 1.8 | 113 | 2.1 | 565 | 2.1 |
| Hispanic | 1318 | 10.3 | 581 | 10.6 | 2888 | 10.6 |
| Asian | 181 | 1.4 | 71 | 1.3 | 355 | 1.3 |
| Native American | 38 | 0.3 | 22 | 0.4 | 104 | 0.4 |
| Other | 318 | 2.5 | 134 | 2.4 | 664 | 2.4 |
| Missing | 501 | 3.9 | 131 | 2.4 | 643 | 2.4 |
| Number of donations during 2-year study period | ||||||
| 1 | 5689 | 44.3 | 2816 | 51.2 | 14,080 | 51.6 |
| 2–5 | 5146 | 40.1 | 1981 | 36.0 | 9893 | 36.3 |
| 6–9 | 1433 | 11.2 | 508 | 9.2 | 2528 | 9.3 |
| 10–13 | 425 | 3.3 | 154 | 2.8 | 797 | 2.9 |
| 14–37 | 145 | 1.1 | 39 | 0.7 | 0 | 0.0 |
The demographic determinants of the subset of TRT donors designated as consistent TRT were largely similar to those identified in the full TRT cohort. For example, the majority of the consistent TRT donors (81%) were middle-aged white males (Table 2). This group had slightly fewer donations during the study period as comparted with the full TRT cohort; 49% donated more than once, and 3.5% donated 10 times or more. Controls were matched to consistent TRT donors by age, sex, race/ethnicity, and donation frequency and therefore the percentage of control donors within each of these categories are nearly identical to the consistent TRT donors (Table 2). Notably, there were no control donors with more than 12 donations within the 2-year study period as restricted by the minimum inter-donation interval of 56 days for routine allogeneic blood donors.
TRT is characterized by shorter inter-donation intervals
Given the high prevalence of therapeutic phlebotomy among TRT donors, the number of donations in the 2-year period was significantly (p < 0.0004) higher than that of their matched controls (mean ± SD, 2.66 ± 2.71 vs. 2.53 ± 2.37; TRT and controls, respectively, Fig. 2A). While control donors were only eligible for a maximum of 12 visits in the study period, TRT donors had as many as 29 visits over the course of 2 years. As such, control donors tended to have larger average inter-donation intervals than TRT donors (Fig. 2B). Due to extreme donation frequency, this tail of TRT donors with more than 13 donations had an average inter-donation interval of less than 56 days (Fig. 2B); matched controls, on the other hand, do not fall short of 56-day inter-donation intervals as per donation eligibility guidelines. Note that blood collection within 56 days of the previous donation requires review and approval of a physician.
Fig. 2.

Testosterone replacement therapy (TRT) in blood donors is associated with frequent blood donations and shorter average inter-donation intervals. (A) Total number of donations during the 2-year study period for each TRT and control donor. ***p = 0.0004. (B) Average inter-donation interval for TRT donors (dashed line) and matched controls (solid line). Interval separated into bins of 10 days.
TRT donors have higher BMI, MAP, and Hb than matched controls
In analyzing the consistent TRT donors and their matched controls, a number of differences were observed in their health metrics. TRT donors had significantly higher BMI than control donors (mean ± SD, 30.9 ± 5.06 vs. 29.2 ± 5.16; p < 0.0001, Fig. 3). The average BMI for TRT donors falls into the obese range (BMI ≥30 kg/m2), whereas the matched control average falls within the overweight range (BMI 25–29.99 kg/m2). In fact, 50.8% of TRT donors had BMI ≥30 kg/m2 compared with 36.2% in controls. MAP was likewise significantly higher in TRT donors than in matched controls (mean ± SD, 99.9 ± 9.81 vs. 96.5 ± 10.1 mmHg; p < 0.0001, Fig. 4A). TRT is known to increase Hb levels and in accordance with previous reports,6 average Hb at the time of first donation was significantly higher in TRT donors than in matched controls (mean ± SD, 17.8 ± 1.44 vs. 15.6 ± 1.37 g/dL; p < 0.0001, Fig. 4B).
Fig. 3.

Differences in body mass index (BMI) between blood donors who received testosterone replacement therapy (TRT) and matched controls. The main panel illustrates overlapped distributions of BMI for TRT (dashed line) and control (solid line) donor groups. The inset panel illustrates the BMI at the time of first donation for every donor with mean and standard deviation indicated. ****p < 0.0001.
Fig. 4.

Differences in mean arterial pressure (MAP) or hemoglobin (Hb) between blood donors who received testosterone replacement therapy (TRT) and matched controls. Data collected at the time of first donation for every donor with mean and standard deviation indicated. (A) MAP (mmHg) in TRT donors versus matched controls. ****p < 0.0001. (B) Hb (g/dL) in TRT donors versus matched controls. ****p < 0.0001.
Therapeutic phlebotomy in TRT donors is associated with reduced levels of MAP and Hb
We conducted regression analyses to verify whether frequent therapeutic donations in TRT donors modulate donor MAP or Hb levels. The MAP regression solution is shown in Table 3. Higher BMI was associated with higher MAP in both arms (p < 0.0001). The mean inter-donation interval had no significant effect in the TRT group (p = 0.89), suggesting there was no overall effect of donation frequency on MAP for TRT. MAP was associated with a slight increase as the interval between donations increased for the control arm (p < 0.0001). The change in MAP over the study period (interval*arm) was significant for TRT (p < 0.0001) suggesting a decrease in MAP over the study period for TRT donors, and control donors had no significant change in MAP over the period. This resulted in a distinct difference in MAP between TRT and control donors over the course of 1 year of donations. Control donors had a moderate non-significant decrease in MAP over 365 days, whereas in TRT donors MAP decreased nearly 2 mmHg over 365 days, a significant change from Day 0 (Fig. 5A). Despite the observed decline in MAP values in TRT donors, MAP remained significantly higher than that of control donors at Day 365 (p < 0.0001, Fig. 5A).
TABLE 3.
Mean arterial pressure (MAP) Multivariate Regression Solution. Donor MAP (mmHb) was regressed on the main effects of arm (Control and TRT) plus the interactions of arm with body mass index (BMI), the mean donation interval (mean interval) and the interval from the first donation in the 365-day study period. p values indicate the significance of the effect (i.e., parameter not equal to zero). n(control) = 12,297 n(TRT) = 2597
| Effect | Parameter estimate | SE | p |
|---|---|---|---|
| ARM control | 79.0 | 0.3170 | <0.0001 |
| ARM TRT | 87.8 | 0.8307 | <0.0001 |
| BMI*control | 0.5655 | 0.0099 | <0.0001 |
| BMI*TRT | 0.3845 | 0.0252 | <0.0001 |
| Mean interval*control | 0.0042 | 0.0008 | <0.0001 |
| Mean interval*TRT | −0.0003 | 0.0021 | 0.8881 |
| Interval*control | −0.0003 | 0.0004 | 0.5133 |
| Interval*TRT | −0.0046 | 0.0009 | <0.0001 |
Fig. 5.
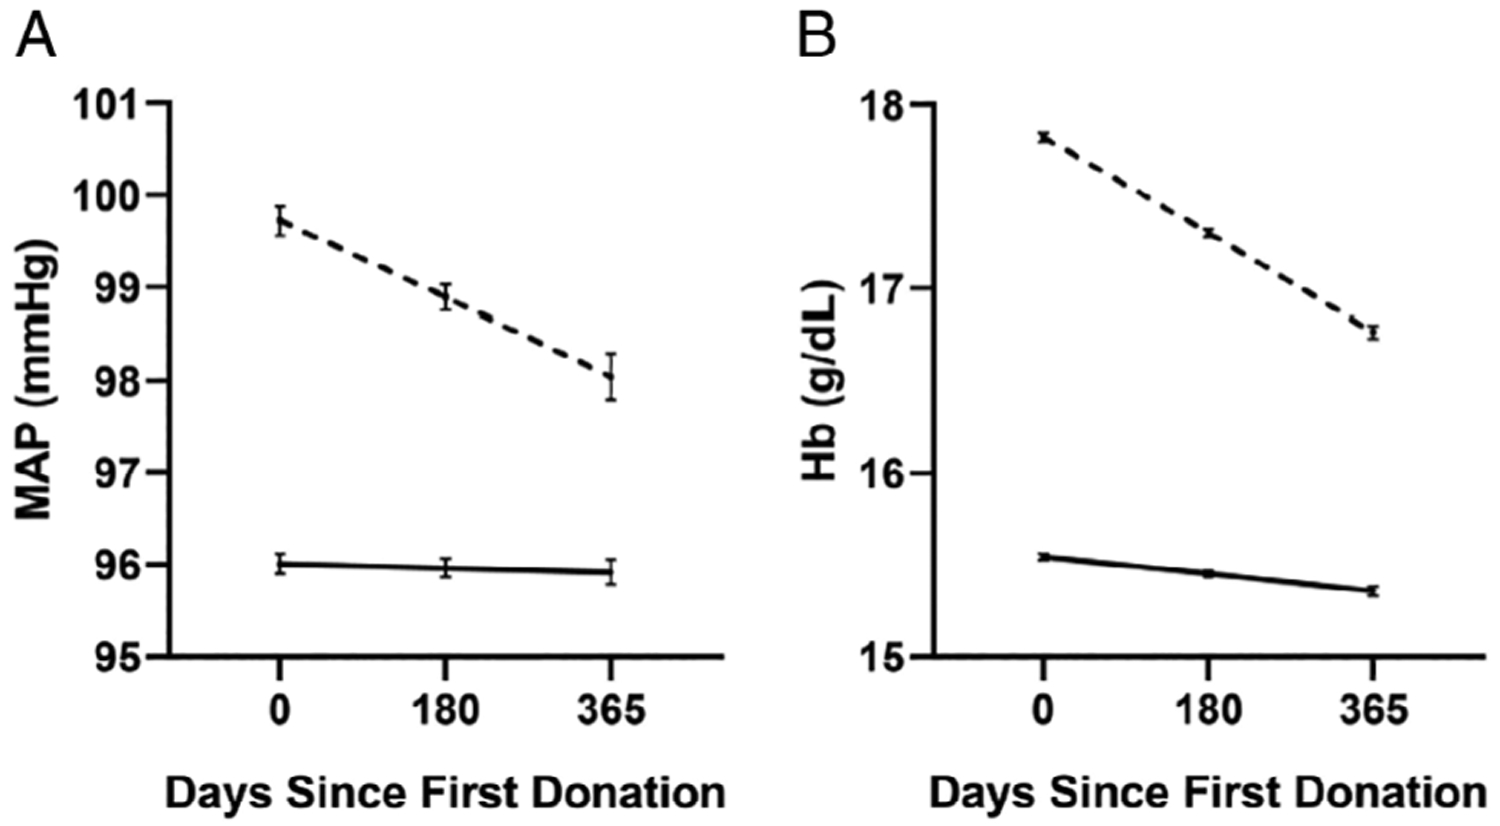
Effect of frequent blood donations on mean arterial pressure (MAP) or hemoglobin (Hb) in testosterone replacement therapy (TRT) donors and matched controls. Regression solution estimates of MAP and Hb are shown using the mean BMI and mean inter-donation intervals. (A) MAP levels of TRT donors (dashed line) decreased significantly (p < 0.0001) over the course of 365 days of donations but did not change for matched controls (solid line). (B) Hb levels of TRT donors (dashed line) and matched control donors (solid line) decreased significantly (p < 0.0001 for both) over the course of 365 days of donations. However, the magnitude of the change observed in TRT donors is higher than that that of controls.
The donor Hb regression solution is shown in Table 4. Higher BMI was associated with higher overall Hb (p < 0.0001). The mean inter-donation interval had no significant effect in the control group (p = 0.83), suggesting there was no overall effect of donation frequency on Hb for controls with donations at least 56 days apart. The significant effect of mean inter-donation interval in TRT donors (p < 0.0001) suggests less frequent donations in the TRT group results in a higher mean Hb. The change in Hb over the study period (interval*arm) was significant for both arms (p < 0.0001), although TRT had greater decrease in Hb over time during the study period (Fig. 5B). Importantly, the decrease for control donors measured 0.19 g/dL, whereas TRT donors experienced a change of 1.06 g/dL, bringing their Hb down to 16.8 g/dL on average (Fig. 5B). Despite those changes, TRT donor Hb levels remained significantly higher than that of control donors at Day 365 (p < 0.0001, Fig. 5B). The results of this regression analyses suggested that multiple donations over a course of 1 year are associated with significant reductions in Hb levels.
TABLE 4.
Hemoglobin (Hb) Multivariate Regression Solution. Donor hemoglobin (Hb; g/dL) was regressed on the main effects of arm (Control and TRT) and BMI plus the interactions of arm with the mean donation interval (mean interval) and the interval from the first donation in the 365-day study period. p values indicate the significance of the effect (i.e., parameter not equal to zero). n(control) = 12,297 n(TRT) = 2597
| Effect | Parameter estimate | SE | p |
|---|---|---|---|
| ARM control | 14.9 | 0.04402 | <0.0001 |
| ARM TRT | 16.9 | 0.05653 | <0.0001 |
| BMI | 0.02117 | 0.00132 | <0.0001 |
| Mean interval*control | 0.00003 | 0.00012 | 0.8319 |
| Mean interval*TRT | 0.00234 | 0.00033 | <0.0001 |
| Interval*control | −0.00051 | 0.00005 | <0.0001 |
| Interval*TRT | −0.00291 | 0.00012 | <0.0001 |
DISCUSSION
This study evaluated the prevalence and demographic determinants of blood donors who received testosterone therapies during 2017–2018 in a large USA blood collection system. The outcomes provide new information regarding the contribution of TRT donors to the blood supply, as well as demographic and health measures unique to these donors. These analyses addressed a growing phenomenon among male donors, in which further evaluation is required to inform the long-term risks associated with TRT including potential impact on the quality of RBC components.
In this study, TRT donors made up about 1.6% of the overall donor population with large variation (0.1%−3.8%) among the 16 blood centers. This variation may be explained by demographic and cultural differences among the tested sites. For example, TRT has been prescribed for obesity-associated hypogonadism,14 in which higher rates of obesity in certain geographical areas may coincide with higher prevalence of this therapy. The proportion of TRT-RBC units in the blood inventory was enriched above the prevalence of TRT donors because of the increased donation frequency of TRT donors. Eligible TRT donors with erythrocytosis may present at the blood centers on a weekly or monthly basis for therapeutic phlebotomy, which consequently increases the overall number of RBC units from TRT donors. In our analyses, the overall share of TRT RBC units donated in Blood Center 1 (6.4%) was higher than the prevalence (3.8%) of TRT donors presenting at that blood center (Table 1). A similar study from Louisiana reported that the overall RBC donations by TRT donors (including repeated donors) measured about 10%.10
The demographic determinants of TRT blood donors in the tested blood centers revealed that these donors are likely to be middle-aged white and Hispanic males, with average BMI over 30 kg/m2 (defined as obese) and MAP that was significantly higher than that of their matched controls. As noted, obesity is a risk factor for late-onset hypogonadism or testosterone deficiency,15,16 which may explain the observed differences in BMI values between TRT donors and controls. A previous study, which determined the rates of obesity and BMI in over 1 million blood donors between 2007–2008, has suggested that about 29% of male donors were obese.17 Our analyses revealed that obesity rates measured 50.8% in TRT donors and 36.2% in controls. The rates of obesity observed in control donors are higher than those reported over a decade ago17 and slightly lower than the population average (39.8%) in the USA (as of 2016).18 Additionally, the prevalence of Class 2 (BMI 35 to 39.9 kg/m2) or Class 3 (BMI ≥40 kg/m2) obesity among TRT donors was higher than that of the controls (17.4% vs. 11.9%, respectively for BMI ≥35 kg/m2).
We recently reported that frequent blood donations in healthy donors are significantly associated with enhanced resistance of donor RBCs to oxidative stress and with a decline in plasma ferritin levels.19 Although we did not evaluate these outcomes in the present study, we were able to identify several changes in blood donor health measures, some of which were unique to TRT donors. For example, multiple donations over a course of 1 year were associated with a significant decrease in MAP in TRT donors, but not in controls. Similarly, the decrease in donor Hb levels across subsequent donations was larger in TRT compared with controls. These observations suggest that frequent therapeutic phlebotomies in TRT donors with polycythemia or erythrocytosis are somewhat effective in reducing Hb levels and blood pressure, however, both parameters (i.e., Hb and MAP) remained significantly higher than that of controls. This observation is in agreement with a similar study from Canadian Blood Services, which concluded that repeated blood donations in TRT donors exhibited limited effectiveness in reducing Hb and hematocrit levels.9 The same study has argued that polycythemia secondary to testosterone is a major risk factor for cardiovascular events in TRT donors, and that therapeutic phlebotomy by itself may not be sufficient to counteract these risks.
This study has several limitations. First, the dosage and the forms of testosterone supplements are not captured in the blood bank information system; therefore, changes in testosterone dosing over time could have contributed the observed changes (e.g., decrease) in Hb levels in TRT donors. Second, TRT status was determined based upon donor disclosure of testosterone use at the time of donation. In the case of inconsistent TRT donors, it is not clear when or how long prior to donation they discontinued therapy. The larger proportion of intensive donations (i.e., 14–37 in prior 2 years) observed in the full TRT cohort as compared with consistent TRT donors (Table 2) may have been confounded by inaccurate disclosure of TRT in inconsistent donors. Third, although we found no significant change in BMI values over the study period for control subjects (calculated as the difference between BMI at first donation and last donation; n = 27,297, delta = −0.0006, p = 0.9221), there was a minor but significant decrease in BMI for TRT donors (n = 5497, delta = −0.079, p < 0.0001). However, we argue this small change in BMI for TRT donors (−0.079/30.9 = 0.26%) was unlikely to have a meaningful effect on the MAP.
In conclusion, this study provided quantitative measures to assess a growing trend among blood donors. Although the reported observations are limited to a single blood collection system, they are supported by similar reports that have identified demographic determinants associated with TRT in allogeneic blood donors. Among those are higher than average levels of Hb, hematocrit, high blood pressure, as well as higher prevalence of erythrocytosis and obesity. The impact of these unique donor characteristics on the quality of RBC concentrates and patient outcomes is not clear and currently being investigated by our group.
ACKNOWLEDGMENTS
The authors wish to thank Vitalant and Vitalant Research Institute for supporting this work. This study was also supported by the National Heart, Lung, and Blood Institute (NHLBI) grant number R01 HL134653 (T.K).
Footnotes
CONFLICT OF INTEREST
The authors have disclosed no conflicts of interest.
REFERENCES
- 1.Yabluchanskiy A, Tsitouras PD. Is testosterone replacement therapy in older men effective and safe? Drugs Aging 2019;36:981–9. [DOI] [PMC free article] [PubMed] [Google Scholar]
- 2.Kathryn Korkidakis A, Reid RL. Testosterone in women: measurement and therapeutic use. J Obstet Gynaecol Can 2017;39: 124–30. [DOI] [PubMed] [Google Scholar]
- 3.Rao PK, Boulet SL, Mehta A, et al. Trends in testosterone replacement therapy use from 2003 to 2013 among reproductiveage men in the United States. J Urol 2017;197:1121–6. [DOI] [PMC free article] [PubMed] [Google Scholar]
- 4.Morgan DJ, Dhruva SS, Wright SM, et al. 2016 update on medical overuse: a systematic review. JAMA Intern Med 2016;176: 1687–92. [DOI] [PMC free article] [PubMed] [Google Scholar]
- 5.Ohlander SJ, Varghese B, Pastuszak AW. Erythrocytosis following testosterone therapy. Sex Med Rev 2018;6:77–85. [DOI] [PMC free article] [PubMed] [Google Scholar]
- 6.Jones SD Jr, Dukovac T, Sangkum P, et al. Erythrocytosis and polycythemia secondary to testosterone replacement therapy in the aging male. Sex Med Rev 2015;3:101–12. [DOI] [PubMed] [Google Scholar]
- 7.Grech A, Breck J, Heidelbaugh J. Adverse effects of testosterone replacement therapy: an update on the evidence and controversy. Ther Adv Drug Saf 2014;5:190–200. [DOI] [PMC free article] [PubMed] [Google Scholar]
- 8.FDA. Exceptions and alternative procedures approved under 21 CFR 640.120. FDA; 2018. Available from: https://www.fda.gov (last visited Oct. 25, 2019).
- 9.Chin-Yee B, Lazo-Langner A, Butler-Foster T, et al. Blood donation and testosterone replacement therapy. Transfusion 2017;57:578–81. [DOI] [PubMed] [Google Scholar]
- 10.Rauch T, Thomas J, Clark S, et al. Abstract presentations from the AABB Annual Meeting Boston, MA, October 13–16, 2018. Transfusion 2018;58:6A–254A. [DOI] [PMC free article] [PubMed] [Google Scholar]
- 11.Fang F, Page G, Alexander KL, et al. Testosterone replacement therapy in blood donors alters red blood cell metabolic pathways and susceptibility to hemolysis in cold storage. Transfusion 2019;59:87A. [DOI] [PMC free article] [PubMed] [Google Scholar]
- 12.Kanias T, Sinchar D, Osei-Hwedieh D, et al. Testosterone-dependent sex differences in red blood cell hemolysis in storage, stress, and disease. Transfusion 2016;56:2571–83. [DOI] [PMC free article] [PubMed] [Google Scholar]
- 13.DeMers D, Wachs D. Physiology, mean arterial pressure In: StatPearls Treasure Island (FL): StatPearls Publishing LLC; 2019. [PubMed] [Google Scholar]
- 14.Fink J, Matsumoto M, Tamura Y. Potential application of testosterone replacement therapy as treatment for obesity and type 2 diabetes in men. Steroids 2018;138:161–6. [DOI] [PubMed] [Google Scholar]
- 15.Grossmann M, Ng Tang Fui M, Cheung AS. Late-onset hypogonadism: metabolic impact. Andrology 2019. 10.1111/andr.12705 [DOI] [PubMed]
- 16.Fernandez CJ, Chacko EC, Pappachan JM. Male obesity-related secondary hypogonadism—pathophysiology, clinical implications and management. Eur Endocrinol 2019;15:83–90. [DOI] [PMC free article] [PubMed] [Google Scholar]
- 17.Murphy EL, Schlumpf K, Wright DJ, et al. BMI and obesity in US blood donors: a potential public health role for the blood centre. Public Health Nutr 2012;15:964–71. [DOI] [PMC free article] [PubMed] [Google Scholar]
- 18.Centers for Disease Control and Prevention. (2020). Adult obesity facts [monograph on the internet]. Available from: https://www.cdc.gov/obesity/data/adult.html
- 19.Kanias T, Stone M, Page GP, et al. Frequent blood donations alter susceptibility of red blood cells to storage- and stress-induced hemolysis. Transfusion 2019;59:67–78. [DOI] [PMC free article] [PubMed] [Google Scholar]