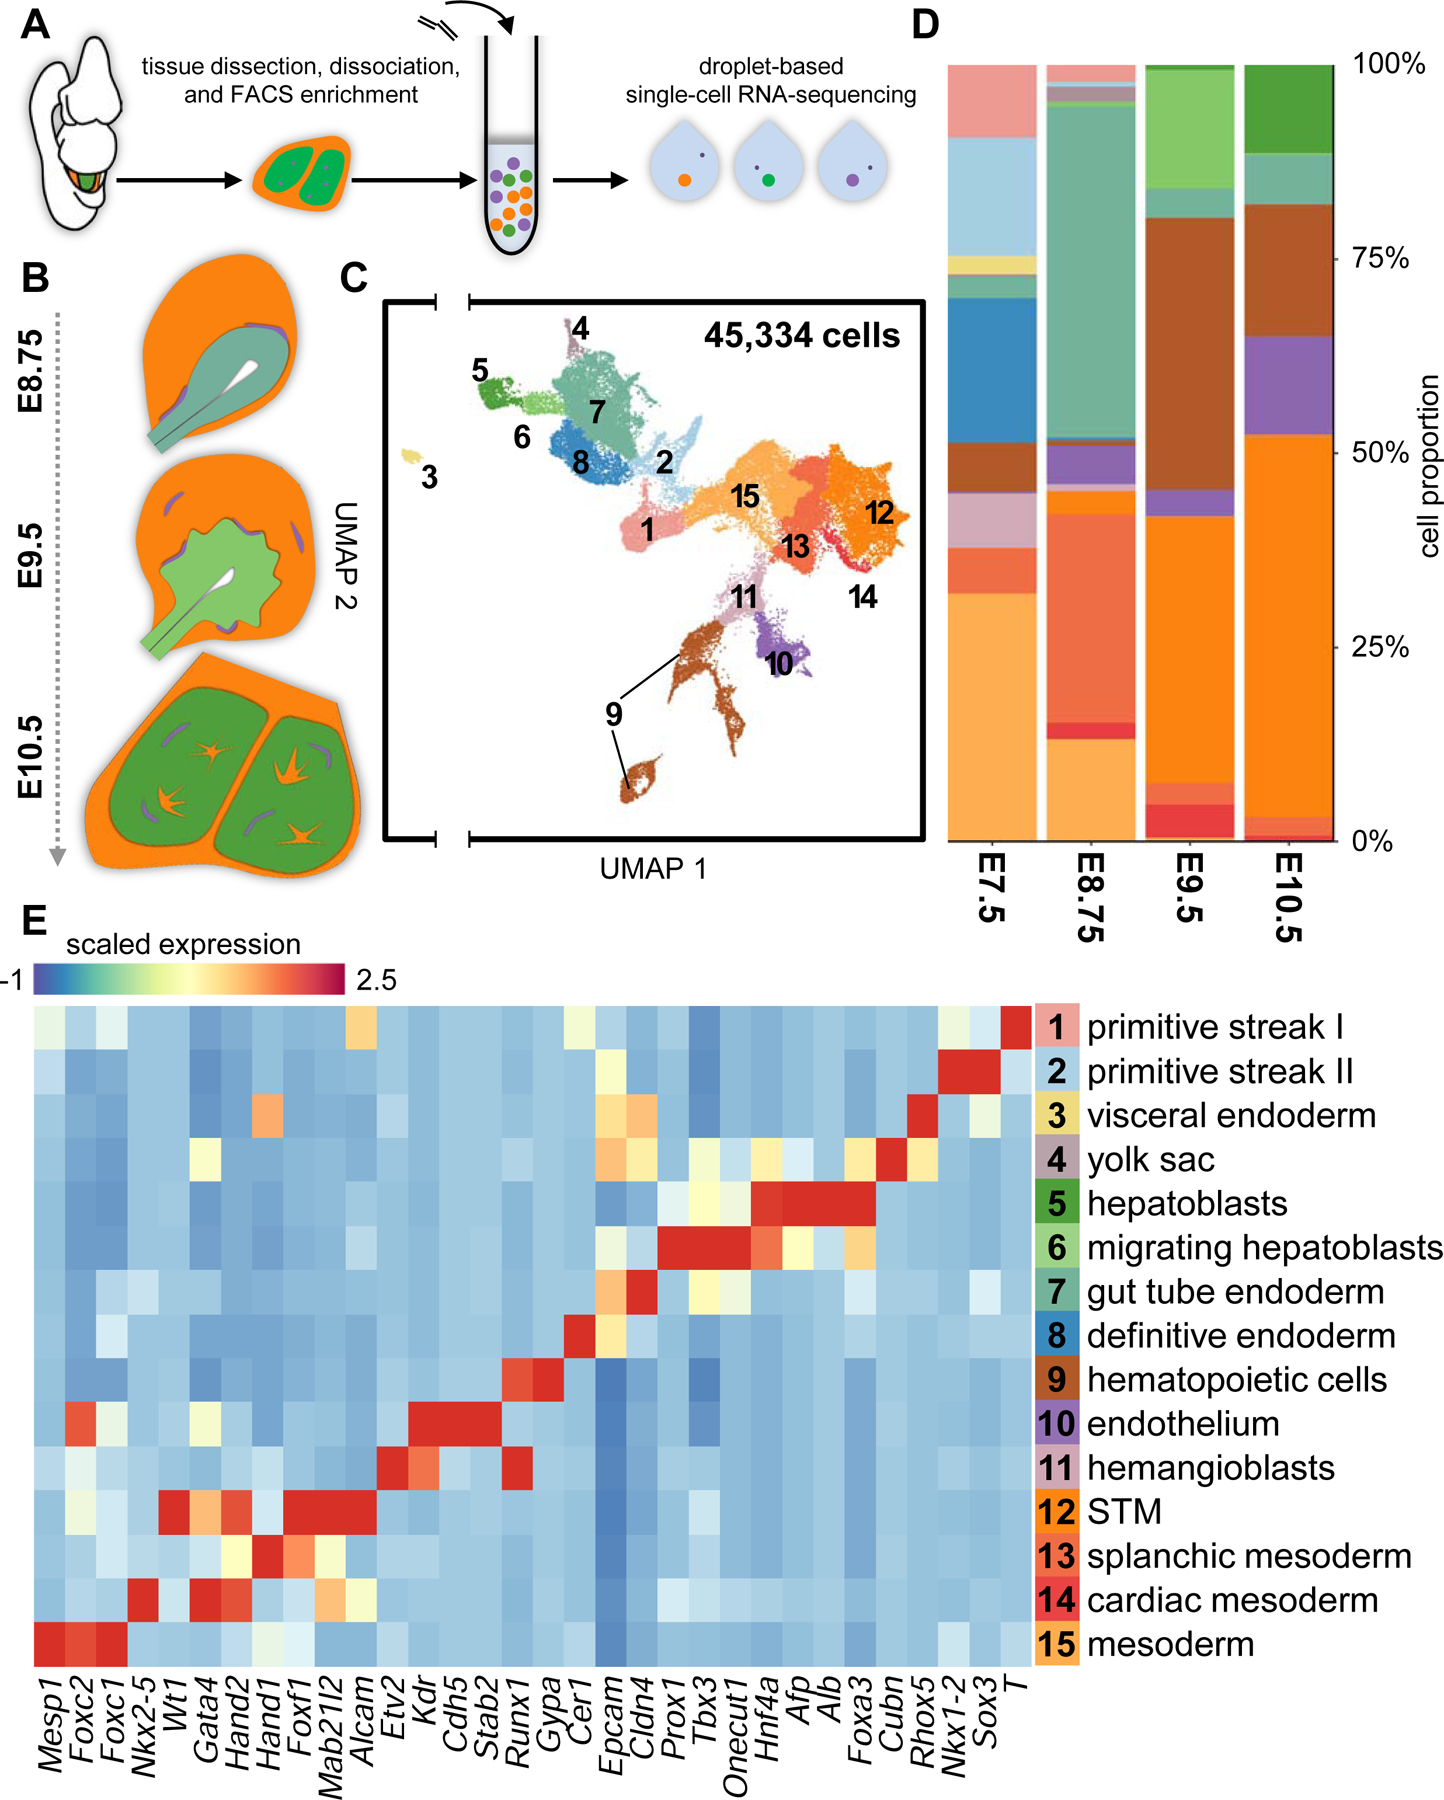
Figure 1.

Tracking emergent parenchymal and non-parenchymal liver lineages using scRNA-seq.
(A) Schematic of experimental approach. (B) Overview of murine liver development. (C) UMAP visualization of all cells sequenced. Each dot represents a single-cell that is color-coded by cell type. (D) Cell type composition by developmental stage. (E) Heatmap depicting select differentially-expressing genes for all cell types identified. STM, septum transversum mesenchyme; FACS, fluorescently-activated cell sorting. See also Figure S1 and Table S2.
