Abstract
Assessment of computed tomography (CT) images can be complex due to a number of dependencies that affect system performance. In particular, it is well-known that noise in CT is object-dependent. Such object-dependence can be more pronounced and extend to resolution and image textures with the increasing adoption of model-based reconstruction and processing with machine learning methods. Moreover, such processing is often inherently nonlinear complicating assessments with simple measures of spatial resolution, etc. Similarly, recent advances in CT system design have attempted to improve fine resolution details – e.g., with newer detectors, smaller focal spots, etc. Recognizing these trends, there is a greater need for imaging assessment that are considering specific features of interest that can be placed within an anthropomorphic phantom for realistic emulation and evaluation. In this work, we devise a methodology for 3D-printing phantom inserts using procedural texture generation for evaluation of performance of high-resolution CT systems. Accurate representations of texture have previously been a hindrance to adoption of processing methods like model-based reconstruction, and texture serves as an important diagnostic feature (e.g. heterogeneity of lesions is a marker for malignancy). We consider the ability of different systems to reproduce various textures (as a function of the intrinsic feature sizes of the texture), comparing microCT, cone-beam CT, and diagnostic CT using normal- and high-resolution modes. We expect that this general methodology will provide a pathway for repeatable and robust assessments of different imaging systems and processing methods.
INTRODUCTION
There is a long history of image quality assessment in CT. Performance metrics have included standard measures of noise and resolution via estimates of modulation transfer function and noise power spectrum, as well as more sophisticated metrics that combine the noise and resolution requirements needed for particular tasks (e.g., detectability indices, etc.). One of the difficulties with CT image quality is that imaging performance can be highly object-dependent. For example, it is well known that object size plays a significant role in image quality with larger object exhibiting more noise than smaller objects as well as correlated noise that varies with position in the object. Such dependencies have increased with the use of increasingly nonlinear data processing algorithms including model-based iterative reconstruction (MBIR) and machine learning (ML) methods (e.g., denoising using convolutional neural networks). These dependencies have spurred the development of various image quality phantoms that attempt to capture some of this object dependence – e.g., by modeling different patient sizes [1]. However, in general, such phantoms are still idealizations of human anatomy. Even more sophisticated phantoms with anatomical structures including bones, organs, etc. are also available but these tend to be most realistic at large scales and don’t reproduce small features and textures found in actual patients.
Texture is an important diagnostic tool in CT. For example, heterogeneity of lesions is a potential indicator of malignancy. Thus, accurate and reliable reproduction of physical textures should be part of CT performance assessment. We note that one of the obstacles to the adoption of MBIR approaches was the introduction of unnatural textures in reconstructed images. Not only does poor reproduction of tissue textures have the potential to impact diagnostic performance and interfere with radiologist assessment (by presenting unfamiliar textures), but it has the potential to interfere with automated methods that rely on radiomics that are used to classify and aid in diagnosis. Prior work [2] has demonstrated significant variability of radiomics based on the CT scanner [2] as well as the radiation dose and reconstruction algorithm [3]. Spatial resolution of the CT scanner can have significant impact on radiomics. Thus, new CT scanners with finer detector pixels and with the capability for increased spatial resolution will likely yield different radiomics values than previous “standard” resolution scanners.
In this work, we explore the use of 3D-printed textures to probe the ability of CT systems to reproduce fine textures. Specifically, we use procedurally generated textures and 3D print those textures in small inserts that can be introduced into a larger anthropomorphic phantom to accommodate realistic overall attenuation and noise properties. We compare the reproduction of textures on various systems including 1) a micro CT, 2) a flat-panel-based cone-beam CT (CBCT) system, and 3) a commercial diagnostic CT scanner with high-resolution capability. Radiomic measures based on gray level co-occurrence matrices are investigated at a range of offset distances, and the ability to reproduce the designed and scanned features across imaging devices is compared.
METHODS
A. Procedural Phantom Generation and 3D-printing
To generate a range of textures, we developed procedural routines for placing spherical voids within a specified volume. These routines randomly placed spheres within a defined volume (e.g. a cylinder) with a defined amount of overlap to ensure connectivity between voids. In this work, we defined a cylindrical volume of 25 mm diameter and 8 mm height. An outer wall thickness of 0.5 mm was defined. Using these parameters, we produced CAD models of textures with homogeneous spherical voids of sizes 1.0, 1.2, 1.4, 1.6, 1.8, and 2.0 mm; and one texture with heterogeneous spherical voids uniformly randomly sized between 1.0 and 2.0 mm. Three different random texture realizations were produced for each of the homogeneous textures and five realizations of the heterogeneous textures.
These CAD models were exported to a stereolithography (SLA) printer (Peopoly Moai, Hong Kong) with a 70 μm laser spot and layer height of 25 μm. A clear UV resin was used for printing. Printed samples were flushed with 90% ethanol solution to clear voids of uncured resin, followed by 1–2 hours of additional UV curing.
A 3D-printed small phantom insert is illustrated in Figure 1. We note that this insert is easily integrated into a larger anthropomorphic phantom to locally test texture reproduction. The attenuation of the cured resin is approximately 150 HU using a 100 kVp x-ray beam. The local contrast can be modified by introducing a potassium phosphate solution into the voids in the insert – e.g. to emulate an iodine-enhanced lesion with texture. (In this initial work, we consider inserts with only air voids, and not placed in a larger anthropomorphic phantom.)
Figure 1:

A) Photograph of a sample SLA textured print. B) Print in potassium phosphate solution. C) CT scan showing a designed texture contrast of ~70 HU.
B. Phantom Scanning
Completed inserts were scanned in three different CT systems including 1) a Bruker SkyScan 1172 microCT (Billerica, MA) at 50 kVp and 200 μA using 28 μm isotropic voxels; 2) a custom CBCT system using a Varex Paxscan 4343CB detector and Varex Rad-94 x-ray tube (Salt Lake City, UT) at 100 kVp and 10 mA using 100 μm isotropic voxels; and 3) a Canon Aquilion Precision CT (Otawara, Japan) at 120 kVp and 100 mA using two different protocols. Both a “normal” resolution (NR) and high resolution (HR) protocol were used on the clinical scanner. The NR protocol used a 100 μm voxel size (in-plane) and 0.5 mm slice thickness with a FC11 reconstruction filter and the HR protocol used a 50 μm voxel size (in-plane) and 0.25 mm slice thickness with a FC15 reconstruction filter.
C. Computation of Radiomics Features
To compare the ability of the 3D-printer and the various imaging devices to reproduce the originally designed textures radiomics features were computed. For computation of radiomics features, all scan volumes (e.g. microCT and HR-CT) were re-binned to a common 100 μm in-plane voxel size. Gray level co-occurrence matrices (GLCMs) were computed for a range of offsets from 0 to 3.0 mm in four principle directions (illustrated in Figure 2) using eight gray level bins. While many summary metrics of GLCMs can be computed, we focused on correlation and homogeneity. We compute an average GLCM-correlation and GLCM-homogeneity over the four directions, all transaxial slices, and three (or five, for the heterogeneous inserts) realizations as a function of offset distance. Similarly, we compute standard deviation over the same ensemble.
Figure 2:
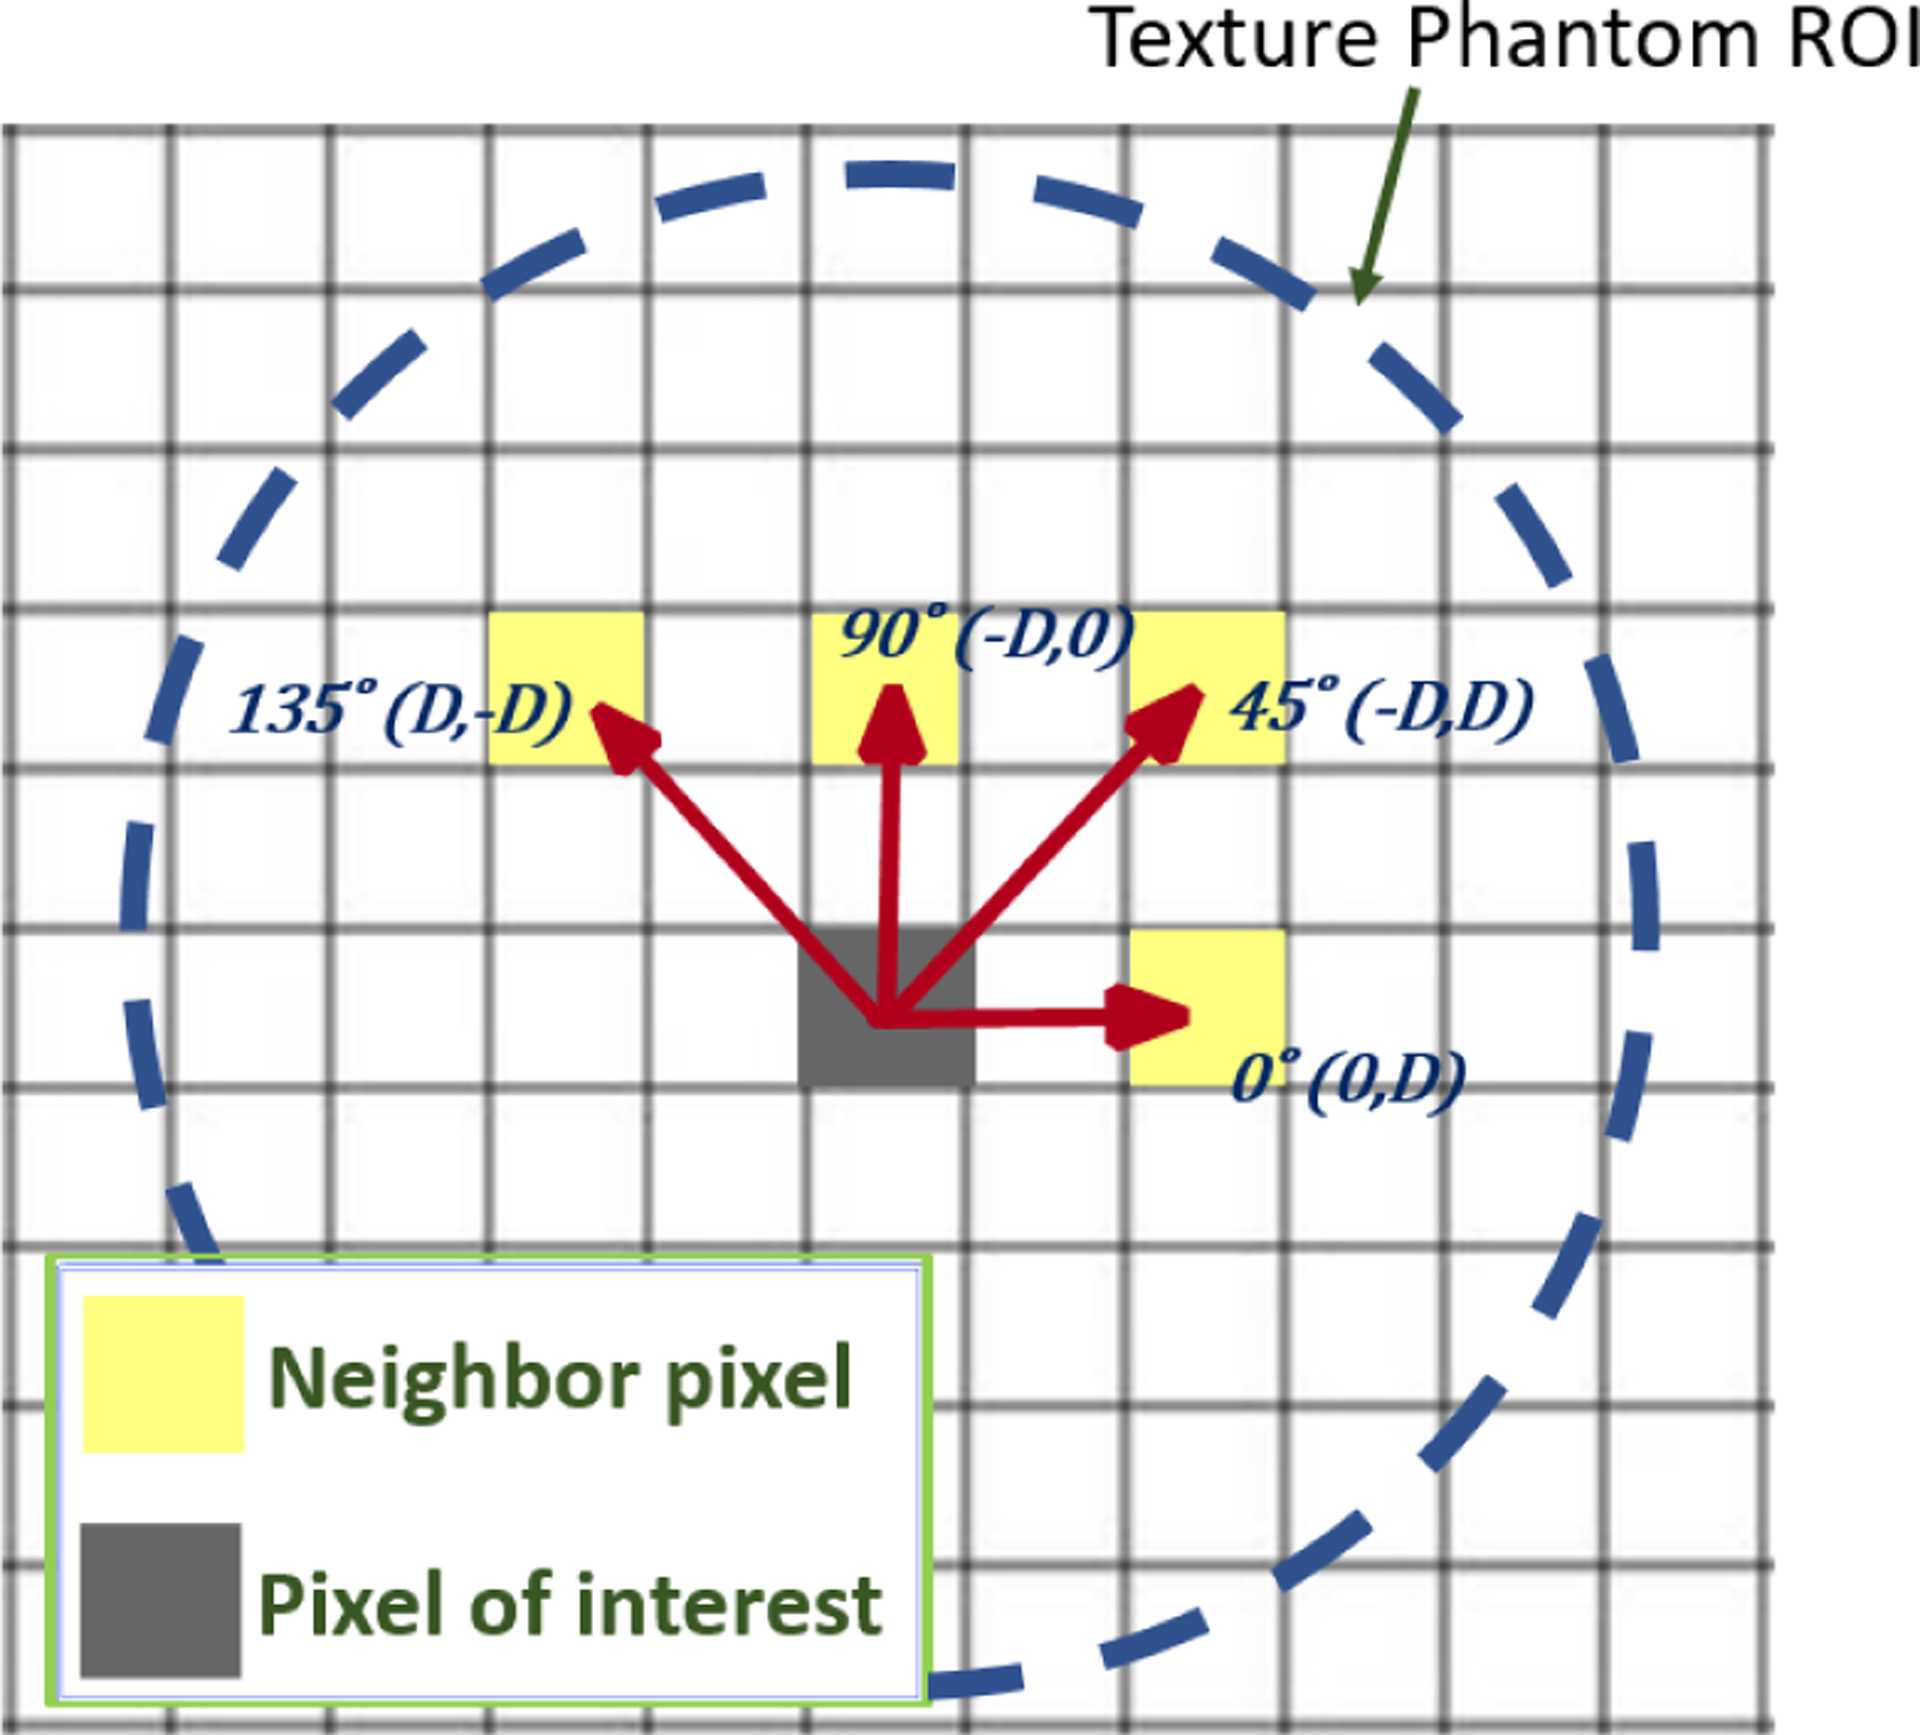
Illustration of the four GLCM offset directions used. Offset distance is computed as the distance to the origin in millimeters.
RESULTS
Three sample texture inserts (homogeneous 1 and 2 mm, and heterogeneous 1–2 mm spherical voids) are shown in Figure 3. We note that there is a difference between the digital design and the 3D-printed result. This is evident from the microCT scans, which are serving as a surrogate truth image (based on the very high resolution scan). In particular, we see that the SLA resin tends to cure “thicker” than the original digital design (in part due to the size of the laser focal spot). This makes the plastic walls of the texture thicker with smaller internal voids. There are also subtle differences in texture that may have to do with incomplete removal of uncured resin between printing and the secondary curing step. Cone-beam CT and CT scans show the reproduction of the insert texture for each modality and the different acquisition modes/reconstruction filters. The CBCT and HR-CT images look similar while the NR-CT images are clearly lower spatial resolution leading to a much different representation of the underlying textures. Additional differences between modalities are present due to positioning of the insert and the different slice thicknesses between modalities.
Figure 3:
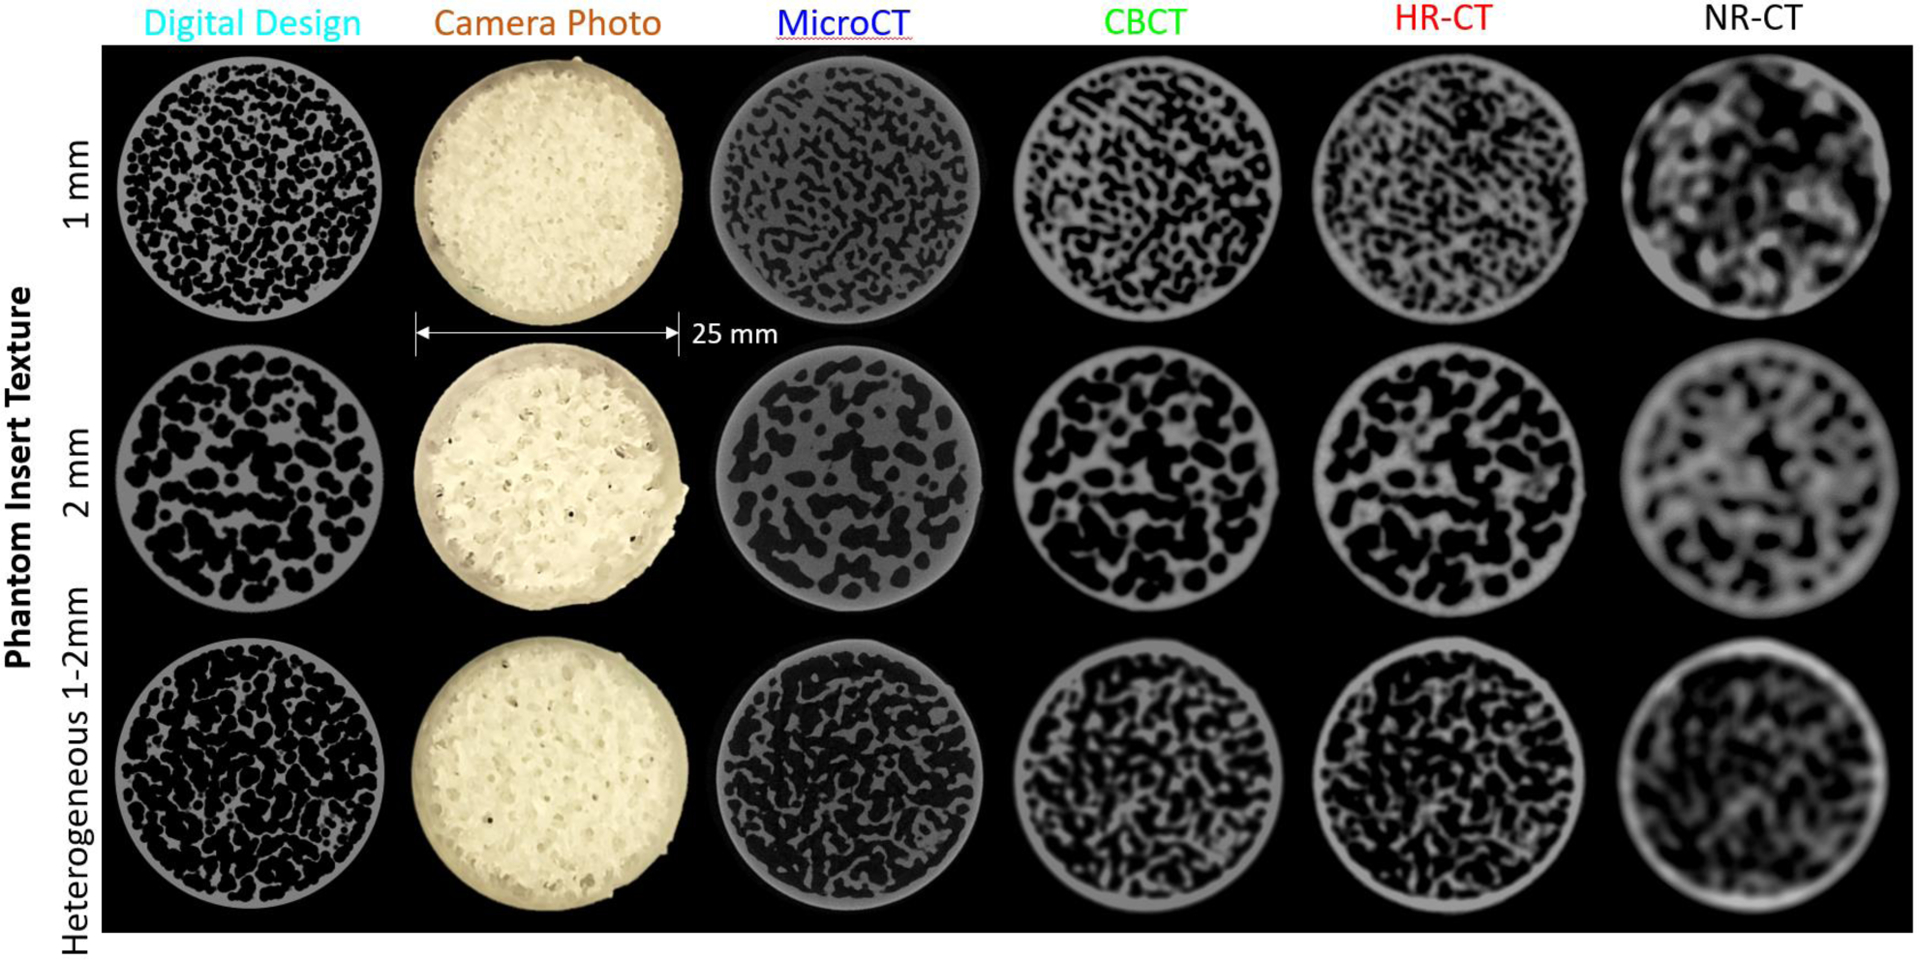
Illustration of three of the texture inserts with 1 mm and 2 mm homogeneous, and 1–2 mm heterogeneous spherical voids. In addition to the digital design and a photograph of the 3D print, scans of one slice of the insert are shown for microCT, cone-beam CT, high-resolution CT (HR-CT), and normal resolution CT (NR-CT) are shown.
A summary of the radiomics measures investigation is shown in Figure 4. Both GLCM-Correlation (top row) and GLCM-Homogeneity are shown as a function of offset distance. A number of trends are apparent. GLCM-Correlation decreases from a value of one, tends to fall to a minimum at a value slightly smaller than the void/feature size, and then asymptotically approaches zero. The microCT ground truth suggests that we are able to reproduce the GLCM-Correlation of the original design and that printing differences do not affect this particular metric. In contrast, both CBCT and HR-CT do not reproduce this metric perfectly – instead extending the location of the minimum to larger values. This is likely due to spatial resolution loss. We note that CBCT and HR-CT perform similarly in this regard with the most significant differences at the smallest feature sizes. However, NR-CT shows increased discrepancy and loses a well-defined minimum for the smaller feature sizes. Similar conclusions can be drawn from GLCM-Homogeneity; however, we note significant differences from the designed GLCM-Homogeneity. Again, CBCT and HR-CT show very similar GLCM-Homogeneity across feature sizes suggesting a similar ability to reproduce texture, though different than the microCT ground truth. Again, NR-CT is significantly different in its reproduction of texture and this is reflected in the GLCM-Homogeneity.
Figure 4:
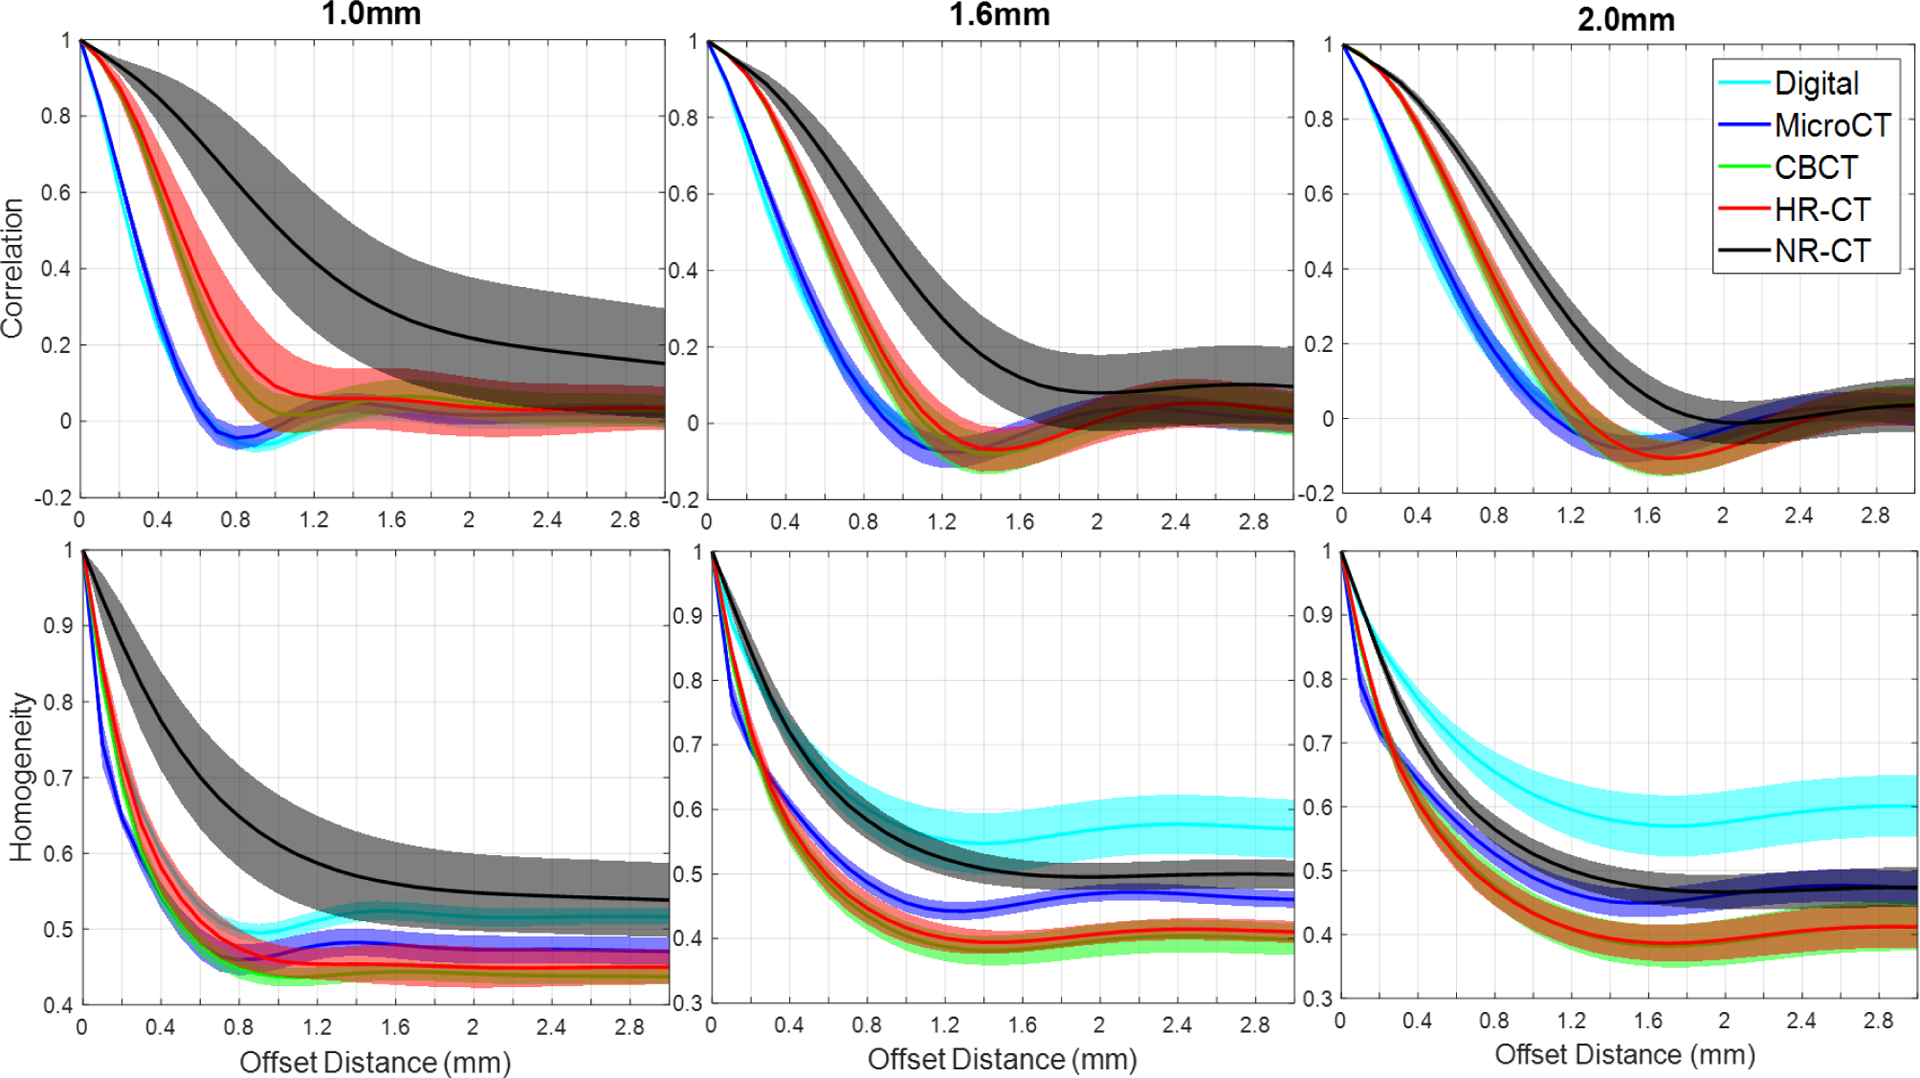
A summary of GLCM features, GLCM-Correlation (top row) and GLCM-Homogeneity (bottom row), as a function of offset distance for the different homogeneous inserts (i.e., varying void/feature size) and the different imaging modalities.
Noting the apparent connection between the first minimum in the GLCM-Correlation and the intrinsic void/feature size in the designed textures, we plotted the GLCM-Correlation minimum as a function of feature size for each of the modalities and performed linear fits for all but the NR-CT data. These results are summarized in Figure 5. We see that there is a strong linear relationship between GLCM-Correlation minimum and feature size with strong correlation across imaging methods except for NR-CT which does not appear to capture this aspect of the texture very well and has no defined minima for the smaller feature sizes. Similarly, there is no distinct minimum for the HR-CT approach at the smallest 1.0 mm size. Thus, it is not straightforward to deduce intrinsic features size using GLCM-Correlation for NR-CT or for HR-CT at the smallest investigated feature size.
Figure 5:
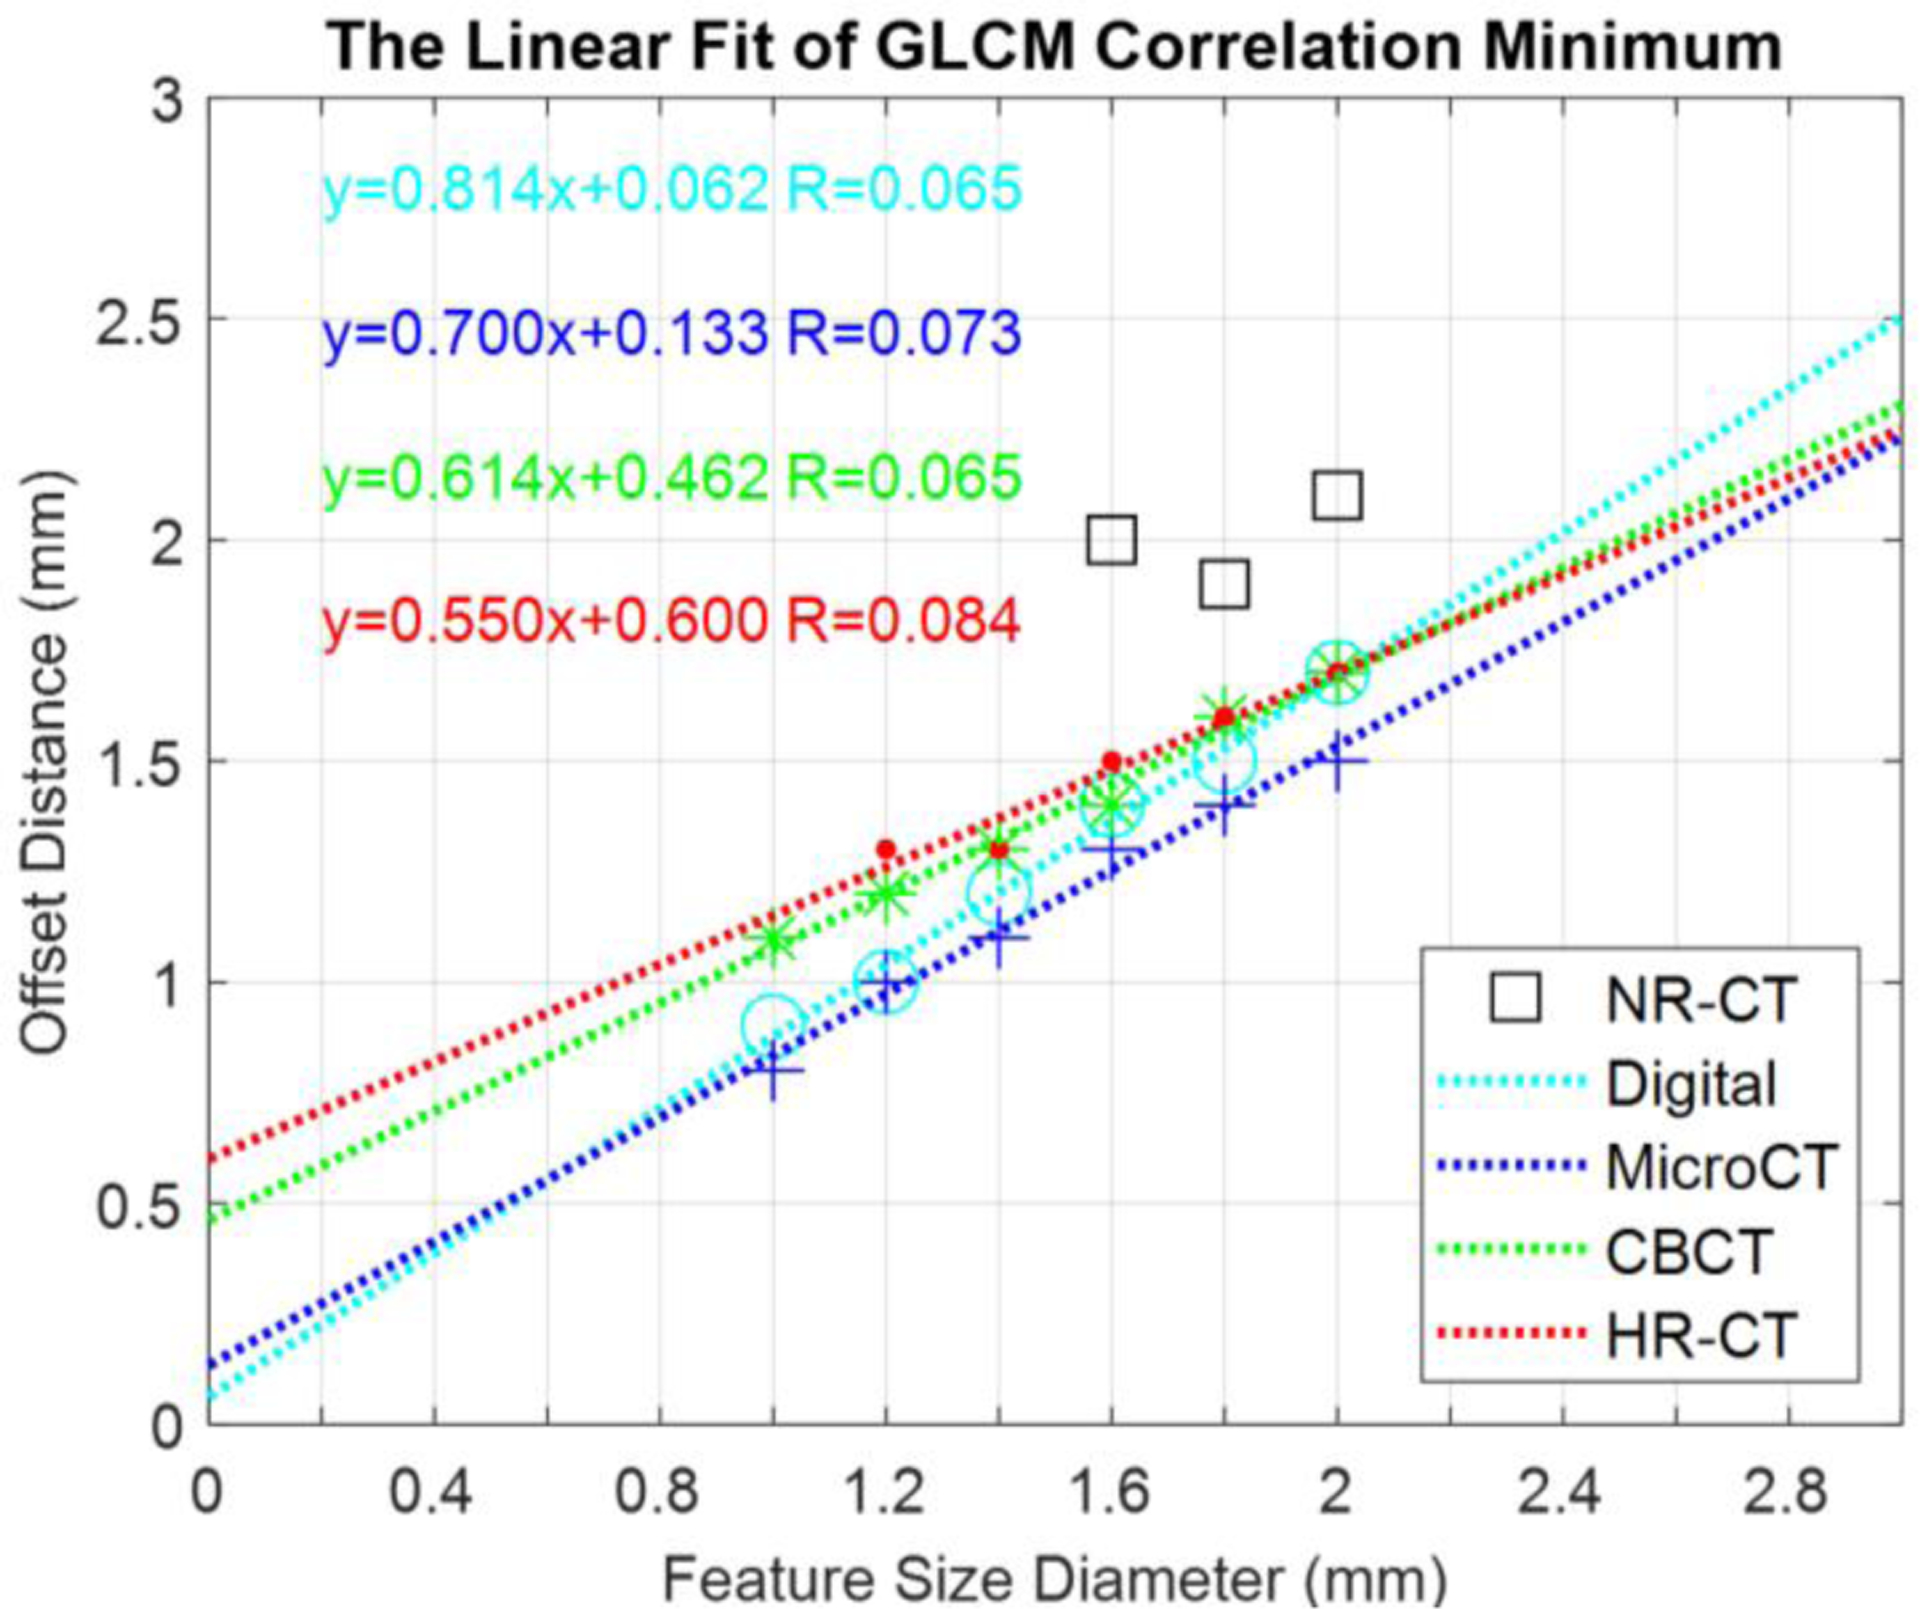
Plots of GLCM-Correlation Minimum for different modalities as a function of feature size.
Figure 6 shows the GLCM-Correlation and GLCM-Homogeneity for the heterogeneous inserts. These inserts have feature sizes covering the range of 1.0–2.0 mm. As such we see differences in the curves from previous studies – e.g., the GLCM-Correlation plots show a wider dip around the minimum due to the range of feature sizes. We draw similar conclusions from this experiment as the prior homogeneous inserts. In particular, GLCM-Correlation is reproduced between the digital design and the microCT while GLCM-Homogeneity is not. Again, we see similar reproduction of radiomics between the CBCT and HR-CT methods. NR-CT is significantly different in its radiomics, which we attribute to the significantly decreased spatial resolution.
Figure 6:
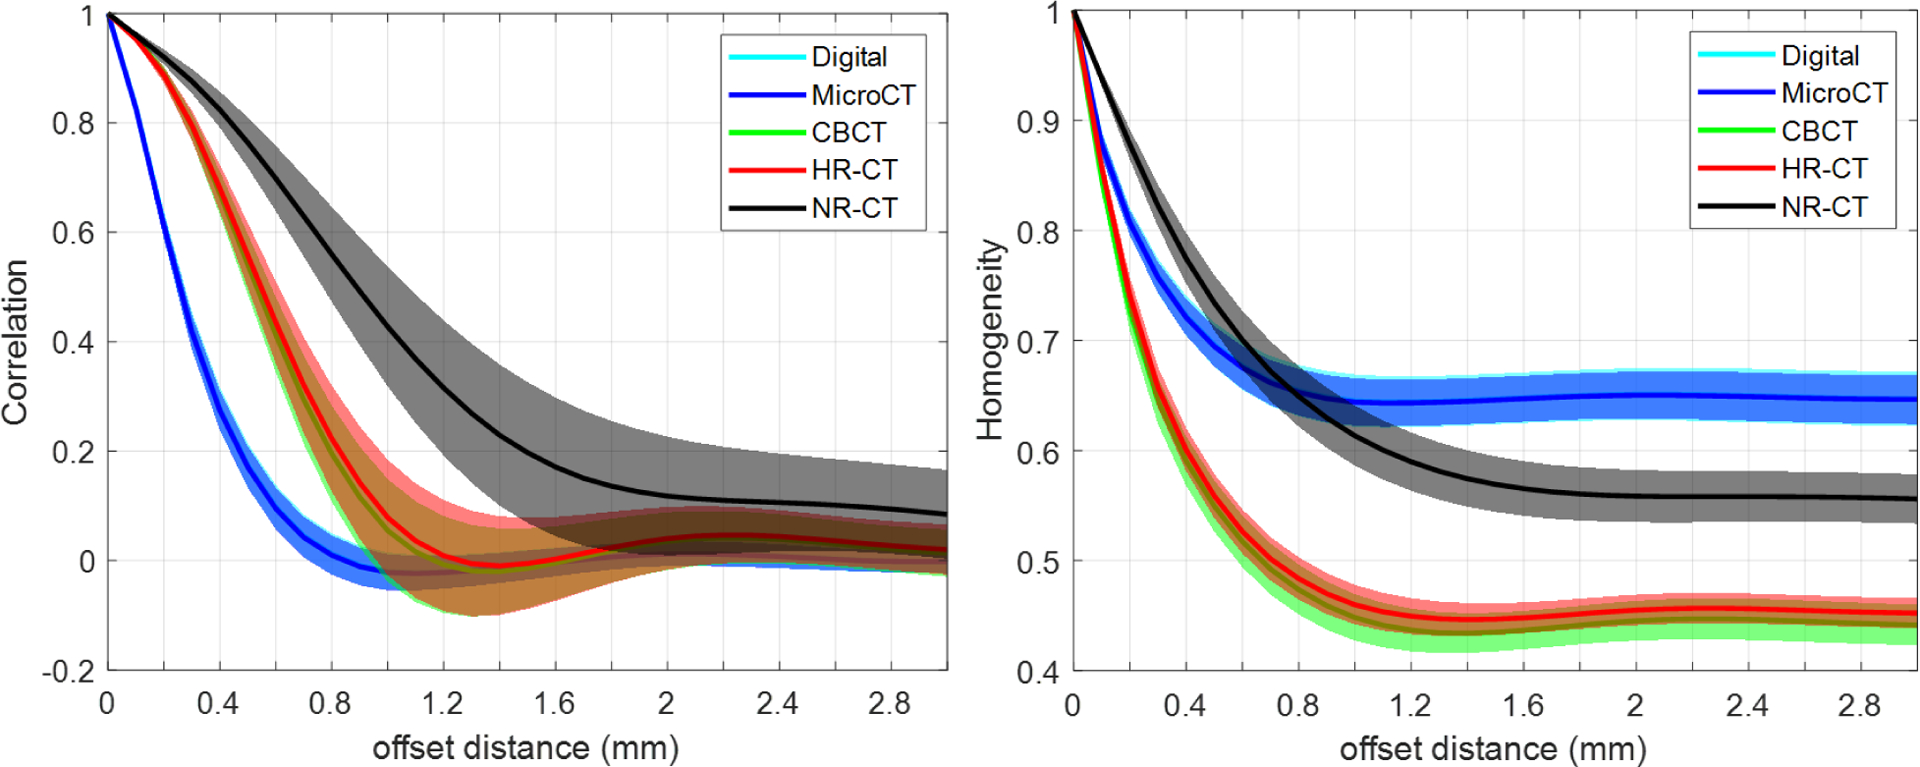
GLCM-Correlation and GLCM-Homogeneity for the heterogeneous inserts.
CONCLUSIONS
We have presented a methodology for investigation of textures in high-resolution CT systems. In particular, we have developed procedural texture generation methods and used 3D-printing to create high-resolution inserts that may be placed in an anthropomorphic phantom. Though not fully investigated here, a wide range of textures and contrasts are possible with this methodology. In our investigations we see differences between the original digital design and the 3D print using microCT as a gold standard. These differences (largely due to the finite resolution of the 3D-printer) create thicker resin walls than the design which alters many radiomics metrics (including GLCM-Homogeneity). Other metrics like GLCM-Correlation are well-reproduced. When scanned with a variety of CT methodologies, we see that decreased spatial resolution can have a significant impact on both the appearance of the texture as well as radiomics. In our investigations the HR-CT system was able to reproduce textures in a fashion very similar to the flat-panel-based cone-beam CT test bench that was used as a benchmark.
In ongoing and future work, we will be considering the impact of contrast on the reproducibility of the texture – by infusing the inserts with potassium phosphate solution to control contrast. Moreover, we will be placing these inserts within anthropomorphic phantoms to provide realistic noise levels as compared with human scanning. Other important aspects for investigation include advanced reconstruction algorithms including nonlinear approaches like model-based reconstruction and machine learning methods; and the development of textures and features more closely tied to specific imaging tasks (e.g. heterogeneity of specific lesion types).
Acknowledgement:
This research is supported, in part, by NIH Grant R01EB025829 and an academic-industry partnership with Canon Medical Systems. The authors would like to acknowledge help from Gengxin Shi for data conversion.
REFERENCES
- [1].Wilson J, Christianson O, Richard S, Samei E, “A methodology for image quality evaluation of advanced CT systems,” Medical Physics, 40(3), March 2013. [DOI] [PubMed] [Google Scholar]
- [2].Mackin D, et al. , “Measuring CT scanner variability of radiomics features,” Invest. Radiol 50(11) November 2015. [DOI] [PMC free article] [PubMed] [Google Scholar]
- [3].Solomon J, Mileto A, Nelson RC, Choudhury KR, Samei E, “Quantitative features of liver lesions, lung nodules and renal stones at multi-detector row CT examinations: Dependency on radiation dose and reconstruction algorithm,” Radiology, 279(1), April 2016. [DOI] [PubMed] [Google Scholar]


