INTRODUCTORY PARAGRAPH
Organogenesis is a complex and inter-connected process, orchestrated by multiple boundary tissue interactions1–7. However, it is currently unclear how individual, neighboring components coordinate to establish an integral multi-organ structure. Here, we report the continuous patterning and dynamic morphogenesis of hepatic, biliary and pancreatic structures, invaginating from a three-dimensional culture of human pluripotent stem cell (PSC). The boundary interactions between anterior and posterior gut spheroids differentiated from human PSCs enables autonomous emergence of hepato-biliary-pancreatic (HBP) organ domains specified at the foregut-midgut boundary organoids in the absence of extrinsic factor supply. Whereas transplant-derived tissues were dominated by midgut derivatives, long-term culture of micro dissected HBP organoids develop into a segregated hepato-pancreato-biliary anlage, followed by the recapitulation of early morphogenetic events including the invagination and branching of three different and inter-connected organ structures, reminiscent of tissues derived from mouse explanted foregut-midgut culture. Missegregation of multi-organ domains incurred by a genetic mutation in HES1 abolishes the biliary specification potential in culture, as seen in vivo8,9. Together, we demonstrate that the experimental multi-organ integrated model can be established by the juxta-positioning of foregut and midgut tissues, and potentially serves as a tractable, manipulatable and easily-accessible model for the study of complicated endoderm organogenesis in human.
The hepato-biliary-pancreatic (HBP) anlage, which is demarcated by HHEX (Hematopoietically-expressed homeobox protein) and PDX1 (Pancreatic and duodenal homeobox 1) expression is first specified at the boundary between the foregut-midgut10, and forms an epithelial vesicle invaginating ventrally from the primitive gut11–13. The disruption of boundary-defining genes around this area such as BMPR1A (Bone morphogenetic protein receptor, type 1A)1, HLX (H2.0-like homeobox)2, CDX2 (Caudal type homeobox 2)3, NKX3-2 (NK3 Homeobox 2)4, HHEX 5, PDX1 and SOX9 (SRY-box 9)6 significantly alters balanced organogenesis along the stomach-HBP-intestine in vivo1–7. Subsequent diversification of HBP lineages is likely mediated by adjacent mesenchymal BMP at their boundary by indirectly repressing SOX9 in the posterior liver bud cells14. Thus, contiguous, dynamic organogenesis occurs in a complex environment and is likely driven by successive neighboring tissue interactions5,6,15. However, the patterning and balanced HBP organogenesis has not been successfully modelled in tissue culture due to technical complexities, hindering detailed mechanistic studies16,17.
Here, we leverage a three-dimensional differentiation approach using human PSCs to specify gut spheroids with distinct regional identities comprised of both endoderm and mesoderm. We show that antero-posterior interactions recapitulate the foregut (marked by SOX2, SRY-Box 2) and the midgut (marked by CDX2) boundary in vitro, modeling the inter-coordinated specification and invagination in the human hepato-biliary-pancreatic organoid (HBPO).
To develop a foregut-midgut boundary, we first exposed definitive endoderm cells, patterned as previously described 18,19,20, to FGF4, and CHIR99021 in the presence or absence of a BMP antagonist for charting anterior (A) or posterior (P) gut fate (Fig. 1a and Extended Data Fig. 1a). At day (D) 7, SOX2+ anterior or CDX2+ posterior gut cells were aggregated to form spheroids, respectively (Extended Data Fig. 1b). We then transferred a posterior spheroid adjacent to an anterior spheroid. At D9, the two spheroids were fused in 94.8% of the wells, and fused spheroids were embedded into Matrigel, which was required for subsequent morphogenesis (Fig. 1a and Extended Data Fig. 1b). Surprisingly, without adding any exogenous factors, the HBP primordium emerged at the interface of the fused spheroids, as evidenced by the emergence of the early hepatic marker HHEX and the antrum, duodenum and pancreas progenitor marker PDX1 expressions at day10, wherein HHEX was only detectable at the boundary. Both PDX1 and HHEX positive cells were distinctively increased in the boundary region at D11 (Fig.1b). The use of three PSC lines confirmed the reproducibility in developing HHEX and PDX1 expressing cells at the boundary (Extended Data Fig. 1c–e). HBP progenitor induction critically requires the cell-to-cell contact between the anterior and posterior spheroids (Extended Data Fig. 2a and b). Of all the detected PDX1 positive cells at the boundary site (30 out of 30 stained samples) (Fig.1c), the percentage of PDX1 positive cells per total cell number was 5% in the boundary region while 0 and 1% in the anterior and the posterior region, respectively (Fig.1d). PDX1 expressing cells were observed in A-P and P-P combinations. In contrast, HHEX positive cells were only detected in A-P, but not in A-A nor P-P combinations (Fig. 1e and Extended Data Fig. 2c), indicating the balanced induction of the HBP progenitors requires A-P fusion.
Figure 1. Boundary organoid generates multi-endoderm domains.
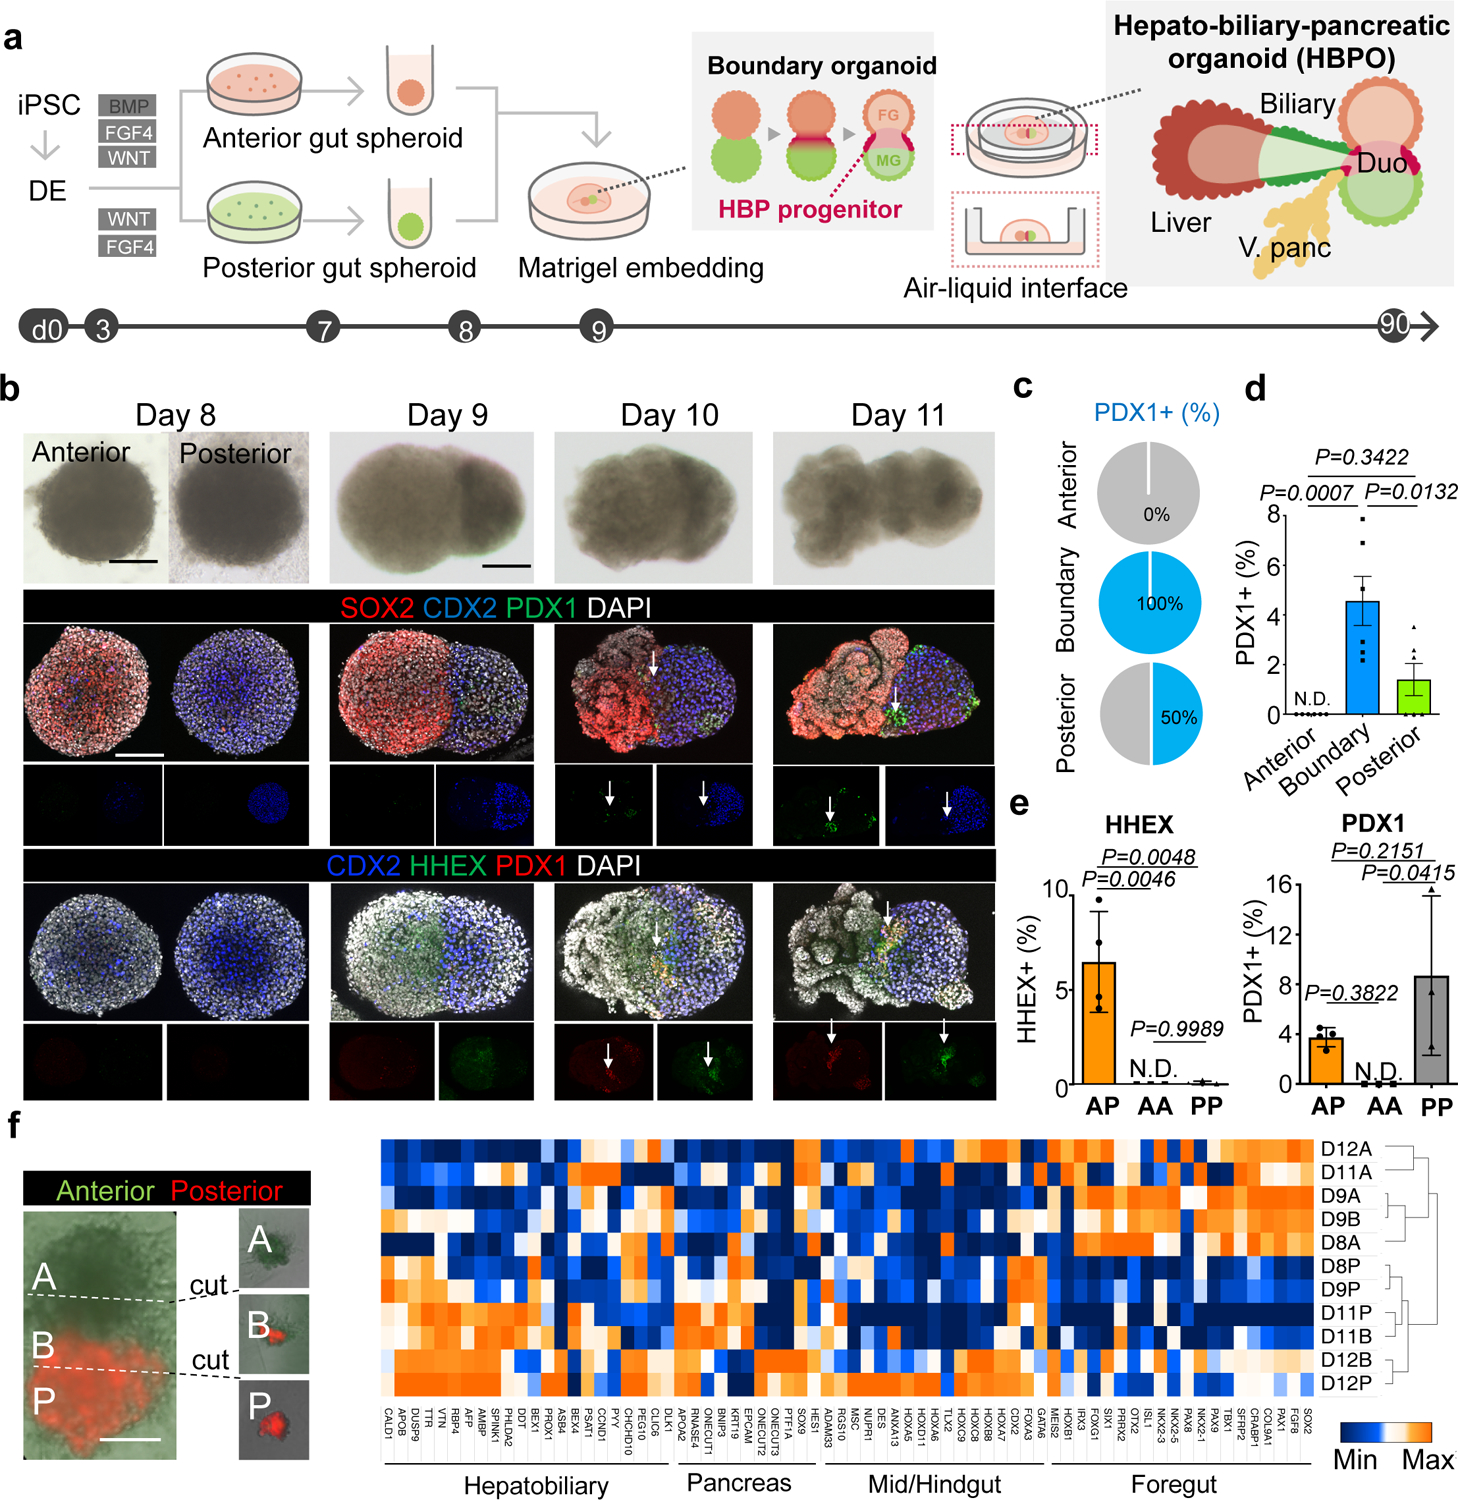
a. Schematic overview for the hepato-biliary-pancreatic (HBP) organoid from PSC (see, video S1).
b. Tracing of fused spheroids from day 8 to day 11. Upper: Bright-field. Middle: wholemount immunostaining for SOX2, PDX1 and CDX2. Lower: wholemount immunostaining for CDX2, HHEX and PDX1. Arrow: PDX1 and HHEX positive region. Independent 12 samples were analyzed with similar results.
c. Frequency of PDX1 positive cell in each area of fused spheroid.
d. Percentages of PDX1 positive cells in each area compared to DAPI stained total cells numbers. Data are mean ± s.e.m. (n = 6), one-way ANOVA, followed by Tukey’s test.
e. Percentage of HHEX and PDX1 positive cells in anterior-posterior (AP) (n = 4), anterior-anterior (AA) (n = 3) and posterior-posterior (PP) (n = 3) combination at day11 compared to total cell numbers. Data are mean ± s.d., one-way ANOVA, followed by Tukey’s test.
f. Transcriptomic characterization of boundary organoids using the gene-sets of anterior foregut, liver/biliary/pancreas primordium and mid/hindgut markers reported 32,33. From day 8 (D8) to day 12 (D12), anterior (A), boundary (B), and posterior (P) domains were dissected and applied for RNAseq as indicated in left representative image. Independent 12 organoids for D11 and 30 organoids for D9 and D12 were microdissected with similar results.
Scale bars, 50 µm (f), 100 µm (b).
To trace the source of HHEX and PDX1 expressing cells, the fused spheroids were established using non-labeled anterior and GFP-labeled posterior spheroids. We found that both HHEX and PDX1 expression overlapped with GFP, suggesting that the HBP progenitors originate from the posterior gut (Extended Data Fig. 3a). RNA-sequencing of D8, D9, D11 and D12 micro-dissected anterior, boundary and posterior regions showed that the boundary domains at D11 and D12 progressively expressed the arrays of HBP specification markers, whereas anterior or posterior regions gained foregut or mid/hindgut identity, respectively (Fig.1f). Taken together the AP fusion strategy orchestrates autonomous patterning of HHEX and PDX1 positive HBP progenitors in the absence of exogenous inductive factors.
Next, we established a reporter human iPSC to track their fate by visualizing tdTomato under the common progenitor marker of the liver, bile duct, and pancreas, a prospero-related homeobox 1 (PROX1) using CRISPR/Cas9 genome editing (Extended Data Fig. 4a). Similar to HHEX and PDX1, PROX1 expression initiated at the boundary at D10 and increased afterwards (Fig. 2a and Extended Data Fig. 4b). The PROX1 emergence was specific to the A-P, but not in A-A nor P-P combinations (Fig. 2b). A-P fusion assays indicated PROX1 positive cells also originated from the posterior gut cells (Extended Data Fig.3b and c). Air-liquid interface culture induced additional growth of the PROX1 area, as seen in E8.75 Prox1::EGFP mouse embryonic liver (Fig.2c). PROX1 immunostaining confirmed that the morphologically invaginating domain induced from the fused spheroids was similar to the boundary region of mouse at E8.5-8.75 (Fig. 2d).
Figure 2. Self-emergence of hepato-biliary-pancreatic progenitors from boundary organoid without inductive factors.
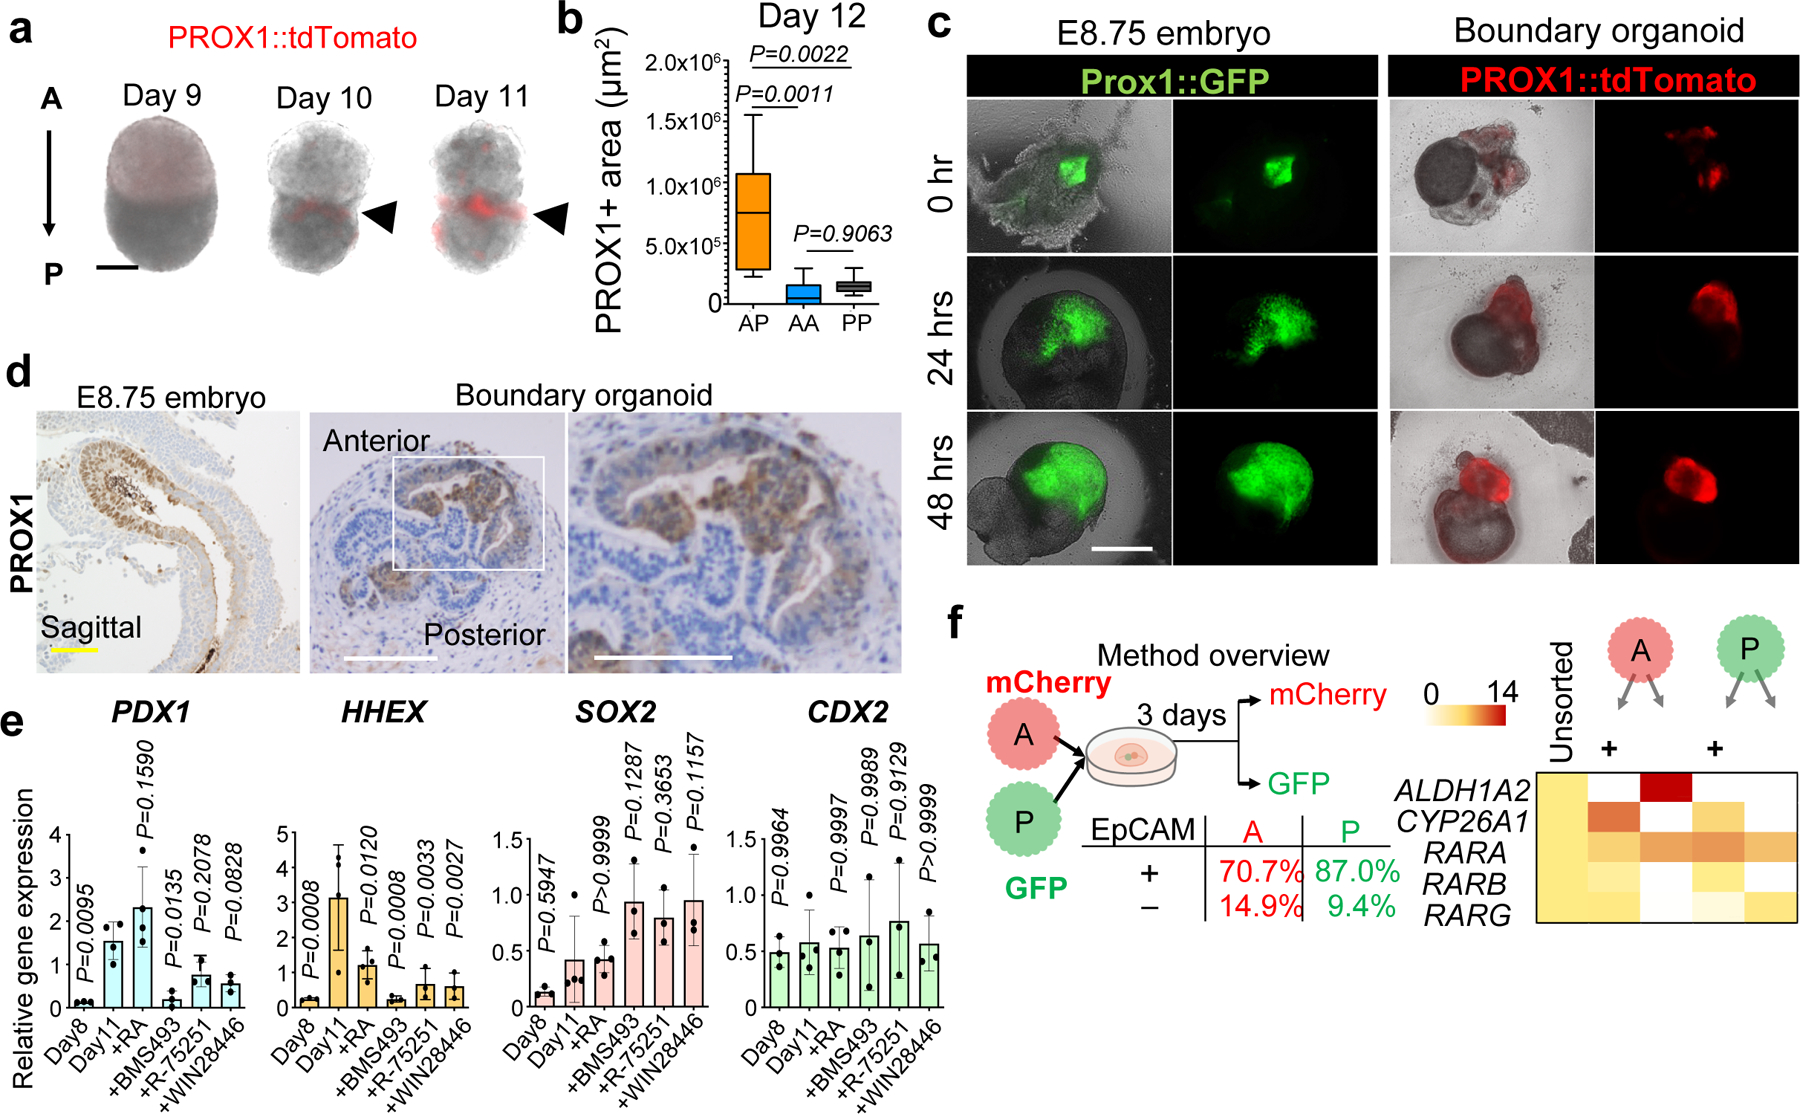
a. PROX1-tdTomato expression from day 9 to day 11. Independent 19 samples were taken image with similar results.
b. PROX1-tdTomato positive area in AP (n = 11), AA (n = 6) and PP (n = 7) combinations. Mean ± 25th and 75th percentile is shown by central and boxes; whiskers go down to the smallest and up to the largest. One-way ANOVA, followed by Tukey’s test.
c. Hepatic invagination in mouse liver primordium explant (Prox1::GFP) and human boundary organoids (PROX1::tdTomato). Independent three samples for mouse and four samples for organoid were analyzed with similar results.
d. Immunostaining of PROX1 in E8.75 mice embryo and boundary organoids at day13. The experiments were repeated twice for mice embryo and three times for organoid independently with similar results.
e. Gene expression of PDX1, HHEX, SOX2, and CDX2 at day11 with three days culture of retinoic acid (RA), BMS493, R-75251, or WIN18446. Data is mean ± s.d.; n = 4 independent experiments for Day11 control and RA, and n = 3 for others. one-way ANOVA and Dunnett’s test for multiple comparisons versus Day11 control.
f. Gene expression analysis for RA pathway in epithelial or mesenchymal cells from original anterior or posterior spheroids. Each gut spheroids were differentiated using mCherry or GFP labeled iPSCs and dissociated into single cells after boundary formation. Anterior/ Posterior separation was performed by mCherry or GFP expression, whereas epithelial / mesenchymal separation was by EpCAM expression.
Scale bars, 50 µm (a), 200 µm (c), 100 µm (d).
To delineate the HBP progenitor self-inductive mechanism, we evaluated the boundary specific expression profiles of known inductive signaling pathways. Amongst FGF, BMP, HH (hedgehog), NOTCH and RA (retinoic acid) signals, RNAseq identified that the signal of RA was activated prominently at the boundary, but not in the anterior or posterior regions (Extended Data Fig. 4c, Supplementary Table1 and 2). In support of this, the RA receptor antagonist BMS493 strongly suppressed the gene expression of both HHEX and PDX1 (Fig. 2e). Animal studies suggested that RA signaling has an important role in the lineage specification into the HBP systems21,22. Lateral plate mesoderm acts as an activator for RA signaling during the specification in vivo23–25. To implicate the cellular source for RA in our model system, RA signaling related genes were assessed in the isolated epithelial and non-epithelial populations. FACS analysis showed that there were 90.3% EpCAM positive epithelial cells in the anterior gut cells at day7, whereas EpCAM positive ratio decreased to 70.7 % in the anterior gut cells by day 12 due to non-epithelial cell expansion (Fig. 2f and Extended Data Fig. 1a). Interestingly, the anterior non-epithelial cells, but not in other populations, highly expressed the RA synthesis gene Aldehyde Dehydrogenase 1 Family Member A2 (ALDH1A2) similar to previous animal studies (Fig. 2f). Complementing this, exposing only the posterior, and not the anterior spheroid to BMS493 prior to fusion suppressed the protein-level induction of HHEX and PDX1 (Extended Data Fig. 5a). An E9.0 PROX1::GFP reporter mouse embryo, cultured with BMS493, also displayed significant inhibition of PROX1 expressing cells after 2 days (Extended Data Fig. 5b and c). Taken together, HBP progenitor self-specification in boundary model system is regulated by RA, potentially supported by co-differentiating anterior non-epithelial, most likely mesenchymal lineages.
It has been noted that stem cell-derived embryonic endodermal cells are highly plastic and usually generate intestinal tissues18,26. To examine whether there is an ability to form HBPOs from the fused spheroids in vivo, we performed transplantations of human PROX1+ spheroids into immunodeficient mice. One month-transplant derived tissues exhibited the small intestinal tissue markers Keratin 20 (CK20), CDX2, and EpCAM, but negligible expression of the other HBP markers (Extended Data Fig. 4d). In addition, the duodenum maker Receptor Accessory Protein 6 (REEP6 / DP1L1) and SOX9 expression pattern in the transplants were most similar to duodenum tissue (Extended Data Fig. 4d). Even upon transplantation of a micro dissected PROX1 positive domain, the cells failed to maintain the HBP fate (Extended Data Fig. 6a). as seen in the graft of mouse E9.0 embryonic Prox1 expressing portion (Extended Data Fig. 6b). These results indicated that despite the presence of HBP progenitors, ectopically transplanted organoids tend to develop intestinal tissues in vivo.
Because the fused spheroids generated predominantly duodenum tissue in vivo, we next excised PROX1 positive regions from the D13 boundary organoids and cultured them in a number of different formats to effectively model HBP organogenesis (Extended Data Fig. 7a and b). Strikingly, among the various tested culture conditions (Extended Data Fig. 7c), the air liquid interface system of excised PROX1+ domains continued the morphogenesis, and formed a branching structure, hereafter called HBPO (Extended Data Fig. 7b). Time course imaging showed the dissected PROX1+ domain changed from an epithelial morphology into a more convoluted structure during 2 days of culture (Extended Data Fig. 7d). Around D25, the PROX1+ epithelium in the HBPO started to invaginate and grow outward in multiple directions, progressively forming a branching structure (Fig. 3a and b). The branching structures were not observed in A-A and P-P combination (Extended Data Fig. 8a–d). Furthermore, the posterior region in D11 HBPO, which partially had expressed PDX1, were not capable of growing invaginating structures at D30 (Extended Data Fig. 8e).
Figure 3. Modeling human hepato-biliary-pancreatic organogenesis.
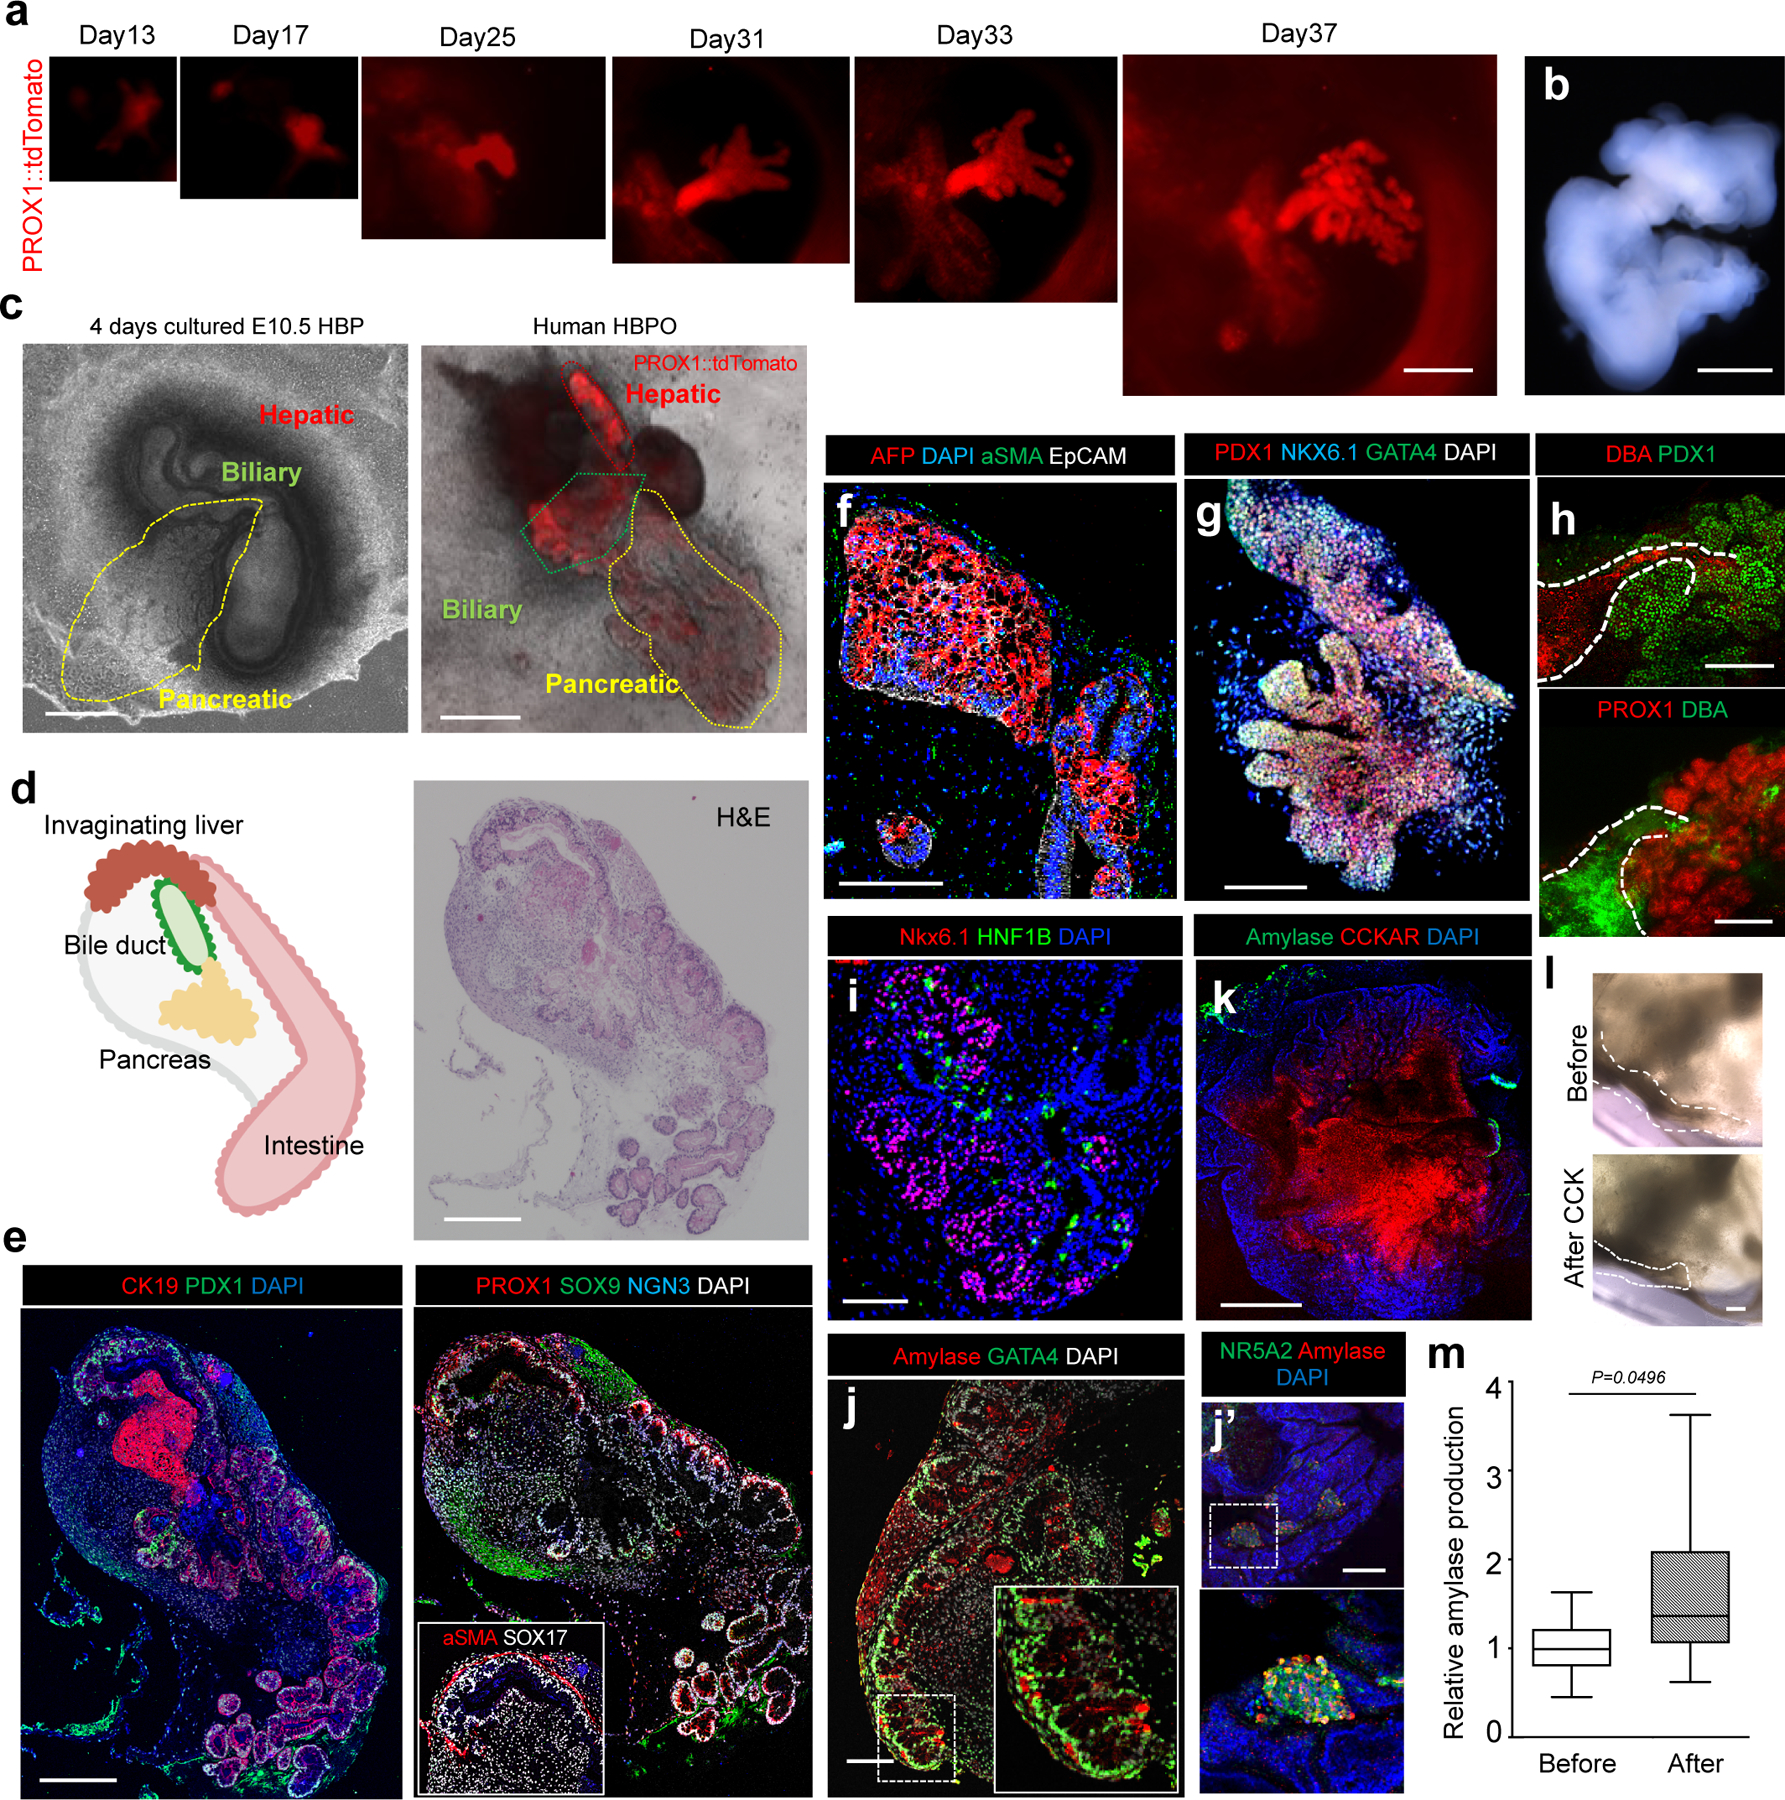
a. Morphogenetical change of PROX1 dissected domain through 30 days of air-liquid interface culture.
b. Stereomicroscopic image of day 37 organoids.
c. Boundary organoid has PROX1 expressing HBP domains branched out for putative pancreatic domains, similar to cultured mouse hepato-biliary-pancreas. Left: cultured mouse E10.5 embryonic tissue during 4 days, Right: PROX1-tdTomato HBP domain at day 90.
d. Left: Illustration of invagination liver, bile duct and pancreas connected with intestine. Right: H&E in D90 boundary organoid.
e-f. Immunostaining of CK19 and PDX1; PROX1, SOX9 and NGN3; and alpha-SMA and SOX17 (e) and AFP, EpCAM, and alpha-SMA (f).
g-h Wholemount staining of PDX1, NKX6.1 and GATA4 (g), DBA and PDX1; and PROX1 and DBA (h).
i-k. Immunostaining of NKX6.1 and HNF1B (i), Amylase and GATA4 (j) or NR5A2 (j’) and Amylase and CCKAR (k).
l. CCK treatment response in putative biliary structure.
m. Hormone induced secretory function of exocrine pancreatic domain. ELISA of amylase before and after 3 days- CCK treatment. Mean ± 25th and 75th percentile is shown by central and boxes; whiskers go down to the smallest and up to the largest. n =10 independent experiments. Unpaired two-tailed t-test.
The imaging experiments were repeated by independent two samples (b), three samples (d, e, f, h, i, j and k), four samples (c, g and l) and six samples (a) with similar results.
Scales, 100 µm (h, j), 200 µm (a, c, d, e, f, g, i), 1 mm (b), 500 µm (k), 50 µm (l).
To determine whether longer-term culture can produce more advanced tissue, we cultured the HBPOs until D90. The D90 organoids were morphologically similar to mouse explants, which were isolated from E10.5 and grown for 4 days in air liquid interface system (Fig. 3c). H&E staining showed that the long-term cultured HBPOs maintained HBP domains (Fig. 3d). Furthermore, the immunofluorescent staining detected the expression of the pancreas marker PDX1 and NGN3, the liver marker PROX1, and the bile duct markers CK19 and SOX9 in the organoids (Fig. 3e). Alpha-SMA expressing mesenchyme cells wrapped around bile duct SOX17+ cells similar to developing gallbladder tissue27 (Fig. 3e). Immunofluorescent staining with liver markers AFP and albumin, pancreatic markers PDX1, NKX6.1 and GATA4, and bile duct markers DBA and SOX9 confirmed that each lineage of primitive tissues segregated in the HBPOs after 30 days of culture (Fig. 3f–i and Extended Data Fig. 9). NKX6.1, HNF1B and GATA4 were differentially expressed on the PDX1+ region, and pancreatic mesenchymal marker NKX6.3 expression was observed alongside the PDX1+ cells, like in in vivo developing pancreas (Fig. 3f–i and Extended Data Fig. 9). Remarkably, the bile duct and pancreas domain are directly connected in branching organoids, as evidenced by whole mount co-staining of DBA, SOX9, and PDX1 and by the capacity to incorporate fluorescein-labelled bile acid (CLF) (Fig. 3h and Extended Data Fig. 9c). Moreover, at 90 days, the exocrine markers amylase and GATA4 was identified in the pancreatic component of HBPOs (Fig. 3j). Given the Cholecystokinin A Receptor (CCKAR) expression in the HBPOs (Fig. 3k), CCK responsive the pancreatic secretory function was analyzed with an amylase ELISA. The ductal structures constricted on the following day, and the CCK treated HBPOs increased amylase secretion in supernatants compared with untreated controls (Fig. 3l and m). These results indicate that the boundary organoid strategy not merely generates multiple organ (HBP) domains but also establishes a functional connection of the pancreas, especially exocrine lineage, and bile duct.
HES1 (Hes family bHLH transcription factor 1) is a transcription factor that regulates the posterior foregut lineage15,28. In Hes1 knock-out rodents, conversion of the biliary system to pancreatic tissue occurs due to failed pancreato-biliary segregation8,9. To elucidate whether the HBPO recapitulates HES1 mediated developmental process, we established HES1 KO on PROX1 reporter iPSCs by CRISPR/Cas9 system (Extended Data Fig. 10a–c), and confirmed the absence of HES1 gene expression in HES1−/− iPSC derived organoids (Extended Data Fig. 10d). HES1−/− HBPOs retained PROX1 reporter activity (Fig. 4a) and HHEX / PDX1 expression at the boundary at D11 (Fig. 4b). RNAseq of HES1−/− and HES1+/+ organoids at day 22 showed the significant upregulation of reported pancreatic associated murine genes, including endocrine markers, as HES1 targets9,29, in HES1−/− HBPOs (Fig. 4c and Extended Data Fig. 10e). qRT-PCR confirmed that the endocrine gene expression GCG and INS were significantly upregulated in HES1−/− HBPOs, compared with HES1+/+ (GCG: 264 fold; INS: 212 fold) (Fig.4d). Moreover, consistent with in vivo rodent studies, HES1−/− HBPOs produced less DBA and SOX9 positive ductal tissue and more PDX1 positive pancreatic structures (Fig. 4e and f and Extended Data Fig. 10d), highlighting the phenotypic relevance of the HBPO to in vivo phenotype.
Figure 4. Modeling HES1-mediated organ segregation error in HBPOs.
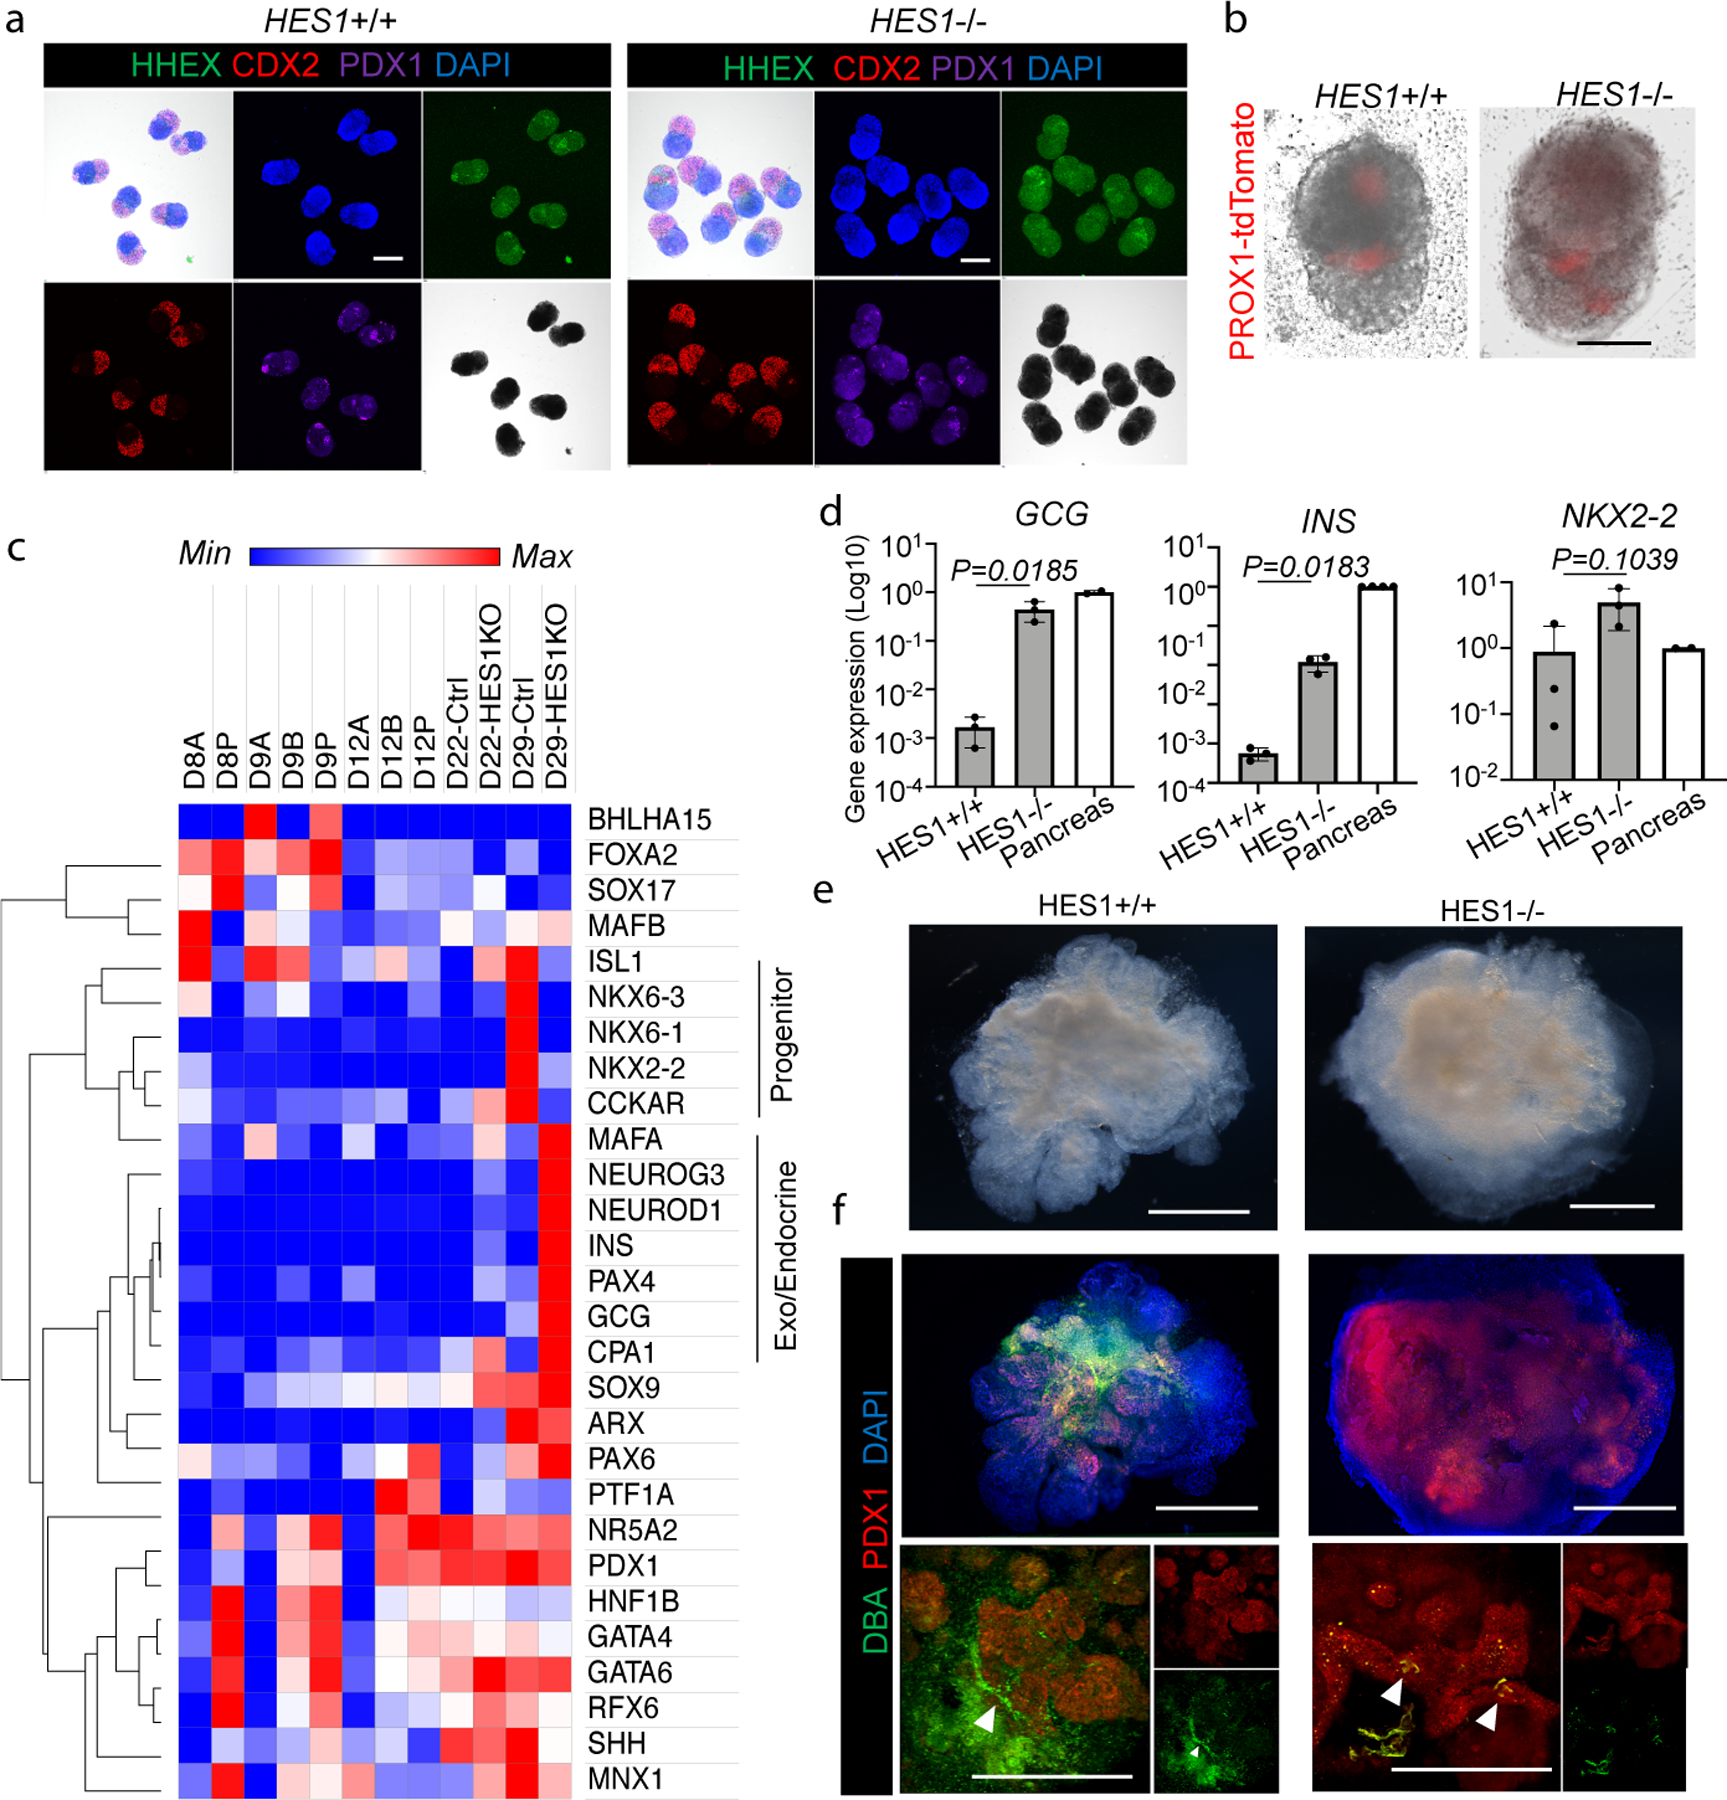
a. Confirmation of boundary domain formation from HES1 −/− iPSC by wholemount immunostaining of SOX2, CDX2, PDX1 and HHEX. Independent experiments were repeated twice with similar results.
b. PROX1-tdTomato expression in HES1 −/− organoids at D11. Representative of n = 6 independent organoids showing similar results.
c. RNAseq of pancreas associated markers at day22 of HES1 −/− HBPOs.
d. Log fold gene expression of GCG, INS, and NKX2–2 in HES1 −/− organoid and human adult pancreas. Data are mean ± s.d. n = 3 independent experiments for organoids. Unpaired, two-tailed t-test for HES1 +/+ and −/− organoids.
e. Macroscopic observation of boundary domain of HES1−/− organoid. Representative of n = 3 independent organoids showing similar results.
f. Wholemount staining for PDX1 and DBA in HES1 KO organoids. Representative of n = 3 independent organoids showing similar results.
Scale bars, 200 µm (a), 100 µm (b), 500 µm (e, f).
Multi-organ integration in stem cell culture is a critical unmet challenge. We demonstrate the generation of a human three-dimensional antero-posterior boundary system that leads to structurally and functionally integrated HBPOs developed at foregut-midgut border. Further HBP organogenesis, i.e. liver budding process including delamination of hepatic epithelial sheet by disruption of laminar layer, requires additional investigation that potentially requires additional stromal cell components, such as septum transversum mesenchyme and/or endothelial progenitors 30,31. Nevertheless, the in vitro contiguous specification and early morphogenesis of HBP subdomains open the opportunity for studying the complicated boundary interaction and for generating inter-connected, multi-organ structures within personalized human model systems for organogenesis and disease in vitro.
METHODS
Maintenance of PSCs
Human PSC lines were maintained as described previously. Undifferentiated hPSCs were maintained on feeder-free conditions in mTeSR1 medium (StemCell technologies, Vancouver, Canada) or Stem Fit medium (Ajinomoto Co, Japan) on plates coated either with Matrigel Growth Factor Reduced (Corning Inc., New York, NY, USA) at 1/30 dilution or iMatrix-511 (Nippi, Japan) at 0.25 ug/cm2 in an incubator with 5% CO2/95% air at 37°C. The TkDA3 human iPSC clone (RRID:CVCL_RJ54, passage number 37 to 47) used in this study was kindly provided by Drs. K. Eto and H. Nakauchi. The human 72_3 iPSC (passage number 44 to 46) and human H1 ESC (passage number 55 to 60) were provided from Pluripotent Stem Cell Facility in our institute.
Differentiation of PSCs into anterior and posterior gut spheroid
Differentiation of hPSCs into definitive endoderm was induced using previously described methods18,19 with modifications. In brief, colonies of hiPSCs were isolated in Accutase (Thermo Fisher Scientific Inc., Waltham, MA, USA) and 150,000 cells/mL were plated on Matrigel coated tissue culture plate (VWR Scientific Products, West Chester, PA). Medium was changed to RPMI 1640 medium (Life Technologies, Carlsbad, CA) containing 100 ng/mL Activin A (R&D Systems, Minneapolis, MN) and 50 ng/mL bone morphogenetic protein 4 (BMP4; R&D Systems) at Day 1, 100 ng/mL Activin A and 0.2 % fetal calf serum (FCS; Thermo Fisher Scientific Inc.) at Day 2 and 100 ng/mL Activin A and 2% FCS at Day 3. For Day 4–7, cells were cultured in gut growth medium (Advanced DMEM/F12 (Thermo Fisher Scientific Inc.) with 15 mM HEPES, 2 mM L-glutamine, penicillin-streptomycin, B27 (Life Technologies) and N2 (Gibco, Rockville, MD)) supplemented with 200 ng/mL noggin (NOG; R&D Systems), 500 ng/ml fibroblast growth factor 4 (FGF4; R&D Systems) and 2 µM CHIR99021 (Stemgent, Cambridge, MA, USA) for anterior gut cell induction and supplemented with 500 ng/ml FGF 4 and 3 µM CHIR99021 for posterior gut cell induction. Cultures for cell differentiation were maintained at 37°C in an atmosphere of 5% CO2 / 95% air and the medium was replaced every day.
Anterior-posterior boundary spheroid formation
On Day 7, anterior or posterior gut cells were dissociated to single cells by incubation with TrypLE Express (Life Technologies) at 37°C. Cells were centrifuged at 1000 rpm for 3 minutes and, after removing supernatant, the pellet was re-suspended in gut growth medium containing 10 uM of Y-27632 dihydrochloride (Tocris Bioscience, Bristol, United Kingdom). The anterior or posterior gut cell suspensions were plated on 96 well round bottom ultra-low attachment plate (Corning Inc) at density of 10,000 cells/well and incubated at 37°C for 24 hours to form spheroid. On Day 8, generated single anterior spheroid and posterior spheroid were mixed on 96 well round bottom ultra-low attachment plate in gut growth medium for 24 hours to form fused boundary spheroids (A-P spheroids).
Hepato-biliary-pancreatic organoid (HBPO) culture
On Day 9, A-P spheroids were embedded in Matrigel drop and were cultured in gut growth medium to generate multi-organ HBPOs. For longer-term culture, HBPOs were dissected and/or transferred to transwell for air-liquid interface culture at Day13. Cultures for spheroid were maintained at 37°C in an atmosphere of 5% CO2 / 95% air and the gut growth medium were replaced every 4 days. A step-by-step protocol describing HBPO organoid generation can be found at Protocol Exchange34.
Transplantation
Single HBPO at day 13 was transplanted into the subcapsule of the kidney in male immune deficient NSG (NOD.Cg-PrkdcscidIl2rgtm1Wjl/ SzJ) mice, aged 12 weeks old. All experiments were performed under the approval of the Institutional Animal Care and Use Committee of CCHMC (protocols IACUC2018-0096).
H&E staining and immunohistochemistry
Spheroid and organoid were collected from Matrigel, fixed in 4% paraformaldehyde (PFA) and embedded in paraffin. Sections were subjected to H&E and immunohistochemical staining. The primary antibodies were listed in supplementary table 3. Immunohistochemical staining was performed by using ultraView Universal DAB Detection Kit (Roche Diagnostics, Basel, Switzerland). The specimens were observed under a microscope.
For whole mount immunohistochemical staining, spheroid and organoid were collected from Matrigel and removed remaining Matrigel by treating with Cell recovery solution at 4°C for 30 min. The tissues were washed by PBS and were fixed in 4% PFA at 4°C for overnight. The fixed samples were treated by 4% PFA with 0.5 % Triton X100 at room temperature for 15 min and permeabilized with 0.1% Tween 20 (Sigma) at room temperature for 15 min. The samples were treated with blocking solution (1% BSA, 0.3% Triton X100) at room temperature for 1 hour and were incubated overnight at 4°C with the primary antibodies diluted in blocking solution. After washing, fluorescent dye-conjugated secondary antibodies were applied to the samples at room temperature for 2 hours. The primary and secondary antibodies were listed in supplementary table 3. After the secondary antibody reaction, the samples were washed three times. Nuclei were stained with DAPI mounting solution.
The stained section and whole mount samples were observed under a Nikon A1Rsi inverted confocal microscope.
RNA isolation, RT-qPCR
RNA was isolated using the RNeasy mini kit (Qiagen, Hilden, Germany). Reverse transcription was carried out using the SuperScript IV First-Strand Synthesis System for RT-PCR (Invitrogen, CA, USA) according to manufacturer’s protocol. qPCR was carried out using TaqMan gene expression master mix (Applied Biosystems) on a QuantStudio 3 Real-Time PCR System (Thermo). All primers and probe information for each target gene was obtained from the Universal ProbeLibrary Assay Design Center (https://qpcr.probefinder.com/organism.jsp) and listed in supplementary table 4.
RNA sequencing
Sample preparation for RNA sequencing was performed using SMART-seq v4 Ultra Low Input RNA Kit for Sequencing (Clontech Laboratories) according manufacture’s user manual.
Briefly, First-strand cDNA synthesis was primed by the 3’ SMART-seq CDS Primer II A and uses the SMART-Seq v4 Oligonucleotide for template switching at the 5’ end of the transcript. PCR Primer II A amplified cDNA from the SMART sequences introduced by 3’ SMART-Seq CDS Primer II A and the SMART-Seq v4 Oligonucleotide by PCR. PCR-amplified cDNA was purified by immobilization on AMPure XP beads. The beads were then washed with 80% ethanol and cDNA was eluted with Elution Buffer. Amplified cDNA was validated using the Agilent 2100 Bioanalyzer and Agilent’s High Sensitivity DNA Kit (Agilent) according Kit User Manual. The full-length cDNA output of the SMART-Seq v4 Ultra Low Input RNA Kit for Sequencing was processed with the Nextera XT DNA Library Preparation Kit (Illumina).
The RNA profiles were compiled with Kallisto software and expressed as transcripts per million (TPM). The data sets filtered by the threshold requiring greater than 0 in at least 1 sample were first subjected to gene functional classification based on gene sets related to FGF, BMP, Hedgehog, NOTCH and RA signaling pathway. The lists of gene sets were acquired from Molecular Signatures Database (ver 6.2). Cluster analysis for filtered data sets performed by using Cluster 3.0 software. Detail of gene sets included in each cluster were listed in supplementary table 1. GSEA (http://software.broadinstitute.org/gsea/index.jsp) analysis was applied to identify significant enrichment of pathway genes across genes between the different regions in fused organoid. GSEA results for comparison of anterior-boundary and boundary-posterior combinations in day9, 11 and 12 RNAseq data was listed in supplementary table 2. Significant difference was validated by false discovery rate (FDR) q value < 0.25.
Flow cytometry.
For flow cytometry, Anterior gut cells were differentiated from GFP-Labeled iPSCs and posterior gut cells were differentiated from mCherry-Labeled iPSCs. At day13, A-P spheroid were dissociated to single cells by the treatment of TrypLE Express for 10 min at 37°C. After PBS wash, the single cells were incubated with BV421-conjugated EpCAM antibody (BioLegend) at room temperature for 30 min. After PBS wash, cell sorting was performed by BD FACS AriaII (BD Biosciences). Analysis was performed by BD FACS DIVA software and FlowJo (FlowJo, LLC).
CRISPR Editing
The plasmid encoding Cas9-2A-GFP was acquired from addgene (#44719, doi: 10.1016/j.stem.2013.03.006). Guide RNA targeting the N-terminus of PROX1 or HES1 was synthesized by Integrated DNA Technologies, cloned into the pGL3-U6-sgRNA-PGK-puromycin vector (addgene #51133, doi: 10.1038/nmeth.2857) and sequenced using the RV3 universal primer. To construct the HDR template, homology arms flanking the PROX1 start codon were independently amplified from genomic DNA and then fused to tdTomato via overlap extension PCR using the high-fidelity taq polymerase iProof (Bio-Rad). The resulting PCR product was then cloned into the pCR-Blunt II-TOPO cloning vector (Invitrogen) and confirmed by Sanger sequencing.
Human iPSCs were transfected with 2μg of each plasmid using the Lipofectamine 3000 following the manufacturer’s instructions. Twenty-four hours after transfection, cells were sorted by GFP expression to select for positively transfected cells. Clonal cells were expanded for 2 weeks and screened for inserted PROX1-tdTomato or depleted HES1 exon1 sequence and karyotyped.
Amylase ELISA.
To measure Amylase secretion level of organoids, 200 μL of culture supernatant was collected from organoid embedded in Matrigel. The culture supernatants were collected at 72 hrs time points after the culture and stored at - 80°C until use. The supernatant was centrifuged at 1,500 rpm for 3 min and to pellet debris, and the resulting supernatant was assayed with Human Amylase ELISA Kit according to the manufacturer’s instructions.
Mouse whole embryo culture
The Rotator-type Bottle Culture System (Ikemoto Scientific Technology Co., Ltd) was used for whole embryo culture. E9.0 Prox1-GFP mouse embryo was dissected and transfer to culture bottle with Advanced DMEM/F12 supplemented B27 and N2 supplements. The temperature inside the whole embryo culture system was kept at 37.0 ℃.
Statistics and reproducibility.
Statistical analysis was performed using unpaired two- tailed Student’s t-test, Dunn-Holland-Wolfe test, or Welch’s t-test. Results were shown mean ± s.d or s.e.m.; P values < 0.05 were considered statistically significant. N-value refers to biologically independent replicates, unless noted otherwise. For comparisons between more than 2 samples, we performed one-way analysis of variance (ANOVA), followed by Tukey’s test, Dunnett’s test, non-parametric Kruskal-Wallis and post hoc Dunn-Holland-Wolf test.
Extended Data
Extended Data Fig. 1: Anterior and posterior gut cell specification and boundary organoid formation.
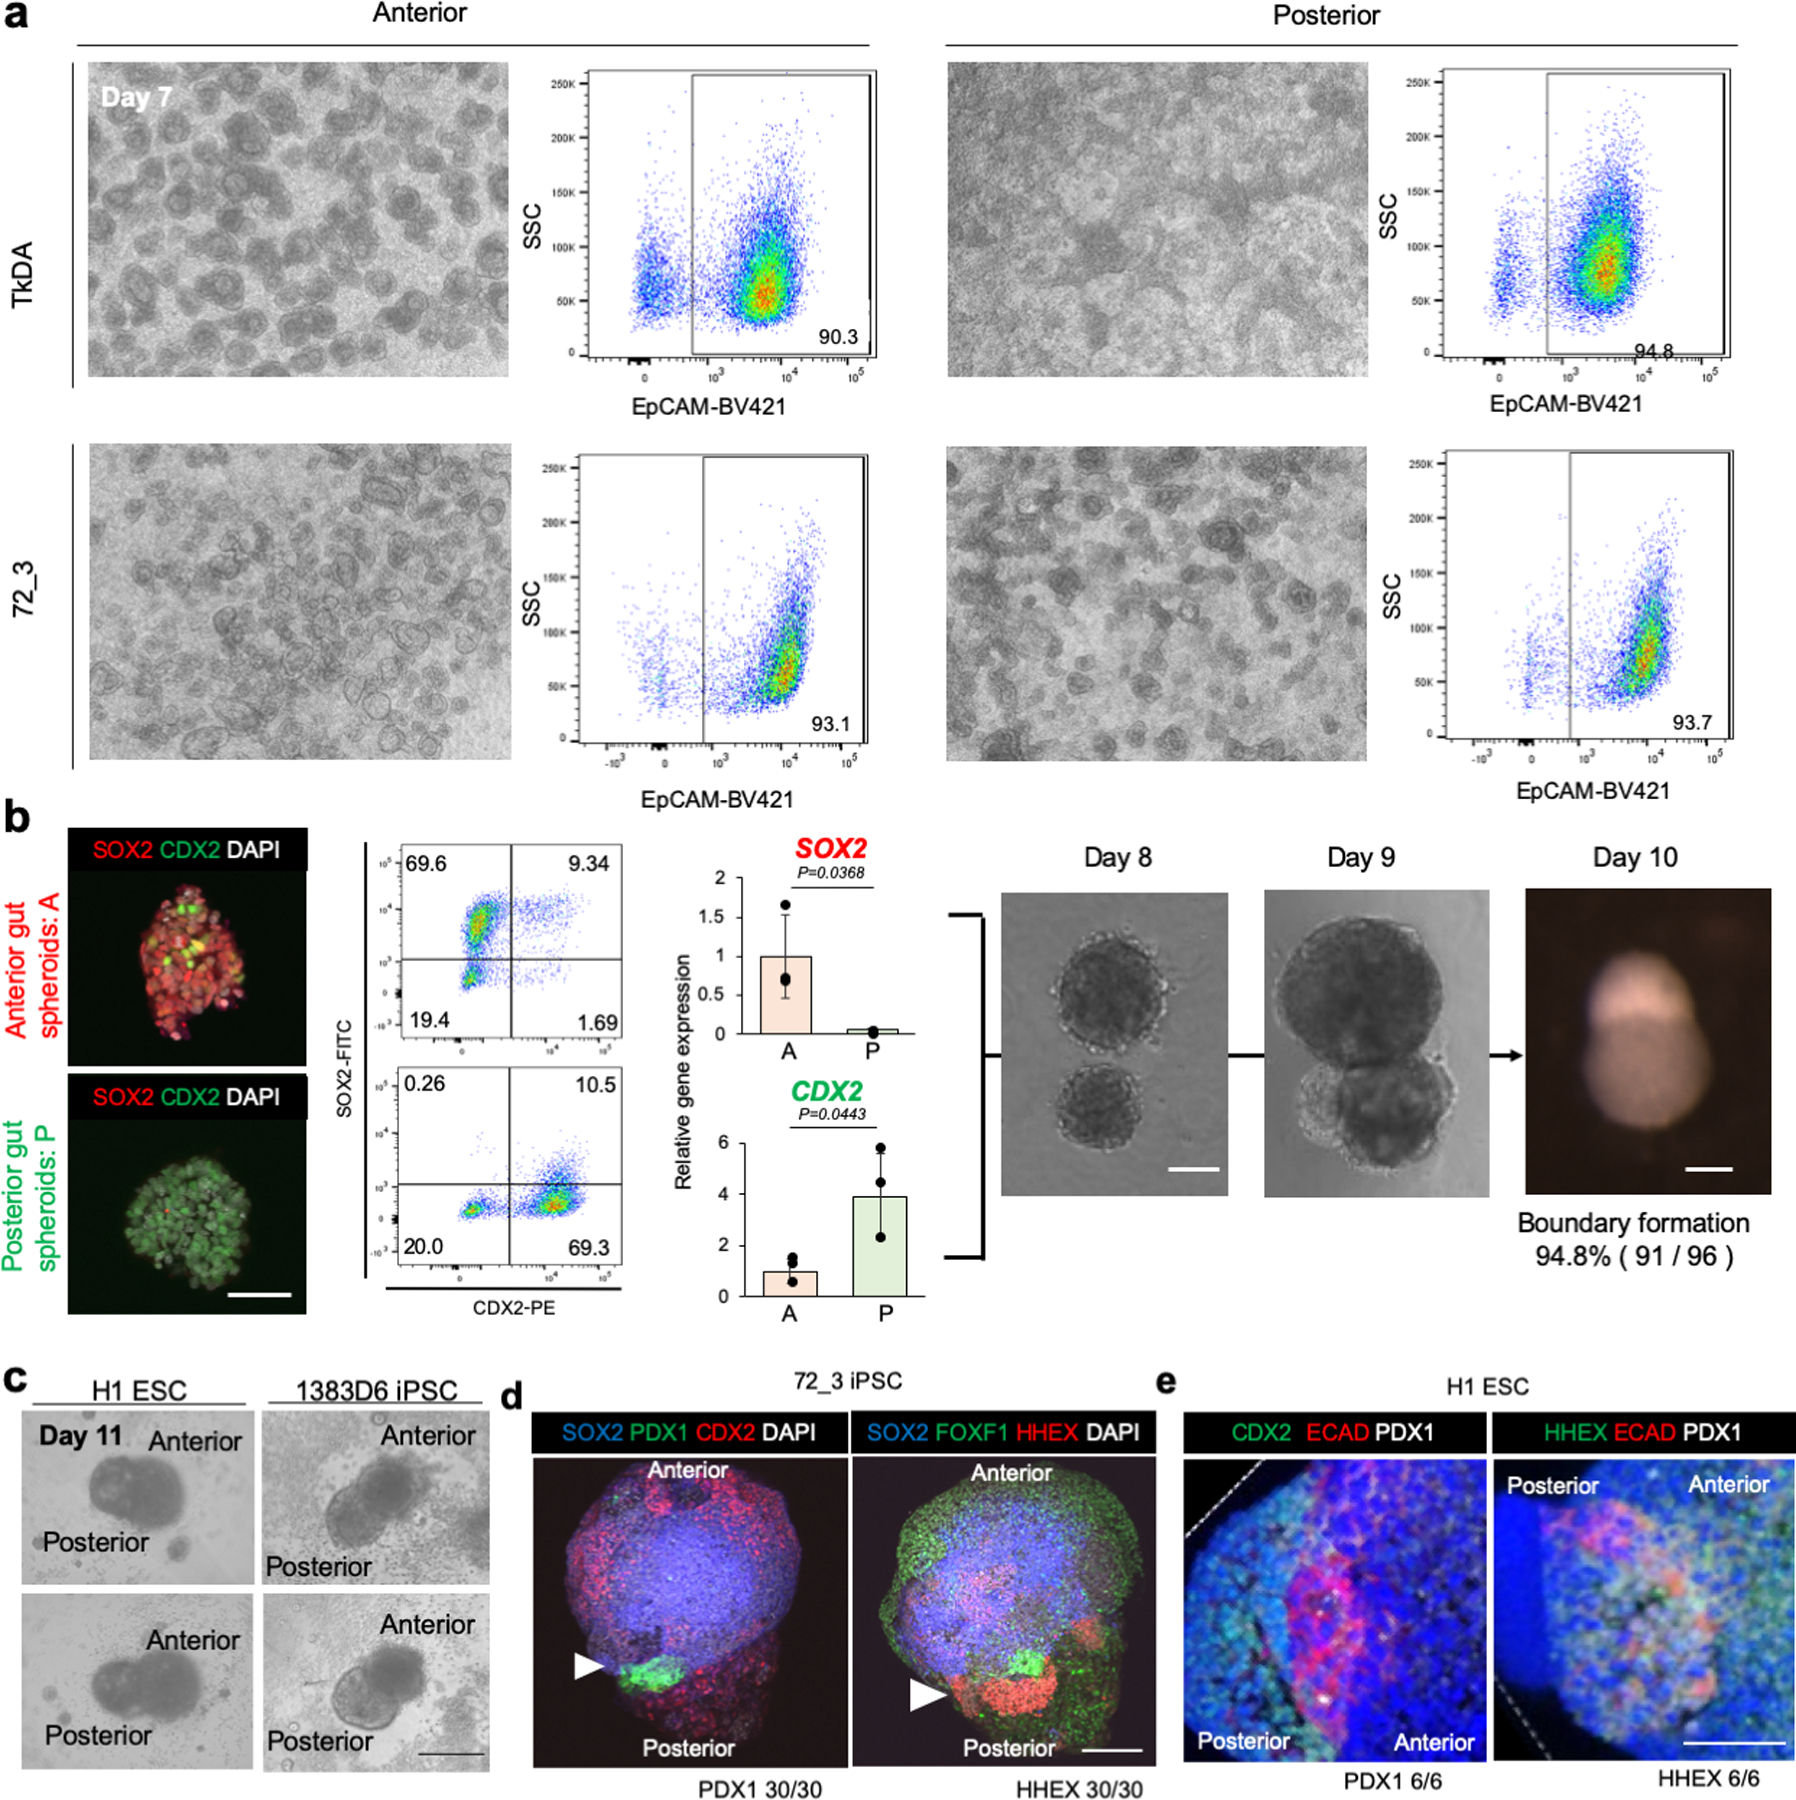
a. Flow cytometry of EpCAM in day 7 anterior and posterior gut cells using TkDA human iPSCs and 72_3 human iPSCs. The gating strategy was FSC A / SSC A > FSC H / FSC W > SSC H / SSC W > PI / FSC A > EpCAM-BV421 / SSC A. Representative image of independent three experiments showing similar results.
b. Wholemount immunostaining, flowcytometry with percentage of each population showed in inlet, and qPCR for SOX2, CDX2, and organoid images of each time point. Data is mean ± s.d.; n =3 independent experiments. Unpaired, two-tailed t-test. Scale bars, 50 µm
c. The image of day 11 boundary organoids. Anterior and posterior gut spheroids were differentiated from H1 ESCs or 1383D6 iPSCs, mixed and transferred into Matrigel. Independent experiments repeated twice for each line with similar results. Scale bar is 200 μm.
d. Wholemount Immunofluorescent staining of PDX1, CDX2, FOXF1, and HHEX in boundary organoids derived from 72_3 iPSC at day 12. Representative image of n = 30 Independent organoids showing similar results. Arrowhead indicates boundary of organoid. Scale bar is 100 μm.
e. Wholemount immunofluorescent staining of CDX2, E-Cadherin, and HHEX in boundary region of boundary organoids derived from H1 ESC at day 12. Representative image of n = 6 Independent organoids showing similar results. Scale bar is 50 μm.
Extended Data Fig. 2: Cell-cell contact of anterior-posterior gut spheroids induced HBP marker expression.
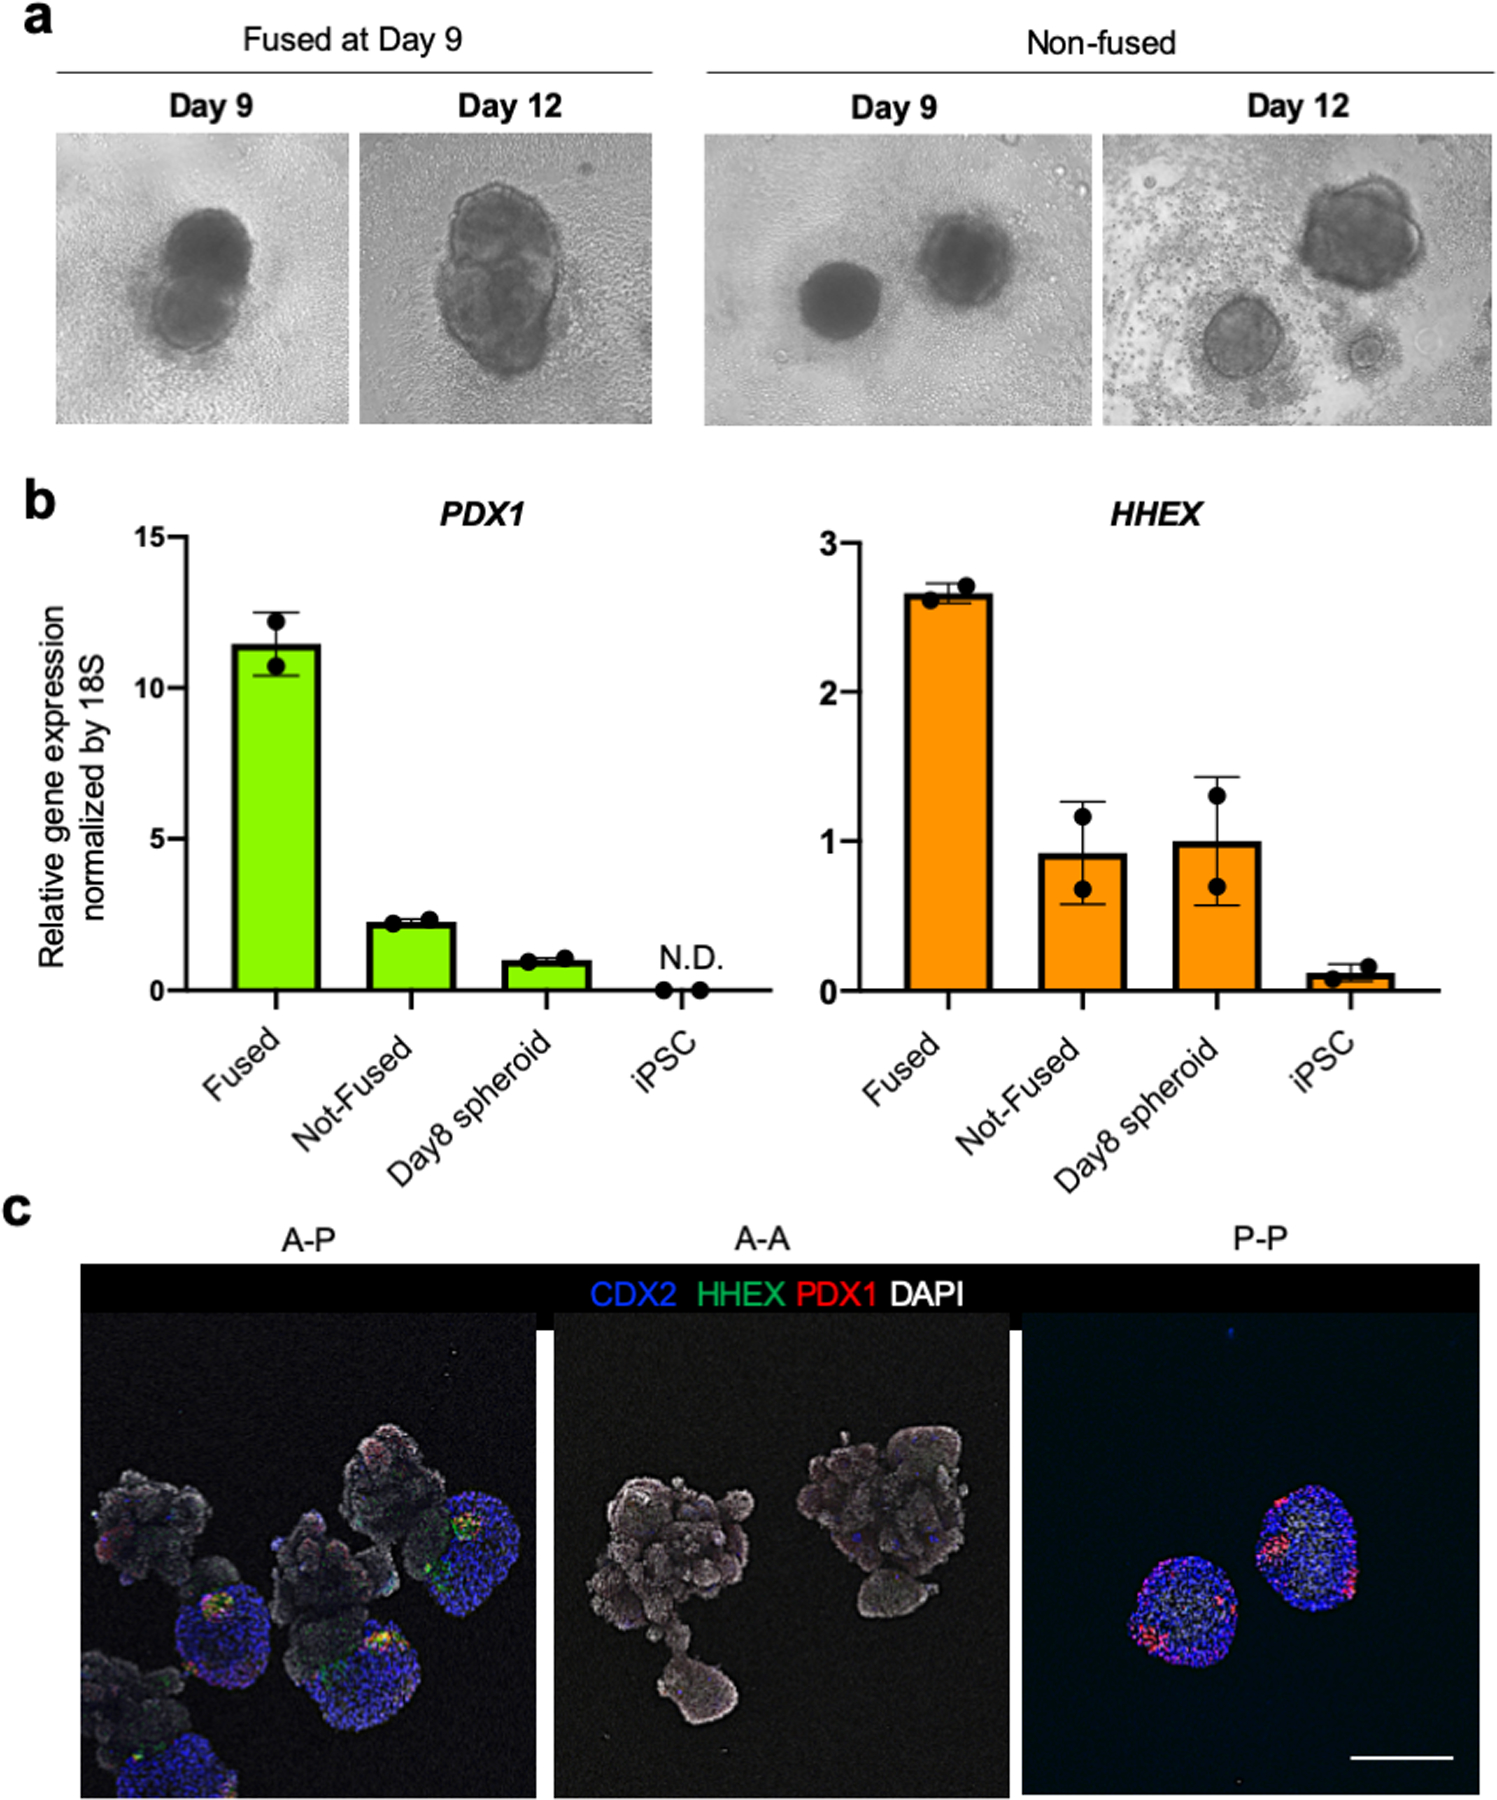
a. Anterior and posterior spheroids were mixed at Day 8, fused the following day at Day 9, cultured and collected at Day 12 for quantitative RT-PCR. The spheroids that not fused were also collected at Day 12 for comparison. Independent experiments repeated twice with similar results.
b. PDX1 and HHEX gene expressions in the condition of fused, not-fused, posterior spheroid (day8), and iPS cells. Data are mean ± s.d. from two independent experiments.
c. Comparison of different anterior and posterior gut combinations. Immunofluorescent staining of CDX2, HHEX, and PDX1 in the combination of AP, AA, and PP spheroids at D12. Representative of n = 4 for AA and PP, and n= 6 for AP independent organoids showing similar results. Scale bar is 200 μm.
Expended Data Fig. 3: HBP progenitors developed from posterior gut cells.
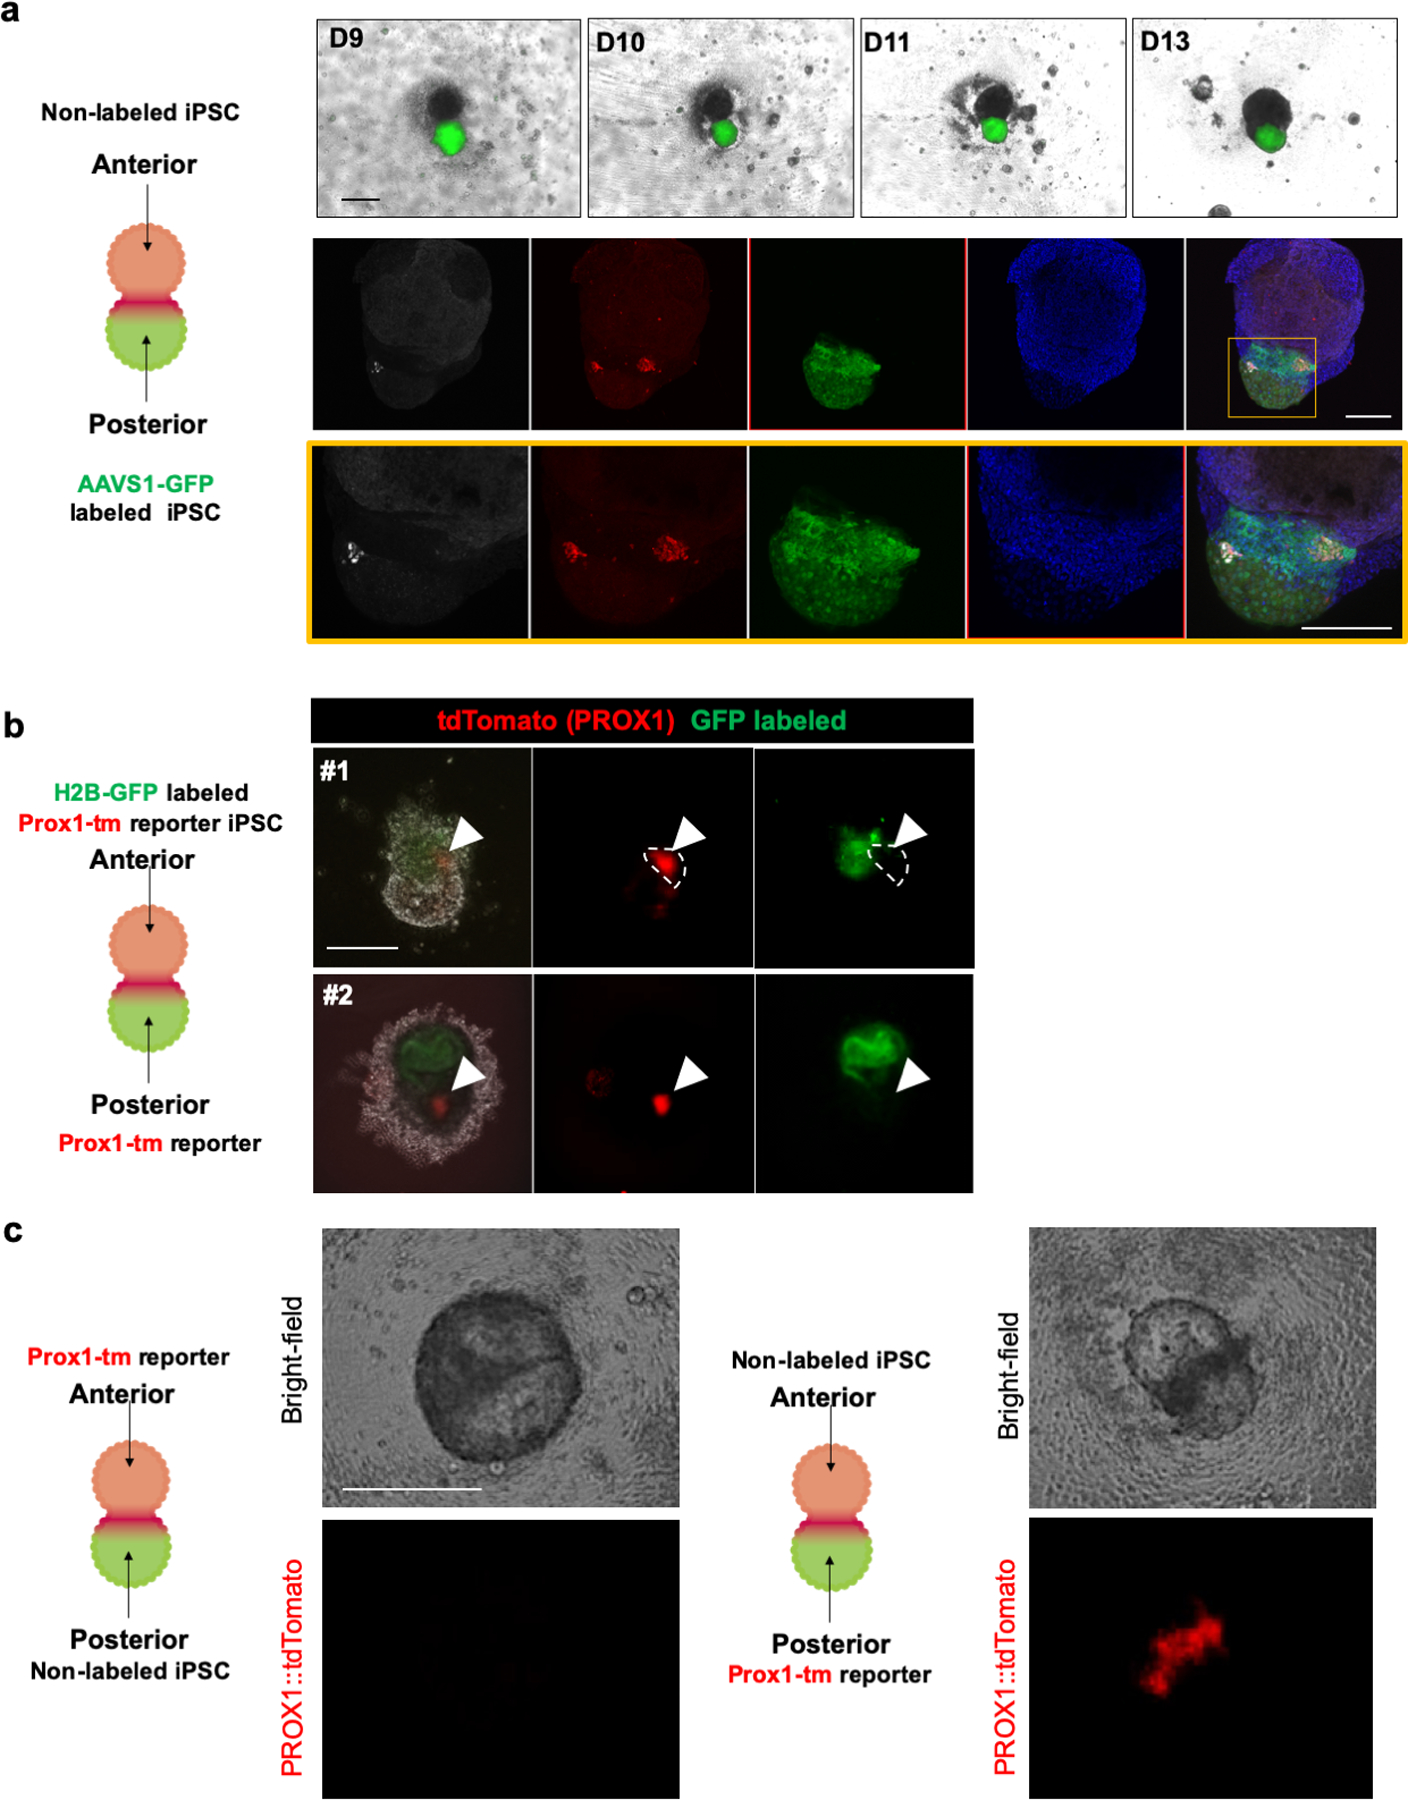
a. Non labeled iPS cells were differentiated into anterior spheroid while AAVS1-GFP labeled iPS cells were differentiated into posterior spheroid. Top column showed bright field and GFP fluorescent image during boundary organoid formation. Bottom column showed whole mount immunostaining for HHEX and PDX1 at day13. The HHEX expression was overlapped with GFP expression. Top and bottom column were representative of n = 3 independent organoids showing similar results. Scale bar is 200 μm.
b. H2B-GFP labeled and unlabeled PROX1::tdTomato reporter iPSCs were differentiated into anterior and posterior spheroid, respectively. tdTomato expression was only detected in unlabeled original posterior gut spheroid. Independent experiments were repeated twice with similar results. Scale bar is 200 μm
c. Using unlabeled iPSCs and PROX1::tdTomato reporter iPSCs, anterior and posterior gut spheroids were differentiated. Two combinations, reporter cell derived anterior and unlabeled cell posterior (left column), or unlabeled cell derived anterior and reporter cell derived posterior spheroid (right column) were examined by tdTomato expression. Top row: bright field image, bottom row: tdTomato fluorescence image. Representative of n = 3 independent organoids showing similar results. Scale bar is 200 μm
Expended Data Fig. 4: characterization of HBP progenitors from boundary organoid.
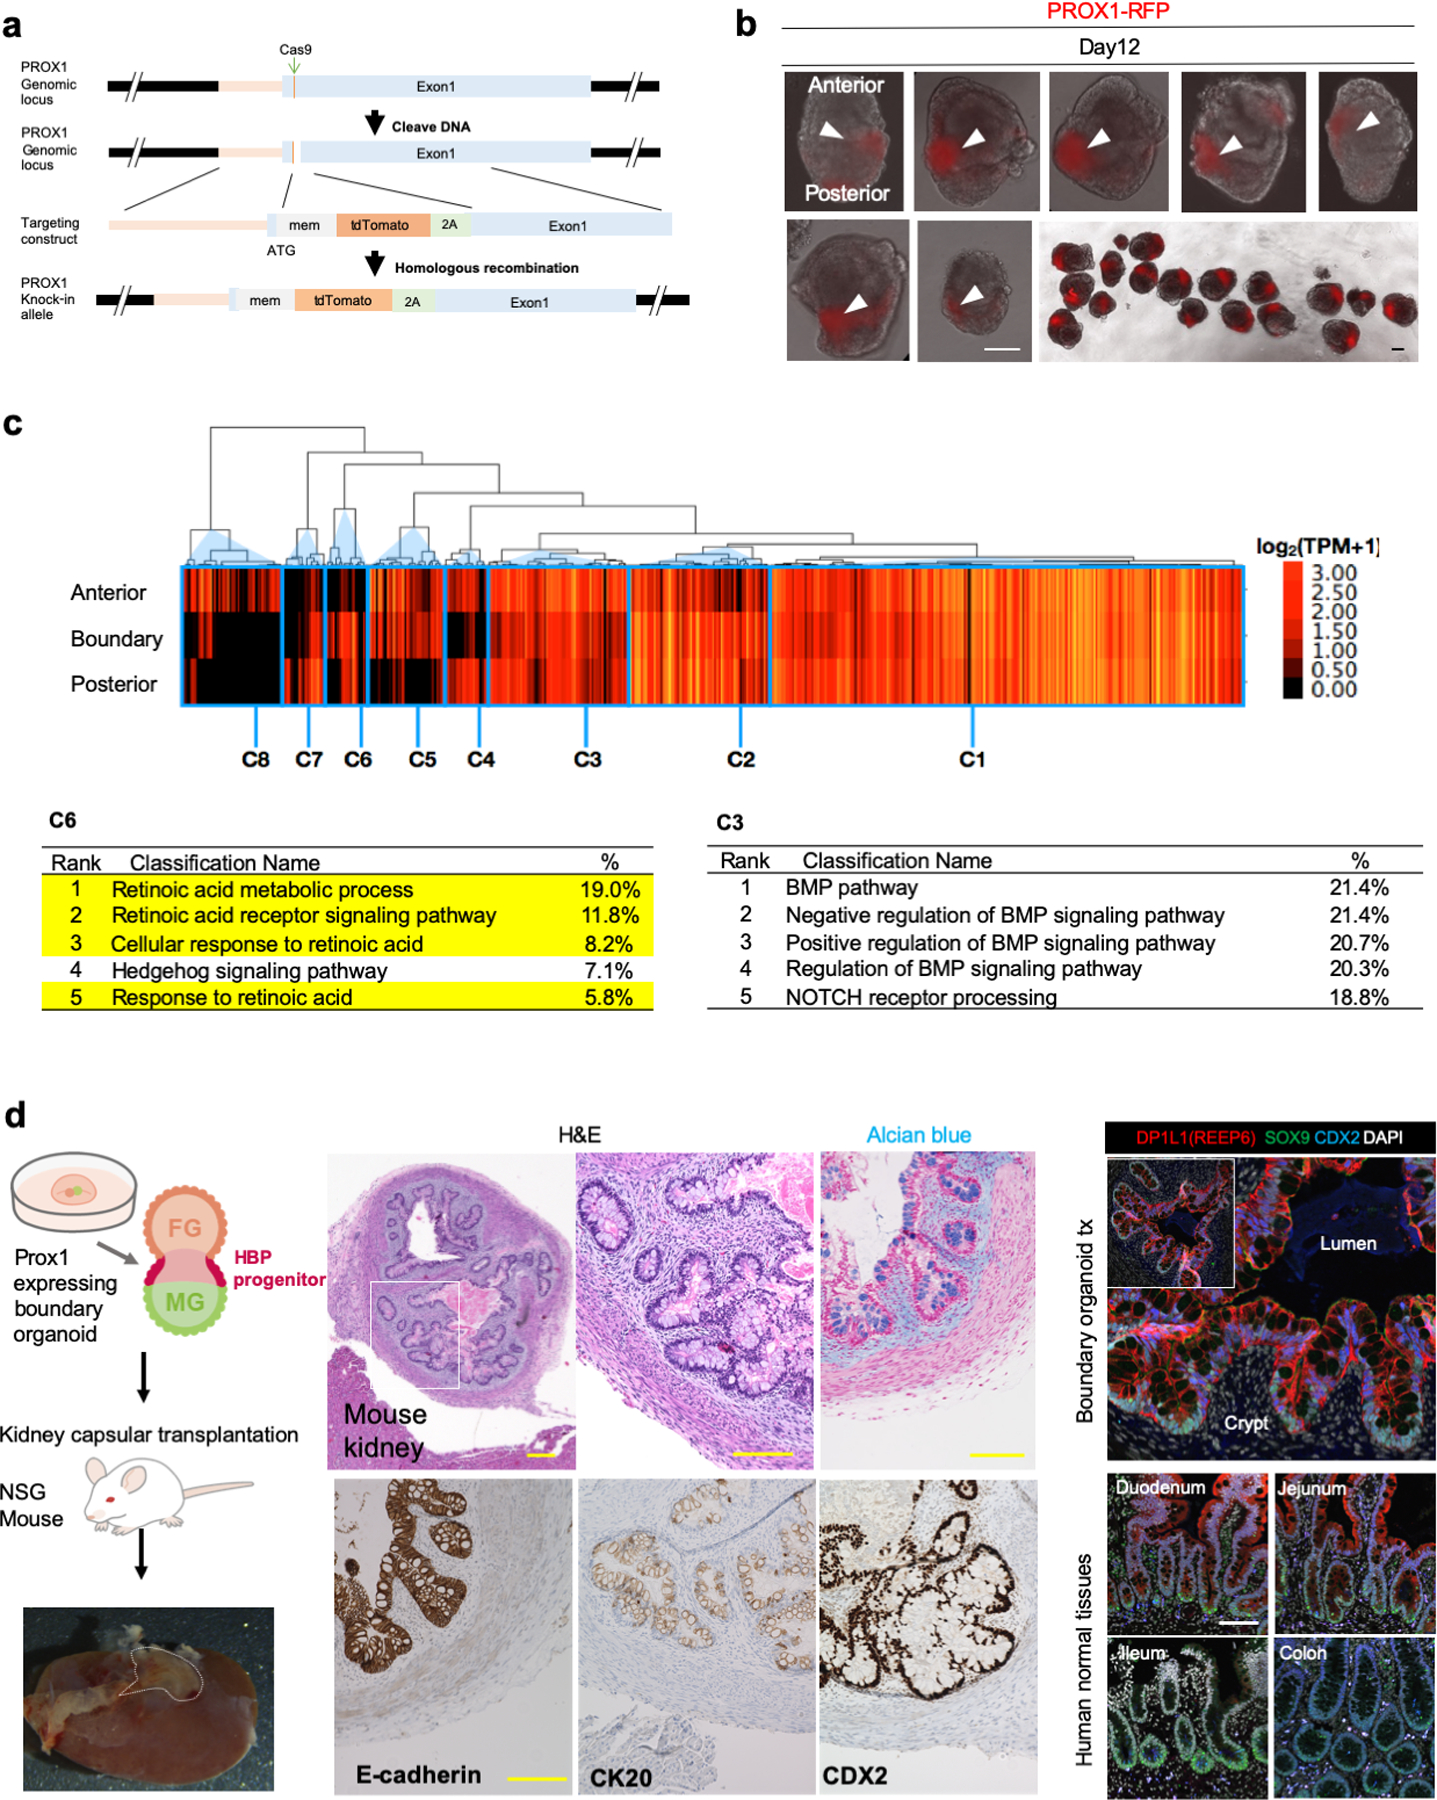
a. Generating PROX1-tdTomato reporter line by CRISPR-Cas9 system.
b. PROX1 reporter activity in boundary organoid. All images are boundary organoids derived from PROX1::tdTomato reporter line at day 12. Top and bottom side of the organoids indicated anterior and posterior side, respectively. Arrowhead indicates PROX1::tdTomato expression at boundary of each spheroid. Independent experiments repeated three times with similar results. Scale bar is 100 μm.
c. Transcriptomic characterization of dissected anterior, boundary, and posterior domains by RNAseq. Heatmap shows downstream gene expression related to FGF, BMP, Hedgehog, NOTCH and RA signal pathway selected from GO term category and KEGG pathway category. Heatmap was separated into 8 detailed groups (C1 – C8) by hierarchical clustering.
d. Default developmental potential of transplanted boundary organoid. Middle panels show H&E staining and immunohistochemistry, right panel show immunofluorescence. The experiment was repeated by independent three samples with similar results. Scale bar is 100 µm.
Extended Data Fig. 5: HHEX, PDX1 and PROX1 inhibition by retinoic acid receptor antagonist exposure in human boundary organoid and mouse embryo.
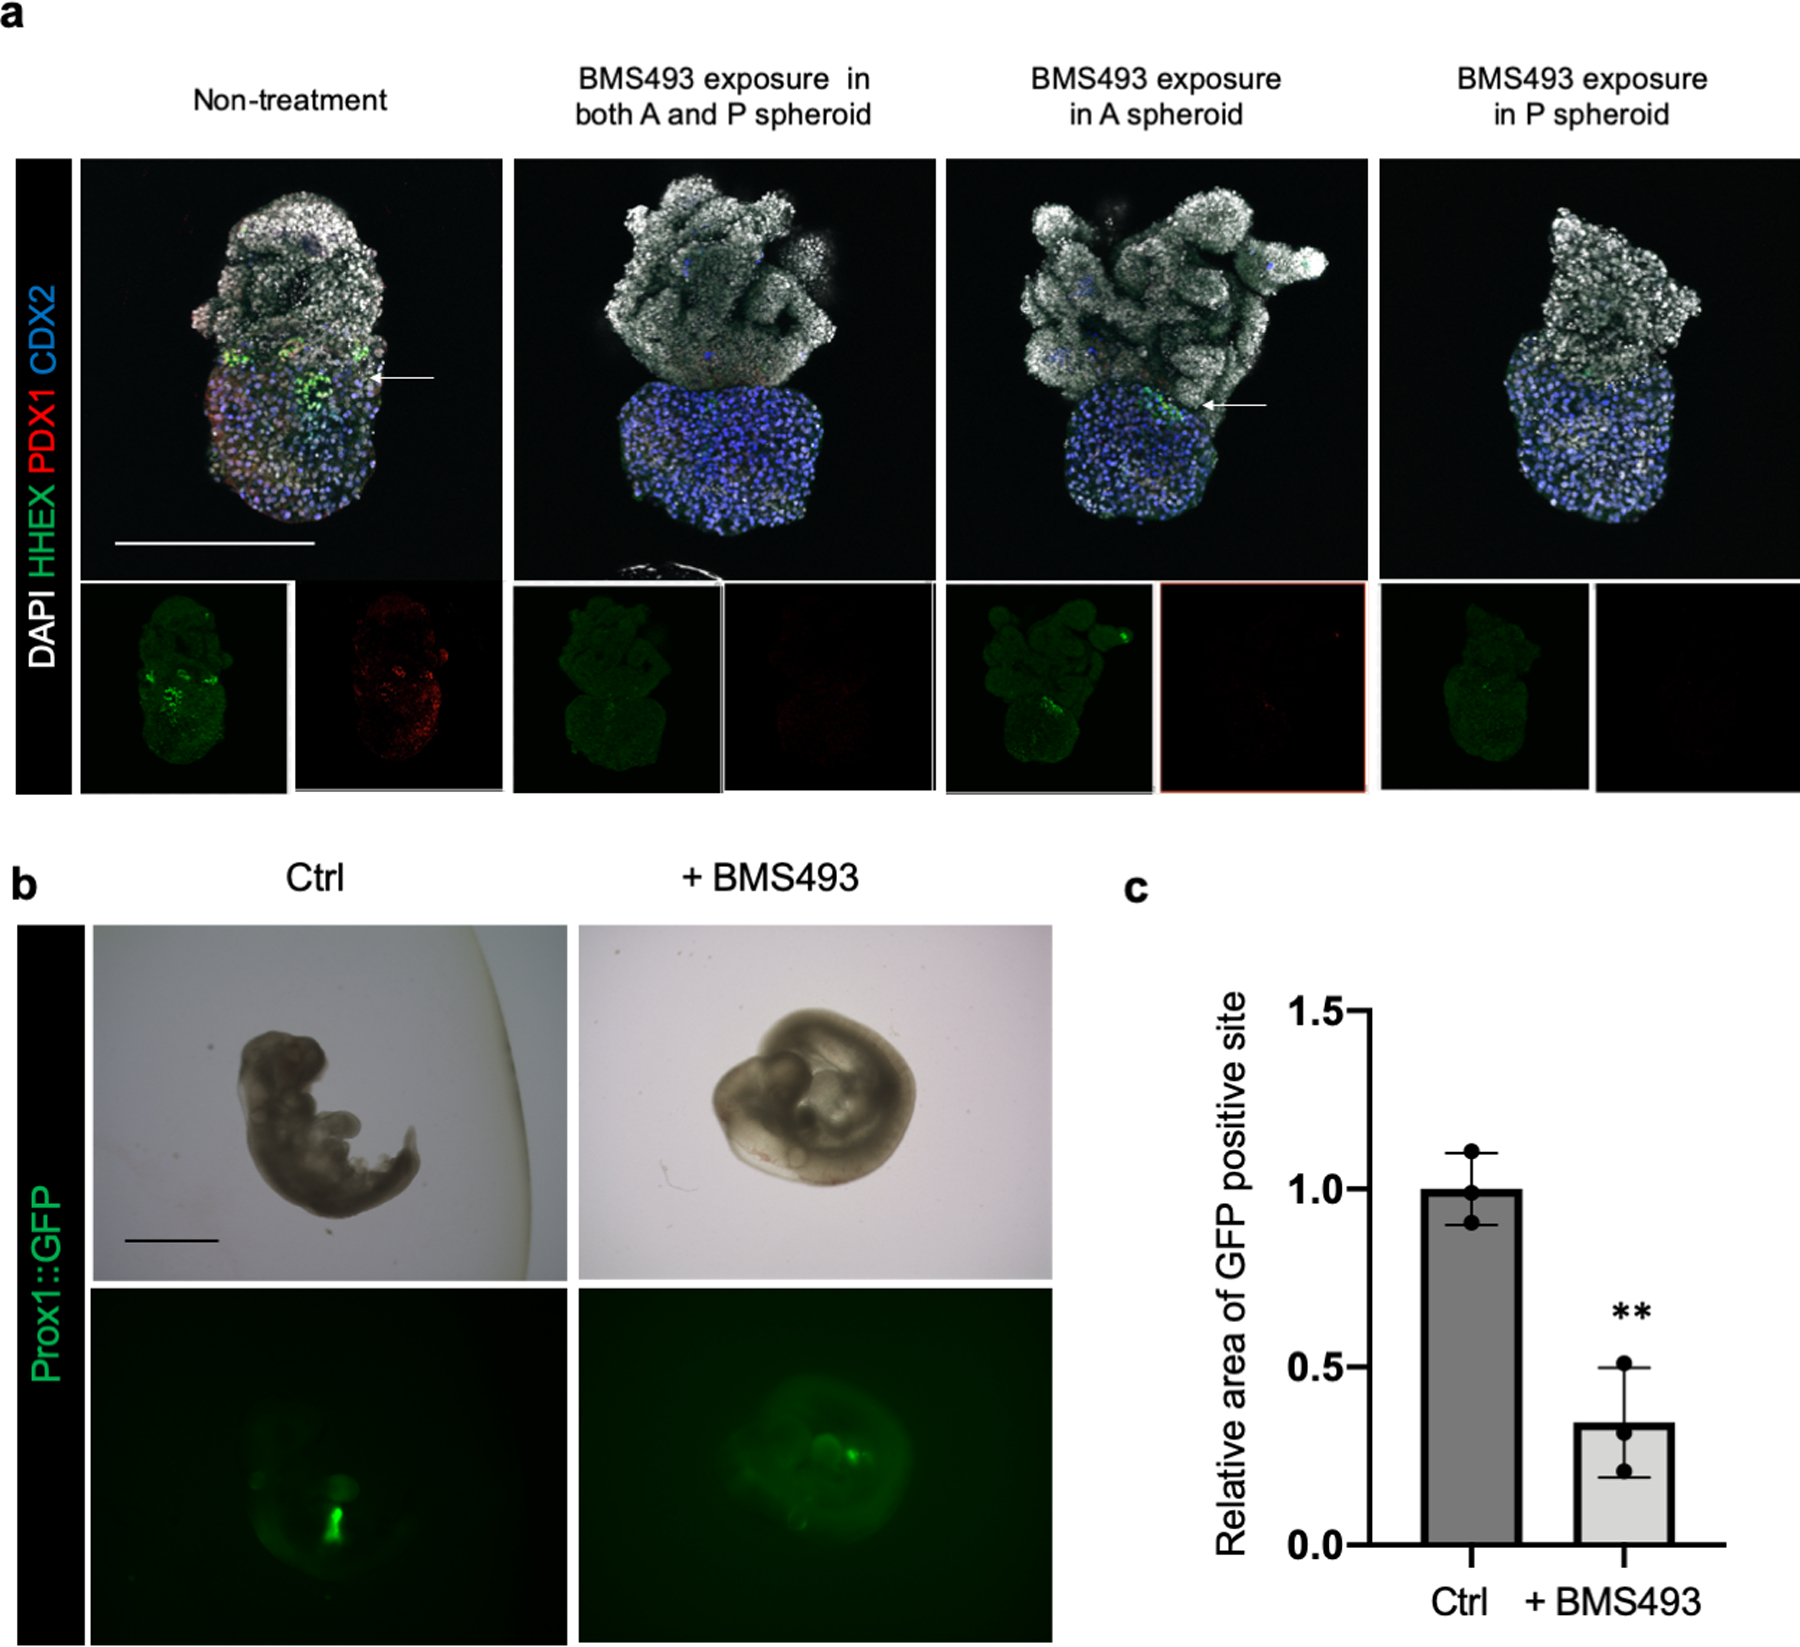
a. Retinoic acid receptor antagonist, BMS493 pretreated anterior or posterior spheroids were fused to induce HBP anlage formation, and wholemount stained for HHEX, PDX1 and CDX2. Compared to untreated control group, the group of BMS493 pretreated posterior spheroid was inhibited HHEX and PDX1 expression at boundary, suggesting retinoic acid receptor function in posterior side was important to establish HBP boundary organoid. Representative of n = 4 independent organoids showing similar results. Scale bar: 200 μm
b,c. Prox1 inhibition by BMS493 exposure with embryonic day (E) 9.0 Prox1::GFP reporter mouse embryo explant culture. The whole embryo was cultured in the rotator-type bottle culture system for 24 hrs. Retinoic acid receptors antagonist BMS493 treated group was compared with control (adding DMSO) group. b. Bright field image and GFP fluorescent image for embryo after culture. Representative of n = 3 independent organoids showing similar results. c. The area of GFP expressing parts were quantified from GFP image in (b). Data were mean ± s.d. (n = 3). P = 0.0035 by Unpaired, two-tailed Student’s t-test. Scale bar: 1 mm
Extended Data Fig. 6: Transplantation of dissected PROX1 expressing domain from human organoid and mouse embryo.
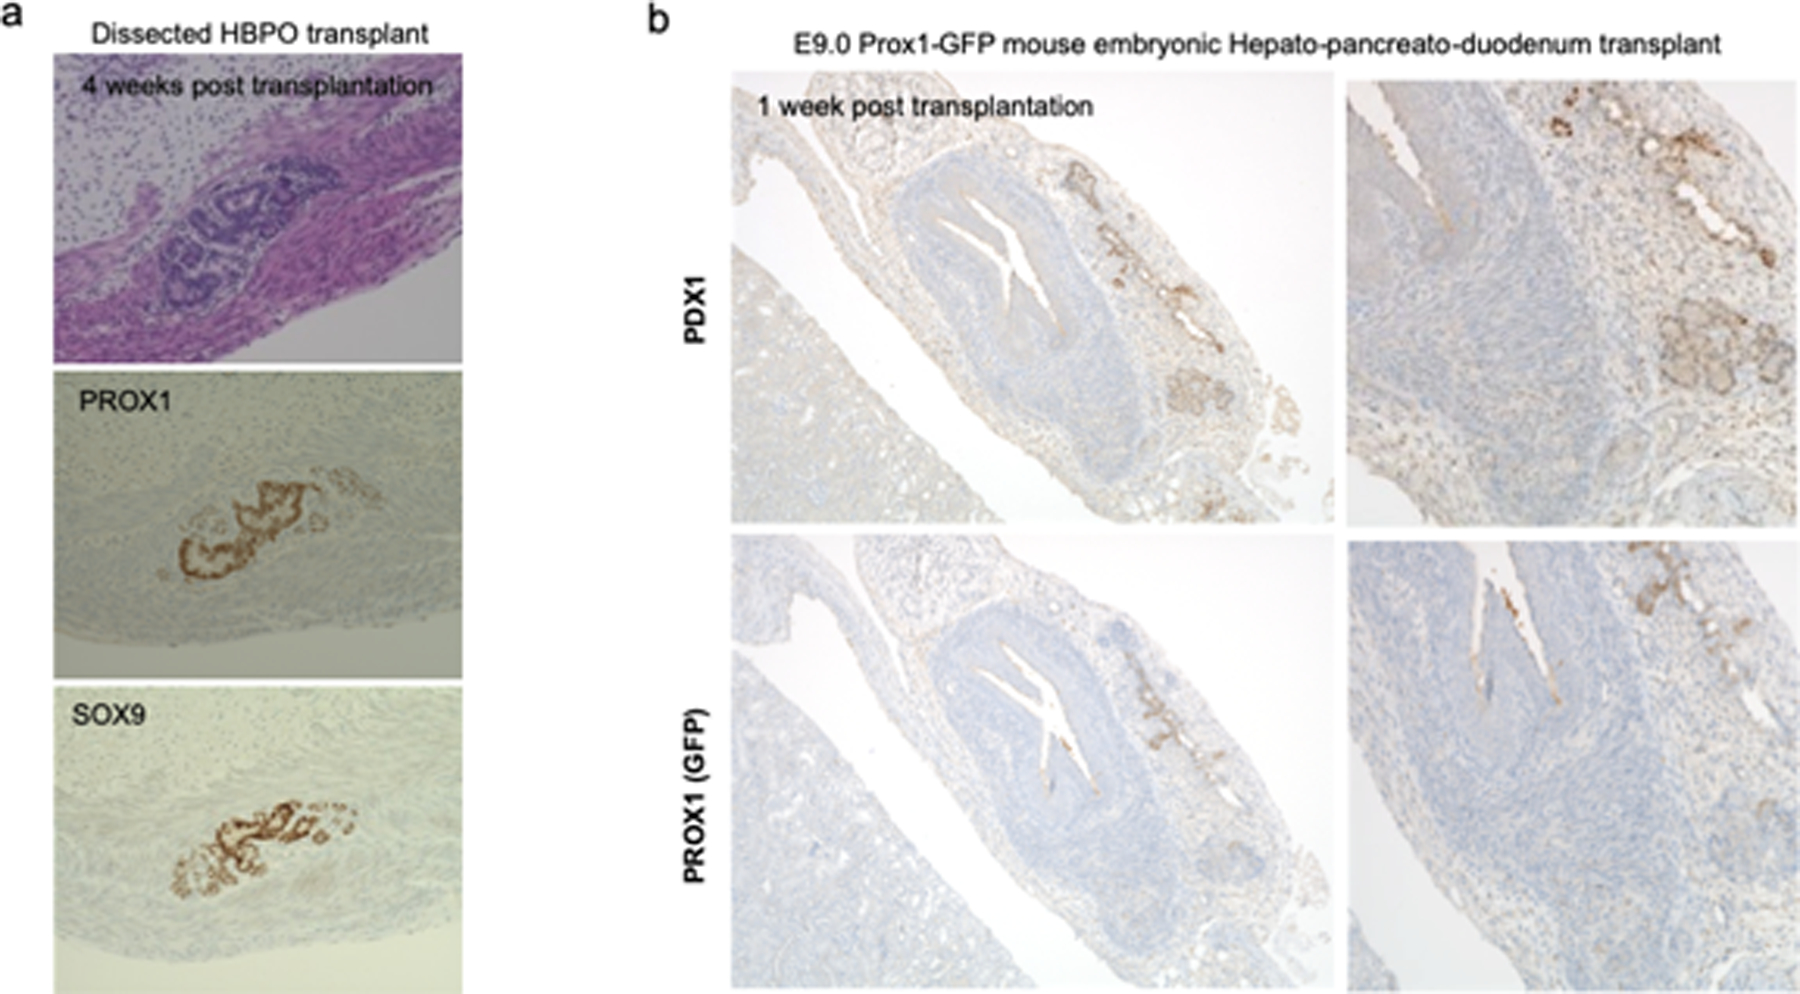
a Dissected PROX1 positive boundary domain at day 13 was transplanted into immunodeficient mouse, and formed duct like structure in the tissue expressing PROX1 and duct marker SOX9 after 1 month. Representative of n = 2 independent transplants showing similar results.
b E9.0 Prox1-GFP mouse embryonic HBP domain was transplanted and formed limited tissue expressing Prox1 (GFP) or Pdx1 at post 7 days of transplantation. Representative of n = 2 independent transplants showing similar results.
Extended Data Fig. 7: Optimization of in vitro culture system.
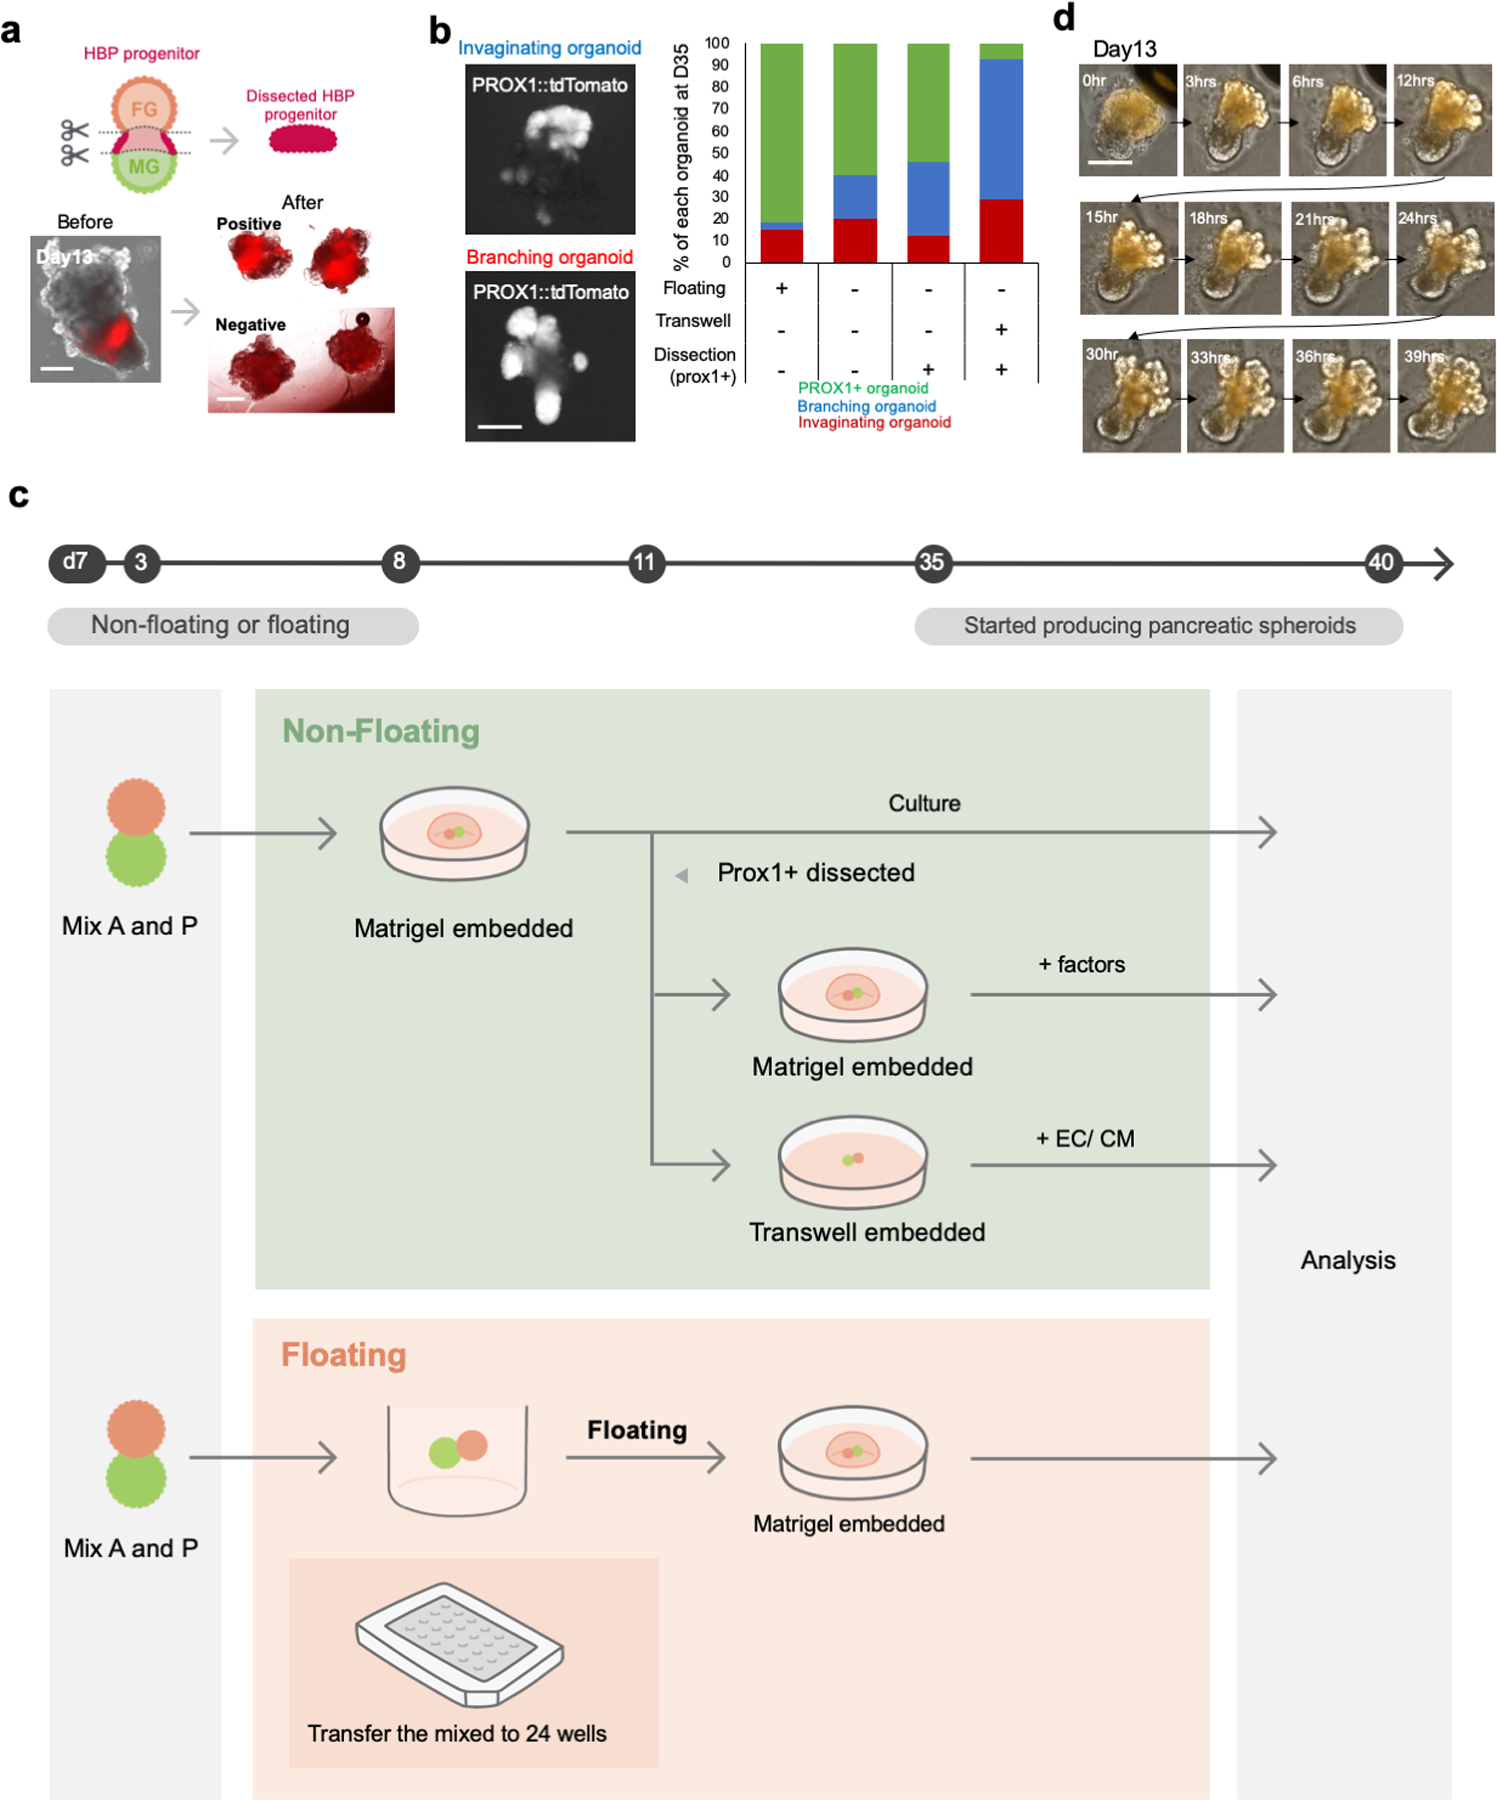
a. Illustration for the dissection strategy of PROX1 positive region from organoids with representative image. The imaging experiments were repeated by independent twelve samples with similar results. Scale is 100 µm
b. Optimization of organoid culture system by comparing: 1) Floating, 2) Embedded into Matrigel, 3) Embedded into Matrigel and cultured with Transwell from D13, 4) Dissected, embedded into Matrigel, and cultured with Transwell from D13. Left panel shows the typical morphology of invaginating or branching organoid. The imaging experiments were repeated by independent twelve samples with similar results. Scale is 100 µm
c. Illustration of Optimization of in vitro culture system. we compared various culture formats to enhance morphological change, such as invagination and branching morphogenesis, of PROX1 positive HBP domain. At day 7, anterior and posterior gut spheroids were mixed and connected after 24 hour-culture. Connected spheroids were transferred into Matrigel drop or low binding culture plate to compare between non-floating and floating conditions during HBP domain emergence. The organoid in Matrigel embedded group was started to express tdTomato at day 11. The tdTomato positive region was manually dissected under microscope according to the fluorescence expression and transferred into Matrigel drop again or Transwell to compare the effect from various agonist and antagonist in medium.
d. Morphogenesis of boundary organoids through 2 days from day 13. The imaging experiments were repeated by independent three samples with similar results. Scale is 100 µm
Extended Data Fig.8: Comparison of organoid size, PROX1 positive area, branching and invagination in various condition.
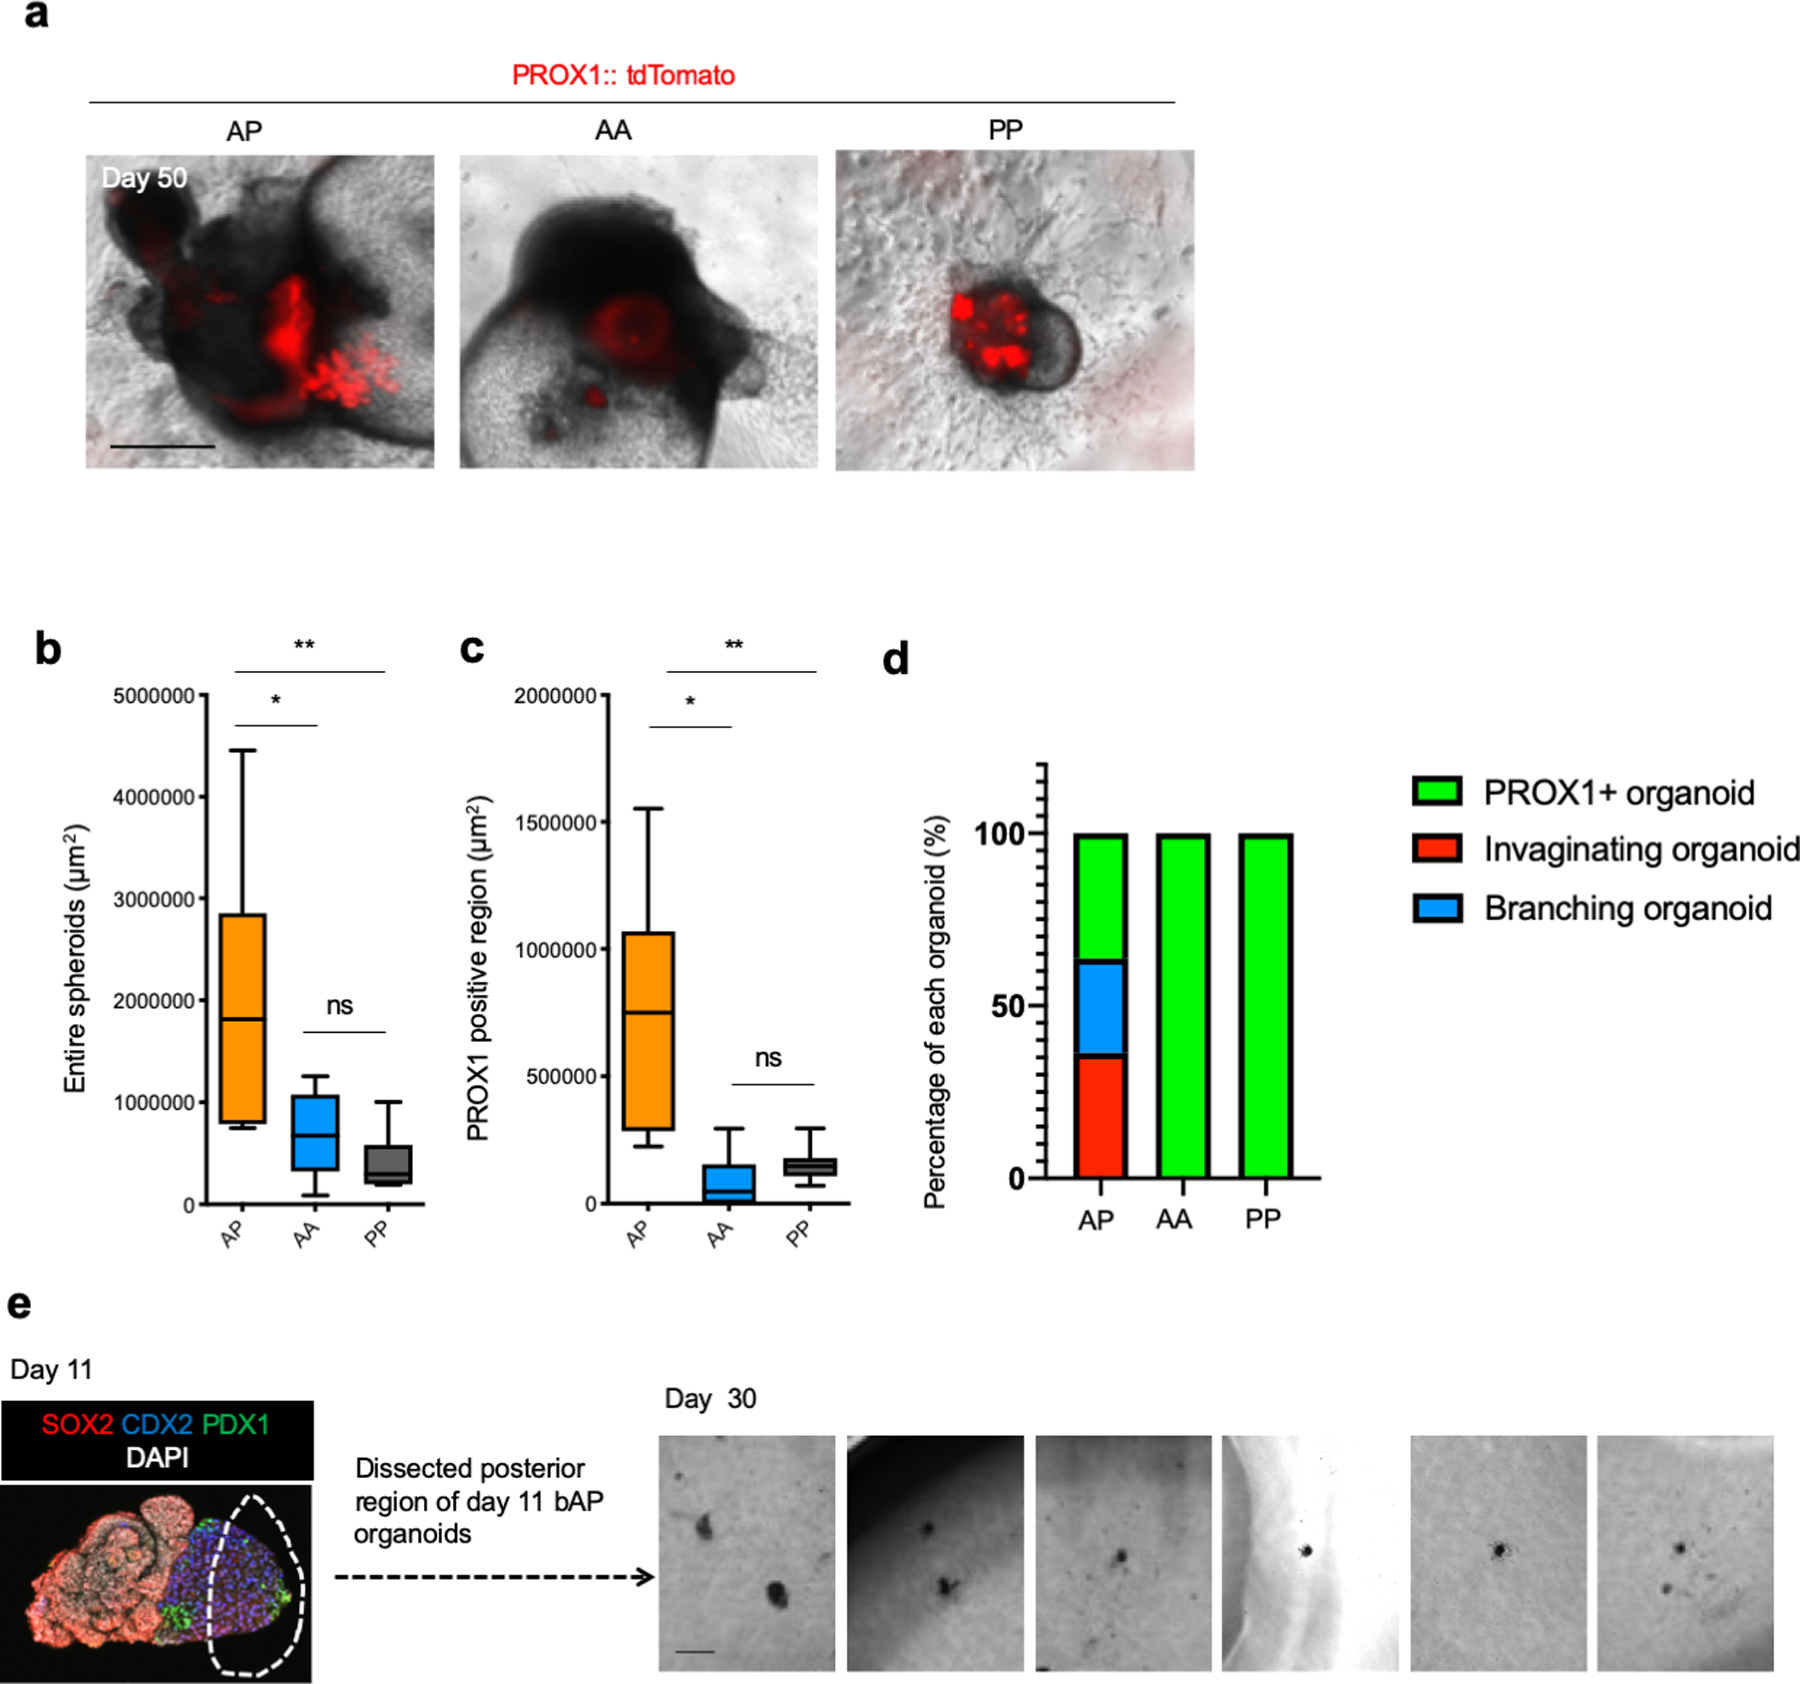
a. Comparison of PROX1-tdTomato expression in AP, AA and PP combination at day 50 of culture. Representative image of n = 6 independent organoid showing similar results. Scale bar: 500 μm
The quantification of entire spheroid area (b) and of PROX1 positive region (c). n = 11 (AP), 6 (AA) and 7 (PP). Data is mean ± 25th and 75th percentile are shown by central and outer lines of the boxes; whiskers go down to the smallest value and up to the largest. P = 0.0278 (AP vs AA), 0.0052 (AP vs PP) and 0.8566 (AA vs PP) in (b), and P = 0.0011 (AP vs AA), 0.0022 (AP vs PP) and 0.9063 (AA vs PP) in (c); one-way ANOVA, followed by Tukey’s test.
d. Percentage of branching, invaginating and other type of PROX1 positive organoid, defined as in Extended Data Fig. 7b. AP combination showed the spheroids with branching and invagination while other two combination did not.
e. Failure to branch and invaginate from posterior region of HBPOs. Dissected posterior region from day 11 organoid cultured until day 30. While HBPO formed PROX1 expressing branching structure, posterior dissected region of HBP that contain PDX1 expression did not form its structure. Independent experiment repeated twice with similar results. Scale bar is 200 μm.
Extended Data Fig. 9: Expression of organ domain-specific markers in HBPOs.
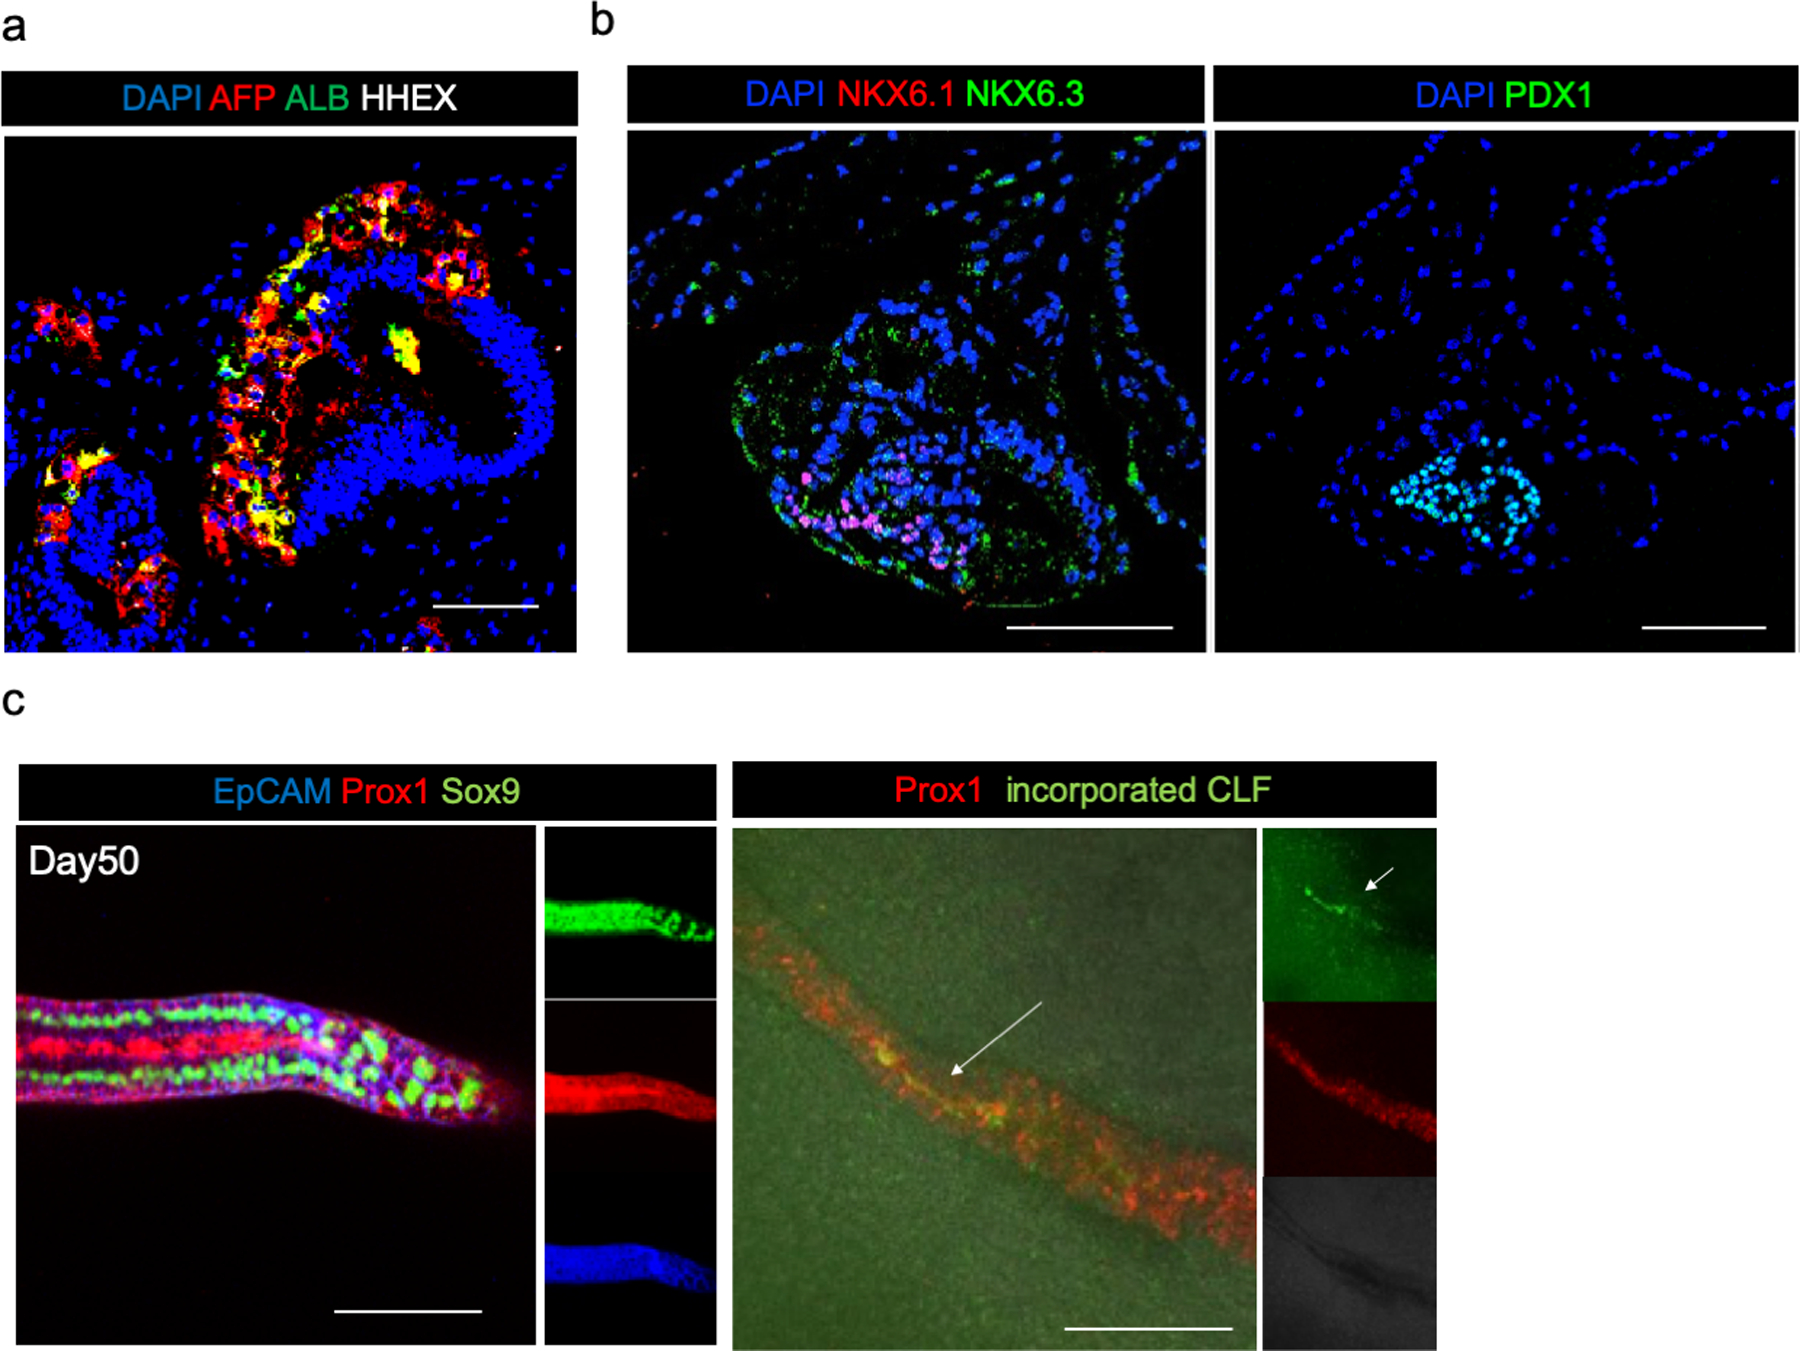
a. Immunofluorescent staining of AFP, Albumin, and HHEX at day30. AFP and Albumin expressed in the same region but not HHEX. HHEX were hepatocyte progenitor marker which result in disappearance of the expression at the later stage. Independent experiment was repeated twice with similar results.
b. Immunofluorescent staining of NKX6.1, NKX6.3 and PDX1. NKx6.3 were expressed in the area of pancreatic markers PDX1 and NKX6.1 expression. Independent experiment was repeated three times with similar results.
c. Immunofluorescent staining of EpCAM, PROX1, SOX9, and CLF. Representative image of n = 3 independent organoids showing similar results. Scale bar: 100 μm
Extended Data Fig. 10: Upregulation of pancreatic marker genes and depletion of bile duct markers in HES−/− organoids.
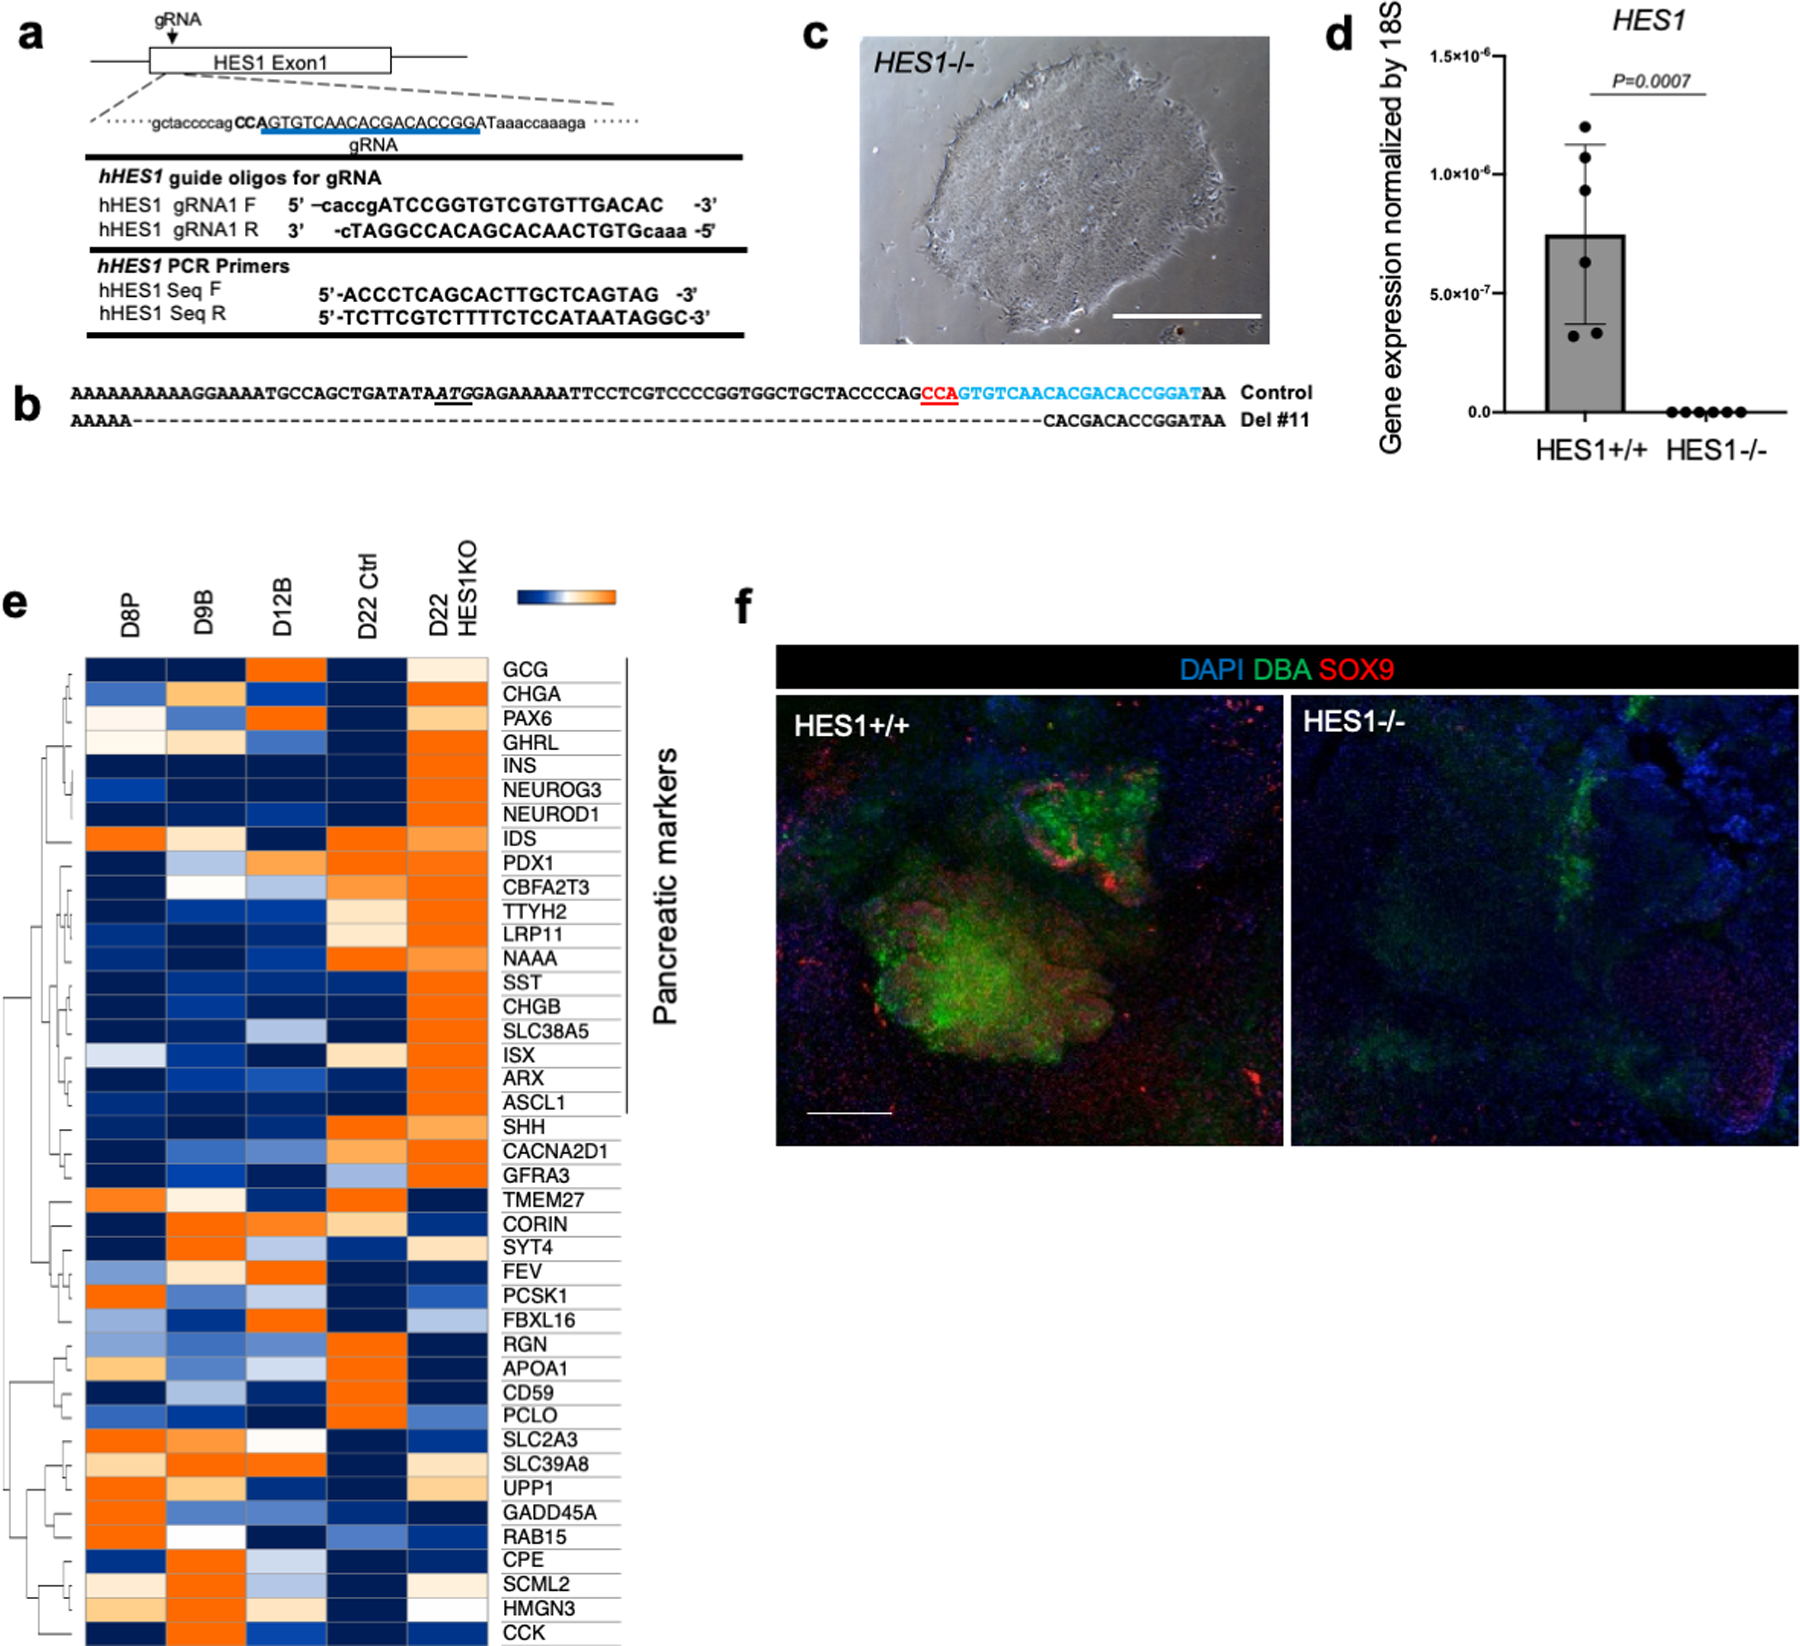
a. Gene targeting strategy for HES1 knock out (KO) line by CRISPR-Cas9 system.
b. Confirmation of modified gene sequence of control and HES1 KO (Del #11)
c. Representative photo of n = 3 HES1 −/− iPSC culture showing similar results. Scale bar is 500 µm
d. HES1 expression in organoid at day 20. Data is mean ± s.d.; n = 6 independent organoids. Unpaired two-tailed t-test.
e. Heatmap shows gene expression profile of pancreatic associated markers at day 22 of HES1+/+ and HES1−/− HBPOs. This is related to Main fig. 4c.
f. Connected structure inhibited in long term cultured HES1 KO organoid. Wholemount staining of DBA and SOX9 in HES1−/− and HES1+/+ organoids. DBA and SOX9 disappeared in HES1−/− organoids. Independent experiment was repeated three times with similar results. Scale bar: 200 μm.
Supplementary Material
ACKNOWLEDGMENTS
The authors would like to appreciate communication design items by Ms. Asuka Kodaka for graphics, and by Hydroid team at Amana inc. and Mr. Hiro Nakazawa for video. We would like to also express sincere gratitude to Drs. Hiromitsu Nakauchi, Vivian Hwa and Akihiro Asai, and his lab members for their support and excellent technical assistance, Ms. Deanna Louis for kind administrative/technical assistance, confocal imaging core for microscopy and the Transgenic Animal and Genome Editing Core at CCHMC for guide RNA design, construction and validation. This work was supported by Ono Pharmaceutical Co., Ltd. Grant, Cincinnati Children’s Research Foundation grant and PRESTO grant from Japan Science and Technology Agency (JST) to TT. This work was also supported by an Institutional Clinical and Translational Science Award, NIH/NCRR Grant Number UL1TR001425, Cincinnati Center for Autoimmune Liver Disease Fellowship Award, PHS Grant P30 DK078392 (Integrative Morphology Core and Pluripotent Stem Cell and Organoid Core) of the Digestive Disease Research Core Center in Cincinnati, and Takeda Science Foundation grants. TT is a New York Stem Cell Foundation – Robertson Investigator.
Footnotes
Competing Interests: The authors declare no competing interests
Supplementary information is available for this paper.
Data Availability
Sequence data used in this study have been deposited in Gene Expression Omnibus with the accession codes GSE121830. The data that support the findings of this study are available from the corresponding author upon reasonable request.
REFERENCE
- 1.Smith DM, Nielsen C, Tabin CJ & Roberts DJ Roles of BMP signaling and Nkx2.5 in patterning at the chick midgut-foregut boundary. Development 127, 3671–3681 (2000). [DOI] [PubMed] [Google Scholar]
- 2.Hentsch B et al. Hlx homeo box gene is essential for an inductive tissue interaction that drives expansion of embryonic liver and gut. Genes Dev 10, 70–79 (1996). [DOI] [PubMed] [Google Scholar]
- 3.San Roman AK & Shivdasani RA Boundaries, junctions and transitions in the gastrointestinal tract. Exp Cell Res 317, 2711–2718, doi: 10.1016/j.yexcr.2011.07.011 (2011). [DOI] [PMC free article] [PubMed] [Google Scholar]
- 4.Nielsen C, Murtaugh LC, Chyung JC, Lassar A & Roberts DJ Gizzard formation and the role of Bapx1. Dev Biol 231, 164–174, doi: 10.1006/dbio.2000.0151 (2001). [DOI] [PubMed] [Google Scholar]
- 5.Bort R, Martinez-Barbera JP, Beddington RS & Zaret KS Hex homeobox gene-dependent tissue positioning is required for organogenesis of the ventral pancreas. Development 131, 797–806, doi: 10.1242/dev.00965 (2004). [DOI] [PubMed] [Google Scholar]
- 6.Shih HP et al. A Gene Regulatory Network Cooperatively Controlled by Pdx1 and Sox9 Governs Lineage Allocation of Foregut Progenitor Cells. Cell Rep 13, 326–336, doi: 10.1016/j.celrep.2015.08.082 (2015). [DOI] [PMC free article] [PubMed] [Google Scholar]
- 7.Tepass U & Hartenstein V Epithelium formation in the Drosophila midgut depends on the interaction of endoderm and mesoderm. Development 120, 579–590 (1994). [DOI] [PubMed] [Google Scholar]
- 8.Fukuda A et al. Ectopic pancreas formation in Hes1 -knockout mice reveals plasticity of endodermal progenitors of the gut, bile duct, and pancreas. J Clin Invest 116, 1484–1493, doi: 10.1172/JCI27704 (2006). [DOI] [PMC free article] [PubMed] [Google Scholar]
- 9.Sumazaki R et al. Conversion of biliary system to pancreatic tissue in Hes1-deficient mice. Nat Genet 36, 83–87, doi: 10.1038/ng1273 (2004). [DOI] [PubMed] [Google Scholar]
- 10.Udager A, Prakash A & Gumucio DL Dividing the tubular gut: generation of organ boundaries at the pylorus. Prog Mol Biol Transl Sci 96, 35–62, doi: 10.1016/B978-0-12-381280-3.00002-6 (2010). [DOI] [PubMed] [Google Scholar]
- 11.Zhang Z, Rankin SA & Zorn AM Syndecan4 coordinates Wnt/JNK and BMP signaling to regulate foregut progenitor development. Dev Biol 416, 187–199, doi: 10.1016/j.ydbio.2016.05.025 (2016). [DOI] [PMC free article] [PubMed] [Google Scholar]
- 12.McLin VA, Rankin SA & Zorn AM Repression of Wnt/beta-catenin signaling in the anterior endoderm is essential for liver and pancreas development. Development 134, 2207–2217, doi: 10.1242/dev.001230 (2007). [DOI] [PubMed] [Google Scholar]
- 13.Nissim S et al. Iterative use of nuclear receptor Nr5a2 regulates multiple stages of liver and pancreas development. Dev Biol 418, 108–123, doi: 10.1016/j.ydbio.2016.07.019 (2016). [DOI] [PMC free article] [PubMed] [Google Scholar]
- 14.Palaria A, Angelo JR, Guertin TM, Mager J & Tremblay KD Patterning of the hepato-pancreatobiliary boundary by BMP reveals heterogeneity within the murine liver bud. Hepatology 68, 274–288, doi: 10.1002/hep.29769 (2018). [DOI] [PMC free article] [PubMed] [Google Scholar]
- 15.Spence JR et al. Sox17 regulates organ lineage segregation of ventral foregut progenitor cells. Dev Cell 17, 62–74, doi: 10.1016/j.devcel.2009.05.012 (2009). [DOI] [PMC free article] [PubMed] [Google Scholar]
- 16.Ameri J et al. FGF2 specifies hESC-derived definitive endoderm into foregut/midgut cell lineages in a concentration-dependent manner. Stem Cells 28, 45–56, doi: 10.1002/stem.249 (2010). [DOI] [PubMed] [Google Scholar]
- 17.Zhang RR et al. Human iPSC-Derived Posterior Gut Progenitors Are Expandable and Capable of Forming Gut and Liver Organoids. Stem Cell Reports 10, 780–793, doi: 10.1016/j.stemcr.2018.01.006 (2018). [DOI] [PMC free article] [PubMed] [Google Scholar]
- 18.Spence JR et al. Directed differentiation of human pluripotent stem cells into intestinal tissue in vitro. Nature 470, 105–109, doi: 10.1038/nature09691 (2011). [DOI] [PMC free article] [PubMed] [Google Scholar]
- 19.McCracken KW et al. Modelling human development and disease in pluripotent stem-cell-derived gastric organoids. Nature 516, 400–404, doi: 10.1038/nature13863 (2014). [DOI] [PMC free article] [PubMed] [Google Scholar]
- 20.Ouchi R et al. Modeling Steatohepatitis in Humans with Pluripotent Stem Cell-Derived Organoids. Cell Metab, doi: 10.1016/j.cmet.2019.05.007 (2019). [DOI] [PMC free article] [PubMed] [Google Scholar]
- 21.Wang Z, Dollé P, Cardoso WV & Niederreither K Retinoic acid regulates morphogenesis and patterning of posterior foregut derivatives. Dev Biol 297, 433–445, doi: 10.1016/j.ydbio.2006.05.019 (2006). [DOI] [PubMed] [Google Scholar]
- 22.Rankin SA et al. Timing is everything: Reiterative Wnt, BMP and RA signaling regulate developmental competence during endoderm organogenesis. Dev Biol 434, 121–132, doi: 10.1016/j.ydbio.2017.11.018 (2018). [DOI] [PMC free article] [PubMed] [Google Scholar]
- 23.Cunningham TJ & Duester G Mechanisms of retinoic acid signalling and its roles in organ and limb development. Nat Rev Mol Cell Biol 16, 110–123, doi: 10.1038/nrm3932 (2015). [DOI] [PMC free article] [PubMed] [Google Scholar]
- 24.Rankin SA et al. A Retinoic Acid-Hedgehog Cascade Coordinates Mesoderm-Inducing Signals and Endoderm Competence during Lung Specification. Cell Rep 16, 66–78, doi: 10.1016/j.celrep.2016.05.060 (2016). [DOI] [PMC free article] [PubMed] [Google Scholar]
- 25.Bayha E, Jørgensen MC, Serup P & Grapin-Botton A Retinoic acid signaling organizes endodermal organ specification along the entire antero-posterior axis. PLoS One 4, e5845, doi: 10.1371/journal.pone.0005845 (2009). [DOI] [PMC free article] [PubMed] [Google Scholar]
- 26.Watson CL et al. An in vivo model of human small intestine using pluripotent stem cells. Nat Med 20, 1310–1314, doi: 10.1038/nm.3737 (2014). [DOI] [PMC free article] [PubMed] [Google Scholar]
- 27.Higashiyama H et al. Embryonic cholecystitis and defective gallbladder contraction in the. Development 144, 1906–1917, doi: 10.1242/dev.147512 (2017). [DOI] [PMC free article] [PubMed] [Google Scholar]
- 28.Thamm K & Seaver EC Notch signaling during larval and juvenile development in the polychaete annelid Capitella sp. I. Dev Biol 320, 304–318, doi: 10.1016/j.ydbio.2008.04.015 (2008). [DOI] [PubMed] [Google Scholar]
- 29.Jørgensen MC et al. Neurog3-dependent pancreas dysgenesis causes ectopic pancreas in. Development 145, doi: 10.1242/dev.163568 (2018). [DOI] [PubMed] [Google Scholar]
- 30.Camp JG et al. Multilineage communication regulates human liver bud development from pluripotency. Nature 546, 533–538, doi: 10.1038/nature22796 (2017). [DOI] [PubMed] [Google Scholar]
- 31.Takebe T et al. Vascularized and functional human liver from an iPSC-derived organ bud transplant. Nature 499, 481–484, doi: 10.1038/nature12271 (2013). [DOI] [PubMed] [Google Scholar]
- 32.Davenport C, Diekmann U, Budde I, Detering N & Naujok O Anterior-Posterior Patterning of Definitive Endoderm Generated from Human Embryonic Stem Cells Depends on the Differential Signaling of Retinoic Acid, Wnt-, and BMP-Signaling. Stem Cells 34, 2635–2647, doi: 10.1002/stem.2428 (2016). [DOI] [PubMed] [Google Scholar]
- 33.Green MD et al. Generation of anterior foregut endoderm from human embryonic and induced pluripotent stem cells. Nat Biotechnol 29, 267–272, doi: 10.1038/nbt.1788 (2011). [DOI] [PMC free article] [PubMed] [Google Scholar]
- 34.Koike H, Iwasawa K and Takebe T “Generation of hepato-biliary-pancreatic organoid from human pluripotent stem cells” Protocol Exchange (2019) DOI: 10.21203/rs.2.13102/v1. [DOI] [PMC free article] [PubMed] [Google Scholar]
Associated Data
This section collects any data citations, data availability statements, or supplementary materials included in this article.
Supplementary Materials
Data Availability Statement
Sequence data used in this study have been deposited in Gene Expression Omnibus with the accession codes GSE121830. The data that support the findings of this study are available from the corresponding author upon reasonable request.


