

Abstract
A combined experimental and computational model approach was developed to assess heat effects on drug delivery from transdermal delivery systems (TDSs) in vitro and nicotine was the model drug. A Franz diffusion cell system was modified to allow close control of skin temperature when heat was applied from an infrared lamp in vitro. The effects of different heat application regimens on nicotine fluxes from two commercial TDSs across human cadaver skin were determined. Results were interpreted in terms of transport parameters estimated using a computational heat and mass transport model. Steady-state skin surface temperature was obtained rapidly after heat application. Increasing skin surface temperature from 32 to 42°C resulted in an approximately 2-fold increase in average nicotine flux for both TDSs, with maximum flux observed during early heat application. ANOVA statistical analyses of the in vitro permeation data identified TDS differences, further evidenced by the need for a two-layer model to describe one of the TDSs. Activation energies associated with these data suggest similar temperature effects on nicotine transport across the skin despite TDS design differences. Model simulations based on data obtained from continuous heat application were able to predict system response to intermittent heat application, as shown by the agreement between the simulation results and experimental data of nicotine fluxes under four different heat application regimens. The combination of in vitro permeation testing and a computational model provided a parameter-based heat and mass transport approach to evaluate heat effects on nicotine TDS delivery.
Keywords: heat-enhanced, human skin, in vitro membrane transport, mathematical model, nicotine, transdermal
INTRODUCTION
Exposure to heat may alter the permeation rate of compounds across the skin from both topical and transdermal formulations. Scheuplein first reported the effect of temperature on the permeation of water across skin in the 1960s (1). Similar temperature effects on water permeability were observed by Potts and Francoeur, and a correlation between the water permeability and stratum corneum intercellular lipid alkyl-chain disorder was observed (2). Blank et al. assessed the effect of temperature on skin permeation with respect to activation energies (3). For polar and ionic solutes, Peck et al. reported ~ 1.7-fold increase in permeability coefficients across human epidermal membranes at 39°C versus 27°C (4). Similarly, Tominaga and Tojo observed significant temperature effects on skin penetration of felbinac, ketoprofen, flurbiprofen, and loxoprofen in the range of 2–47°C (5). A variety of mechanisms have been proposed for the increase in skin permeability due to elevated temperature (6–11) including changes in skin lipid fluidity and drug solubility. Lidocaine, for instance, was reported to have higher partitioning and epidermal diffusivity at 45°C compared to 32°C (9). More recent reports have discussed enhancement of drug delivery from transdermal delivery systems (TDSs) (12–17) following exposure to different sources of heat. In vivo pharmacokinetic TDS studies have reported results as changes in AUC or Cmax (14,18–20). The findings indicate that, overall, the application of heat enhances drug delivery from these systems. The strategic use of heat to enhance topical and transdermal drug delivery is exemplified by the controlled heat-assisted drug delivery (CHADD) system (14,18). This technique has been shown to reduce the transport lag time of fentanyl delivery across the skin, thereby reducing the time it takes to reach therapeutic concentrations, which is particularly beneficial in the treatment of breakthrough pain (14,21). In contrast to the beneficial effects of controlled heat treatment, accidental heat exposure can lead to severe adverse effects in transdermal delivery. In fact, several cases involving such undesirable effects have been reported for fentanyl TDS used in conjunction with heat (21–24). Drug manufacturers have incorporated cautionary statements on heat exposure in TDS product labels, and transdermal buprenorphine, fentanyl, granisetron, and methylphenidate are among the drug products with such warnings (25).
An in vitro permeation test (IVPT) method to evaluate TDS performance under elevated temperature conditions can assist pharmaceutical scientists in predicting heat effects on transdermal drug delivery. However, a standardized test for the evaluation of heat effects is currently not available (25). The development of an IVPT method based on a robust data analysis approach can provide a platform to evaluate heat effects on drug delivery from TDS. The identification of heat protocols that introduce the maximum transdermal flux of drug from TDS, the ability to predict heat effects under a variety of heat exposure protocols, and the capability to delineate the skin and TDS factors that impact heat effects are imperative in evaluating TDS performance.
The purpose of this investigation was to assess the effects of heat on nicotine TDS skin absorption using a combined experimental and model approach. First, an experimental IVPT model employing human cadaver skin and varying heat application regimens was developed and tested using two commercially available matrix nicotine TDS in vitro. The transdermal flux results were then interpreted using a simultaneous heat and mass transport model solved numerically using a computer program (computational model). Particularly, this diffusion-based model, developed in parallel and described in detail elsewhere (26), was fitted to two sets of experimental data (normothermic baseline and 24-h heating regimen) to ascertain key transport parameters under these conditions. The parameters were evaluated and the model was examined for flux enhancement prediction under four different heating regimens. The ultimate goal for this study was to develop a computational model that can predict the conditions under which maximum flux enhancement (maximum heat effect) is observed for a given TDS using input parameters obtained from a limited in vitro dataset. Nicotine was selected as the model drug because commercial TDS products containing nicotine are available from multiple manufacturers. As noted in the Acknowledgements section, the feasibility to evaluate the same products in vivo to generate clinical data (27) under identical conditions further influenced the selection of the model compound for the present study.
MATERIALS AND METHODS
Materials
Phosphate-buffered saline (PBS) of pH 7.4 (consisting of 0.01 M phosphate buffer, 0.0027 M potassium chloride, and 0.137 M sodium chloride) was prepared by dissolving PBS tablets (MP Biomedicals, Solon, OH) in deionized water. Sodium azide (Acros Organics, Morris Plains, NJ) was added to PBS at 0.02% as a bacteriostat.
Two TDS products were investigated in the study. The first TDS was Equate Clear Transdermal System Nicotine Patch, 21 mg/24 h (Nicoderm CQ®) manufactured by Alza Corp (Mountain View, CA), National Drug Code (NDC) of 49035-194-02, lot number 1405762. The second TDS was Aveva Transdermal System Nicotine Patch, 21 mg/24 h manufactured by Aveva Drug Delivery Systems (Miramar, FL), NDC of 0536-5896-88, lot number 42488. Although both systems have the same nominal delivery rate, the two products are of different size and the formulations are also different with respect to drug loading, adhesives, and inactive excipients. The Alza and Aveva nicotine TDS are hereafter referred to as TDS-N1 and TDS-N2, respectively. These two pharmaceutically equivalent nicotine TDS products have different formulations, are not approved as therapeutic equivalents, and are not expected to be bioequivalent to each other.
Human Skin Preparation
Excised split-thickness human cadaver skin from the posterior torso of males of mixed ethnicity (2 Caucasian, 1 Black, 1 Hispanic) between the ages of 45 and 67 years (mean ± SD: 59 ± 10) was obtained from New York Firefighters Skin Bank (New York, NY). Skin donor ID numbers were recorded. Sufficient skin was procured to allow for donor consistency throughout all heat application protocols. Skin thickness was measured by a micrometer (Mitutoyo, Kanagawa, Japan) and found to be 0.28 ± 0.17 mm (mean ± SD, all skin samples). The skin was thawed by immersion in PBS, patted dry with Kimwipe, and promptly used. Any unused skin was wrapped in aluminum foil and stored in a freezer at − 20°C for later use. The use of human tissues was approved by the Institutional Review Board (IRB) at the University of Cincinnati, Cincinnati, OH.
Skin Permeation Experiments with TDS
Skin permeation experiments with TDS were conducted in Franz diffusion cells with an effective diffusional area of ~ 0.7 cm2. Skin samples were mounted onto static, water-jacketed, unoccluded diffusion cells with the dermis facing the receptor. The receptor compartment was filled with ~ 6 mL PBS and equipped with a magnetic stir bar. Skin integrity testing followed the electrical resistance method described in the literature (28). Skin samples with electrical resistance ≤ 10 kΩ cm2 were excluded from the study. A temperature probe located in the receptor compartment was used to monitor the receptor temperature, and the results were recorded. Punch-outs (0.58 cm2) of the TDS, accomplished through the use of a cork borer, had Ultrafine IT-series flexible microprobes (IT-24P, Physitemp Instruments, Clifton, NJ) attached to the adhesive surface and were then affixed to the skin surface in the donor chamber by the manual application of light pressure. The flexible microprobes were used to measure the skin temperatures. The temperature probes were calibrated by the manufacturer and checked in the present study by immersion in a water bath at temperatures ranging from 32 to 46°C. Accuracy of the probes was found to be within ± 0.2°C by comparison with an NSIT traceable thermometer and ± 0.1°C among the probes themselves. Prior to dosing and heat application, the circulating water bath was adjusted to maintain the skin surface temperature at 32°C. One TDS per diffusion cell group had an additional probe attached on the underside of the TDS for the temperature control operation using the proportional-integral-derivative (PID) temperature controller (TCAT-2, Physitemp Instruments).
The application of heat at the TDS surface was accomplished by the maintenance of a temperature set point, specified for the PID temperature controller at 42°C at the skin surface, and achieved through the intermittent functioning of an infrared heat lamp (HL-1, Physitemp Instruments) as described in a previous study (29). This experimental design mimicked external heat application scenarios, e.g., application of a heating blanket, by creating a temperature gradient across the TDS, skin, and receptor chamber. Briefly, six diffusion cells were arranged in a centric configuration located approximately 6–8 in. beneath the infrared heat lamp. The skin surface temperature measurements were recorded by a data logger and computer software (Thermes USB Temperature Data Acquisition System and DasyLab-Lite Software, respectively, Physitemp Instruments). Skin temperature was monitored and maintained in the range of 41–44°C. On the few occasions (5 of 186 skin samples, 2 TDS-N1, and 3 TDS-N2) when the skin temperature was outside the 3°C window for more than 30 min, skin permeation data were excluded from the study, and the experiments were repeated. Six heat application protocols were investigated (Fig. 1): a baseline experiment of 32°C for the maximum duration of TDS wear of 24 h (protocol 1); 42°C heat application for 0–24 h (protocol 2); 42°C heat application for time periods 4–5 h, 8–9 h, 4–24 h, and 8–24 h (protocols 3, 4, 5, and 6, respectively). The heat application regimens were selected in conjunction with the collaborators with specific exposure scenarios in mind and in parallel with a recent University of Maryland study (27). These heat application times were chosen to identify the conditions under which the maximum effect of heat on drug permeation might be observed for the TDS. In addition, by using the conditions harmonized with those in the recent study, the in vitro data generated in the present study could be compared with the heat enhancement observed in vitro and in vivo for the same set of products. Protocol 1 provided a control with the skin maintained at the normal temperature of 32°C for 24 h, while protocol 2 was the simplest heat protocol from an experimental perspective because the temperature was maintained at 42°C for the entire duration of 24 h. In this study, protocols 1 and 2 were also used to obtain parameters for the computational model. Protocols 3 and 4 were specifically designed to harmonize the data obtained from the in vitro studies with in vivo data available from a parallel collaborative research agreement at the University of Maryland using the same products. Protocols 5 and 6 were designed to identify heat effects following comparatively longer heat application times. With the exception of TDS removal at 9 h for protocols 3 and 4 to replicate the in vivo protocol, the TDS was removed at 24 h in all protocols.
Fig. 1.

Heat and TDS application regimens for the six heat study protocols (normothermic baseline, 24-h continuous heat application, and four intermittent heating regimens) used in the in vitro permeation studies for nicotine
Sample aliquots (0.5 mL) were withdrawn from the receptor compartment at 1, 2, 4, 6, 8, 10, 12, and 24 h, followed by replacement with an equal volume of PBS. In protocols 3 and 4, additional samples were taken at 5 and 9 h, respectively, to gain additional resolution during the heat application period. Prior to each sample withdrawal, the receptor content was manually mixed by pipetting the sample “in and out” of the compartment several times. Samples were then collected from the center of the receptor compartment and stored at 4°C. The samples were assayed using a Shimadzu HPLC system (Shimadzu Scientific Instruments, Addison, IL) with SPD-20A UV-Vis detector, SIL-20A autoinjector, mobile phase of acetonitrile:water:triethylamine (v/v) at 300:700:1, and flow rate of 1.5 mL/min. For mass balance purposes, the residual drug was extracted by placing the used TDS in a stirred scintillation vial filled with a 5 mL mixture of acetonitrile:water (v/v) at 50:50 at room temperature. The extraction solvent in the vial was replaced daily with fresh solvent for 3–6 days, and combined extracts were assayed for the drug.
Four skin donors were used in each protocol with at least three replicates per skin donor. One diffusion cell per skin donor was used as a non-dosed control. Identical experimental procedures were used for the TDS-N1 and TDS-N2. The cumulative amounts of drug transported across the skin over time were determined. Flux values were calculated using the amount of drug permeated during a given period of time for each diffusion cell and TDS area of 0.58 cm2, and then averaged as described in the Statistical Analysis section. The average flux values were plotted against the mid-time points between the respective sampling time points. Due to the errors introduced by aliquot sampling in the flux calculation from the cumulative drug amount/permeation versus time plot, criteria were established in advance to identify outliers for data exclusion. Although the criteria were arbitrary, more conservative limits would exclude significantly more data. Thus, skin samples showing negative fluxes or when the flux dropped by > 40% followed immediately by > 66% increase without heat application in the flux versus time profile were excluded from the analysis and the experiments were repeated (17 of 186 total skin samples, 5 TDS-N1, and 12 TDS-N2). The cause of flux variability necessitating this exclusion criterion is explained in the Discussion section.
Skin Permeation Experiment Without TDS
Skin permeation experiments were conducted in side-by-side diffusion cells (effective area ~ 0.7 cm2) to determine the activation energy of skin permeation of nicotine without TDS. The skin was equilibrated in a petri dish containing PBS and then mounted between the diffusion cells together with a rubber gasket and the dermis facing the receptor chamber. Skin integrity testing (skin resistance measurements in PBS) was performed prior to the permeation experiments. The donor solution was prepared by dissolving nicotine bitartrate dihydrate in PBS to obtain 1% (w/v) solution and the pH was adjusted to pH 7.4 with concentrated NaOH. The donor and receptor compartments were filled with 2 mL donor solution and 2 mL PBS with magnetic stir bars, respectively. Experiments were conducted in a circulating water bath at 32 and 42°C. Sample aliquots (0.5 mL) were withdrawn from the receptor compartment at 2, 4, 6, and 8 h, followed by replacement with an equal volume of PBS; at the same time, 10 μL aliquots were withdrawn from the donor chamber. The collected samples were assayed by HPLC. The steady-state fluxes (calculated using the diffusion cell area of 0.7 cm2) and permeability coefficients of the skin for nicotine were determined. Activation energy was calculated by the ratio of the permeability coefficients at 32 and 42°C and the Arrhenius relationship (see equations in Computational Data Analysis section).
Computational Model Methods
The simultaneous heat and mass transport simulation model for describing drug permeation across human skin from the application of a TDS on the skin surface, which in turn is supplied with heat, has been described elsewhere (26). Briefly, four mass transport domains were employed: the three skin layers SC, viable epidermis (VE), and dermis (DE), and the TDS, in addition to a heat component to describe the temperature-dependent drug permeation through human skin. In order to compare simulated results to the experimental in vitro results presented herein, the model was modified such that results for nicotine (MW = 162.2 Da, log Koct = 1.17, pKa = 8.02) (30) are presented in terms of the flux exiting the viable epidermis layer. Thus, the dermis was assumed to be a negligible barrier to drug permeation and the effects of perfusion and dermal clearance were not taken into account by constraining their values to zero in the current study. Additionally, the model originally assumed the TDS as a homogeneous 1-layer structure for both TDS-N1 and TDS-N2, but was subsequently modified to account for the non-homogeneous nature of TDS-N1. Such modification was not necessary for TDS-N2.
COMSOL Computational Details
The COMSOL® multiphysics finite element analysis platform (using the chemical reaction engineering and heat transfer modules) was used for one-dimensional and time-dependent transport simulations. The COMSOL simulations used the PARDISO direct default solver with an extremely fine mesh, yielding run times generally less than 10 min using a laptop computer (Dell Latitude E5540, Intel Core i7). For data fitting, COMSOL used an optimization process (via the optimization module) involving a least squares approach (Levenberg-Markquardt method) and PARDISO solver for parameter estimation. Absolute tolerance was set to 0.001 while the relative tolerance (default) specification was 0.01.
Initial and lower boundary conditions, with the exception of skin surface temperature and concentration of drug, were consistent in all simulations (Table I). A representative TDS concentration, corresponding to the experimental value obtained for the given TDS, was used as the initial concentration for the TDS domain. The concentration was calculated using the amount of nicotine in the TDS and the volume of the nicotine-containing layer (area × thickness, Table II). Surface temperatures of both 32°C (normothermic case) and 42°C (elevated case) were considered. Six different heat application protocols (including the normothermic control, i.e., the no heat control), described in Fig. 1, were modeled to match the in vitro investigations. For time variant heat applications, the surface temperature was entered as a function of time in tabular format, with an appropriate delay for temperature ramping. Specifically, 10°C temperature changes were programmed to occur at the surface over a period of 450 s, in order to achieve a gradual temperature rate of 0.022°C/s to simulate the exposure and removal of heat. This temperature response rate is intermediate between a value calculated using the experimental observation for human skin (29) and a literature value reported as the representative temperature ramping rate for mammalian skin (31). It should be noted that the overall impact of this value on the flux results is minimal due to the much faster rate of heat transfer compared to mass transport; the timescales for heat and mass transfer were significantly different such that thermal steady-state conditions through the skin layers were achieved in seconds as compared to the hours required to achieve mass steady-state concentration profiles (see Discussion).
Table I.
Initial and Boundary Conditions Used in Fully Hydrated (FH) Model Simulations
| Units | SC | VE | DE | |
|---|---|---|---|---|
| Initial conditions | ||||
| Temperature (T0) | °C | 37 | ||
| Concentration (C0) | mol/m3 | 0 | ||
| Boundary conditions | ||||
| Temperature (T(z)) | °C | 32 or 42 for a given time t | T(1623)=37 | |
| z in μm | ||||
| Concentration (C(z)) | mol/m3 | CTDS = TDS concentration | C(1623)=0 | |
| z in μm | (sink conditions) |
Table II.
TDS Dimensions and Nicotine Transport and Partition Parameters (ANOVA Least Squares Mean ± SE, n = 4 Skin Donors, 3–4 Replicates Per Donor) Calculated from the Optimization Analyses of 0–24-h 32°C and 42°C In Vitro Permeation Data in Franz Diffusion Cells (Protocols 1 and 2)
| Product | Nicotine content mg/cm2 | Thickness (cm) | C0 (mg/mL) | KSCpb |
Dscc × 1010 (cm2/s) |
EAd (kJ/mol) |
|||||
|---|---|---|---|---|---|---|---|---|---|---|---|
| Total | Backing | Reservoira | Modelb | Expe | Sigma minusb | 32°C | 42°C | ||||
| TDS-N1 (two-layer TDS) |
5.86 | 0.027 | 0.006 | 0.015 | 384 ± 7 | 391 ± 7 | 381 ± 10 | 3.73 ± 0.17 | 20f | 44g | 65 ± 6 |
| TDS-N2 (homogeneous TDS) |
1.72 | 0.030 | 0.006 | 0.021 | 108 ± 7 | 83 ± 2 | 115 ± 10 | 1.14 ± 0.04 | 8.1 ± 0.5 | 16.0 ± 0.6 | 58 ± 5 |
Drug reservoir thickness (hres) calculated from: total thickness – thickness of backing membrane – thickness of membrane inside TDS
Products significantly different, p < 0.001
Products significantly different, p < 0.05
Experimentally determined activation energy value for aqueous nicotine: 65.9 kJ/mol
Experimentally determined nicotine concentration in TDS (mean ± SEM), calculated as: (Nicotine content) / hres
Value is the modified optimization value, and thus, SEM is not applicable; other values used in this model were: Dadh = 4 × 10⁻⁸ cm2 /s; Dp (32°C) = 2.27 × 10⁻¹⁰ cm2 /s; Dp (42°C) = 6.1 × 10⁻¹⁰ cm2 /s; cadh = 10 mol/m3
Value calculated from the modified optimization value at 32°C using EA; SEM is not applicable
Nicotine content per unit area in the TDS, designated “Load,” was assumed to be homogenously distributed in one or two reservoir layers of the TDS having total thickness hres. The initial concentration in these layers was C0 = Load/hres. Initial nicotine concentration in the uppermost layer of the SC was calculated according to Eq. 1:
| (1) |
where KSCp is the SC/TDS partition coefficient. In the case of a linear isotherm, KSCp = Csat/Sp = KSCw(Sw/Sp), where Csat = KSCw Sw is the solubility of nicotine in the SC, Sp is the solubility of nicotine in the TDS, KSCw is the SC/water partition coefficient, and Sw is the water solubility of the drug at the test temperature (32). In this case, Eq. 1 may be written as
| (2) |
a form which has value for predictive modeling because the parameters on the right-hand side can be measured or estimated without using skin (32). In the present report, Eq. 1 was employed, whereas the accompanying model development report (26) employed Eq. 2.
Computational Data Analysis
Data analysis involved two types of computational simulations: “optimizations,” which denotes computer analysis to obtain model parameters that are fitted to experimental data and “simulations,” which indicates predicted results using the optimized model parameters.
Optimizations were performed using experimental cumulative amount data for each diffusion cell (four skin donors, three replicates per skin donor) for the 0–24-h heat applications at both the baseline (32°C) and elevated (42°C) temperatures (24 cells total). Cumulative amount data rather than the flux data were used in the optimization process because they are generally more precise than flux data; flux, technically the differential of the cumulative amount data with respect to time (i.e., dM(t)/dt), is calculated using ΔM(t)/Δt in this study, and therefore, the cumulative amount data (as untreated raw data) are generally more reliable with less uncertainties compared to the calculated flux data. From the optimizations based on a homogeneous one-layer TDS, the three resulting parameters—homogeneous TDS concentration (C0), SC/TDS partition coefficient (KSCp), and SC diffusivity (DSC_42 and DSC_32)—were averaged over three rounds of iterations to obtain global values (Fig. 2) for use in the predictive model validation process. Such an approach allows for better final determinations of each of the parameters (i.e., tighter error bounds) since the iteration sequence was ordered based on parameter sensitivity (least to most). Specifically, the first round of optimizations was conducted using cumulative amount data for each of the 24 diffusion cells (both temperatures), yielding 24 C0 values which were then averaged to obtain C0_avg. This constraint was then used in the second round of data fitting to obtain updated diffusivity values and partition coefficients at each temperature (32°C and 42°C) using a consistent TDS concentration throughout. Due to relative insensitivity of the partition coefficient parameter, a temperature dependence was not ascribed to this parameter, and the 24 individual partition coefficients were averaged next to obtain KSCp_avg. This new constraint was used, along with C0_avg, in the third and final round of data fitting, thereby yielding individual DSC_42 and DSC_32 values. These global transport parameters were then used in the model to simulate fluxes at both temperatures for comparison to the corresponding in vitro mean flux data.
Fig. 2.

Iterative modeling process used for obtaining global (optimized) transport parameters from 0- to 24-h experimental data (protocols 1 and 2)
For the two-layer TDS model, an initial iterative data fitting process analogous to the one described for the homogeneous one-layer TDS model was performed to yield the total TDS concentration C0, and the skin transport parameters KSCp, DSC_42, and DSC_32. Additional optimizations were then performed by manually adjusting the TDS diffusivities Dadh and Dp2 (for the fast- and slow-release compartments, respectively) and baseline stratum corneum diffusivity (DSC_32) until acceptable agreement between fitted and experimental flux results was obtained, thereby accounting for initial burst behavior. Additional insight into the two-layer TDS can be found in the Discussion. A graph showing the fitting progression from homogeneous to two-layer TDS and then to an adjusted two-layer TDS (for adjusted TDS and baseline diffusivities) for TDS-N1 can be found in the Supplementary Material (Fig. S3).
Using the optimized transport diffusivities obtained from the modeling process along with the Arrhenius relationship (1), the temperature dependence for diffusivity can be calculated as follows:
| (3) |
where R is the gas constant, EA is the activation energy in J/mol, and T1 and T2 are temperatures in K. Rearranging Eq. 3 and simplifying the equation by combining the two temperatures and gas constant, the activation energy, EA, can be expressed as:
| (4) |
Accordingly, the ratio of the two diffusivity values will allow for the experimental determination of the activation energy, EA, for each diffusion cell, thereby providing an average nicotine EA per TDS in this study. This value is comparable to an activation energy estimate of 60 kJ/mol based on approximate literature values for permeants of similar size and lipophilicity (33).
Additionally, Sigma Minus analyses via curve fitting of the cumulative amount data (M(t)) were used as an independent means of assessing TDS concentration (C0) values. Specifically, the total TDS drug amount (Mf) was optimized in order to achieve straight-line semi-log plots of (Mf−M(t)) as a function of time. Mf was then converted to TDS concentration.
Statistical Analysis
All experimental data are presented as means and standard error of the mean (mean ± SEM) with n values representing the number of skin donors, unless otherwise noted. Specifically, the average flux and cumulative amount results for each skin donor and protocol were first calculated. The means and SEM across donors were then calculated from these average values. In the regression analyses, the least squares means and standard error (mean ± SE) are presented. Statistical differences between parameter values for the two different TDS were determined via ANOVA for EA, DSC_32, Jmax, and tmax using a significance level of p < 0.05 and factors of TDS and skin donor.
RESULTS
Experimental Results of Heat Effect on Skin Permeation
Figure 3 shows the experimental data and the increase in nicotine flux across human skin due to elevated temperature (42°C skin surface temperature) compared to the baseline condition (32°C) for both TDS-N1 and TDS-N2. Here heat application occurred during the entire 24-h period of TDS application (protocol 2, Fig. 1). Although the experimental flux profiles differed for TDS-N1 and TDS-N2, peak fluxes for both systems occurred within the first 4 h. The substantially higher experimental flux values at initial time points for TDS-N1 compared to TDS-N2 suggest possible TDS design differences. Specifically, the initial burst of TDS-N1 nicotine flux through the skin indicates a fast nicotine release phase followed by a slower one. Such release kinetics for the nicotine TDS were consistent with the results observed in an in vitro release test (IVRT) experiment, which showed similar initial fast and then slow sustained release kinetics with IVRT fluxes being 2–3 × higher in the fast-release phase and 1–1.5 × in the sustained release phase compared to those in the IVPT study (see IVPT and IVRT data in Fig. 3 and Fig. S4 in the Supplementary Material, respectively). Also, the physical dissection of the TDS revealed the presence of an internal membrane (Fig. S5 in the Supplementary Material), which supports a mechanistic (TDS design) basis for such release kinetics. Overall, the data (symbols) show ~ 2-fold peak flux increase for both TDS-N1 and TDS-N2 with a 10°C increase in skin surface temperature from 32°C, which is consistent with the anticipated skin permeation activation energy of ~ 50–65 kJ/mol. The experimental average increase in cumulative amount of drug delivered due to the application of heat (42°C compared to 32°C) was ~ 1.6 and 1.4 at 24 h for TDS-N1 and TDS-N2, respectively.
Fig. 3.
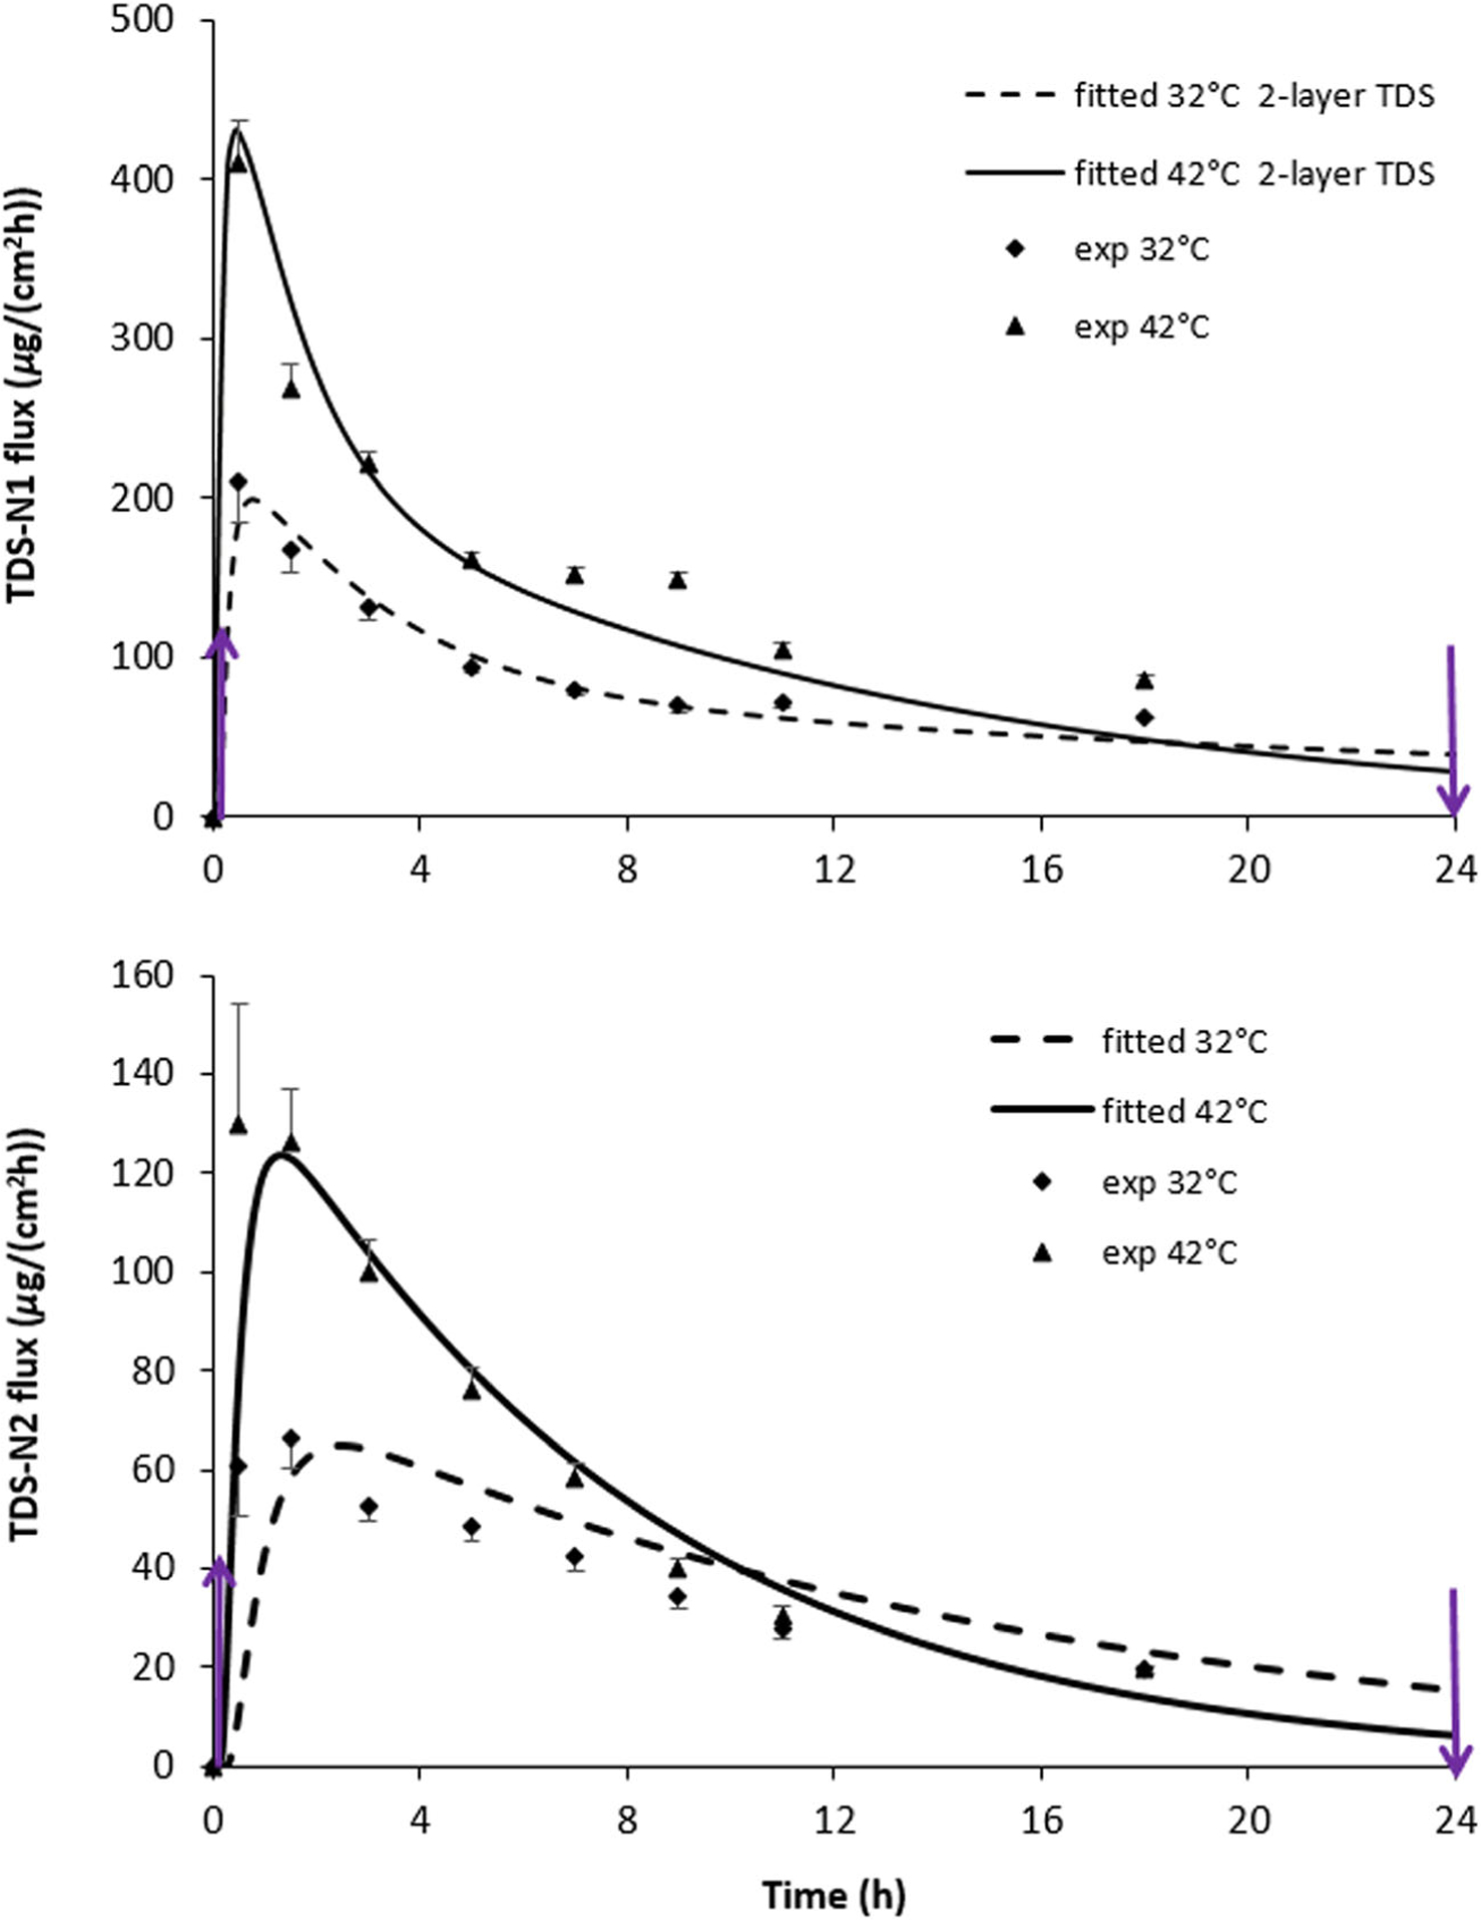
Nicotine flux across human skin from (a) TDS-N1 and (b) TDS-N2 at 32°C and 42°C. Heat was applied from 0 to 24 h (arrows). Mean ± SEM, n = 4 skin donors (average of 3–4 skin samples per donor). For TDS-N1, the solid lines for each temperature level are fitted curves resulting from the 2-layer TDS employing the optimized transport parameters in Table II. For TDS-N2, the solid lines for each temperature level are fitted curves obtained from the homogeneous TDS optimized transport parameters (Table II). Fully hydrated skin parameters were used in the modeling process. TDS-N1 concentrations were 381 mg/mL (homogeneous TDS) and 384 mg/mL (2-layerTDS); TDS-N2 concentration was 108 mg/mL
Skin donor was found via statistical analysis to be a significant factor impacting skin permeation rate for both TDS-N1 and TDS-N2 with and without heat application. Figure 4 illustrates such variability, presented in terms of cumulative permeation. Between-donor variability (e.g., for DSC_32, p = 0.003) was substantially greater than within-donor variability (p > 0.1). Flux variability was largest at early time points for both TDSs (Fig. 3). This phenomenon is discussed later.
Fig. 4.

Cumulative amount (normalized by area) of nicotine permeation across human skin from TDS-N2 at 42°C as a function of skin donor. Heat was applied from 0 to 24 h (arrows). Mean ± SD (n = 3 per donor)
Model Curve Fitting and Statistical Analysis
Fitted flux curves for TDS-N1 and TDS-N2 0–24 h for protocols 1 and 2 are shown in Fig. 3. These curves were produced using the optimized transport parameters obtained from the cumulative amount optimization iterations (Table II), as explained in the Computational Data Analysis section, and are shown in comparison to the corresponding mean experimental nicotine flux data. For TDS-N2, the model fitting and experimental data were in agreement after the initial time points using the homogeneous one-layer TDS computational model. Conversely, better agreement between fitted and experimental data for TDS-N1 was obtained using the two-layer TDS computational model, in order to account for the initial burst (Fig. 3). These results show that the attainment of peak flux occurred slightly faster under elevated temperature compared to the baseline.
Since permeation results are usually presented in terms of flux, the figures herein depict flux values (i.e., the total flux exiting the viable epidermis layer). However, the optimization process was performed using cumulative amount data over a period of time. A representative plot comparing predicted and experimental cumulative amount data for a single diffusion cell can be found in the Supplementary Material (Fig. S1). Visual inspection of the predicted and experimental cumulative permeation profile indicates that the modeling reasonably describes drug permeation across human skin under the influence of heat.
In the model analysis, the TDSs were assumed to be inherently different for the characterization of the key parameters (see Computational Data Analysis) by using individual diffusion cell sample 0–24-h results for each TDS (n = 4 skin donors for each temperature, at least three replicates per skin donor). ANOVA analyses that accounted for skin donor and TDS types revealed that the average TDS concentration, average partition coefficient, and average baseline diffusivity differed significantly between the two TDSs, while the activation energy (EA value) did not (Table II). Baseline diffusivities were consistent with fully hydrated skin conditions as estimated from the Dancik model (32). However, this does not confirm the hydration state of the skin beneath the TDS. An increase in nicotine diffusivity in the SC relative to that expected in partially hydrated skin could be caused by high concentrations of nicotine, high concentrations of water, or the combined impact of both ingredients. Furthermore, the SC/TDS partition coefficient of nicotine, KSCp, may differ from that calculated using Eq. 1 if the partition isotherm is not linear. The effective EA values obtained for both skin and TDS transport combined in the model analysis are close to the experimental EA determined in the skin permeation experiments of nicotine without TDS (footnote in Table II). This suggests that the activation energy of drug release from TDS is close to that of drug transport across the skin. Parallel ANOVA analyses on simulated (predicted) Jmax revealed significant differences with respect to temperature and TDS (Table III). Peak delivery rates for the two TDSs were significantly different at both temperatures. A significant difference in tmax due to heat application was only seen with TDS-N2. This is most likely reflective of the non-homogeneous TDS model for TDS-N1 versus the homogeneous TDS model for TDS-N2.
Table III.
Nicotine Peak Flux, Delivery Rate (ANOVA Least Squares Mean ± SE, n = 4 Skin Donors, 3–4 Replicates Per Donor) Obtained from Optimization Simulations of 0–24-h 32°C and 42°C In Vitro Permeation Data in Franz Diffusion Cells (Protocols 1 and 2)
| Product | Jmax (μg/(cm2·h)) | Peak delivery ratea (Jmax × A, mg/h) | tmax (h) | |||
|---|---|---|---|---|---|---|
| 42°Cb | 32°Cb | 42°Cc | 32°Cc | 42°Cc | 32°C | |
| TDS-N1 (two-layer TDS) | 270 ± 10 | 161 ± 10 | 6.0 ± 0.2 | 3.6 ± 0.2 | 2.4 ± 0.2 | 2.8 ± 0.2 |
| TDS-N2 (homogeneous TDS) | 121 ± 10 | 60 ± 10 | 3.5 ± 0.2 | 1.7 ± 0.2 | 1.5 ± 0.1 | 2.9 ± 0.1 |
21 mg/24 h TDS surface area
Products significantly different, p < 0.05
Products significantly different, p ≤ 0.001
Comparison of Model Predictions and Experimental Data
Figures 5 and 6 show the experimental nicotine flux data of TDS-N1 and TDS-N2, respectively, across human skin as a function of heat application for different durations and application times (protocols 3–6). In each case, nicotine flux increased significantly within 1 h of heat application. Higher flux values were observed when heat was applied earlier during the application period of 24 h. The percentage of nicotine remaining in TDS and total drug recovery were also examined. In general, the percentage of drug remaining in the TDS aligned with heat exposure duration and TDS application for the individual protocols. Details can be found in the Supplementary Material (Table SI).
Fig. 5.
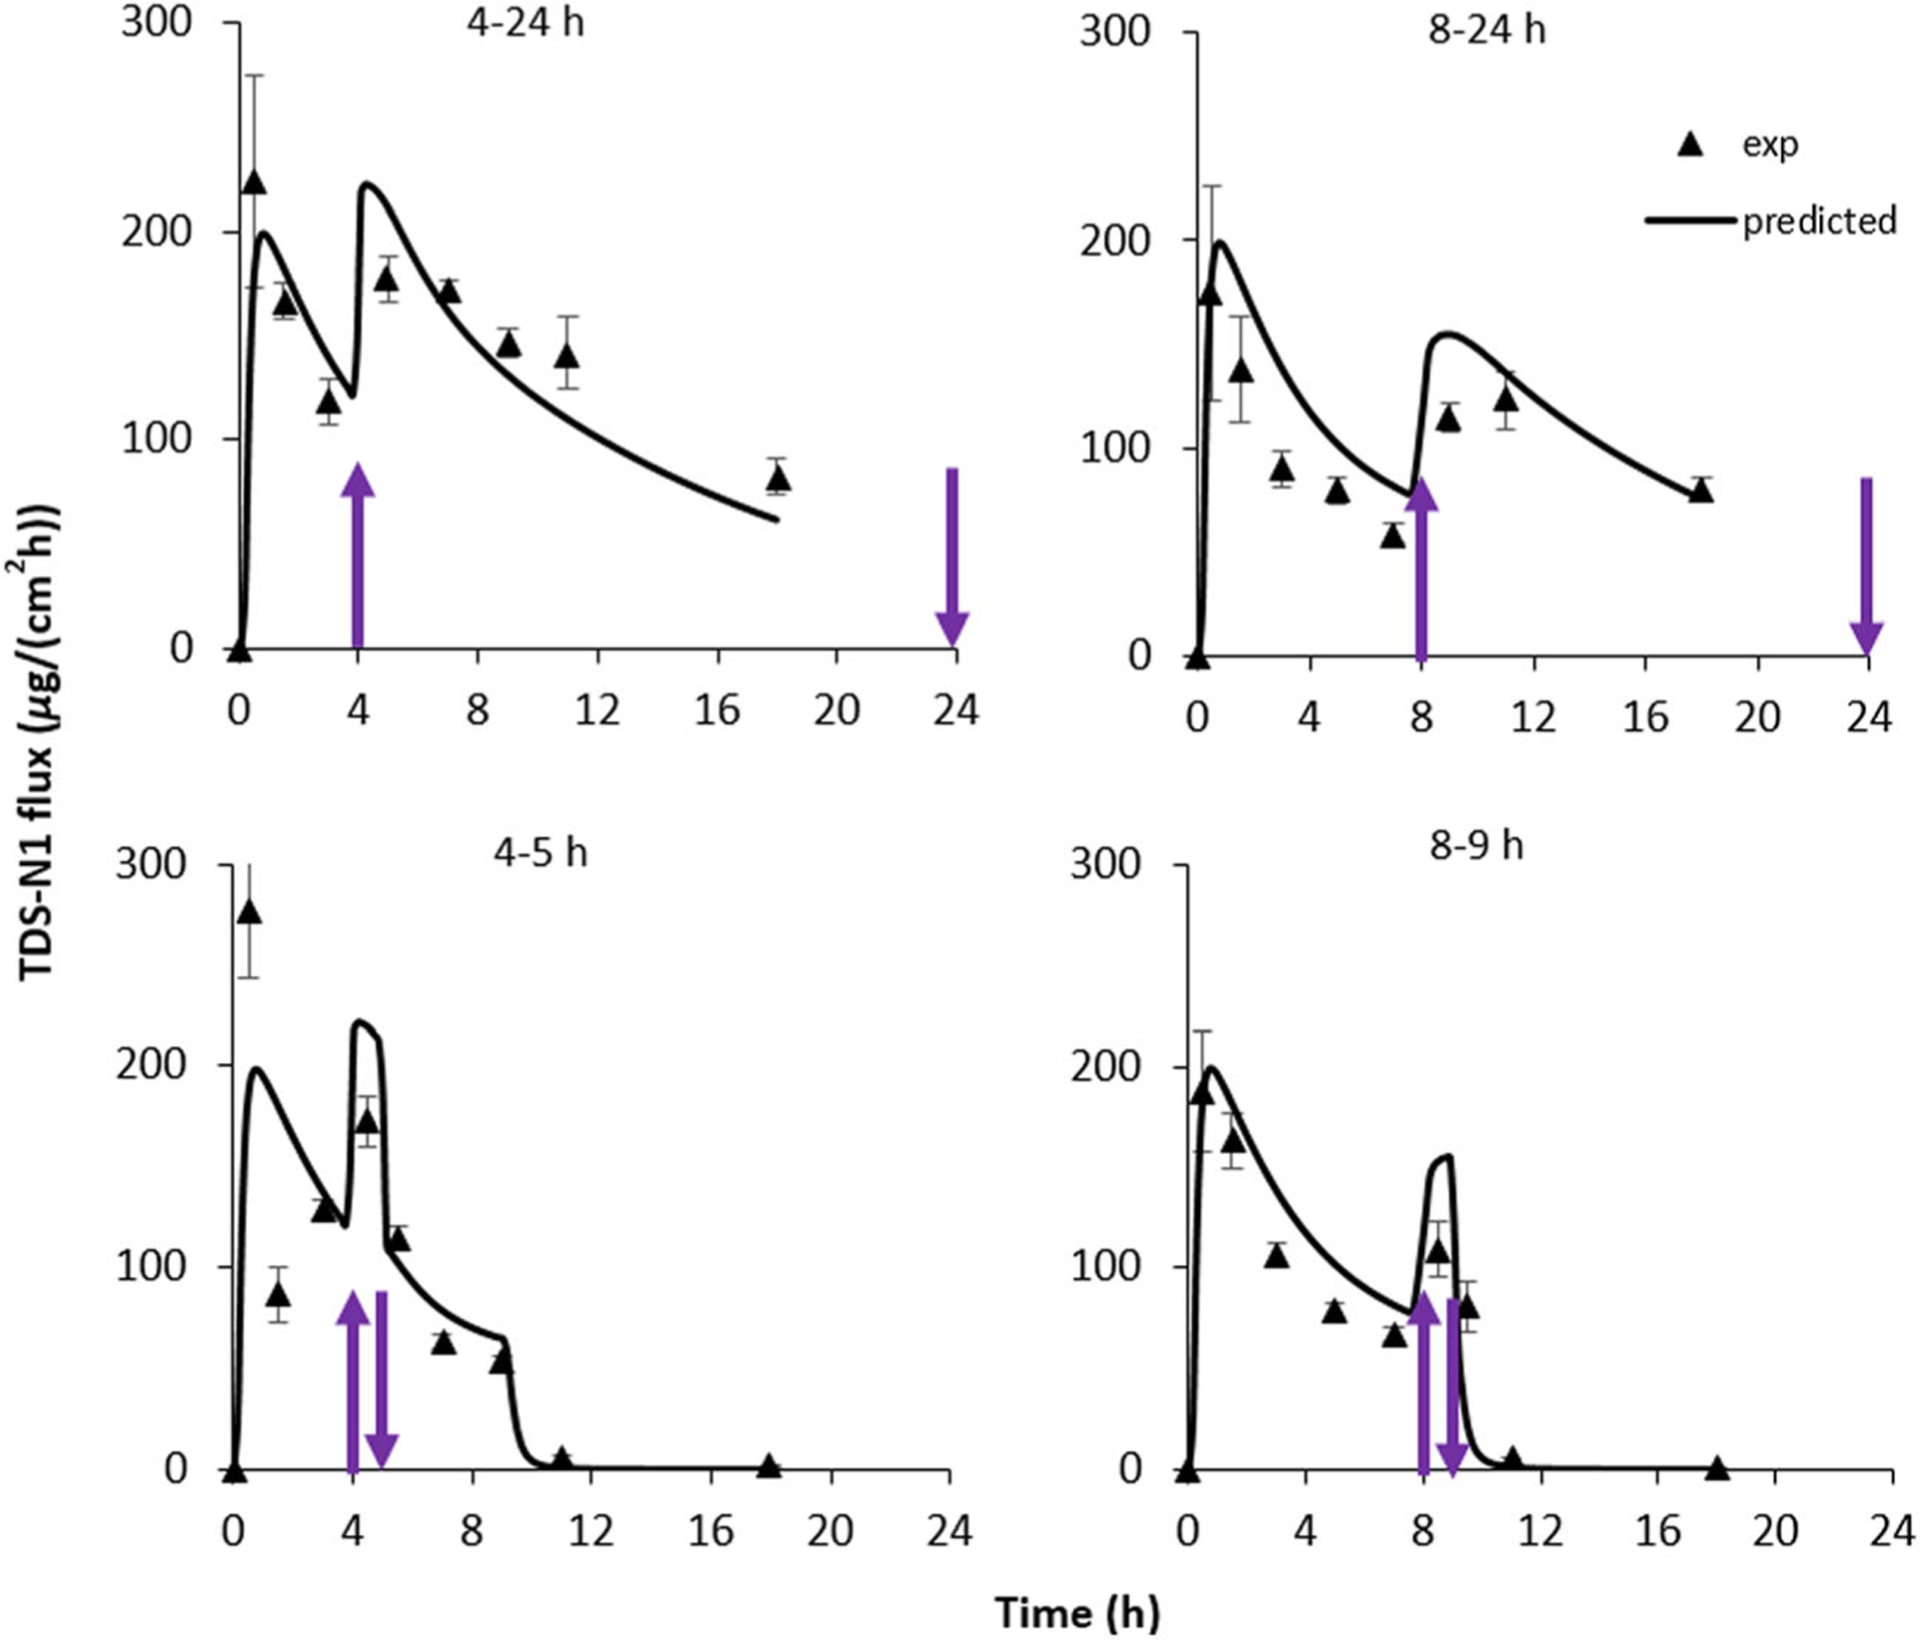
Nicotine flux across human skin from TDS-N1. Heat (42°C) was applied for the times shown and indicated by the arrows. Mean ± SEM, n = 4 skin donors (average of 3–4 skin samples per donor). Solid lines for each temperature level are predicted curves obtained using the model optimization values. The 4–5- and 8–9-h simulations mimicked TDS removal at 9 h. Parameters of fully hydrated skin and a nicotine concentration of 384 mg/mL were used in the 2-layer TDS modeling process
Fig. 6.

Nicotine flux across human skin from TDS-N2. Heat (42°C) was applied for the times shown and indicated by the arrows. Mean ± SEM, n = 4 skin donors (average of 3–4 skin samples per donor). Solid lines for each temperature level are predicted curves obtained using the model optimization values. The 4–5- and 8–9-h simulations mimicked TDS removal at 9 h. Parameters of fully hydrated skin and a nicotine concentration of 108 mg/mL were used in the modeling process
Predicted fluxes for the 4–5-h, 8–9-h, 4–24-h, and 8–24-h heat application protocols using the average transport parameters (C0, KSCp, DSC_32, and EA) derived from the 0–24-h model curve fitting studies with the optimization process are also shown in Figs. 5 and 6 for TDS-N1 and TDS-N2, respectively. Agreement between the model predictions and experimental data was observed for both TDSs. The corresponding increases (calculated) in simulated cumulative amount of drug delivered across the skin during heat application for both TDS-N1 and TDS-N2 (~ 1.5-fold for heat application duration for all heat protocols) were consistent with those determined experimentally. Despite the inter-skin variability observed with the experimental data, the model was able to reasonably predict the mean drug delivery enhancement following heat application. The results illustrate the value of the computational model, predicated upon reasonable estimates for input parameters, as a predictive tool.
Prediction of Maximum Heat Effect on Drug Delivery
To identify the effects of heat application times that may result in a significant increase in TDS flux, model simulations were conducted for heat applications in periodic intervals for the duration of TDS application. Figure 7(a) shows the results of these simulations for nicotine with heat application of 42°C compared to 32°C. The observed heat-induced flux enhancement behavior can be divided into two categories in this simulation plot: before tmax in the 32°C profile (before the flux reaches Jmax in the baseline profile) and after tmax in this profile. Early heat application prior to the attainment of the peak flux in the 32°C profile (i.e., first category) provided the largest enhancement in drug delivery compared to the 32°C baseline data due to the decrease in transport lag time under heat application. Earlier heat application time corresponded to a larger flux enhancement. The early heat application also provided peak flux of the highest magnitude. The results observed could have implications with respect to systemic bioavailability despite the fleeting temporal nature of the enhancement in drug delivery. When heat was applied after tmax of the 32°C profile (i.e., second category), the peak flux increase was consistently ~ 2-fold across for the entire time range. The magnitude of peak flux diminished gradually over this time period, similar to those observed with the experimental data.
Fig. 7.

The effect of heat application time on TDS peak flux. Simulations were performed using a TDS-N1 parameters (DSC of 3.77 × 10⁻¹⁰ cm2/s) and permeant parameters corresponding to DSC of b 4 × 10⁻⁹ cm2/s and c 1 × 10⁻¹⁰ cm2/s and fully hydrated skin condition
As the effect of heat application time is expected to differ with permeants of different physicochemical properties, such as permeant molecular sizes, which can impact their SC diffusivities, simulations were conducted to investigate the effect of heat application time on peak flux for additional DSC values. Figure 7(b, c) displays the simulation results for DSC values of 4 × 10⁻⁹ cm2/s (corresponding to MW ≈ 70 Da) and 1 × 10⁻¹⁰ cm2/s (MW ≈ 240 Da), respectively, under the assumption that the other parameters are identical to those of nicotine. For a permeant smaller than nicotine (Fig. 7(b)), the roughly 2-fold increase in peak flux observed at the earlier heat application times diminished much faster as time progressed compared to those of nicotine (Fig. 7(a)). This behavior could be attributed to the faster drug depletion from the TDS at the higher DSC. Conversely, for a larger permeant (Fig. 7(c)), the sharp flux increases (the behavior in Fig. 7(a, b)) were not seen initially, demonstrating the influence of the lower DSC on heat effects at those time points. Larger solutes also display delayed drug depletion behavior. Despite that the flux profiles were significantly influenced by DSC, the heat application protocols that produce the highest peak fluxes (leading to the “worst case” scenario of unintentional effect of heat) were the ones for which heat was applied at the early time points. In other words, these simulation results suggest that heat effect testing of earlier heat application times will likely provide more information on the highest Jmax from a TDS for the parameter ranges investigated in the present study. However, a caveat in this type of study design (early heat application) is the large flux variability usually encountered in the early time period of a permeation study, which will be discussed in the next section.
DISCUSSION
Effect of Heat on Nicotine Delivery and Data Analysis
This study showed (both experimentally and from the simulations) ~ 2-fold average increase in peak flux for the nicotine TDS with a 10°C increase in skin surface temperature over normothermic conditions. Using the modeling approach, the effects of elevated temperature on transport parameters C0, DSC, and KSCp were evaluated. The increase in DSC is commensurate with the normal range of EA for skin permeation reported previously for molecules that have similar size and lipophilicity (33) as well as the experimental EA value observed for nicotine in the present skin permeation study without the TDS (footnote in Table II). As 42°C is regarded as the maximum temperature tolerable for human skin exposure (34), this increase can be considered to be representative of the maximum heat-induced increase in transdermal delivery of nicotine from a TDS. An objective of the present study was to identify the heat application protocols that resulted in maximum enhancement in drug delivery following the application of heat, and one of these factors was the time at which heat application was initiated over the course of the application of the product. Experimentally, it was found that heat applied immediately following TDS application resulted in higher Jmax among the studied protocols (protocols 1–6), a finding consistent with finite drug loading in TDS. Investigating the effect of all scenarios of heat applications (times and durations) on transdermal delivery in vitro could be exhaustive, and hence the number of heat application regimens examined was limited to five protocols in the present study. The goal of the computational model was to expand on the limited in vitro dataset and evaluate the effects of heat under alternate heat application scenarios with the ultimate goal of identifying the “worst case” scenario for evaluation of a TDS under the influence of heat. To demonstrate the utility of the computational approach, simulations were extended to other heat application protocols (Fig. 7(a)) and hypothetical drugs of different molecular weights (Fig. 7(b, c)). The simulations provide a means to predict and assess flux profiles under different heat application times and durations using the parameters obtained from the two 24-h heat protocols of skin permeation experiments in vitro. This approach could have a unique advantage over time-consuming IVPT screening. However, it should be cautioned that the proposed model was tested with nicotine TDS only, and the applicability of the model and its findings to other drug molecules remain to be investigated.
Mechanistic Understanding of TDS Drug Transport and Heat Effect
In addition to the prediction of flux profiles and statistical analysis of the transport parameters for TDS comparison, relevant information regarding in vitro transdermal drug transport with TDS was also gleaned from the analyses of the results for both types of TDS design. For example, with the homogeneous one-layer TDS model, the SC presents the main transport barrier for nicotine, as evidenced by parametric sweeps (26) conducted for the transport parameters of each layer; the diffusivity and partitioning parameters of SC are important for characterizing drug delivery from TDS under the application of heat. In contrast, the characterization of TDS-N1, which necessitated the use of a two-layer TDS model, indicated that the TDS, by virtue of its slow-release compartment, provided a significant resistive barrier to mass transport, rather than the SC alone. In this case, both the TDS and SC transport parameters impact heat-enhanced TDS drug delivery. Thus, TDS drug delivery is controlled by skin for TDS-N2, but is controlled by both skin and TDS for TDS-N1. Furthermore, the effect of heat on the skin transport barrier is essentially the same for the two nicotine TDSs studied, as reflected by the similarity in EA between the TDSs. Little evidence from this study is presented to suggest that differences in TDS formulations, such as the presence of different excipients, impact the enhancement of drug delivery due to application of heat. The difference in flux magnitudes between the two TDSs (cf. Figures 5 and 6) can be potentially attributed to the different effective concentrations of nicotine in the two TDSs.
Another finding in the present study is the different behaviors of heat and mass transfer across skin with TDS under elevated temperature conditions. In all simulations, the heat transfer was several orders of magnitude faster than that of mass transport. This implies that steady-state thermal conditions were attained relatively quickly compared to corresponding drug permeation. The heat transfer result is consistent with the finding in a previous study (29) and is not surprising because the SC is a thin membrane and its thermal resistivity is not markedly different from that of water (35). In addition, while the SC acts as a significant barrier to permeation of most molecules compared to the other layers of the skin, the thermal parameters for the various skin layers differ on a much smaller scale. The large difference in the timescales for heat and mass transport in skin permeation suggests that a transient heat transfer model is generally not required in the simulation and analysis of the in vitro permeation data because one could assume a steady-state temperature profile for the skin slab and base the transport parameters on a constant temperature gradient. This approach is further described in the accompanying report (26). Still, it could be complicated to calculate the skin flux from variable diffusion parameters related to the temperature gradient within the barrier. The COMSOL software facilitates the computational effort and easily allows for studying any changes under temperature exposures.
The present analysis is in contrast with those reported by Tominaga and Tojo (5), where similar heat effects were observed for TDS products containing nonsteroidal anti-inflammatory drugs, but the results were represented in terms of increased skin surface concentrations of drug molecules rather than increased diffusivity in the SC. The conclusions within the publication referenced above were based on SC diffusivity values that were calculated using the time lag relationship, tL = h2/6DSC. While the equation is appropriate for evaluation of diffusivity for a homogenous membrane system in which the time lag for diffusion is dictated by a single membrane, the equation may not be appropriate for a two-layer system including both the TDS and SC.
Data Variability
Overall, the predicted flux obtained using the in silico model was in agreement with the experimental flux for the various heat application protocols. Flux variability at all time points was addressed through the implementation of data criteria for identifying outliers, which dictated experimental repeats. Nevertheless, higher data variability was observed in the flux results for the first time points. Potential explanations for this behavior include variability commonly observed during transient drug transport across skin (e.g., at time < transport lag time) which is usually larger than the variability observed at steady state (36). The skin could also undergo skin hydration and swelling after TDS application, and this hydration process could lead to enhanced drug transport (37) augmenting the variability, particularly in the initial time points. The use of aliquot sampling would introduce variability in the flux calculation due to propagation of errors in the calculation of differential cumulative amounts; i.e., a small percentage error in the cumulative amount values could result in a significant error in the calculated flux values. Another source of variability is the instrumentation limitation inherent with the PID temperature control that could result in a delay in reaching the target temperature. This phenomenon is demonstrated in the representative temperature versus time plot in the Supplementary Material (Fig. S2). Variability could also be related to the delayed response of the experimental fluxes compared to model predictions, particularly for Jmax and other time points after Jmax. This delay is due to the manner in which the flux data were determined when the cumulative amount sampling was collected at time points after drug permeation had occurred. Regardless of the source of variability, the flux variability exhibited in the first few time points does not preclude subsequent data analysis or satisfactory modeling results.
CONCLUSIONS
Nicotine permeation across human skin in vitro was ~ 2-fold higher at 42°C than that at 32°C, with maximum flux increases occurring shortly after the introduction of heat. Heat transfer was orders of magnitude faster than the accompanying mass transport. A key finding is that the computational model, using experimental data from continuous heat exposure studies (e.g., 24-h heating regimen), adequately predicted nicotine flux from TDS under transient heat application scenarios (e.g., 4–5-h, 8–9-h, 4–24-h, and 8–24-h heating regimens). Thus, limited data can be used to generate flux profiles for a wide variety of exposure conditions with the model. In other words, the model enabled the evaluation of TDS heat effects under different conditions, facilitating the identification of “worst case” scenarios with limited data. In conjunction with experimental data, the model also has the capability to identify differences in TDS design features that impact the rate of drug release. The mechanistic understanding obtained through the determination of mass transport parameters allows for the identification of TDS differences using a parameter-based analysis, implicating details which may have been missed otherwise. Similar activation energies for nicotine diffusion were obtained for the two TDSs mounted on the skin and for nicotine delivered from aqueous solution, suggesting that the dominant effect of elevated temperatures for the TDSs tested was a heat-induced increase in stratum corneum permeability. However, a full range of TDS architectures or excipients has not been tested. The combination of in vitro experiments and computational models allows the analyses of skin transport parameters under elevated temperature conditions and is a promising approach to evaluate heat effects on drug delivery from TDS.
Supplementary Material
ACKNOWLEDGMENTS
The authors gratefully acknowledge the contributions to the IVPT study design by Dr. Audra Stinchcomb, Dr. Hazem Hassan, Soo Hyeon Shin, and others at the University of Maryland, as well as Dr. Bryan Newman, Dr. Robert Lionberger, and others at the FDA. The authors also thank Daniel M. Frey for his help in the laboratory.
FUNDING INFORMATION
Funding for this project was made possible, in part, by the US Food and Drug Administration (FDA) through a cooperative agreement (Research Award U01 FD004942). In response to funding opportunity announcement RFA-FD-13-015, separate research projects were awarded in parallel to the University of Cincinnati and the University of Maryland, and each institution was requested by the FDA to perform independent research with the same drug products under comparable study conditions in a manner coordinated by the FDA.
Abbreviations:
- AUC
Area under the curve
- CHADD
Controlled heat-assisted drug delivery
- C
Concentration
- cadh
Fast-release compartmental concentration in the two-layer TDS
- C0
TDS concentration
- Cmax
Maximum concentration
- DE
Dermis
- Dadh
Fast-release compartmental diffusivity in the two-layer TDS
- Dp
Homogeneous TDS diffusivity
- Dp2
Slow-release compartmental diffusivity in the two-layer TDS
- DSC_32
Stratum corneum diffusivity (DSC) for 32°C
- DSC_42
DSC for 42°C
- EA
Activation energy
- IVPT
In vitro permeation test
- Jmax
Maximum (peak) flux
- Jmax_sim
Simulation Jmax
- Jmax_exp
Experimental Jmax
- KSCp
SC/TDS partition coefficient
- Koct
Octanol-water partition coefficient
- Mf
Total (cumulative) amount of drug permeated
- M(t)
Cumulative amount of drug permeated at a given time
- PBS
Phosphate-buffered saline
- PID
Proportional-integral-derivative
- SC
Stratum corneum
- T
Temperature
- tmax
Time when maximum flux occurs
- tmax_sim
Simulation tmax
- TDS
Transdermal delivery system(s)
- UC/UB
University of Cincinnati/University of Buffalo
- VE
Viable epidermis
- z
Position in the membrane along the axis perpendicular to the skin surface
Footnotes
Publisher's Disclaimer: Disclaimer This article reflects the views of the authors and should not be construed to represent the US Food and Drug Administration’s views or policies. The views expressed in this paper do not reflect the official policies of the Department of Health and Human Services, nor does any mention of trade names, commercial practices, or organization imply endorsement by the United States Government.
Electronic supplementary material The online version of this article (https://doi.org/10.1208/s12248-020-00457-w) contains supplementary material, which is available to authorized users.
REFERENCES
- 1.Scheuplein RJ. Analysis for permeability data for the case of parallel diffusion pathways. Biophys J. 1966;6:1–17. [DOI] [PMC free article] [PubMed] [Google Scholar]
- 2.Potts RO, Francoeur ML. Lipid biophysics of water loss through the skin. Proc Natl Acad Sci U S A. 1990;87:3871–3. [DOI] [PMC free article] [PubMed] [Google Scholar]
- 3.Blank IH, Scheuplein RJ, MacFarlane DJ. Mechanism of percutaneous absorption III. The effect of temperature on the transport of non-electrolytes across the skin. J Invest Dermatol. 1967;49:582–9. [PubMed] [Google Scholar]
- 4.Peck KD, Ghanem A-H, Higuchi WI. The effect of temperature upon the permeation of polar and ionic solutes through human epidermal membrane. J Pharm Sci. 1995;84:975–82. [DOI] [PubMed] [Google Scholar]
- 5.Tominaga K, Tojo K. Effect of environmental temperature on transdermal drug penetration. Biol Pharm Bull. 2010;33:1983–7. [DOI] [PubMed] [Google Scholar]
- 6.Oliveira G, Leverett JC, Emamzadeh M, Lane ME. The effect of heat on skin barrier function and in vivo dermal absorption. Int J Pharm. 2014;464:145–51. [DOI] [PubMed] [Google Scholar]
- 7.Akomeah F, Nazir T, Martin GP, Brown MB. Effect of heat on the percutaneous absorption and skin retention of three model penetrants. Eur J Pharm Sci. 2004;21:337–45. [DOI] [PubMed] [Google Scholar]
- 8.Clarys P, Alewaeters K, Jadoul N, Barel A, Manadas RO, Preat V. In vitro percutaneous penetration through hairless rat skin: influence of temperature, vehicle, and penetration enhancers. Eur J Pharm Biopharm. 1998;46:279–83. [DOI] [PubMed] [Google Scholar]
- 9.Wood DG, Brown MB, Jones SA. Understanding heat-facilitated drug transport across human epidermis. Eur J Pharm Biopharm. 2012;81:642–9. [DOI] [PubMed] [Google Scholar]
- 10.Park J-H, Lee J-W, Kim Y-C, Prausnitz MR. The effect of heat on skin permeability. Int J Pharm. 2008;359:94–103. [DOI] [PMC free article] [PubMed] [Google Scholar]
- 11.Hull W Enhanced transdermal delivery: a survey paper. J Appl Res. 2002;2:1–10. [Google Scholar]
- 12.Prodduturi S, Sadrieh N, Wokovich AM, Doub WH, Westenberger BJ, Buhse L. Transdermal delivery of fentanyl from matrix and reservoir systems: effect of heat and compromised skin. J Pharm Sci. 2010;99:2357–66. [DOI] [PubMed] [Google Scholar]
- 13.Varvel JR, Shafer SL, Hwang SS, Coen PA, Stanski DR. Absorption characteristics of transdermally administered fentanyl. Anesthesiol. 1989;70:928–34. [DOI] [PubMed] [Google Scholar]
- 14.Ashburn MA, Ogden LL, Zhang J, Love G, Basta SV. The pharmacokinetics of transdermal fentanyl delivered with and without controlled heat. J Pain. 2003;4:291–7. [DOI] [PubMed] [Google Scholar]
- 15.Petersen KK, Rousing ML, Jensen C, Arendt-Nielsen L, Gazerani P. Effect of local controlled heat on transdermal delivery of nicotine. Int J Physiol Pathophysiol Pharmacol. 2011;3:236–42. [PMC free article] [PubMed] [Google Scholar]
- 16.Klemsdal TO, Gjesdal K, Bredesen J-E. Heating and cooling of the nitroglycerin patch application area modify the plasma level of nitroglycerin. Eur J Clin Pharmacol. 1992;43:625–8. [DOI] [PubMed] [Google Scholar]
- 17.Moore KJ, Sathyan G, Richarz U, Natarajan J, Vandenbossche J. Randomized 5-treatment crossover study to assess the effects of external heat on serum fentanyl concentrations during treatment with transdermal fentanyl systems. J Clin Pharmacol. 2012;52:1174–85. [DOI] [PubMed] [Google Scholar]
- 18.Shomaker TS, Zhang J, Ashburn MA. Assessing the impact of heat on the systemic delivery of fentanyl through the transdermal fentanyl delivery system. Pain Med. 2000;1:225–30. [DOI] [PubMed] [Google Scholar]
- 19.Vanakoski J, Seppala T, Sievi E, Lunell E. Exposure to high ambient temperature increases absorption and plasma concentrations of transdermal nicotine. Clin Pharmacol Ther. 1996;60:308–15. [DOI] [PubMed] [Google Scholar]
- 20.Gupta SK, Southam M, Hwang SS. System functionality and physicochemical model of fentanyl transdermal system. J Pain Symptom Manage. 1992;7:S17–26. [DOI] [PubMed] [Google Scholar]
- 21.Gourlay GK. Treatment of cancer pain with transdermal fentanyl. Lancet Oncol. 2001;2:165–72. [DOI] [PubMed] [Google Scholar]
- 22.Nelson L, Schwaner R. Transdermal fentanyl: pharmacology and toxicology. J Med Toxicol. 2009;5:230–41. [DOI] [PMC free article] [PubMed] [Google Scholar]
- 23.Rose PG, Macfee MS, Boswell MV. Fentanyl transdermal system overdose secondary to cutaneous hyperthermia. Anesth Analg. 1993;77:390–1. [DOI] [PubMed] [Google Scholar]
- 24.Snackey K Transdermal fentanyl patches and heat-associated toxicities. Hospital U The Prescription. 4 San Antonio, TX: University Health System Pharmacy Dept; 2007. [Google Scholar]
- 25.Hao J, Ghosh P, Li SK, Newman B, Raney SG, Kasting GB, et al. Heat effects on drug delivery across human skin. Expert Opin Drug Deliv. 2016;13:755–68. [DOI] [PMC free article] [PubMed] [Google Scholar]
- 26.La Count TD, Zhang Q, Hao J, Ghosh P, Raney SG, Talattof A, et al. Modeling temperature-dependent dermal absorption and clearance for transdermal and topical drug applications. AAPS J 22(3):70 10.1208/s12248-020-00451-2. [DOI] [PMC free article] [PubMed] [Google Scholar]
- 27.Shin SH, Thomas S, Raney SG, Ghosh P, Hammell DC, El-Kamary SS, et al. In vitro-in vivo correlations for nicotine transdermal delivery systems evaluated by both in vitro skin permeation (IVPT) and in vivo serum pharmacokinetics under the influence of transient heat application. J Control Release. 2018;270:76–88. [DOI] [PubMed] [Google Scholar]
- 28.Kasting GB, Bowman LA. DC electrical properties of frozen, excised human skin. Pharm Res. 1990;7:134–43. [DOI] [PubMed] [Google Scholar]
- 29.Zhang Q, Murawsky M, La Count TD, Hao J, Kasting GB, Newman B, et al. Characterization of temperature profiles in skin and transdermal delivery system when exposed to temperature gradients in vivo and in vitro. Pharm Res. 2017;34:1491–504. [DOI] [PMC free article] [PubMed] [Google Scholar]
- 30.EPA. Estimation Program Interface (EPI) Suite v 4.11 Washington DC: U.S. Environmental Protection Agency; 2013. [Available from: http://www.epa.gov/oppt/exposure/pubs/episuite. [Google Scholar]
- 31.Widmer RJ, Stewart RH, Young MF, Laurinec JE, Laine GA, Quick CM. Application of local heat induces capillary recruitment in the Pallid bat wing. Am J Physiol Regul Integr Comp Physiol. 2007;292:R2312–7. [DOI] [PubMed] [Google Scholar]
- 32.Dancik Y, Miller M, Jaworska J, Kasting GB. Design and performance of a spreadsheet-based model for estimating bioavailability of chemicals from dermal exposures. Adv Drug Deliv Rev. 2013;65:221–36. [DOI] [PubMed] [Google Scholar]
- 33.Mitragotri S Temperature dependence of skin permeability to hydrophilic and hydrophobic solutes. J Pharm Sci. 2007;96:1832–9. [DOI] [PubMed] [Google Scholar]
- 34.Brown MB, Traynor MJ, Martin GP, Akomeah FK. Transdermal drug delivery systems: skin perturbation devices In: Jain KK, editor. Drug Delivery Systems. Totowa NJ: Humana Press (Springer Science); 2008. [DOI] [PubMed] [Google Scholar]
- 35.Cohen ML. Measurement of the thermal properties of human skin. A review. J Invest Dermatol. 1977;69:333–8. [DOI] [PubMed] [Google Scholar]
- 36.Scheuplein RJ. Mechanism of percutaneous absorption II. Transient diffusion and the relative importance of various routes of skin penetration. J Invest Dermatol. 1967;48:79–88. [PubMed] [Google Scholar]
- 37.Li X, Johnson R, Weinstein B, Wilder E, Smith E, Kasting GB. Dynamics of water transport and swelling in human stratum corneum. Chem Eng Sci. 2015;138:164–72. [Google Scholar]
Associated Data
This section collects any data citations, data availability statements, or supplementary materials included in this article.