

Abstract
Objective
To investigate a novel approach for determining the effects of energy-standardized dinner meals (high-fat and low-fat) on respiratory exchange ratio (RER) dynamics and metabolic flexibility.
Methods
Using a randomized, crossover study design, energy expenditure (EE), RER, and macronutrient oxidation rates were assessed in response to a single dinner meal during an overnight stay in a whole-body room calorimeter. Eight healthy adults completed two overnight chamber stays while fed either a high-fat (60% fat, 20% carbohydrate (CHO), 20% protein; food quotient (FQ)=0.784) or low-fat (20% fat, 60% CHO, 20% protein; FQ=0.899) dinner containing 40% of daily energy requirements.
Results
Following the low-fat meal, CHO oxidation first increased before decreasing resulting in a 12-h RER:FQ ratio close to 1.0 (0.986±0.019, p=0.06) and therefore in a 12-h equilibrated fat balance (29±76 kcal/12-h). Following the high-fat meal, participants had a RER:FQ ratio above 1.0 (1.061±0.017, p<0.01), resulting in a significant positive 12-h fat balance of 376±142 kcal/12-h. Various RER trajectory parameters were significantly different following the high-fat and low-fat meals.
Conclusions
This proof-of-concept study provides an alternative approach to quantify metabolic flexibility in response to a high-fat dinner and can be used to derive indexes of metabolic flexibility such as 12-h RER:FQ ratio or 12-h fat balance.
Keywords: Energy Metabolism, Lipid Metabolism, Carbohydrate Metabolism, Indirect Calorimetry
INTRODUCTION
Metabolic flexibility is the ability to adapt fuel oxidation to fuel availability and energy demands (1, 2). Impaired metabolic flexibility is associated with ectopic lipid deposition (3, 4), insulin resistance (2, 5), weight gain (6), and the potential development of type 2 diabetes (T2DM) (5). Recent evidence from genetic studies suggests that impaired cellular lipid oxidation is associated with the development of T2DM independent of weight gain (4). Thus, impaired metabolic flexibility to excessive fat consumption may be an etiologic factor driving weight gain, insulin resistance, and the development of T2DM.
Metabolic flexibility is commonly measured during a hyperinsulinemic-euglycemic clamp. Yet, this technique is questioned because it relies on a non-physiological stimulus (intravenous glucose and insulin), is confounded by differences in insulin sensitivity (7), and inherently suppresses fat oxidation via the artificial hyperinsulinemic condition (e.g. 8). In contrast, measurement of metabolic flexibility with a metabolic cart following a single mixed meal allows for a more robust physiological assessment (9, 10), but is confounded by short measurement windows and the use of canopies or masks that are often uncomfortable and may cause anxiety and stress to study participants (11). Although these confounds can be avoided with whole-room calorimetry, current experimental paradigms require multiple days in a calorimeter following increased consumption of dietary fat (12, 13), thus limiting their practicality. With the improvement in response time and accuracy of whole-room calorimeters, it is now possible to conduct shorter protocols for rapid assessment of metabolic flexibility by measuring changes in respiratory exchange ratio (RER) over 8 to 12 hours following standardized meals with different macronutrient compositions.
In the present study, we investigated whether metabolic flexibility could be effectively measured following a single dinner eaten during an overnight stay in a whole-body room indirect calorimeter. We conducted a randomized, crossover trial in healthy adults to assess changes in RER over time and to calculate 12-h substrate oxidation following two isocaloric dinner meals (low-fat: 20% vs. high-fat: 60%). Since protein and carbohydrate (CHO) stores are tightly regulated (14, 15), fat is the only macronutrient that contributes to a chronic imbalance between intake and oxidation (14). Thus, we hypothesized that impaired fat oxidation in response to the high-fat meal would be indicative of metabolic inflexibility. In other words, some individuals will increase fat oxidation more than others in the hours following the high-fat meal. We defined metabolic flexibility as a 12-h RER:FQ (food quotient) ratio equal or below 1.00 thus resulting in 12-h fat balance equal to zero, or even negative.
METHODS
Individuals aged 18 to 40 years with body mass index (BMI) between 20 and 30 kg/m2 were eligible to participate in the METFLEX study (NCT03839641) at the Pennington Biomedical Research Center (PBRC). Participants were excluded for unstable weight (gain or loss of >3 kg in last 3 months); current shift work; smoking; hypertension; history of diabetes or fasting glucose ≥126 mg/dL; amenorrhea; previous weight loss surgery; history of chronic diseases; adherence to special diets during the last 3 months; and use of medications affecting metabolism or sleep. The PBRC Institutional Review Board approved the study, and all participants provided written informed consent before participating.
At screening, height, weight, vital signs, body composition (Lunar iDXA, General Electric, Milwaukee, WI), and fasting metabolites were measured. Participants completed two overnight stays in a room calorimeter (5-7 day washout) and received either a low-fat (20% fat, 60% CHO, 20% protein; FQ=0.899) or high-fat (60% fat, 20% CHO, 20% protein; FQ=0.784) isocaloric dinner in random order (Figure S1). To control for preceding energy and macronutrient balances, meals were provided 36-h prior to each inpatient stay (30% fat, 50% CHO, 20% protein; FQ=0.871; 100% of daily estimated energy requirements). Participants resided in the calorimeter overnight for 13-h (from 1800 to 0700 h) (Figure 1, x-axis). Dinner was consumed between 1900 to 1930 h, and accounted for 40% of daily energy requirements (16).
Figure 1.
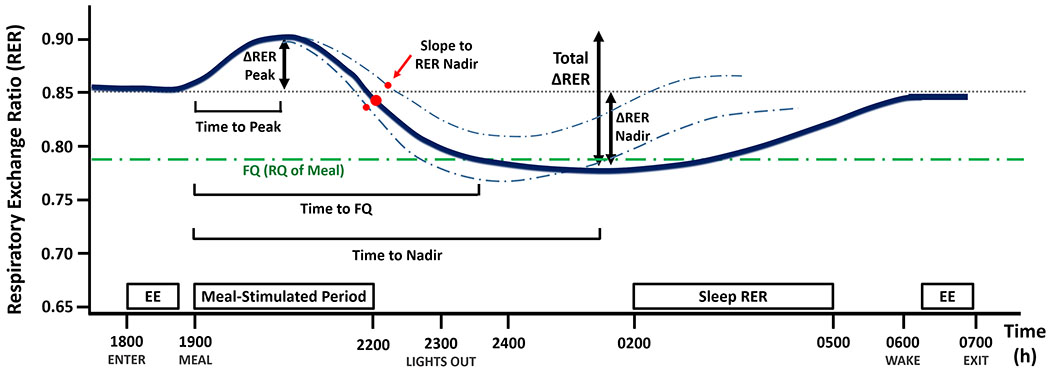
Proposed overnight RER parameters for assessing metabolic flexibility after a meal. Parameters are defined as follows: i) the meal-stimulated rise in RER (∆RER Peak); ii) the subsequent fall in RER during the night (∆RER Nadir) relative to each individual’s baseline RER; iii) the difference between the higher and the lower RER (total ∆RER); iv) time to peak RER; v) time to nadir RER; vi) slope to RER nadir (the slope between the peak and nadir of RER); and vii) time for RER to reach FQ. The solid blue line represents a hypothetical mean RER over time trace, while the dashed blue lines represent hypothetical individual RER traces with different slope to RER nadir. Abbreviations: RER, respiratory exchange ratio; EE, resting energy expenditure; FQ, food quotient.
Prior to each test dinner meal, baseline energy expenditure (EE) and RER were determined during a 45-min period of supine rest. Except for two windows of free activity, 2200-2300 h and 0630-0700 h, participants were instructed to remain seated or in bed. Urine was collected throughout the stay for measurement of urinary nitrogen (Kjeldahl method). Standard equations were used to calculate EE (17), macronutrient oxidation (17), and FQ (18). Macronutrient oxidation was converted from g to kcal using the following: 4.44, 4.18, and 9.46 kcal/g for protein, CHO, and fat, respectively (12). Fat, CHO, and protein balances were calculated as the difference between the nutrient intake and the 12-h oxidation rates after the meal. RER:FQ ratio was defined as the average 12-h RER/FQ for each test meal. The following parameters of overnight RER dynamics were also quantified: ∆RER peak, ∆RER nadir, total ∆RER, slope to RER nadir, time to peak RER, time to nadir RER, and time to FQ. (Figure 1).
All analyses were performed using SAS version 9.4 (SAS Institute Inc., Cary, NC, USA) with a significance level set at α=0.05. All data are reported as means±SD. A linear mixed effect model was used to determine: RER:FQ ≠ 1, substrate balances ≠ 0, and differences between the least squares means in the low-fat and high-fat dinner conditions.
RESULTS
Eight healthy adults (4 male, 4 female) completed the study (Figure S2). At screening, the age, BMI, and fasting glucose concentration of the participants was 27.6±6.3 y, 25.5±3.3 kg/m2, and 88±4 mg/dL, respectively (Table S1). All energy metabolism parameters measured in the room calorimeter following each dinner meal are presented in Table 1. Baseline and mean 12-h energy expenditure (EE) were not different between the low-fat and high-fat dinner conditions (Table 1, Figure 2A). In contrast, the time course of RER diverged significantly following the two meals (Figure 2A). Following the low-fat meal, CHO oxidation rate was increased (p<0.01), 12-h fat balance was close to 0 (29±76 kcal/12-h, p=0.51), and 12-h RER:FQ ratio was close to 1.0 (0.986±0.019, p=0.06). Following the high-fat meal, 12-h RER:FQ ratio was greater than 1.0 (1.061±0.017, p<0.01), resulting in a positive 12-h fat balance of 376±142 kcal/12h (p<0.01) and a negative 12-h CHO balance of −132±43 kcal/12h (p<0.01) (Table 1, Figure 2C). Additional measures of overnight RER dynamics were different between the high-fat and low-fat conditions (Table 1, Figure S3), but were not significantly correlated with 12-h fat balance following the high-fat meal (Table S2).
Table 1.
Metabolic Parameters during Chamber Stays1
| Low-fat | High-fat | P-value | |
|---|---|---|---|
| 12-h Energy Metabolism2 | |||
| Energy Intake (kcal) | 1251 (227) | 1256 (228) | 0.04 |
| Mean Energy Expenditure (kcal) | 1076 (168) | 1054 (180) | 0.09 |
| Energy Balance (kcal) | 189 (101) | 212 (81) | 0.10 |
| Mean RER | 0.887 (0.017) | 0.832 (0.014) | <0.01 |
| Sleep RER | 0.867 (0.035) | 0.820 (0.016) | <0.01 |
| 12-h Macronutrient Oxidation and Balance2 | |||
| Fat Oxidation (kcal) | 221 (90) | 370 (106) | <0.01 |
| Fat Balance (kcal) | 29 (76) | 376 (142) | <0.01 |
| CHO Oxidation (kcal) | 576 (93) | 379 (59) | <0.01 |
| CHO Balance (kcal) | 163 (95) | −132 (43) | <0.01 |
| Protein Oxidation (kcal) | 266 (78) | 264 (120) | 0.56 |
| Protein Balance (kcal) | −2.7 (69) | −31 (106) | 0.55 |
| Overnight RER parameters | |||
| RER/FQ Ratio | 0.986 (0.019) | 1.061 (0.017) | <0.01 |
| Time to FQ (min) | 39.3 (10.8) | 295 (23.3)† | <0.01 |
| Slope to RER Nadir | −0.028 (0.016) | −0.042 (0.007) | 0.05 |
| ∆RER Peak | 0.103 (0.028) | 0.057 (0.030) | 0.02 |
| ∆RER Nadir | 0.025 (0.038) | 0.093 (0.031) | <0.01 |
| Total ∆RER | 0.129 (0.046) | 0.149 (0.023) | 0.25 |
| Time to Peak RER (min) | 100.3 (45.4) | 61.9 (13.3) | 0.07 |
| Time to Nadir RER (min) | 427 (113) | 274 (12.8) | <0.01 |
Data are expressed as mean (SD).
All data are over a 12-h period (1900 to 0700 h). Only sleep RER is defined as 0200-0500 h.
n=7, One participants’ RER did not reach FQ overnight following the high-fat meal.
Abbreviations: CHO, carbohydrate; FQ, food quotient; RER, respiratory exchange ratio.
Bolded p-values denote a statistically significant (p<0.05) mean difference between the low-fat and high-fat dinner based on our linear mixed effect model.
Figure 2.
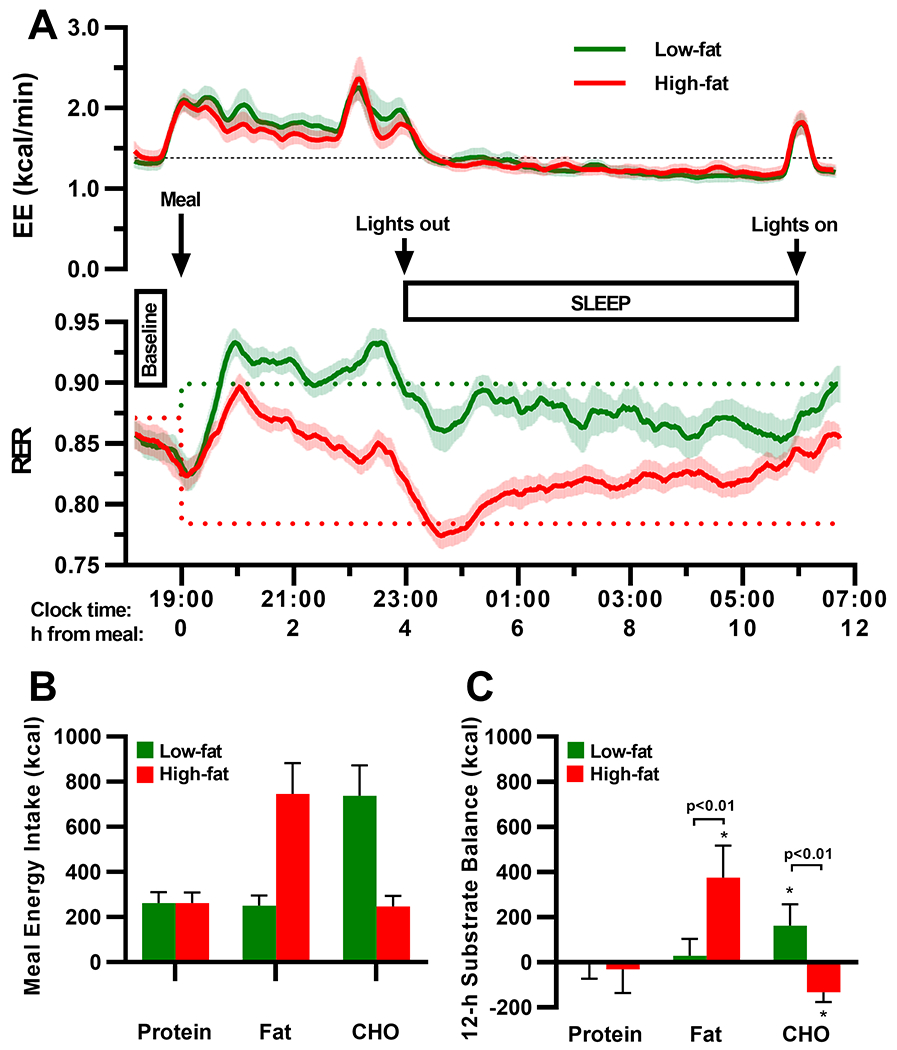
Changes in energy expenditure (EE), respiratory exchange ratio (RER), and substrate balance during an overnight stay in a whole-body room calorimeter following a low-fat or a high-fat isocaloric dinner meal. Although 12-h EE, baseline RER, and baseline EE were similar between the low-fat (green trace) and high-fat (red trace) conditions (A), RER diverged significantly following the two dinner meal conditions (A, lower panel). The alterations in RER were reflective of the low fat-to-carbohydrate (CHO) ratio in low-fat dinner, and the high fat-to-CHO ratio in the high-fat dinner (B). Yet, the increased fat oxidation rate was insufficient to prevent a 12-h positive fat balance following the high-fat dinner (panel C). Upper panels (A): Plotted values were based on 20-min moving averages as a smoothing method; solid lines represent the mean, and shade areas represent the standard deviation of the mean. Dotted lines indicate baseline EE (black) and food quotient (FQ) of the test meals (green, low-fat; red, high-fat). Bottom panels (B,C): Values are expressed as mean±SD. P-values were generated from comparing the differences between least squares means in the low-fat and high-fat conditions derived from a linear mixed effect model controlling for sequence and period effects; * indicates values that were significantly different from zero (p<0.05).
DISCUSSION
This study investigated whether metabolic flexibility could be measured during a 12-h overnight stay in a whole-room calorimeter. We propose that the variability in the kinetics of the ratio between carbohydrate and fat oxidation, as measured by RER, may represent a true physiological method to assess metabolic flexibility. To test our novel paradigm, we used a randomized crossover design to investigate the variability in the changes in RER in response to two isocaloric test meals, a high-fat (60%) and a low-fat (20%) dinner. Unlike carbohydrate, fat intake did not cause a rapid and strong increase in its own oxidation. The average response to the high-fat meal is consistent with overall metabolic inflexibility indicated by a RER:FQ>1 and a significant residual positive fat balance 12 hours after the ingestion of the meal. This was in sharp contrast with the low-fat meal paradigm in which fat oxidation matched fat intake, resulting in zero fat balance. However, with both meals, the variability in the 12-h response in RER is what defines metabolic flexibility. For example, a steeper decrease in RER (as opposed to a shallower slope to RER nadir) after the initial rise (Figure 1) is what could define metabolic flexibility. Similarly, those individuals whose RER reaches the meal FQ earlier are more flexible than those who reach it later. These data represent a proof-of-concept for a novel approach to assess metabolic flexibility as proposed by Galgani et al. (2), and suggests that metabolic flexibility can be measured with significantly less participant burden compared to other paradigms which utilize indirect calorimetry.
Although our results are consistent with previous studies demonstrating metabolic inflexibility to acute fat supplementation (15, 19), high-fat overfeeding (6), high-fat underfeeding (20), and adaptation to isocaloric high-fat diets (12, 13), our study is unique since it allowed the detection of such an effect with only one overnight chamber stay following a single isocaloric high-fat meal. Therefore, we now propose that assessing the variability in the RER kinetics after an isocaloric high-fat meal may be valuable for further quantifying individual variability in metabolic flexibility. This variability needs to be described by parameters such as RER/FQ ratio, time to reach FQ, ∆RER peak, ∆RER nadir, time to nadir, and slope to RER nadir. Although we observed a substantial difference in the above parameters in response to the two meal conditions, they were not all correlated with fat balance following the high-fat meal. Further studies using not only high-fat meals, but also meals with differing macronutrient content, will be required to determine the intra-subject variability of these additional measurements of metabolic flexibility and if they can predict the development of impaired metabolic health or identify a “thrifty” vs. a “spendthrift” metabolic phenotype.
Supplementary Material
What is already known about this subject?
Metabolic flexibility is the ability to adapt fuel oxidation to fuel availability and energy demand.
Lack of metabolic flexibility is associated with ectopic fat deposition and insulin resistance.
Metabolic flexibility is commonly measured during a hyperinsulinemic-euglycemic clamp, a non-physiological condition.
What are the new findings in your manuscript?
Our study provides a novel approach to measure metabolic flexibility by assessing the dynamics in respiratory exchange ratio (RER) in comparison to the food quotient (FQ) of high-fat versus low-fat standardized dinners in a whole-body room calorimeter.
How might your results change the direction of research or the focus of clinical practice?
Our proof-of-concept study provides an alternative approach to quantifying metabolic flexibility in response to a high-fat dinner.
Studies are now needed to assess the intra-subject variability of this novel physiological measure of metabolic flexibility and determine its impact on weight regulation and metabolic health.
ACKNOWNLEDGMENTS
We would like to thank the study participants, Brian Gilmore for technical support, and Guillermo Sanchez-Delgado for his input on the manuscript. The study dataset is available upon written request, and will be shared in accordance with appropriate data use agreements and IRB approvals. Requests should be directed to Eric Ravussin at eric.ravussin@pbrc.edu.
Funding:
This work was supported in part by a NORC Center Grant P30DK072476, and the Louisiana Clinical and Translational Science Center (LA CaTS; U54 GM104940). KLM was supported by the NIDDK sponsored Ruth L. Kirschstein National Research Service T32 Research Training Grant (T32-DK064584).
Footnotes
Clinical trials registration: NCT03839641
Disclosures: The authors declare no conflicts of interest.
REFERENCES
- 1.Kelley DE, Mandarino LJ. Fuel selection in human skeletal muscle in insulin resistance: a reexamination. Diabetes 2000;49: 677–683. [DOI] [PubMed] [Google Scholar]
- 2.Galgani JE, Moro C, Ravussin E. Metabolic flexibility and insulin resistance. American journal of physiology Endocrinology and metabolism 2008;295: E1009–1017. [DOI] [PMC free article] [PubMed] [Google Scholar]
- 3.Rachek LI. Chapter Eight - Free Fatty Acids and Skeletal Muscle Insulin Resistance In: Tao Y-X (ed). Progress in Molecular Biology and Translational Science. Academic Press, 2014, pp 267–292. [DOI] [PubMed] [Google Scholar]
- 4.Sangwung P, Petersen KF, Shulman GI, Knowles JW. Mitochondrial dysfunction, insulin resistance and potential genetic implications. Endocrinology 2020. [DOI] [PMC free article] [PubMed] [Google Scholar]
- 5.Ukropcova B, Sereda O, de Jonge L, Bogacka I, Nguyen T, Xie H, et al. Family History of Diabetes Links Impaired Substrate Switching and Reduced Mitochondrial Content in Skeletal Muscle. Diabetes 2007;56: 720–727. [DOI] [PubMed] [Google Scholar]
- 6.Begaye B, Vinales KL, Hollstein T, Ando T, Walter M, Bogardus C, et al. Impaired Metabolic Flexibility to High-Fat Overfeeding Predicts Future Weight Gain in Healthy Adults. Diabetes 2020;69: 181–192. [DOI] [PMC free article] [PubMed] [Google Scholar]
- 7.Galgani JE, Heilbronn LK, Azuma K, Kelley DE, Albu JB, Pi-Sunyer X, et al. Metabolic flexibility in response to glucose is not impaired in people with type 2 diabetes after controlling for glucose disposal rate. Diabetes 2008;57: 841–845. [DOI] [PMC free article] [PubMed] [Google Scholar]
- 8.van Herpen NA, Schrauwen-Hinderling VB, Schaart G, Mensink RP, Schrauwen P. Three Weeks on a High-Fat Diet Increases Intrahepatic Lipid Accumulation and Decreases Metabolic Flexibility in Healthy Overweight Men. The Journal of Clinical Endocrinology & Metabolism 2011;96: E691–E695. [DOI] [PubMed] [Google Scholar]
- 9.Whitley HA, Humphreys SM, Samra JS, Campbell IT, Maclaren DPM, Reilly T, et al. Metabolic responses to isoenergetic meals containing different proportions of carbohydrate and fat. British Journal of Nutrition 1997;78: 15–26. [DOI] [PubMed] [Google Scholar]
- 10.Bobbioni-Harsch E, Habicht F, Lehmann T, James RW, Rohner-Jeanrenaud F, Golay A. Energy expenditure and substrates oxidative patterns, after glucose, fat or mixed load in normal weight subjects. Eur J Clin Nutr 1997;51: 370–374. [DOI] [PubMed] [Google Scholar]
- 11.Rising R, Whyte K, Albu J, Pi-Sunyer X. Evaluation of a new whole room indirect calorimeter specific for measurement of resting metabolic rate. Nutr Metab (Lond) 2015;12: 46. [DOI] [PMC free article] [PubMed] [Google Scholar]
- 12.Smith SR, de Jonge L, Zachwieja JJ, Roy H, Nguyen T, Rood JC, et al. Fat and carbohydrate balances during adaptation to a high-fat diet. The American Journal of Clinical Nutrition 2000;71: 450–457. [DOI] [PubMed] [Google Scholar]
- 13.Schrauwen P, van Marken Lichtenbelt WD, Saris WH, Westerterp KR. Changes in fat oxidation in response to a high-fat diet. The American Journal of Clinical Nutrition 1997;66: 276–282. [DOI] [PubMed] [Google Scholar]
- 14.Abbott WG, Howard BV, Christin L, Freymond D, Lillioja S, Boyce VL, et al. Short-term energy balance: relationship with protein, carbohydrate, and fat balances. The American journal of physiology 1988;255: E332–337. [DOI] [PubMed] [Google Scholar]
- 15.Schutz Y, Flatt JP, Jequier E. Failure of dietary fat intake to promote fat oxidation: a factor favoring the development of obesity. The American Journal of Clinical Nutrition 1989;50: 307–314. [DOI] [PubMed] [Google Scholar]
- 16.Redman LM, Heilbronn LK, Martin CK, de Jonge L, Williamson DA, Delany JP, et al. Metabolic and behavioral compensations in response to caloric restriction: implications for the maintenance of weight loss. PLoS ONE 2009;4: e4377. [DOI] [PMC free article] [PubMed] [Google Scholar]
- 17.Jequier E, Acheson K, Schutz Y. Assessment of energy expenditure and fuel utilization in man. Annu Rev Nutr 1987;7: 187–208. [DOI] [PubMed] [Google Scholar]
- 18.de Jonge L, DeLany JP, Nguyen T, Howard J, Hadley EC, Redman LM, et al. Validation study of energy expenditure and intake during calorie restriction using doubly labeled water and changes in body composition. The American Journal of Clinical Nutrition 2007;85: 73–79. [DOI] [PMC free article] [PubMed] [Google Scholar]
- 19.Flatt JP, Ravussin E, Acheson KJ, Jequier E. Effects of dietary fat on postprandial substrate oxidation and on carbohydrate and fat balances. The Journal of Clinical Investigation 1985;76: 1019–1024. [DOI] [PMC free article] [PubMed] [Google Scholar]
- 20.Hall KD, Bemis T, Brychta R, Chen KY, Courville A, Crayner EJ, et al. Calorie for Calorie, Dietary Fat Restriction Results in More Body Fat Loss than Carbohydrate Restriction in People with Obesity. Cell Metabolism 2015;22: 427–436. [DOI] [PMC free article] [PubMed] [Google Scholar]
Associated Data
This section collects any data citations, data availability statements, or supplementary materials included in this article.