

Summary
The tyrosine kinase receptor ephrin receptor A2 (EPHA2) is overexpressed in lung (LSCC) and head and neck (HNSCC) squamous cell carcinomas. Although EPHA2 can inhibit tumorigenesis in a ligand-dependent fashion via phosphorylation of Y588 and Y772, it can promote tumorigenesis in a ligand-independent manner via phosphorylation of S897. Here, we show that EPHA2 and Roundabout Guidance Receptor 1 (ROBO1) interact to form a functional heterodimer. Furthermore, we show that the ROBO1 ligand Slit Guidance Ligand 2 (SLIT2) and ensartinib, an inhibitor of EPHA2, can attenuate growth of HNSCC cells and act synergistically in LSCC cells. Our results suggest that patients with LSCC and HNSCC may be stratified and treated based on their EPHA2 and ROBO1 expression patterns. Although ~73% of patients with LSCC could benefit from SLIT2+ensartinib treatment, ~41% of patients with HNSCC could be treated with either SLIT2 or ensartinib. Thus, EPHA2 and ROBO1 represent potential LSCC and HNSCC theranostics.
Subject Areas: Biological Sciences, Cell Biology, Molecular Biology, Cancer Systems Biology
Graphical Abstract
Highlights
-
•
EPHA2 heterodimerizes with ROBO1 in LSCC and HNSCC
-
•
SLIT2 inhibits non-canonical signaling and cellular proliferation in SCCs
-
•
SLIT2 is a potential therapeutic and EPHA2 and ROBO1 are potential theranostics
Biological Sciences; Cell Biology; Molecular Biology; Cancer Systems Biology
Introduction
With an estimated 2.09 million new cases that account for >13% of total cancer diagnoses, and 1.76 million deaths in 2018, lung cancer is the most common cancer and a leading cause of cancer-related deaths worldwide (Adjei, 2019). Non-small cell lung cancer (NSCLC) represents ~85% of all lung cancers with the majority of patients presenting with advanced stages of the disease when diagnosed. Squamous cell carcinoma of the lung (LSCC) is the second most common histology in NSCLC accounting for 20%–30% of all NSCLC cases and, more often than not, it presents with advanced stage disease at diagnosis (Herbst et al., 2018). Head and neck cancers represent the sixth most common cancer worldwide and accounts for approximately 650,000 new cases and more than 350,000 deaths every year. In the United States, head and neck cancer accounts for 3% of all cancers, with an estimated 53,000 Americans developing head and neck cancer annually and 10,800 dying from the disease. Approximately 90% of head and neck cancers are squamous cell carcinomas (HNSCCs) that arise from the mucosal surfaces of the oral cavity, oropharynx, and larynx. Tobacco use, alcohol consumption, Epstein-Barr virus infection, and HPV infection are some of the risk factors that are known to contribute to the development of almost 80% of the HNSCC cases diagnosed globally (Bray et al., 2018; Siegel et al., 2020). However, there are limited treatment options for advanced SCC, both in first-line and relapsed/refractory settings. In the last few years, several new drugs that include an anti-EGFR monoclonal antibody (necitumumab) in combination with standard chemotherapy and immune-checkpoint inhibitors such as nivolumab, pembrolizumab, or atezolizumab have been approved for treating SCC. Although the initial response to these drugs is encouraging, the patients eventually acquire resistance during the course of treatment, emphasizing the need for new drug targets and more efficacious drugs (Zappa and Mousa, 2016; Sabari and Paik, 2017).
The ephrin receptors (EPHR) and their ligands, the ephrins, play critical roles in a broad range of biological processes including neuronal pathfinding, angiogenesis, T cell activation, and stem cell maintenance (Darling and Lamb, 2019; Mosch et al., 2010). At the cellular level, the EPHR pathway regulates polarity, motility, proliferation, and survival in normal as well as neoplastic conditions (Singh et al., 2012; Lisabeth et al., 2013). In humans, ephrins and ephrin receptors constitute the largest receptor tyrosine kinase (RTK) family with a total of 14 members. Upregulation of EPH receptors, particularly EPHA2 and EPHB4, has been broadly implicated in the growth and metastasis of solid tumors, including NSCLC (Zelinski et al., 2001; Fang et al., 2005; Faoro et al., 2010; Ferguson et al., 2013; Pasquale, 2010; Salgia and Kulkarni, 2018; Tan et al., 2019). High levels of EPHA2 have been correlated with brain metastasis, disease relapse, and overall poor patient survival in lung cancers (Amato et al., 2014). In addition, EPHA2 is involved in acquired resistance to EGFR tyrosine kinase inhibitors (TKIs) and anti-EGFR antibodies (Zhuang et al., 2010; Koch et al., 2015; Amato et al., 2016), further highlighting the role of EPHA2 in tumor progression.
Ephrins are classified into either class A or B depending upon how they bind to the cell membrane. Class A ephrins (ephrin A1 to A5) are tethered to the cell membrane via a glycosyl-phosphatidylinositol (GPI) anchor, whereas class B ephrins (ephrin B1 to B3) are integral membrane proteins that contain a single transmembrane domain. EPH receptors are classified according to the class of ligand they bind to. There are eight class A receptors (EPHA1 to A8) and six class B receptors (EPHB1 to B6) (Pasquale, 2010). Both the ligands and the receptors are membrane bound and typically elicit signaling through cell-cell contact that leads to clustering of the ligand-receptor complexes. In addition, the binding of the ligand to the receptor triggers downstream events in the ligand-bearing cells, referred to as reverse signaling (Pasquale, 2010; Salgia and Kulkarni, 2018; Boyd et al., 2014). Among the EPHRs, EPHA2 has been shown to possess both ligand-dependent as well as ligand-independent activities (Miao et al., 2009; Taddei et al., 2009). Although ligand-mediated activation of EPHA2 was shown to inhibit cell motility, the ligand-independent activities enhance invasiveness and viability and are linked to tumor progression (Miao et al., 2009; Beauchamp and Debinski, 2012; Brantley-Sieders, 2012; Zhou and Sakurai, 2017). Importantly, S897 phosphorylation by AKT or RSK is a key mediator of the ligand-independent activities (Miao et al., 2009; Zhou et al., 2015) leading to tumorigenesis. In C. elegans, the ortholog of the human ephrin receptor, VAB-1, and its ligand, ephrin, EFN-1, function as cues in neuroblasts for proper neuronal pathfinding and in epidermal movements during embryogenesis. Mutants of the VAB-1 and ephrin exhibit variable degree of defects in embryonic arrest, larval arrest, and morphogenesis with a high percentage of animals showing the notch head phenotype (George et al., 1998; Chin-Sang et al., 1999). The ephrin/VAB-1 pathway interacts genetically with the conserved axon guidance receptor SAX-3/ROBO pathway in a dose-dependent fashion and showed synthetic embryonic lethal phenotype (Ghenea et al., 2005; Bernadskaya et al., 2012). SAX-3/ROBO null mutants display embryonic defects independent of VAB-1/EPHR mutants. Interestingly, double mutants of SLT-1, a ligand of SAX-3 (ROBO) and VAB-1, also show enhanced cell migration defects in comparison with VAB-1/EPHR or SLT-1 single mutants indicating cross talk between the two pathways. In addition, the tyrosine kinase domain of VAB-1 physically binds to the intracellular domain of SAX-3, specifically at the juxtamembrane region and the conserved cytoplasmic region 1 (CC1) (Ghenea et al., 2005).
Roundabout guidance receptors (ROBOs) and their ligands, SLITs (Slit Guidance Ligand 2), were first identified as important signaling molecules involved in the neuronal development in Drosophila (Rothberg et al., 1988; Kidd et al., 1999). Since then, this function in neuronal development has been found to be highly conserved in metazoans. In addition, new functions of the SLIT-ROBO pathway have been discovered in angiogenesis and in the development of the lung, mammary glands, and kidneys (Xian et al., 2001; Greishammer et al., 2004; Bedell et al., 2005; Strickland et al., 2006; Chen et al., 2010; Blockus and Chedotal, 2016; Ballard and Hinck, 2012). Recent studies have also implicated the SLIT-ROBO pathway in cancer progression and metastasis (Huang et al., 2015; Gara et al., 2015; Maiti et al., 2015). There are four ROBOs (ROBO 1–4) and three SLITs (SLIT 1–3) in mammals that can bind to different ROBO receptors with differing affinities. All ROBO receptors contain a single transmembrane domain with several weakly conserved cytoplasmic (CC) domains and no clear functionally defined domain in the cytoplasmic tail. Therefore, additional signaling molecules are probably involved in directing cellular activities (Hohenester, 2008; Gara et al., 2015; Maiti et al., 2015; Blockus and Chedotal, 2016). ROBO1 overexpression and mutations in lung cancer have been correlated with better patient outcome (Dallol et al., 2002; Maiti et al., 2015). Suppression of SLIT2 was associated with advanced pathological stage and a poor survival rate among patients with lung cancer (Gara et al., 2015).
Despite the correlation between expression levels of EPHA2, ROBO1, and SLIT2, and tumorigenesis and clinical outcome in patients with lung cancer, the translational potential of this clinical research has not been fully explored. Here, we have investigated the roles of EPHA2 and ROBO1 in SCCs of the lung and head and neck. Our results demonstrate that EPHA2 can physically interact by heterodimerizing with ROBO1 and this interaction is stabilized in the presence of SLIT2, which in turn attenuates cellular proliferation. Furthermore, the data also suggest that patients with LSCC and HNSCC may be stratified and treated based on their EPHA2 and ROBO1 expression patterns. Altogether our results indicate that SLIT2 is a potential therapeutic for LSCC and HNSCC and that EPHA2 and ROBO1 may represent potential theranostics in these two diseases.
Results
ROBO1 and EPHA2 Are Not Synthetic Lethal in LSCC and HNSCC Cells
In C. elegans, double mutants of sax-3 in the SLIT-ROBO and vab-1 the ephrin-EPH pathway showed synthetic lethal phenotype in embryonic stage suggesting that there is cross talk between the two pathways (Ghenea et al., 2005). This interaction presents an attractive window of opportunity for developing targeted therapy against the EPH-ROBO pathway, if the underlying mechanism is conserved in SCC. Therefore, we first determined whether a knockdown or pharmacological inhibition of the EPH receptor (vab-1) in C. elegans exhibits a synthetic lethal phenotype with ROBO mutant (sax-3). Consistent with the phenotype of genetic double mutants, knocking down vab-1 in sax-3 or knocking down sax-3 in vab-1 mutants exhibited the synthetic lethal phenotype (Figures S1A–S1C). Figure S1C displays the percentage of F1 viable progeny that survived out of the total F1 population. Moreover, treating sax-3 worms with ALW-II-41-27, a small molecule Eph family tyrosine kinase inhibitor, also enhanced lethality (Figure S1D), indicating that ALW-II-41-27 inhibited the ephrin receptor of C. elegans (Amato et al., 2014; Choi et al., 2009; Miao et al. 2015).
Next, to determine if EPHA2 is important for the survival of lung squamous cells, we knocked down EPHA2 using shRNA in three squamous cell carcinoma cell lines (H2170, SK-MES-1, and SW900) as well as in control, normal lung epithelial BEAS-2B cells and measured cell viability 96 h post transfection using the CCK8 cell survival assay. Although control BEAS-2B cells showed no growth inhibition, H2170 SK-MES-1 and SW900 cells showed 80%, 47%, and 83% inhibition, respectively (Figure 1A). Similarly, treatment of cells with ALW-II-27-41 resulted in stronger inhibition of NSCLC cells (IC50 range from 134 to 768 nM) relative to control BEAS-2B cells (IC50 = 1,533 nM) (Figure 1B). These results support the idea that EPHA2 is involved in positive signaling for LSCC cell proliferation.
Figure 1.

ROBO1 and EPHA2 Are Not Synthetic lethal in LSCC Cell Lines
shRNA-mediated knock down of EPHA2 and ROBO1 to study effect on cellular proliferation in lung cancer cell lines.
(A) Knockdown of EPHA2, ROBO1 and double knockdown via shRNA has variable effects on cellular proliferation among different cell lines in comparison with control cells BEAS-2B. We used four biological replicates and used two-way (ANOVA) to calculate the p values. shRNA knockdown for EPHA2, ROBO1 and double knockdown in H2170, SK-MES-1, and SW900 were significant p < 0.0001. But the double knockdown was not synthetic lethal in all cell lines. Data are represented as mean ± SD.
(B) Chemical ablation of EPHA2 using ALW-II-41-27 shows significant inhibition of proliferation in all lung cancer cell lines in comparison with control lung epithelial cells BEAS2B as indicated by values of IC50. The p values (p < 0.0001) are calculated using simple linear regression. Data are represented as mean ± SD.
(C) Immunoblot showing protein levels of EPHA2 and ROBO1 in single and double knockdowns compared with control. Related to Figure S1.
To further investigate the functional relationship between ROBO1 and EPHA2 in LSCC, we first determined whether ROBO1 knockdown also affects cell proliferation in various LSCC cell lines. Knocking down ROBO1 in H2170, SK-MES-1, and SW900 cells showed 69%, 30%, and 90% inhibition of proliferation, respectively (Figure 1A). We then asked if knocking down both EPHA2 and ROBO1 would show an enhancement of the inhibition shown in these cell lines. However, in all three cell lines, no additive effect was observed (Figure 1A and Table 1). To confirm the efficiency of shRNA knockdown, we determined the expression of EPHA2 and ROBO1 proteins by immunoblotting (Figure 1C). Next, a variety of head and neck cancer cell lines and cetuximab-resistant cell lines (HN30-C2, C4, and C5) expressing high EPHA2 were investigated (Figures 2A and 2D). Knockdown of either EPHA2 or ROBO1, or both (double knockdown), was performed using specific pooled siRNAs and the results were confirmed by immunoblotting (Figures 2B and 2E). When we performed the ROBO1 knockdown with siRNA in HNSCC cells and examined ROBO1 protein levels in the cell lysates by immunoblotting using Invitrogen antibody; we did not observe a decrease in the ROBO1 protein level. We repeated the immunoblot experiment with another antibody from Proteintech (Rosemont, IL, USA) that detects a smaller isoform and observed a complete knockdown of ROBO1. The Proteintech antibody was raised against a C-terminal fragment of human ROBO1 (residues1,631-1,647), whereas the Invitrogen antibody was raised against a fragment corresponding to a region within amino acids 75 and 344 of Human ROBO1, which may explain the observed differences. However, we did not observe a significant effect on cell proliferation with EPHA2 or ROBO1 knockdown, or double knockdown (except for Tu138 and HN-30P cell lines), as determined by CCK-8 assay (Figures 2C and 2F).
Table 1.
Percentage Inhibition of LSCC Cell Lines after shRNA Knockdown of EPHA2, ROBO1, and Double Knockdown
| %Age Inhibition | BEAS2B | H2170 | SK-MES-1 | SW900 |
|---|---|---|---|---|
| shEPHA2 | −52.42 | 80.72 | 47.26 | 83.70 |
| shROBO1 | −52.01 | 69.58 | 30.35 | 90.90 |
| shEPHA2+ROBO1 | −39.55 | 77.89 | 42.88 | 75.02 |
Figure 2.

ROBO1 and EPHA2 Are Not Synthetic Lethal in HNSCC Cell Lines
EPHA2, ROBO1 and double siRNA-mediated knockdown to study effect on cellular proliferation.
(A) Levels of total EPHA2, ROBO1, and pEPHA2 S897 in head and neck cancer cell lines.
(B) Levels of EPHA2, ROBO1, and double knockdown confirming knockdown using siRNA.
(C) CCK8 assay to determine cellular proliferation inhibition after knocking down EPHA2, ROBO1, or both.
(D) Levels of total EPHA2, ROBO1, and pS897 in cetuximab-resistant cells.
(E) Levels of EPHA2 and ROBO1 after knocking down EPHA2, ROBO1, or both via siRNA.
(F) Relative cell number after CCK8 assay to determine cellular proliferation inhibition in EPHA2, ROBO1, and double knockdown in cetuximab-resistant cells. Data are represented as mean ± SD. P values calculated were found significant in Tu138 and HN-30P cell lines. P values were calculated using one-way (ANOVA). Related to Figure S1.
These results support the idea that both EPHA2 and ROBO1 are involved in positive signaling for LSCC cell proliferation. The effect of shRNA knockdown of EPHA2 was less pronounced in SK-MES-1 cells. However, ALW-II-27-41 inhibited cell growth with an IC50 of 134 nm suggesting a role of other RTKs in these cells. Surprisingly, in spite of low levels of EPHA2 in H2170, shRNA knockdown of EPHA2 caused 80% inhibition of cell proliferation in these cells suggesting that EPHA2 is driving proliferation in these cells. We previously reported an activating EPHA2 mutation in its extracellular domain (G391A) in these cells that renders it constitutively active (Faoro et al., 2010). Thus, it is likely that low levels of the constitutively active receptor could have profound effects on cell growth via a ligand-independent mechanism. ALW-II-27-41 inhibited cell proliferation with lesser efficiency in H2170 compared with SW900 and SK-MES-1. In addition to EPHA2 and other RTKs that are sensitive to ALW-II-27-41, these cells may also have other pathways driving cell growth. SOX-2 is upregulated in LSCC cells H2170 but not in SK-MES-1 cells (Fukazawa et al., 2016). Therefore, it is possible that, in H2170 cells, SOX2 is driving tumorigenesis by suppressing CDKN1A (also called p21) that induces G1 cell-cycle arrest.
Since HNSCC cells are not dependent on EPHA2 and ROBO1 for cell growth because knocking down both proteins inhibited proliferation only 5%–10% except for Tu138 and HN-30P, it is possible that other RTK pathways may be involved. For example, we previously showed that AXL may be driving tumor growth in these cells (Brand et al., 2015).
Expression of EPHA2 and ROBO1 in LSCC and HNSCC Tissue Microarrays
Our previous studies with 105 NSCLC patient samples showed that EPHA2 was overexpressed in these patients (Faoro et al., 2010). Among the three types of lung cancer, LSCC specimens showed the highest expression levels of EPHA2 (n = 24). To further correlate this trend, we examined EPHA2 expression using two tissue microarrays (TMAs), one with 64 LSCC samples and another with 60 HNSCC samples (Figures 3A and 3B). We categorized the TMA core into four categories based on EPHA2 and ROBO1 expression levels. EPHA2high-ROBO1low; EPHA2high-ROBO1high; EPHA2low-ROBO1high; EPHA2low-ROBO1low. The pathological scoring was interpreted by considering a score of +0, +1 as low expressing and +2 and +3 as high expressing. In LSCC, 73% (EPHA2high-ROBO1low) of the samples showed significant expression of EPHA2, whereas very few, ~2% (EPHA2low-ROBO1high) showed high expression levels of only ROBO1 and the remaining 25% showed low expression of both EPHA2 and ROBO1 (EPHA2low-ROBOlow). A quantitative evaluation of the pathological scoring in LSCC TMA revealed that ROBO1 and EPHA2 exhibited an inverse relationship where most samples with high EPHA2 expression had low ROBO1 expression (Figures 3A and 3C). This correlates with the fact that higher ROBO1 levels are associated with better survival in patients with lung cancer since only a relatively small percentage of patients with lung cancer have good survival prognosis (Figures S2 and S3 and Table S1). On the other hand, in HNSCC, 12% samples show EPHA2high and ROBO1low expression, 29% showed EPHA2high and ROBO1high expression, and 17% showed EPHA2low and ROBO1high expression (Figures 3B and 3C). The remaining 42% were EPHA2high-ROBO1low. Based on the TMA results, we attempted to stratify patients with LSCC and HNSCC and observed a striking difference that may be helpful in determining the course of treatment of patients with squamous carcinoma LSCC and HNSCC (Figure 3C).
Figure 3.

Expression of EPHA2 and ROBO1 Receptors in LSCC and HNSCC TMAs
(A) Sixty-four TMA panels of LSCC patient samples, TMA-LC642a purchased from Biomax. Pseudo colors show anti-EPHA2 (red) and anti-ROBO1 (green). The pseudo color was created by FIJI software.
(B) Sixty TMA panels of HNSCC patient samples, TMA-HN801B purchased from Biomax. Pseudo colors show anti-EPHA2 (red) and anti-ROBO1 (green).
(C) Pie-chart representing the quantification of pathologist scoring of LSCC and HNSCC TMAs (see Table S1). The images were taken at 20× magnification. Related to Figures S2 and S3.
ROBO1 and SLIT2 Reside in the Same Complex and Physically Interact with EPHA2
To further probe the EPHA2/ROBO1interaction, we used fluorescent proteins to tag ROBO1 and EPHA2 and tracked their localization using confocal microscopy. ROBO1-mCherry and EPHA2-mGFP were localized to the cell surface as well as cytoplasmic vesicles (Figure 4A). The merged images showed that most of the EPHA2-mGFP and the ROBO1-mCherry co-localized at the cell membrane and in cytoplasmic vesicular structures. However, some discrete loci showed either EPHA2 or ROBO1 signal (Figure 4A). Z-section images revealed that both proteins localized in some discrete loci and in long extensions attached to surfaces (Figures 4A and Video S1). In addition, we also investigated the interaction between EPHA2 (Alexa Flour 547, red) and SLIT2 (Alexa Flour 488, green) in SW900 cells using confocal microscopy. We observed that EPHA2 and SLIT2 co-localized at the cell boundary and around nuclear membrane (Figure 4B).
Figure 4.

ROBO1/SLIT2 Are Present in the Same Complex and Physically Interact with EPHA2
EPHA2-ROBO1 and EPHA2-SLIT2 interaction in LSCC cells.
(A) EPHA2-GFP fusion (green) and ROBO1-m-cherry fusion (red) were co-expressed in cells for discerning interaction of EPHA2 and ROBO1 using confocal microscopy.
(B) Co-immunofluorescence of EPHA2 (Alexa Flour 547, red) and SLIT2 (Alexa Flour 488, green) in SW900 LSCC cells imaged with a confocal microscope. Yellow represents the area of co-expression of EPHA2 and SLIT2.
(C) FRET analysis. EPHA2-mClover3 was used as FRET donor and EPHA2-mRuby3, ROBO1-mRuby3 both were used as the FRET acceptors. EPHA2-mClover3 and EPHA2-mRuby3 were used as a positive control. FRET values are indicated. Images were taken at 40× magnification. Scale bar, 10 μm.
Cytoplasmic and nuclear membrane staining have been observed in other studies too, that have used this EPHA2 antibody (Stammes et al., 2017). It is likely that EPHA2 translocates to the nucleus and has a role in transcription that has not been explored yet. It is also interesting to note that several other RTKs have been shown to be translocated to the nucleus (Xie et al., 2019). Translocation of MET to the nucleus promotes hepatocellular carcinoma tumorigeneses and metastasis by upregulation of TAK1 and activation of NF-κB pathway (Tey et al., 2017). MET has also been shown to regulate nuclear calcium (Gomes et al., 2008) and YAP signaling to stimulate cell proliferation or induce SOX9 and β-catenin to enhance “cancer stem-like cells” self-renewal for cancer recurrence (Xie et al., 2014). Finally, complexes of the soluble forms of EPHA7 and EPHA10 were found to be localized in the cytoplasm as well as the nucleus in breast cancer cells (Johnson et al., 2016). These observations support the ability of EPHA2 to regulate gene expression, and its nuclear staining observed here suggests that it could putatively be involved in the regulation of transcription. Of note, EGFR has also been observed to translocate to the nucleus (Brand et al., 2011, 2013; Wang and Hung, 2009). A C-terminal fragment of ROBO1 has been reported to localize at the nucleus and promote tumorigenesis (Seki et al., 2010). SLIT2, on the other hand, has not been shown to localize to the nucleus but has been reported to inhibit transport of β-catenin to the nucleus (Chang et al., 2012).
To corroborate the interactions between EPHA2 and ROBO1, we used fluorescence resonance energy transfer (FRET) and confocal microscopy and determined the proximity of ROBO1 and EPHA2. For this purpose, we tagged ROBO1 with mClover3 (ROBO1-mClover3) as the FRET donor and EPHA2-mRuby3 (EPHA2-mRuby3) as the FRET acceptor. EPHA2-mClover3 and EPHA2-mRuby3 were used as a positive control; FRET was detected as expected with an N-FRET value of 0.347 ± 0.061. FRET was also detected between ROBO1-mClover3 and EPHA2-mRuby3 with N-FRET value of 0.234 +/0.065 (N = 23) (Figure 4C). Taken together, these data provided good evidence that EPHA2 and ROBO1 are in proximity (Foster radius of ~6 nm) to potentially make direct contact.
As additional evidence supporting interaction between EPHA2 and ROBO1, we performed co-immunoprecipitation (coIP) experiments. Plasmids constructs with FLAG-tagged ROBO-1 (ROBO1-FLAG) and HA tagged-EPHA2 (EPHA2- HA) were co-transfected into HEK293 cells, which express low endogenous levels of both EPHA2 and ROBO1. The LSCC cell lines were not used as the endogenous levels of ROBO1 in these cells are low to observe the interaction with EPHA2 using coIP. Indeed, in these experiments, EPHA2 protein was pulled down with ROBO1-FLAG tag IP (Figure 5A). To test if the kinase activity of EPHA2 is necessary for the interaction, we generated a kinase-dead (K645R) EPHA2-KD-HA construct (Taddei et al., 2009). Interestingly, a higher level of the kinase-dead mutant co-immunoprecipitated with ROBO1 than the wild-type EPHA2, even though the kinase-dead protein expressed at a lower level than the wild-type (Figure 5A) suggesting that the kinase activity of EPHA2 is not required for interaction between EPHA2 and ROBO1. Similarly, when we performed the corollary experiment and used HA tag IP for HA tagged-EPHA2, a higher level of WT ROBO1 was co-immunoprecipitated with the kinase dead EPHA2 than the wild-type EPHA2 (Figure 5B). Additionally, ROBO1 point mutations at Y932F, a ubiquitination site, and Y1073F, an ABL phosphorylation site, showed very low binding to WT-EPHA2 suggesting that these post-translational modifications may be important for interaction between EPHA2 and ROBO1. However, since the input protein of the ROBO1 phosphorylation mutants was low, additional experiments are needed to ascertain this conjecture. Notwithstanding this caveat, these observations suggest that ROBO1 and EPHA2 reside in the same complex and interact with each other, but the interaction does not require EPHA2 kinase activity.
Figure 5.

ROBO1/SLIT2 Interact with EPHA2 and Negatively Regulate Cell Proliferation
EPHA2 and ROBO1 reside in the same protein complex shown by biochemical assays. Co-immunoprecipitation assay for EPHA2 and ROBO1.
(A) Input and IP FLAG (ROBO1). EPHA2 wild-type and EPHA2 kinase dead EPHA2 (K645R KD) HA mutant is pulled down in complex with ROBO1. EV: Empty vector (mCherry FLAG); 1: ROBO1-FLAG; 2: ROBO1-FLAG + EPHA2-WT-HA; 3: ROBO1-FLAG + EPHA2-(K645R KD-HA).
(B) Input and Inverse IP HA of EPHA2 pulls down WT ROBO1 but the phosphorylation mutants of ROBO1 do not bind to EPHA2. EV: Empty vector (mCherry FLAG); 1: mCherry-FLAG + EPHA2-WT-HA; 2: ROBO1-FLAG + EPHA2-WT-HA; 3: ROBO1-FLAG Y932F + EPHA2-WT-HA; 4: ROBO1-FLAG Y1073F + EPHA2-WT-HA; 5: ROBO1-WT-FLAG + EPHA2- (K645R KD) HA.
(C) Proximity Ligation Assay. Interaction (protein-protein) of EPHA2-ROBO1 compared to EPHA2-SLIT2 in LSCC (SW900) cells represented by confocal images. The cell nucleus is stained with DAPI and the PLA is shown by red punctate staining. (E) Confocal microscopy images are quantified for red punctate staining representing the amount of PLA between the two proteins. (D) Proximity Ligation Assay. Interaction (protein-protein) of EPHA2-ROBO1 compared to EPHA2-SLIT2 in HNSCC (SCC1) cells represented by confocal images. The cell nucleus is stained with DAPI and the PLA is shown by red punctate staining. (F) Confocal microscopy images are quantified for red punctate staining representing the amount of PLA between the two proteins. Data are represented as mean ± SD. One-way (ANOVA) was performed to calculate p values. EPHA2-ROBO1 and EPHA2-SLIT2 interactions are significant in LSCC (p value < 0.001). The EPHA2-ROBO1 and EPHA2-SLIT2 both interactions are significant in HNSCC (p value < 0.0001). The images were taken at 40× magnification. Scale bar, 20 μm.
(G) ROBO1 was overexpressed in LSCC cell lines (SK-MES-1; H2170) and SLIT2 (2 μg/mL) was added to determine total EPHA2 and ROBO1 levels and pS897 levels. Densitometry of the bands of immunoblot in (G) normalized to band intensity of empty vector.
(H) SK-MES-1 and SW900 cells treated with ephrinA1 to discern canonical (pY588) and non-canonical signaling (pS897) hallmarks. EGF (0.5 μg/mL) was added to SK-MES-1 and H2170 cells to assay pS897 levels and pAKT (S473) and pEGFR (Y1068).
Finally, we ascertained that there is an interaction between EPHA2-ROBO1 and EPHA2 and SLIT2 ligand of ROBO1 by performing a proximity ligation assay (PLA) in both LSCC (SW900) and HNSCC (SCC1) cell lines. The results showed that EPHA2, ROBO1, and SLIT2 interact with each other in both the cell lines. However, HNSCC cells showed more robust interactions between EPHA2/ROBO1 and EPHA2/SLIT2 compared with LSCC cells (Figures 5C and 5D). The positive PLA signals were quantified using FIJI image software (Figures 5E and 5F). These results revealed that EPHA2 and ROBO1 can form a heterodimer and SLIT2 forms a complex with them. These interactions exert their effect on the tumor cells in both LSCC and HNSCC.
SLIT2/ROBO1 Interaction Negatively Regulates Cellular Proliferation and EPHA2 Tumorigenic Signaling
To assess the functional significance of the EPHA2/ROBO1 interaction, we examined the changes in EPHA2 signaling in LSCC cell lines in which ROBO1 was exogenously overexpressed. Upon binding to the ephrinA1, EPHA2 induces autophosphorylation of Y772 at the activation loop and Y588, Y594 at its juxtamembrane region, leading to the recruitment of downstream effectors (Fang et al., 2008; Pasquale, 2010; Boyd et al., 2014). Previous reports have also identified a ligand-independent activity of EPHA2 that is associated with phosphorylation at S897 by AKT and RSK (Miao et al., 2009; Zhou et al., 2015). Overexpression of ROBO1 in NSCLC cells resulted in down-regulation of pS897, the ligand-independent activity and tumorigenic marker of EPHA2. A more pronounced down-regulation of pS897 signal was observed when the cells (SK-MES-1 and H2170) were treated with SLIT2 (2 μg/mL for 72 h) (Figure 5G). When SK-MES-1 and SW900 cells were treated with ephrinA1 (2 μg/mL for 72 h), as expected, it enhanced ligand-dependent signaling via pY588 and suppressed tumorigenic signaling via pS897 (Figure 5H). Furthermore, addition of EGF (0.5 μg/mL for 72 h) to these cells not only activated EGF receptor and its downstream effectors like AKT but also enhanced the tumorigenic signature of pS897 (Figure 5H).
To assess the physiological changes in response to these ligands, we determined the effects of individual and combined treatments on cell proliferation and caspase activity. The cells were tagged with m-Kate2 (nuclear red fluorescence), and cell proliferation was monitored in real time using the IncuCyte Live Cell Analysis System (Sartorius, Bohemia, NY, USA). Caspase activity was monitored by using Caspase Green 3/7 substrate from IncuCyte, and the results indicated that SLIT2 and the EPHA2 inhibitors had a cytostatic effect in the majority of the instances (Table 3; Figures S4 and S5). The cells were treated with ephrin A1 at a concentration of 2 μg/mL but surprisingly, we did not see any inhibition of cell growth in both SW900 (LSCC) and SCC1 (HNSCC) cells (Figure S6E). In spite of seeing an increase in pY588 and a decrease in pS897 levels upon ephrin A1 treatment in LSCC cells, we do not observe any decrease in cell proliferation (Figures 5H and S6E). We previously demonstrated that the A859D mutation in EPHA2 causes the receptor to be activated in a ligand-independent fashion (Tan et al., 2019). Likewise, we also reported another mutation G391R in EPHA2 in LSCC that renders these cells insensitive to doxazosin an agonist of EPHA2 (Faoro et al., 2010) by affecting binding of the downstream effectors of EPHA2. Thus, it is likely that these cells do not respond to the ligand because they carry mutations in the EPHA2 receptor that makes them entirely independent of the ligand.
Table 3.
Caspase Activity Compared with 0 h Time Point for LSCC and HNSCC Cell Lines on Treatment with SLIT2, ALW-II-41-27, and Ensartinib along with p values
| SW900 Untreated | SW900 SLIT2 | SW900 SLIT2+EGF | SW900 ALW | SW900 SLIT2+ALW | SW900 Ensartinib | SW900 SLIT2+Ensartinib |
|---|---|---|---|---|---|---|
| 14.90 | 10.18 | 6.70 | 7.19 | 7.99 | 6.92 | |
| ns p < 0.9537 | ns p < 0.613 | ns p < 0.6454 | ns p < 0.8115 | ns p < 0.3755 | ns p < 0.0597 | |
| SK-MES-1 untreated | SK-MES-1 SLIT2 | SK-MES-1 SLIT2+EGF | SK-MES-1 ALW | SK-MES-1 SLIT2+ALW | SK-MES-1 ensartinib | SK-MES-1 SLIT2+ensartinib |
| 17.98 | 16.28 | 7.41 | 7.29 | 8.43 | 7.25 | |
| ns p < 0.9554 | ns p < 0.4162 | ns p < 0.8802 | ns p < 0.5383 | ns p < 0.9974 | ns p < 0.9473 | |
| H2170 untreated | H2170 SLIT2 | H2170 SLIT2+EGF | H2170 ALW | H2170 SLIT2+ALW | H2170 ensartinib | H2170 SLIT2+ensartinib |
| 11.25 | 16.36 | 1.95 | 1.67 | 12.30 | 11.92 | |
| ns p < 0.4685 | p < 0.0408 (∗) | p < 0.0475 (∗) | ns p < 0.1052 | ns p < 0.3357 | ns p < 0.6809 | |
| SCC1 untreated | SCC1 SLIT2 | SCC1 SLIT2+EGF | SCC1 ALW | SCC1 SLIT2+ALW | SCC1 ensartinib | SCC1 SLIT2+ensartinib |
| 1.14 | 1.35 | 1.49 | 2.47 | 1.74 | 3.07 | |
| ns p < 0.9496 | ns p < 0.931 | ns p < 0.9577 | ns p < 0.9974 | p < 0.0401 (∗) | p < 0.2386 | |
| SCC6 untreated | SCC6 SLIT2 | SCC6 SLIT2+EGF | SCC6 ALW | SCC6 SLIT2+ALW | SCC6 ensartinib | SCC6 SLIT2+ensartinib |
| 9.79 | 5.58 | 2.32 | 1.41 | 1.95 | 3.50 | |
| ns p < 0.1027 | ns p < 0.2364 | ns p < 0.7513 | ns p < 0.7506 | ns p < 0.9083 | ns p < 0.8686 | |
| SCC90 untreated | SCC90 SLIT2 | SCC90 SLIT2+EGF | SCC90 ALW | SCC90 SLIT2+ALW | SCC90 ensartinib | SCC90 SLIT2+ensartinib |
| 7.01 | 12.72 | 3.54 | 7.62 | 9.78 | 7.27 | |
| ns p < 0.9078 | ns p < 0.3096 | ns p < 0.9158 | p < 0.0019 (∗∗) | ns p < 0.4561 | ns p < 0.99999 |
In SW900 LSCC cells with EPHA2high and ROBO1low expression (majority patient cases based on TMA scoring ~73%), treatment with SLIT2 resulted in 34% inhibition of cellular proliferation. This inhibition was rescued by sequential treatment with EGF (EGF was added 24 h following SLIT2 treatment) (Figure 6A, panel 1). Consistent with this finding, we observed that EGF leads to activation of pS897 of EPHA2 via AKT (Figure 5H). Inhibition of cellular growth was also observed with the EPHA2 inhibitor ALW-II-41-27 (54%), and the combination treatment with SLIT2 showed 61% inhibition (Figure 6B, panel 2). We also observed this effect with another EPHA2 inhibitor ensartinib (Horn et al., 2018) where it showed 41% inhibition by itself and when combined with SLIT2, showed 65% inhibition (Figure 6A, panel 3, Tables 2 and 4) suggesting that combination treatment would be beneficial for LSCC patients with EPHA2high and ROBO1low levels. To confirm this observation, we also tested another EPHA2high and ROBO1low cell line, SK-MES-1. We observed a significant inhibition with SLIT2 treatment and synergy in SK-MES-1 cells when combined with EPHA2 inhibitors (Figures 6B and Table 2). To discern how different cells behave based on EPHA2 and ROBO1 expression (see TMA stratification in Figure 3C), we examined another LSCC cell line H2170, with ROBO1high and EPHA2low expression. We did not see inhibition with SLIT2 but observed 30% and 22% inhibition with EPHA2 inhibitors ALW-II-47-21 and ensartinib, respectively (Figures 6C and Table 2).
Figure 6.

SLIT2/ROBO1 Interaction Negatively Regulates Cellular Proliferation in LSCC
(A) SW900 LSCC cell proliferation plot after treatment with SLIT2 (2 μg/mL), SLIT2 (2 μg/mL) + EGF (0.5 μg/mL), panel 1: ALW-II-41-27 (2 μM) and SLIT2 (2 μg/mL) + ALW-II-41-27 (2 μM), and panel 2: ensartinib (3.461 μM), SLIT2 + ensartinib panel 3.
SW900 LSCC cell proliferation plot after treatment with SLIT2 (2μg/ml), SLIT2 (2μg/ml) + EGF (0.5μg/ml), panel 1: ALW-II-41-27 (2μM) and SLIT2 (2μg/ml) + ALW-II-41-27 (2μM), and panel 2: ensartinib (3.461μM), SLIT2 + ensartinib panel 3. (B, C) SK-MES-1 and H2170 treated as in (A) with SLIT2 (2μg/ml), SLIT2 (2μg/ml) + EGF (0.5μg/ml), panel 1: ALW-II-41-27 (2μM) and SLIT2 (2μg/ml) + ALW-II-41-27 (2μM), and panel 2: ensartinib (3.461μM), SLIT2 + ensartinib panel 3. Data are represented as mean ± SD from six to eight biological replicates. One-way (ANOVA) was performed to calculate p values. Related to Figures S4 and S5.
Table 2.
Percentage Inhibition of LSCC and HNSCC Cell Lines on Treatment with SLIT2, ALW-II-41-27, and Ensartinib along with p Values
| LSCC | SW900 Untreated | SW900 SLIT2 | SW900 SLIT2+EGF | SW900 ALW | SW900 SLIT2+ALW | SW900 Ensartinib | SW900 SLIT2+Ensartinib |
|---|---|---|---|---|---|---|---|
| % Inhibition of cellular proliferation | Control | 34.56 | No Inhibition | 54.08 | 61.53 | 41.54 | 65.00 |
| One-way (ANOVA) p values | p < 0.002 (∗∗) | ns p < 0.1478 | p < 0.0008 (∗∗∗) | p < 0.0015 (∗∗) | p < 0.0041 (∗∗) | p < 0.0015 (∗∗) | |
| SK-MES-1 Untreated | SK-MES-1 SLIT2 | SK-MES-1 SLIT2+EGF | SK-MES-1 ALW | SK-MES-1 SLIT2+ALW | SK-MES-1 ensartinib | SK-MES-1 SLIT2+ensartinib | |
| % Inhibition of cellular proliferation | Control | 51.89 | No Inhibition | 53.13 | 85.52 | 51.63 | 86.12 |
| One-way (ANOVA) p values | p < 0.0042 (∗∗) | ns p < 0.8676 | p < 0.0005 (∗∗∗) | p < 0.0001 (∗∗∗) | p < 0.0078 (∗∗) | p < 0.0001 (∗∗∗) | |
| H2170 Untreated | H2170 SLIT2 | H2170 SLIT2+EGF | H2170 ALW | H2170 SLIT2+ALW | H2170 ensartinib | H2170 SLIT2+ensartinib | |
| % Inhibition of cellular proliferation | Control | No Inhibition | No Inhibition | 29.67 | 35.05 | 22.33 | 29.94 |
| One-way (ANOVA) p values | ns p < 0.9997 | ns p < 0.9844 | p < 0.0001 (∗∗∗) | p < 0.0001 (∗∗∗) | p < 0.0004 (∗∗∗) | p < 0.0001 (∗∗∗) | |
| LSCC | SCC1 Untreated | SCC1 SLIT2 | SCC1 SLIT2+EGF | SCC1 ALW | SCC1 SLIT2+ALW | SCC1 ensartinib | SCC1 SLIT2+ensartinib |
| % Inhibition of cellular proliferation | Control | 23.34 | No Inhibition | 20.66 | 21.63 | 25.59 | 24.75 |
| One-way (ANOVA) p values | p < 0.0113 (∗) | ns p < 0.4382 | ns p < 0.1333 | p < 0.0044 (∗∗) | p < 0.0001 (∗∗∗) | p < 0.0001 (∗∗∗) | |
| SCC6 Untreated | SCC6 SLIT2 | SCC6 SLIT2+EGF | SCC6 ALW | SCC6 SLIT2+ALW | SCC6 ensartinib | SCC6 SLIT2+ensartinib | |
| % Inhibition of cellular proliferation | Control | 34.87 | No Inhibition | 46.08 | 44.12 | 42.45 | 29.49 |
| One-way (ANOVA) p values | p < 0.0001 (∗∗∗) | ns p < 0.2233 | ns p < 0.2713 | p < 0.0052 (∗∗) | ns p < 0.0652 | p < 0.0001 (∗∗∗) | |
| SCC90 Untreated | SCC90 SLIT2 | SCC90 SLIT2+EGF | SCC90 ALW | SCC90 SLIT2+ALW | SCC90 ensartinib | SCC90 SLIT2+ensartinib | |
| % Inhibition of cellular proliferation | Control | No Inhibition | No Inhibition | No Inhibition | No Inhibition | 31.76 | 37.06 |
| One-way (ANOVA) p values | ns p < 0.7553 | p < 0.0065 (∗∗) | ns p < 0.5618 | ns p < 0.995 | p < 0.0001 (∗∗∗) | p < 0.0001 (∗∗∗) |
Table 4.
Ligand and EPHA2 Inhibitors Treatment
| Inhibitor or Ligand | Concentration | Cell Line |
|---|---|---|
| SLIT2 | 2 μg/mL | LSCC; HNSCC |
| EphrinA1 | 2 μg/mL | LSCC; HNSCC |
| EGF | 0.5 μg/mL | LSCC; HNSCC |
| ALW-II-41-27 | 2 μM | LSCC; HNSCC |
| Ensartinib | 3.461 μM | LSCC |
| Ensartinib | 1.794 μM | HNSCC |
| LSCC | Combination Treatments Used | HNSCC | Combination Treatments Used |
|---|---|---|---|
| SW900 | SLIT2; SLIT2+EGF; ALW; SLIT2+ALW; ensartinib; SLIT2+ensartinib |
SCC1 | SLIT2; SLIT2+EGF; ALW; SLIT2+ALW; ensartinib; SLIT2+ensartinib |
| SK-MES-1 | SLIT2; SLIT2+EGF; ALW; SLIT2+ALW; ensartinib; SLIT2+ensartinib |
SCC6 | SLIT2; SLIT2+EGF; ALW; SLIT2+ALW; ensartinib; SLIT2+ensartinib |
| H2170 | SLIT2; SLIT2+EGF; ALW; SLIT2+ALW; ensartinib; SLIT2+ensartinib |
SCC90 | SLIT2; SLIT2+EGF; ALW; SLIT2+ALW; ensartinib; SLIT2+ensartinib |
A similar inhibition of proliferation was observed in HNSCC (SCC1) cells with EPHA2high and ROBO1low expression. Addition of SLIT2 resulted in 23% inhibition of cell proliferation that was rescued by the addition of EGF ligand (Figure 7A, panel 1). However, treating SCC1 cells with ALW-II-41-27 alone or in combination with SLIT2 showed ~20% proliferation inhibition. In the case of ensartinib treatment, either single or combination treatment resulted in ~35% inhibition indicating that the combination treatment did not have a synergistic effect (Figure 7A, panel 3, Tables 2 and 4). We also tested another HNSCC cell line SCC6 that has EPHA2high and ROBO1low expression. This cell line also responded to SLIT2 and ALW-II-41-27 treatments, but the effect was not synergistic (Figures 7B and Table 2). When we tested ensartinib on this cell line we did see a slight increase in inhibition with combination treatment in comparison to what we saw with SCC1 cell line. For assaying EPHA2low and ROBO1high expressing HNSCC cells, we tested SCC90. Again, like in LSCC, SLIT2 treatment had no discernable effect but ensartinib treatment showed 31% inhibition (Figure 7C and Table 2). SCC104, an EPHA2high and ROBO1high cell line, showed 46% inhibition of cell proliferation when treated with SLIT2 that was rescued by the addition of EGF ligand (Figure S6F).
Figure 7.

SLIT2/ROBO1 Interaction Negatively Regulates Cellular Proliferation in HNSCC
(A) SCC1 HNSCC cell proliferation plot after treatment with SLIT2 (2 μg/mL), SLIT2 (2 μg/mL) + EGF (0.5 μg/mL), panel 1: ALW-II-41-27 (2 μM) and SLIT2 (2 μg/mL) + ALW-II-41-27 (2 μM) panel 2, and ensartinib (1.7 μM), SLIT2 + ensartinib panel 3.
SCC1 HNSCC cell proliferation plot after treatment with SLIT2 (2μg/ml), SLIT2 (2μg/ml) + EGF (0.5μg/ml), panel 1: ALW-II-41-27 (2μM) and SLIT2 (2μg/ml) + ALW-II-41-27 (2μM) panel 2, and ensartinib (1.7μM), SLIT2 + ensartinib panel 3. (B, C) SCC6 and SCC90 treated as in (A) with SLIT2 (2μg/ml), SLIT2 (2μg/ml) + EGF (0.5μg/ml), panel 1: ALW-II-41-27 (2μM) and SLIT2 (2μg/ml) + ALW-II-41-27 (2μM) panel 2, and ensartinib (1.7μM), SLIT2 + ensartinib panel 3. (The details of the individual and combination treatments are presented in Table 4. Data are represented as mean ± SD from six to eight biological replicates. p values were calculated using one-way (ANOVA). The p values are represented in Tables 2 and 3. Related to Figures S4 and S5.
To discern the synergistic, additive, or antagonistic effects of combinations of SLIT2 and the EPHA2 inhibitors we performed a dose-response matrix experiment and calculated the combination index (CI) values by treating SW900 (LSCC) and SCC1 (HNSCC) cell lines with SLIT/ALW-II-41-27 and SLIT2/ensartinib treatments as described in the Transparent Methods in the Supplemental Information file. Consistent with the proliferation curves, we found that both EPHA2 inhibitors when combined with SLIT2 in LSCC showed a combination index of lower than 1 indicative of synergy (Figures S6A and S6B). In the case of HNSCC cells, for both combinations the CI values were >1 indicating antagonism (Figures S6C and S6D). These results showed that SLIT2 can inhibit proliferation in cells that are EPHA2high/ROBO1low, but not in EPHA2low/ROBO1high suggesting that SLIT2 can signal via EPHA2/ROBO1 heterodimer or an EPHA2 homodimer.
It is also possible that low levels of the residual EPHA2-ROBO1 heterodimers that exist in EPHA2high/ROBO1low cells may form the critical threshold necessary for eliciting signaling to inhibit proliferation in ROBO1low cells. As shown in the PLA experiment (Figure 5), SLIT2 can bind to EPHA2 and liganded EPHA2 may form functional homodimers to elicit signaling to inhibit cell proliferation. EPHA2 can dimerize even in the absence of ephrinA1 and stabilization of this dimer decreases the tumorigenic pS897 phosphorylation. Furthermore, a small peptide YSA, which can bind to EPHA2 and function as an agonist of the receptor, has also been reported (Singh et al., 2015, 2018; Deo et al., 2016). Another possibility is that EPHA2 may bind to another ROBO receptor or yet another receptor and inhibit proliferation. Concordant with this speculation, while this manuscript was being reviewed Volz et al. (2020) published their study where in NSCLC EPHA2 forms heterodimers with VEGF and inhibits metastasis. However, in the cell lines with EPHA2low and ROBO1high SLIT2 did not inhibit cell proliferation. It is a possibility that in the EPHA2low cells such as H2170, a functional heterodimer may not form or, alternatively, it may not have the critical levels required for SLIT2 signaling. As discussed for the ROBO1low cells, if SLIT2 is signaling via EPHA2 homodimers, these cells may not have the required levels of EPHA2 to form functional homodimers for SLIT2 signaling. EPHA2 inhibitors ALW-II-41-27 and ensartinib, on the other hand, inhibited cell proliferation by 29% and 22%, respectively, in H2170, suggesting that a small amount of EPHA2 and other RTKs that these inhibitors target could be driving cancer cell growth in these cells.
The differences in the combined effect of the treatments could be attributed to the differences in the additional pathways that are driving tumorigenesis in these cell lines or due to off target effects of one or both the drugs in the combination. Alternatively, it could be due to activation of an oncogenic kinase by disruption of a feedback loop by one of the molecules that can have an antagonistic effect on the other pathway. SLIT2 may inhibit cell proliferation by inhibiting AKT that phosphorylates S897-EPHA2, and hence, it is likely that ensartinib and ALW-II-27-41 in HNSCC can activate another kinase such as Src or PKA or inhibit a phosphatase that can increase phosphorylation of S897-EPHA2 antagonizing the effect of SLIT2. This could explain why the combination of the EPHA2 inhibitors and SLIT2 is synergistic in LSCC and antagonistic in the HNSCC. Taken together these results suggest that EPHA2 has an oncogenic role in the LSCC in the absence of its natural ligands ephrinA1 and ROBO1 has a tumor suppressor role in the presence of SLIT2 in both HNSCC and LSCC. Loss of SLIT2 leads to tumorigenesis in these cancers. In the presence of exogenously added SLIT2, EPHA2 and ROBO1 can form a complex and inhibit cell proliferation suggesting that there is cross-functional signaling between the two pathways to exert a tumor suppressor function.
Clinical Significance of ROBO1 and EPHA2 Expression and Mutations
To investigate the potential roles of EPHA2 and ROBO1 in LSCC and HNSCC, we performed overall survival analysis using GEPIA (Gene expression profiling interactive analysis) based on data from The Cancer Genome Atlas (TCGA). Percent survival of EPHA2low versus EPHA2high normalized to ROBO1 in LSCC showed that patients with EPHA2low had better survival (60 EPHA2low versus 50 EPHA2high months), whereas the patients with ROBO1high lived longer (65 ROBO1high versus 50 ROBO1low months). The log rank p value (0.082) and hazard ratio (1.3) were calculated for survival plots with EPHA2high and EPHA2low expressing patients normalized to ROBO1 expression. Additionally log rank p value (0.082) and hazard ratio (0.79) was calculated for ROBO1high and ROBO1low expressing patients normalized to EPHA2 expression (Figures S2A and S2C). In HNSCC, the survival pattern was the same, that is, EPHA2low and ROBO1high had better survival (75 months) in comparison with EPHA2high and ROBO1low (65 months). For HNSCC, the log rank p value (0.062) and hazard ratio (1.3) were calculated for survival plots with EPHA2high and EPHA2low expressing patients normalized to ROBO1 expression. Additionally log rank p value (0.062) and hazard ratio (0.78) was calculated for ROBO1high and ROBO1low expressing patients normalized to EPHA2 expression (Figures S2B and S2D). We also assayed mutations in EPHA2 and ROBO1 and their association with survival. For LSCC, EPHA2 mutations had only 19 cases with 3 deceased; therefore, the median survival could not be calculated for these. ROBO1 mutation in LSCC did not have a significant effect for survival (Figures S3A and S3C). Patients with HNSCC with alteration in EPHA2 had significantly lower survival. Again, ROBO1 alteration did not have a significant effect of survival in HNSCC (Figures S3B and S3D).
Discussion
RTKs play critical roles in several biological processes and have complex signaling mechanisms. Upon binding to their ligands, they often oligomerize and cross-phosphorylate each other, especially on tyrosine residues at the critical juxtamembrane domain and at the activation loop (Singh et al., 2015, 2018; Deo et al., 2016) to transduce various cellular signals. In the case of the EPH receptors, many of which are upregulated in numerous cancers, ligand activation leads to inhibition of tumor growth, migration, and invasiveness (Singh et al., 2018). In our study when SCC cells were treated with ephrinA1, the natural ligand of EPHA2 (non-tumorigenic signaling), in vitro, we did not see an inhibition in cellular proliferation of LSCC and HNSCC cells underscoring the need to study the presence of other degenerate, unexplored pathways regulating EPHA2 signaling (Figure S6E). Cancers overexpressing EPHA2 are accompanied by a concomitant loss of its ligands, implying that EPHA2 may act as an oncogene in the absence of its ligand. Consistent with these observations, several studies have demonstrated that EPHA2 promotes cell migration and tumor malignancy in a ligand-independent manner. This signaling is characterized by high levels of S897 phosphorylation and low levels of Y772 and Y588 phosphorylation of EPHA2 (Miao et al., 2009; Beauchamp and Debinski, 2012; Brantley-Sieders, 2012; Zhou and Sakurai, 2017). In addition to ligand-independent activation, RTK heterodimerization and examples of alternative ligands binding to atypical receptors are well documented and is recognized as a means to amplify signal or induce functional diversity (Maruyama, 2014; Lemmon and Schlessinger, 2010). For example, erythropoietin, which is known to stimulate tumor growth by binding to EPHB4 despite EPHB4 not being its natural receptor (Pradeep et al., 2015).
A physical interaction between the tyrosine kinase domain-1 of VAB-1/EPHR and the CC1 region of SAX-3/ROBO has been observed in C. elegans (Ghenea et al., 2005). However, to the best of our knowledge, a functional heterodimer between EPHA2 and ROBO1 that can respond to SLIT2 signaling and attenuate cell proliferation in the human has not been reported thus far. We also believe that binding of SLIT2 to EPHA2, observed in the present study, has not been reported previously. Studies by Dunaway et al. (2011) have shown that cooperation between SLIT2 and ephrinA1 regulates a balance between the pro- and antiangiogenic functions of SLIT2 in mouse endothelial cells. However, no direct binding of SLIT2 to the EPHA2 receptor was shown.
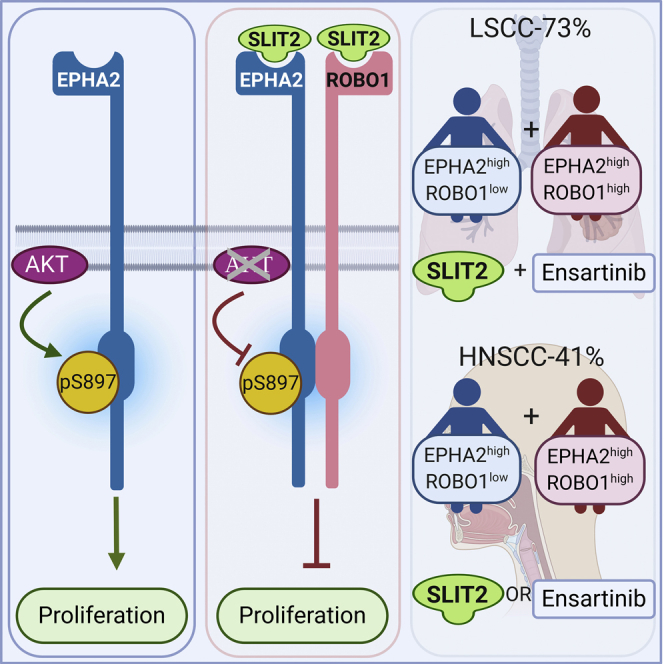
To summarize our findings, we propose a model (Figure 8A) wherein ROBO1 along with SLIT2 exerts its tumor-suppressive function by heterodimerizing with EPHA2 and blocking EGF-induced phosphorylation of EPHA2 at S897 possibly by inhibiting AKT activity. In the LSCC cell line SW900 and HNSCC cell line SCC1 that expresses low levels of ROBO1, addition of SLIT2 inhibited cell proliferation (Figures 6A and 7A), suggesting that, in addition to binding to the EPHA2 and ROBO1 heterodimer (Figures 5C and 5D), SLIT2 may also bind to EPHA2 homodimers to exert its tumor suppressor effects. Alternatively, EPHA2 may heterodimerize with another ROBO receptor in ROBO1low cells to inhibit cell proliferation. EPHA2 over-expression in SCCs is significantly correlated with tumor site, T classification, clinical stage, recurrence, and lymph node metastasis (Liu et al., 2012). These data highlight the translational potential of SLIT2 as a therapeutic in combination with or without EPHA2 inhibitors to treat patients with LSCC and HNSCC who currently have limited options especially those who have acquired resistance to EGFR inhibitors or have progressed on platinum-based therapy. Thus, these patients could be stratified based on the expression patterns of EPHA2 and ROBO1 proteins in the diseased tissue (Figure 8B). The vast majority of patients with LSCC (~73%) with EPHA2high and ROBO1low expression can be treated with a combination of SLIT2 and ensartinib, whereas those patients with EPHA2high and ROBO1low expression (~12%) and EPHA2high and ROBO1high (~29%) in HNSCC can be treated with either SLIT2 or ensartinib. Since EPHA2 and ROBO1 serve as biomarkers for discerning patients for appropriate therapy as well as therapeutic targets, they represent potential theranostics for the two diseases.
Figure 8.

Mechanistic Model for SLIT2 and EPHA2-ROBO1 Signalling and Therapeutic Strategy for Patient Treatment
(A) EPHA2, ROBO1, and SLIT form a complex. EPHA2-ROBO1 signaling model. Model of EPHA2-ROBO1 heterodimerization being stabilized in presence of SLIT2 and in turn promoting non-tumorigenic signaling highlighting therapeutic promise.
(B) Patient stratification. Treatment strategy for patients with high EPHA2 and low ROBO1 in LSCC and HNSCC.
Limitations of the Study
Despite demonstrating multiple lines of evidence that EPHA2 and ROBO1 reside in the same complex and can physically interact to elicit signaling events by binding to SLIT2, more conclusive evidence using biophysical techniques such as multidimensional NMR and or X-ray crystallography is lacking. Second, the patient stratification presented here is based on EPHA2 and ROBO1 expression in TMAs. Determining the efficacy of the treatments individually and in combination in patient-derived LSCC and HNSCC cells will further validate these stratification strategies.
Resource Availability
Lead Contact
Further information and requests for resources and reagents should be directed to and will be fulfilled by the Lead Contact, Dr. Ravi Salgia (rsalgia@coh.org).
Materials Availability
This study did not generate new unique reagents.
Data and Code Availability
This study did not generate/analyze datasets/code.
Methods
All methods can be found in the accompanying Transparent Methods supplemental file.
Acknowledgments
C. elegans strains were provided by the CGC, which is funded by National Institute of Health, United States Office of Research Infrastructure Programs (P40 OD010440). Research reported in this publication included work performed in the Integrative Genomics Core, Light Microscopy Core, and Pathology Core supported by the National Cancer Institute of the National Institutes of Health, United States under grant number P30CA033572. The content is solely the responsibility of the authors and does not necessarily represent the official views of the National Institutes of Health. Research reported in this publication was supported, in part, by the Wisconsin Head & Neck Cancer SPORE (D.L.W., P50 DE026787). The content is solely the responsibility of the authors and does not necessarily represent the official views of the National Institutes of Health. We would like to thank Sourabh Kotnala for generating an R file for calculating combination index for different drug combinations. The R file was based on the algorithm from SynergyFinder.
Author Contributions
S.S.: conceptualized, performed experiments, analyzed data, wrote and reviewed the paper; K.M.P.: conceptualized, performed experiments, analyzed data, wrote and reviewed the paper; M.I.: conceptualized, performed experiments, analyzed data, wrote and reviewed the paper; M.N.: analyzed data, wrote and reviewed the paper; J.L.: analyzed data; A.N.: performed experiments, reviewed the paper; J.W.: performed experiments; I.M.: provided patient samples; R.P.: performed pathological scoring of the TMAs; A.M.: performed experiments and reviewed the paper; N.M: performed experiments, analyzed data; A.B.: conceptualized, wrote and reviewed the paper; P.K.: conceptualized, reviewed and wrote the paper; D.L.W.: conceptualized the idea, reviewed the paper; R,S.: conceptualized the idea, reviewed the paper.
Declaration of Interests
The authors declare no competing interests.
Published: November 20, 2020
Footnotes
Supplemental Information can be found online at https://doi.org/10.1016/j.isci.2020.101692.
Contributor Information
Deric L. Wheeler, Email: dlwheeler@wisc.edu.
Ravi Salgia, Email: rsalgia@coh.org.
Supplemental Information
References
- Adjei A.A. Lung cancer worldwide. J. Thorac. Oncol. 2019;14:956. doi: 10.1016/j.jtho.2019.04.001. [DOI] [PubMed] [Google Scholar]
- Amato K.R., Wang S., Tan L., Hastings A.K., Song W., Lovly C.M., Meador C.B., Ye F., Lu P., Balko J.M. EPHA2 blockade overcomes acquired resistance to EGFR kinase inhibitors in lung cancer. Cancer Res. 2016;76:305–318. doi: 10.1158/0008-5472.CAN-15-0717. [DOI] [PMC free article] [PubMed] [Google Scholar]
- Amato K.R., Wang S., Hastings A.K., Youngblood V.M., Santapuram P.R., Chen H., Cates J.M., Colvin D.C., Ye F., Brantley-Sieders D.M. Genetic and pharmacologic inhibition of EPHA2 promotes apoptosis in NSCLC. J. Clin. Invest. 2014;124:2037–2049. doi: 10.1172/JCI72522. [DOI] [PMC free article] [PubMed] [Google Scholar]
- Ballard M.S., Hinck L. A roundabout way to cancer. Adv. Cancer Res. 2012;114:187–235. doi: 10.1016/B978-0-12-386503-8.00005-3. [DOI] [PMC free article] [PubMed] [Google Scholar]
- Beauchamp A., Debinski W. EPHs and ephrins in cancer: ephrin-A1 signalling. Semin. Cell Dev. Biol. 2012;23:109–115. doi: 10.1016/j.semcdb.2011.10.019. [DOI] [PMC free article] [PubMed] [Google Scholar]
- Bedell V.M., Yeo S.Y., Park K.W., Chung J., Seth P., Shivalingappa V., Zhao J., Obara T., Sukhatme V.P., Drummond I.A. Roundabout4 is essential for angiogenesis in vivo. Proc. Natl. Acad. Sci. U S A. 2005;102:6373–6378. doi: 10.1073/pnas.0408318102. [DOI] [PMC free article] [PubMed] [Google Scholar]
- Bernadskaya Y.Y., Wallace A., Nguyen J., Mohler W.A., Soto M.C. UNC-40/DCC, SAX-3/Robo, and VAB-1/Eph polarize F-actin during embryonic morphogenesis by regulating the WAVE/SCAR actin nucleation complex. Plos Genet. 2012;8:1–17. doi: 10.1371/journal.pgen.1002863. [DOI] [PMC free article] [PubMed] [Google Scholar]
- Blockus H., Chédotal A. SLIT-ROBO signaling. Development. 2016;143:3037–3044. doi: 10.1242/dev.132829. [DOI] [PubMed] [Google Scholar]
- Boyd A.W., Bartlett P.F., Lackmann M. Therapeutic targeting of EPH receptors and their ligands. Nat. Rev. Drug Discov. 2014;13:39–62. doi: 10.1038/nrd4175. [DOI] [PubMed] [Google Scholar]
- Brand T.M., Iida M., Li C., Wheeler D.L. The nuclear epidermal growth factor receptor signaling network and its role in cancer. Discov. Med. 2011;12:419–432. [PMC free article] [PubMed] [Google Scholar]
- Brand T.M., Iida M., Luthar N., Starr M.M., Huppert E.J., Wheeler D.L. Nuclear EGFR as a molecular target in cancer. Radiother. Oncol. 2013;108:370–377. doi: 10.1016/j.radonc.2013.06.010. [DOI] [PMC free article] [PubMed] [Google Scholar] [Research Misconduct Found]
- Brand T.M., Iida M., Stein A.P., Corrigan K.L., Braverman C.M., Coan J.P., Pearson H.E., Bahrar H., Fowler T.L., Bednarz B.P. AXL is a logical molecular target in head and neck squamous cell carcinoma. Clin. Cancer Res. 2015;21:2601–2612. doi: 10.1158/1078-0432.CCR-14-2648. [DOI] [PMC free article] [PubMed] [Google Scholar]
- Brantley-Sieders D.M. Clinical relevance of EPHs and ephrins in cancer: lessons from breast, colorectal, and lung cancer profiling. Semin. Cell Dev. Biol. 2012;23:102–108. doi: 10.1016/j.semcdb.2011.10.014. [DOI] [PMC free article] [PubMed] [Google Scholar]
- Bray F., Ferlay J., Soerjomataram I., Siegel R.L., Torre L.A., Jemal A. Global cancer statistics: GLOBOCAN estimates of incidence and mortality worldwide for 36 cancers in 185 countries. CA Cancer J. Clin. 2018;68:394–424. doi: 10.3322/caac.21492. [DOI] [PubMed] [Google Scholar]
- Chang P.H., Hwang-Verslues W.W., Chang Y.C., Chen C.C., Hsiao M., Jeng Y.M., Chang K.J., Lee E.Y., Shew J.Y., Lee W.H. Activation of Robo1 signaling of breast cancer cells by Slit2 from stromal fibroblast restrains tumorigenesis via blocking PI3K/Akt/β-catenin pathway. Cancer Res. 2012;72 18:4652–4661. doi: 10.1158/0008-5472.CAN-12-0877. [DOI] [PMC free article] [PubMed] [Google Scholar]
- Chen H., Zhang M., Tang S., London N.R., Li D.Y., Zhang K. SLIT-ROBO signaling in ocular angiogenesis. Adv. Exp. Med. Biol. 2010;664:457–463. doi: 10.1007/978-1-4419-1399-9_52. [DOI] [PubMed] [Google Scholar]
- Chin-Sang I.D., George S.E., Ding M., Moseley S.M., Lynch A.S., Chisholm A.D. The Ephrin VAB-2/EFN-1 functions in neuronal signaling to regulate epidermal morphogenesis in C. elegans. Cell. 1999;99:781–790. doi: 10.1016/s0092-8674(00)81675-x. [DOI] [PubMed] [Google Scholar]
- Choi Y., Syeda F., Walker J.R., Finerty P.J., Jr., Cuerrier D., Wojciechowski A., Liu Q., Dhe-Paganon S., Gray N.S. Discovery and structural analysis of Eph receptor tyrosine kinase inhibitors. Bioorg. Med. Chem. Lett. 2009;19:4467–4470. doi: 10.1016/j.bmcl.2009.05.029. [DOI] [PMC free article] [PubMed] [Google Scholar]
- Dallol A., Da Silva N.F., Viacava P., Minna J.D., Bieche I., Maher E.R., Latif F. SLIT2, a human homologue of the Drosophila Slit2 gene, has tumor suppressor activity and is frequently inactivated in lung and breast cancers. Cancer Res. 2002;62:5874–5880. [PubMed] [Google Scholar]
- Darling T.K., Lamb T.J. Emerging roles for Eph receptors and ephrin ligands in immunity. Front. Immunol. 2019;10:1–15. doi: 10.3389/fimmu.2019.01473. [DOI] [PMC free article] [PubMed] [Google Scholar]
- Deo R., Singh D.R., Pasquale E.B., Hristova K. A small peptide promotes EphA2 kinase-dependent signaling by stabilizing EphA2 dimers. Biochim. Biophys. Acta. 2016;1860:1922–1928. doi: 10.1016/j.bbagen.2016.06.004. [DOI] [PMC free article] [PubMed] [Google Scholar]
- Dunaway C.M., Hwang Y., Lindsley C.W., Cook R.S., Wu J.Y., Boothby M., Chen J., Brantley-Sieders D.M. Cooperative signaling between Slit2 and Ephrin-A1 regulates a balance between angiogenesis and angiostasis. Mol. Cell. Biol. 2011;31:404–416. doi: 10.1128/MCB.00667-10. [DOI] [PMC free article] [PubMed] [Google Scholar]
- Fang W.B., Brantley-Sieders D.M., Parker M.A., Reith A.D., Chen J. A kinase-dependent role for EPHA2 receptor in promoting tumor growth and metastasis. Oncogene. 2005;24:7859–7868. doi: 10.1038/sj.onc.1208937. [DOI] [PubMed] [Google Scholar]
- Fang W.B., Brantley-Sieders D.M., Hwang Y., AJ Ham A.J., Chen J. Identification and functional analysis of phosphorylated tyrosine residues within EphA2 receptor tyrosine kinase. J. Biol. Chem. 2008;283:16017–16026. doi: 10.1074/jbc.M709934200. [DOI] [PMC free article] [PubMed] [Google Scholar]
- Faoro L.1., Singleton P.A., Cervantes G.M., Lennon F.E., Choong N.W., Kanteti R., Ferguson B.D., Husain A.N., Tretiakova M.S., Ramnath N. EPHA2 mutation in lung squamous cell carcinoma promotes increased cell survival, cell invasion, focal adhesions, and mammalian target of rapamycin activation. J. Biol. Chem. 2010;285:18575–18585. doi: 10.1074/jbc.M109.075085. [DOI] [PMC free article] [PubMed] [Google Scholar]
- Ferguson B.D., Liu R., Rolle C.E., Tan Y.H., Krasnoperov V., Kanteti R., Tretiakova M.S., Cervantes G.M., Hasina R., Hseu R.D. The EPHB4 receptor tyrosine kinase promotes lung cancer growth: a potential novel therapeutic target. PLoS One. 2013;8:67668. doi: 10.1371/journal.pone.0067668. [DOI] [PMC free article] [PubMed] [Google Scholar]
- Fukazawa T., Guo M., Ishida N., Yamatsuji T., Takaoka M., Yokota E., Haisa M., Miyake N., Ikeda T., Okui T. SOX2 suppresses CDKN1A to sustain growth of lung squamous cell carcinoma. Sci. Rep. 2016;6:20113. doi: 10.1038/srep20113. [DOI] [PMC free article] [PubMed] [Google Scholar]
- Gara R.K., Kumari S., Ganju A., Yallapu M.M., Jaggi M., Chauhan S.C. SLIT/ROBO pathway: a promising therapeutic target for cancer. Drug Discov. Today. 2015;20:156–164. doi: 10.1016/j.drudis.2014.09.008. [DOI] [PMC free article] [PubMed] [Google Scholar]
- Gomes D.A., Rodrigues M.A., Leite M.F., Gomez M.V., Varnai P., Balla T., Bennett A.M., Nathanson M.H. c-Met must translocate to the nucleus to initiate calcium signals. J. Biol. Chem. 2008;283:4344–4351. doi: 10.1074/jbc.M706550200. [DOI] [PMC free article] [PubMed] [Google Scholar]
- Grieshammer U., Ma L., Plump A.S., Wang F., Tessier-Lavigne M., Martin G.R. SLIT2-mediated ROBO2 signaling restricts kidney induction to a single site. Dev. Cell. 2004;6:709–717. doi: 10.1016/s1534-5807(04)00108-x. [DOI] [PubMed] [Google Scholar]
- George S.E., Simokat K., Hardin J., Chisholm A.D. The VAB-1 Eph receptor tyrosine kinase functions in neural and epithelial morphogenesis in C. elegans. Cell. 1998;92:633–643. doi: 10.1016/s0092-8674(00)81131-9. [DOI] [PubMed] [Google Scholar]
- Ghenea S., Boudreau J.R., Lague N.P., Chin-Sang I.D. The VAB-1 EPH receptor tyrosine kinase and SAX-3/ROBO neuronal receptors function together during C. elegans embryonic morphogenesis. Development. 2005;132:3679–3690. doi: 10.1242/dev.01947. [DOI] [PubMed] [Google Scholar]
- Herbst R.S., Morgensztern D., Boshoff C. The biology and management of non-small cell lung cancer. Nature. 2018;553:446–454. doi: 10.1038/nature25183. [DOI] [PubMed] [Google Scholar]
- Hohenester E. Structural insight into SLIT-ROBO signalling. Biochem. Soc. Trans. 2008;36:251–256. doi: 10.1042/BST0360251. [DOI] [PubMed] [Google Scholar]
- Horn L., Infante J.R., Reckamp K.L., Blumenschein G.R., Leal T.A., Waqar S.M., Gitlitz B.J., Sanborn R.E., Whisenant J.G., Du L. Ensartinib (X-396) in ALK-positive non-small cell lung cancer: results from a first-in-human phase I/II, multicenter study. Clin. Cancer Res. 2018;24:2771–2779. doi: 10.1158/1078-0432.CCR-17-2398. [DOI] [PMC free article] [PubMed] [Google Scholar]
- Huang Z., Wen P., Kong R., Cheng H., Zhang B., Quan C., Bian Z., Chen M., Zhang Z., Chen X. USP33 mediates SLIT-ROBO signaling in inhibiting colorectal cancer cell migration. Int. J. Cancer. 2015;136:1792–1802. doi: 10.1002/ijc.29226. [DOI] [PMC free article] [PubMed] [Google Scholar]
- Johnson C., Segovia B., Kandpal R.P. EPHA7 and EPHA10 physically interact and differentially Co-localize in normal breast and breast carcinoma cell lines, and the Co-localization pattern is altered in EPHB6-expressing MDA-MB-231 cells. Cancer Genomics Proteomics. 2016;13:359–368. [PMC free article] [PubMed] [Google Scholar]
- Kidd T., Bland K.S., Goodman C.S. SLIT is the midline repellent for the ROBO receptor in Drosophila. Cell. 1999;19:785–794. doi: 10.1016/s0092-8674(00)80589-9. [DOI] [PubMed] [Google Scholar]
- Koch H., Busto M.E., Kramer K., Médard G., Kuster B. Chemical proteomics uncovers EPHA2 as a mechanism of acquired resistance to small molecule EGFR kinase inhibition. J. Proteome Res. 2015;14:2617–2625. doi: 10.1021/acs.jproteome.5b00161. [DOI] [PubMed] [Google Scholar]
- Lemmon M., Schlessinger A.J. Cell signaling by receptor tyrosine kinases. Cell. 2010;141:1117–1134. doi: 10.1016/j.cell.2010.06.011. [DOI] [PMC free article] [PubMed] [Google Scholar]
- Lisabeth E.M., Falivelli G., Pasquale E.B. Eph receptor signaling and ephrins. Cold Spring Harb. Perspect. Biol. 2013;5:1–20. doi: 10.1101/cshperspect.a009159. [DOI] [PMC free article] [PubMed] [Google Scholar]
- Liu Y., Yu C., Qiu Y., Huang D., Zhou X., Zhang X., Tian Y. Downregulation of EphA2 expression suppresses the growth and metastasis in squamous-cell carcinoma of the head and neck in vitro and in vivo. J. Cancer Res. Clin. Oncol. 2012;138:195–202. doi: 10.1007/s00432-011-1087-9. [DOI] [PubMed] [Google Scholar]
- Maiti G.P., Ghosh A., Mondal P., Ghosh S., Chakraborty J., Roy A., Roy Chowdhury S., Panda C.K. Frequent inactivation of SLIT2 and ROBO1 signaling in head and neck lesions: clinical and prognostic implications. Oral Surg. Oral Med. Oral Pathol. Oral Radiol. 2015;119:202–212. doi: 10.1016/j.oooo.2014.09.029. [DOI] [PubMed] [Google Scholar]
- Maruyama I.N. Mechanisms of activation of receptor tyrosine kinases: monomers or dimers. Cells. 2014;3:304–330. doi: 10.3390/cells3020304. [DOI] [PMC free article] [PubMed] [Google Scholar]
- Miao H., Li D.Q., Mukherjee A., Guo H., Petty A., Cutter J., Basilion J.P., Sedor J., Wu J., Danielpour D. EPHA2 mediates ligand-dependent inhibition and ligand-independent promotion of cell migration and invasion via a reciprocal regulatory loop with Akt. Cancer Cell. 2009;16:9–20. doi: 10.1016/j.ccr.2009.04.009. [DOI] [PMC free article] [PubMed] [Google Scholar]
- Miao B., Ji Z., Tan L., Taylor J.M., Zhang J., Choi H.G., Frederick D.T., Kumar R., Wargo J.A., Flaherty K.T. EphA2 is a mediator of vemurafenib resistance and a novel therapeutic target in melanoma. Cancer Discov. 2015;5:274–287. doi: 10.1158/2159-8290.CD-14-0295. [DOI] [PMC free article] [PubMed] [Google Scholar]
- Mosch B., Reissenweber B., Neuber C., Pietzsch J. Eph receptors and Ephrin ligands: important players in angiogenesis and tumor angiogenesis. J. Oncol. 2010;2010:135285. doi: 10.1155/2010/135285. [DOI] [PMC free article] [PubMed] [Google Scholar]
- Pasquale E.B. EPH receptors and ephrins in cancer: bidirectional signaling and beyond. Nat. Rev. Cancer. 2010;10:165–180. doi: 10.1038/nrc2806. [DOI] [PMC free article] [PubMed] [Google Scholar]
- Pradeep S., Huang J., Mora E.M., Nick A.M., Cho M.S., Wu S.Y., Noh K., Pecot C.V., Rupaimoole R., Stein M.A. Erythropoietin stimulates tumor growth via EPHB4. Cancer Cell. 2015;28:610–622. doi: 10.1016/j.ccell.2015.09.008. [DOI] [PMC free article] [PubMed] [Google Scholar]
- Rothberg J.M., Hartley D.A., Walther Z., Artavanis-Tsakonas S. SLIT: an EGF-homologous locus of D. melanogaster involved in the development of the embryonic central nervous system. Cell. 1988;23:1047–1059. doi: 10.1016/0092-8674(88)90249-8. [DOI] [PubMed] [Google Scholar]
- Sabari J.K., Paik P.K. Relevance of genetic alterations in squamous and small cell lung cancer. Ann. Transl. Med. 2017;5:373–386. doi: 10.21037/atm.2017.06.72. [DOI] [PMC free article] [PubMed] [Google Scholar]
- Salgia R., Kulkarni P. The genetic/non-genetic duality of drug 'resistance' in cancer. Trends Cancer. 2018;4:110–118. doi: 10.1016/j.trecan.2018.01.001. [DOI] [PMC free article] [PubMed] [Google Scholar]
- Seki M., Watanabe A., Enomoto S., Kawamura T., Ito H., Kodama T., Hamakubo T., Aburatani H. Human ROBO1 is cleaved by metalloproteinases and gamma-secretase and migrates to the nucleus in cancer cells. FEBS Lett. 2010;584:2909–2915. doi: 10.1016/j.febslet.2010.05.009. [DOI] [PubMed] [Google Scholar]
- Siegel R.L., Miller K.D., Jemal A. Cancer statistics. CA Cancer J. Clin. 2020;70:7. doi: 10.3322/caac.21590. [DOI] [PubMed] [Google Scholar]
- Singh A., Winterbottom E., Daar I.O. Eph/ephrin signaling in cell-cell and cell-substrate adhesion. Front. Biosci. (Landmark Ed.) 2012;17:473–497. doi: 10.2741/3939. [DOI] [PMC free article] [PubMed] [Google Scholar]
- Singh D.R., Ahmed F., King C., Gupta N., Salotto M., Pasquale E.B., Hristova K. EPHA2 receptor nnliganded dimers suppress EPHA2 pro-tumorigenic signaling. J. Biol. Chem. 2015;290:27271–27279. doi: 10.1074/jbc.M115.676866. [DOI] [PMC free article] [PubMed] [Google Scholar]
- Singh D.R., Kanvinde P., King C., Pasquale E.B., Hristova K. The EPHA2 receptor is activated through induction of distinct, ligand-dependent oligomeric structures. Commun. Biol. 2018;22:1–15. doi: 10.1038/s42003-018-0017-7. [DOI] [PMC free article] [PubMed] [Google Scholar]
- Stammes M.A., Prevoo H.A., Ter Horst M.C., Groot S.A., Van de Valde C.J.H., Chan A.B., de Gues-OeL- F., Kuppen P.J.K., Vahrmeijer A.L., Pasquale E.B., Sier C.F.M. Evaluation of EphA2 and EphB4 as targets for image-guided colorectal cancer Surgery. Int. J. Mol. Sci. 2017;18:307–316. doi: 10.3390/ijms18020307. [DOI] [PMC free article] [PubMed] [Google Scholar]
- Strickland P., Shin G.C., Plump A., Tessier-Lavigne M., Hinck L. SLIT2 and netrin 1 act synergistically as adhesive cues to generate tubular bi-layers during ductal morphogenesis. Development. 2006;133:823–832. doi: 10.1242/dev.02261. [DOI] [PubMed] [Google Scholar]
- Taddei M.L., Parri M., Angelucci A., Onnis B., Bianchini F., Giannoni E., Raugei G., Calorini L., Rucci N., Teti A. Kinase-dependent and -independent roles of EPHA2 in the regulation of prostate cancer invasion and metastasis. Am. J. Pathol. 2009;174:1492–1503. doi: 10.2353/ajpath.2009.080473. [DOI] [PMC free article] [PubMed] [Google Scholar]
- Tan Y.C., Srivastava S., Won B.M., Kanteti R., Arif Q., Husain A.N., Li H., Vigneswaran W.T., Pang K.M., Kulkarni P. EPHA2 mutations with oncogenic characteristics in squamous cell lung cancer and malignant pleural mesothelioma. Oncogenesis. 2019;8:49–60. doi: 10.1038/s41389-019-0159-6. [DOI] [PMC free article] [PubMed] [Google Scholar]
- Tey S.K., Tse E.Y.T., Mao X., Ko F.C.F., Wong A.S.T., Lo R.C., Ng I.O., Yam J. W. P. Nuclear Met promotes hepatocellular carcinoma tumorigenesis and metastasis by upregulation of TAK1 and activation of NF-κB pathway. Cancer Lett. 2017;411:150–161. doi: 10.1016/j.canlet.2017.09.047. [DOI] [PubMed] [Google Scholar]
- Volz C., Breid S., Selenz C., Zaplatina A., Golfmann K., Meder L., Dietlein F., Borchmann S., Chatterjee S., Siobal M. Inhibition of tumor VEGFR2 induces serine 897 EphA2-dependent tumor cell invasion and metastasis in NSCLC. Cell Rep. 2020;31:107568. doi: 10.1016/j.celrep.2020.107568. [DOI] [PubMed] [Google Scholar]
- Wang S.C., Hung M.C. Nuclear translocation of the epidermal growth factor receptor family membrane tyrosine kinase receptors. Clin. Cancer Res. 2009;15:6484–6489. doi: 10.1158/1078-0432.CCR-08-2813. [DOI] [PMC free article] [PubMed] [Google Scholar]
- Xian J., Clark K.J., Fordham R., Pannell R., Rabbitts T.H., Rabbitts P.H. Inadequate lung development and bronchial hyperplasia in mice with a targeted deletion in the Dutt1/ROBO1 gene. Proc. Natl. Acad. Sci. U S A. 2001;18:15062–15066. doi: 10.1073/pnas.251407098. [DOI] [PMC free article] [PubMed] [Google Scholar]
- Xie Y., Nurkesh A.A., Ibragimova N., Zhanzak Z., Meyerbekova A., Alexeyeva Z., Yesbolatova A., Satayeva M., Mustafa A., Manarbek L. Systematic analysis of NLMP suggests nuclear localization of RTK/MET kinases resemble cancer cell clearance. J. Exp. Clin. Cancer Res. 2019;38:43–54. doi: 10.1186/s13046-018-1004-z. [DOI] [PMC free article] [PubMed] [Google Scholar]
- Xie Y., Lu W., Liu S., Yang Q., Carver B.S., Li E., Wang Y., Fazli L., Gleave M., Chen Z. Crosstalk between nuclear MET and SOX9/β-catenin correlates with castration-resistant prostate cancer. Mol. Endocrinol. 2014;28:1629–1639. doi: 10.1210/me.2014-1078. [DOI] [PMC free article] [PubMed] [Google Scholar]
- Zappa C., Mousa S.A. Non-small cell lung cancer: current treatment and future advances. Transl. Lung Cancer Res. 2016;5:288–300. doi: 10.21037/tlcr.2016.06.07. [DOI] [PMC free article] [PubMed] [Google Scholar]
- Zelinski D.P., Zantek N.D., Stewart J.C., Irizarry A.R., Kinch M.S. EPHA2 overexpression causes tumorigenesis of mammary epithelial cells. Cancer Res. 2001;61:2301–2306. [PubMed] [Google Scholar]
- Zhou Y., Sakurai H. Emerging and diverse functions of the EPHA2 noncanonical pathway in cancer progression. Biol. Pharm. Bull. 2017;40:1616–1624. doi: 10.1248/bpb.b17-00446. [DOI] [PubMed] [Google Scholar]
- Zhou Y., Yamada N., Tanaka T., Hori T., Yokoyama S., Hayakawa Y., Yano S., Fukuoka J., Koizumi K., Saiki I., Sakurai H. Crucial roles of RSK in cell motility by catalysing serine phosphorylation of EPHA2. Nat. Commun. 2015;6:7679. doi: 10.1038/ncomms8679. [DOI] [PMC free article] [PubMed] [Google Scholar]
- Zhuang G., Brantley-Sieder s D.M., Vaught D., Yu J., Xie L., Wells S., Jackson D., Muraoka-Cook R., Arteaga C., Chen J. Elevation of receptor tyrosine kinase EPHA2 mediates resistance to trastuzumab therapy. Cancer Res. 2010;70:299–308. doi: 10.1158/0008-5472.CAN-09-1845. [DOI] [PMC free article] [PubMed] [Google Scholar]
Associated Data
This section collects any data citations, data availability statements, or supplementary materials included in this article.
Supplementary Materials
Data Availability Statement
This study did not generate/analyze datasets/code.