

Abstract
Individuals with Fragile X Syndrome (FXS) and autism spectrum disorder (ASD) exhibit cognitive impairments, social deficits, increased anxiety, and sensory hyperexcitability. Previously, we showed that elevated levels of matrix metalloproteinase-9 (MMP-9) may contribute to abnormal development of parvalbumin (PV) interneurons and perineuronal nets (PNNs) in the developing auditory cortex (AC) of Fmr1 knock-out (KO) mice, which likely underlie auditory hypersensitivity. Thus, MMP-9 may serve as a potential target for treatment of auditory hypersensitivity in FXS. Here, we used the MMP-2/9 inhibitor, SB-3CT, to pharmacologically inhibit MMP-9 activity during a specific developmental period and to test if inhibition of MMP-9 activity reverses neural oscillation deficits and behavioral impairments by enhancing PNN formation around PV cells in Fmr1 KO mice. Electroencephalography (EEG) was used to measure resting state and sound-evoked electrocortical activity in auditory and frontal cortices of postnatal day (P)22–23 male mice before and one-day after treatment with SB-3CT (25 mg/kg) or vehicle. At P27–28, animal behaviors were tested to measure the effects of the treatment on anxiety and hyperactivity. Results show that acute inhibition of MMP-9 activity improved evoked synchronization to auditory stimuli, and ameliorated mouse behavioral deficits. MMP-9 inhibition enhanced PNN formation, increased PV levels and TrkB phosphorylation yet reduced Akt phosphorylation in the AC of Fmr1 KO mice. Our results show that MMP-9 inhibition during early postnatal development is beneficial in reducing some auditory processing deficits in the FXS mouse model and may serve as a candidate therapeutic for reversing sensory hypersensitivity in FXS and possibly other ASDs.
Keywords: Fragile X Syndrome, Electroencephalography, Matrix Metalloproteinase-9, Sensory Hypersensitivity, Perineuronal Nets, Parvalbumin
Graphical Abstract
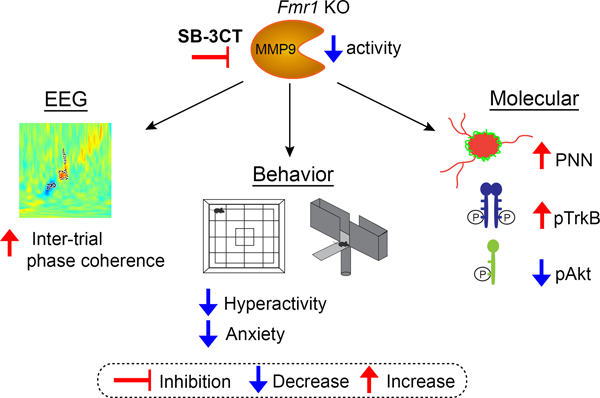
The current study uses the Matrix metalloproteinase (MMP)-2/9 inhibitor SB-3CT to pharmacologically inhibit MMP-9 activity postnatally and test if acute MMP-9 inhibition reverses neural oscillation deficits, behavioral impairments, and enhances perineuronal net (PNN) formation around parvalbumin (PV) cells in Fmr1 KO mice. Results show improved evoked synchronization to auditory stimuli and mouse behavior, enhanced PNN formation and TrkB phosphorylation, and reduced aberrant Akt phosphorylation in the auditory cortex of Fmr1 KO mice. This suggests that MMP-9 inhibition is beneficial in ameliorating cortical processing deficits in Fragile X Syndrome (FXS) and that MMP-9 inhibitors may serve as therapeutic candidates to reduce sensory hypersensitivity.
Introduction
Fragile X Syndrome (FXS) is a neurodevelopmental disorder caused by the hypermethylation of the Fragile X mental retardation 1 (Fmr1) gene, resulting in the loss of the Fragile X Mental Retardation Protein (FMRP) (Verkerk et al. 1991), a regulator of protein synthesis (Laggerbauer 2001). FXS is the most prevalent cause of inherited intellectual disability (Hagerman et al. 2008) and a leading genetic cause of autism, providing a genetic model to study the neurobiological mechanisms underlying autism spectrum disorders (ASD) (Crawford et al. 2001; Hagerman et al. 2008). Individuals with FXS exhibit cognitive dysfunctions (Freund & Reiss 1991), increased anxiety (Talisa et al. 2014), and sensory hyperexcitability (Miller et al. 1999; Rotschafer & Razak 2013; Ethridge et al. 2016).
Auditory hypersensitivity in individuals with FXS and Fmr1 knock-out (KO) mice is commonly characterized by a heightened response to non-aversive stimuli (Crane et al. 2009; McDiarmid et al. 2017; Sinclair et al. 2017; Rais et al. 2018), reduced ability to habituate to sounds (Castren et al. 2003; Ethridge et al. 2016; Lovelace et al. 2016; Wang et al. 2017), and greater resting state gamma power in electroencephalography (EEG) recordings (Ethridge et al. 2017; Wang et al. 2017; Lovelace et al. 2018; Lovelace et al. 2019). Studies in the Fmr1 KO mice also show increased sensory responses, broader receptive fields, impaired sound selectivity (Rotschafer & Razak 2013) and abnormal network synchronization (Paluszkiewicz et al. 2011). It is hypothesized that the inability to habituate to auditory stimuli (Castren et al. 2003; Ethridge et al. 2016) including ongoing background noise, a phenotype that is also observed in Fmr1 KO mice (Lovelace et al. 2016; Lovelace et al. 2018), may contribute to hypersensitivity to sounds and cortical hyperexcitability (Gibson et al. 2008; Ethridge et al. 2016; Ethridge et al. 2017; Lovelace et al. 2018; Lovelace et al. 2019). Notably, EEG gamma frequency band abnormalities are associated with heightened sensory sensitivities and social communication deficits in FXS individuals (Ethridge et al. 2016; Ethridge et al. 2017; Ethridge et al. 2019). Taking advantage of the link between EEG abnormalities and sensory hypersensitivity in FXS, this study used these EEG measures to test the efficacy of a candidate treatment in Fmr1 KO mice.
Individuals with FXS (Dziembowska et al. 2013) and Fmr1 KO mice (Bilousova et al. 2009; Gkogkas et al. 2014; Sidhu et al. 2014) exhibit increased levels of the secreted endopeptidase, matrix metalloproteinase-9 (MMP-9). Specifically, Fmr1 KO mice show elevated levels of MMP-9 in the auditory cortex (AC) during postnatal day (P) 3–18 period. It is hypothesized that increased activity of MMP-9 may contribute to the development of auditory hypersensitivity by excessively degrading PNNs thereby resulting in impaired PNN formation around PV interneurons and affecting PV development in the AC of Fmr1 KO mice at P21 (Wen et al. 2018). Indeed, genetic reduction of MMP-9 levels enhanced PNN formation around PV interneurons and restored sound-evoked responses and spontaneous activity to WT levels (Wen et al. 2018). Genetic removal of MMP-9 also rescued altered event-related potential (ERP) habituation responses in the AC of adult Fmr1 KO mice (Lovelace et al. 2016), normalized dendritic spine abnormalities in the hippocampus and improved abnormal behaviors in Fmr1 KO mice (Sidhu et al. 2014). PV interneuron dysfunction contributes to abnormal network synchrony and alterations in gamma oscillations (Vreugdenhil et al. 2003; Lewis et al. 2005; Sohal et al. 2009). Overall these studies indicate that (1) MMP-9 may influence the development of hypersensitive networks during the third and fourth postnatal weeks, a time that coincides with a critical developmental window for inhibitory and excitatory circuit maturation (Gibson et al. 2008; Oswald & Reyes 2008) and (2) that targeted inhibition of MMP-9 may serve as a candidate therapeutic to reduce auditory hypersensitivity in FXS.
In this study, we tested the hypothesis that acute pharmacological inhibition of aberrant MMP-9 activity during the critical developmental period would ameliorate cortical processing deficits, including abnormal resting state neural oscillatory patterns, the ability to synchronize to stimulus-induced oscillations, PV/PNN deficits, and behavioral impairments. Our results show that acute inhibition of MMP-9 during the P22–23 developmental period improved evoked synchronization to auditory stimuli and enhanced PNN formation around PV cells. We also observed beneficial effects of acute MMP-9 inhibition at P27–28 on animal behaviors, such as anxiety and hyperactivity. MMP-9 inhibition at P27–28 also increased PV levels and TrkB phosphorylation, and reduced aberrant Akt phosphorylation in the developing AC of Fmr1 KO mice.
Materials and Methods
Ethics Statement
All experiments and animal care/use protocols were approved by the Institutional Animal Care and Use Committee at the University of California, Riverside (approval number 20190015 and 20190029) and were carried out in accordance with NIH “Guide for the Care and Use of Laboratory Animals.” The study was not pre-registered.
Animals
Experimental animals were C57BL/6 mice obtained from Jackson Laboratories (RRID: IMSR_JAX:003025). Age-matched WT and Fmr1 KO male mice were used between postnatal day (P) 18–19 (EEG surgery N=79, N=14 died post-surgery), P22–23 [EEG recording (N=65) and PV/PNN analysis (N=24: note the same EEG animals were used for analysis) and DQ gelatin assay (N=16)] and P27–29 for behavior (N=37) and Western blot (N=8). For a detailed description of total animals and animals per group please refer to Figure 1, Figure 6, and Figure 7. A total of 140 male mice were used in this study with an average weight of 8 g and range from 6–18 g. All genotypes were confirmed with the analysis of tail samples by Transnetyx (Cordova, TN, USA), using real-time PCR-based system to probe for WT (fmr+/+forward: 5’-TGT GAT AGA ATA TGC AGC ATG TGA-3’) or KO (fmr−/−forward: 5’CAC GAG ACT AGT GAG ACG TG-3’) target sequence in each sample. Mice were maintained in an AAALAC accredited facility in 12 h light/dark cycles and food and water was available ad libitum. All experimental procedures were performed on C57BL/6 wild type (WT, RRID:IMSR_JAX:000664) and Fragile X mental retardation gene-1 (Fmr1) knock out (KO) mice (RRID: IMSR_JAX:003025, The Jackson Laboratory).
Figure 1. Developing Fmr1 KO mice exhibit increased low gamma power.
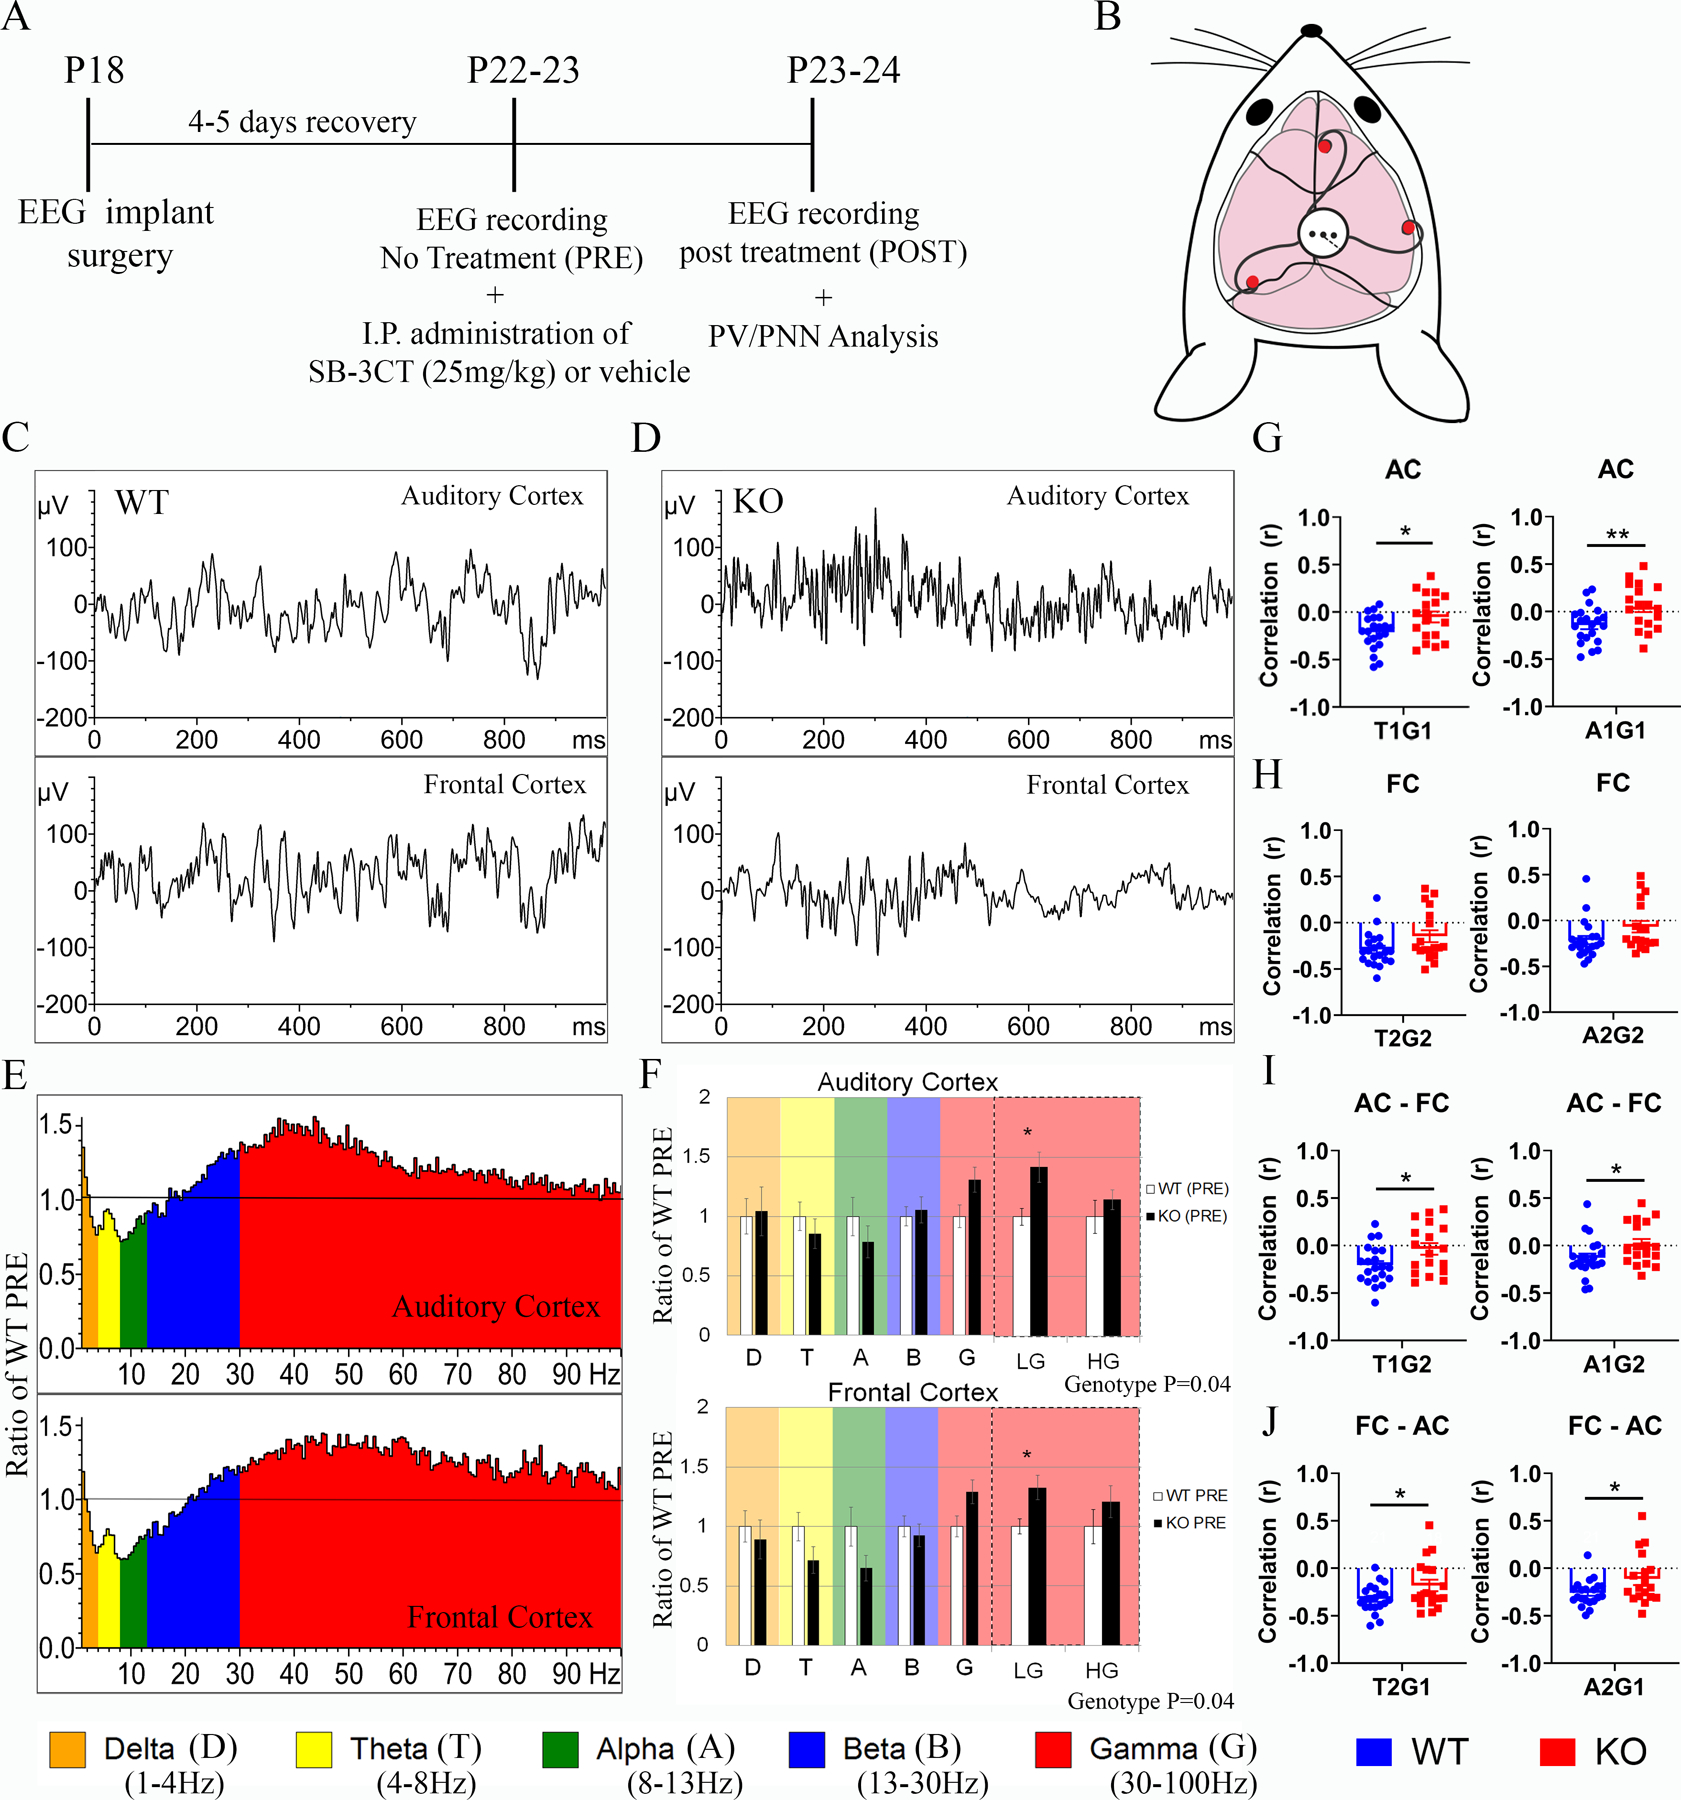
(A) Experimental timeline shows mice were implanted at P18 with 2-channel EEG electrodes (WT, N=35; Fmr1 KO, N=30) in the auditory cortex (AC) and the frontal cortex (FC), and with an occipital cortex reference electrode. Animals were allowed four-five days to recover post-surgery (WT, N=35; Fmr1 KO, N=30; N=14 (WT N=8; KO N=6) animals died post-surgery) and EEG recording was done prior to treatment (PRE) at P22–23 (WT, N=23, excluded N=1; Fmr1 KO, N=21, excluded N=1). Immediately after the EEG recording, animals were given either an intraperitoneal injection of SB-3CT (25mg/kg) or vehicle. At P23–24, a post treatment EEG recording was performed. Brains were collected for PV/PNN analysis immediately after EEG recording. (B) Schematic shows placement of electrodes, which consisted of a three-channel electrode post with three 1-mm stainless steel screws (depicted by red dots). (C-J) EEG recording was done prior to treatment (PRE) at P22–23. Resting data (baseline, in the absence of auditory stimulation) was collected for five minutes and divided into two-second segments for spectral analysis. Depicted are examples of EEG segments from individual WT (C) and Fmr1 KO (D) mice, which include simultaneous recording from the AC and the FC. (E-F) Graphs show average spectral power (μV2/Hz) in the AC and FC of Fmr1 KO mice (N=20) in a histogram (E) and bar graph format (F) expressed as the ratio of WT controls (N=22) prior to treatment (PRE). A value of 1 indicates no mean difference in power between WT and Fmr1 KO mice, while values above the black line indicate KO > WT, and below indicate KO < WT. (F) Statistical analysis was performed using a one-way MANCOVA with the percentage of time spent moving as a covariate. Genotype differences were compared using six spectral bands per region: Delta (D), Theta (T), Alpha, Beta (B), Low Gamma (LG), and High Gamma (HG). Since assumptions were not violated, we report an effect of genotype (AC: Pillai’s Trace =2.465, p=0.04; FC: Pillai’s Trace = 2.587, p=0.036) across all 6 of the combined frequency variables. Low gamma was significantly increased after correction for multiple comparisons in the both the AC and FC: AC low gamma, F (1,27) =10, p=0.003, ɳ2=0.204, FC low gamma, F (1,27) =9.012, p=0.005, ɳ2=0.188 (WT N=22, Fmr1 KO N=20). All graphs represent average values and the error bars indicate SEM. To determine if there is a relationship between power across different frequencies and/or regions, a Pearson’s correlation was done for resting baseline segments comparing Fmr1 KO (N=21, excluded N=3) versus WT control mice (N=23, excluded N=2). (G) Graph shows Pearson’s correlation (r) for each mouse for AC Theta/Low Gamma and AC Alpha/Low Gamma (WT, N=21; Fmr1 KO, N=18; T1G1: p=0.02; A1G1: p=0.008). (H) Graph shows the Pearson’s correlation (r) for FC Theta/Low Gamma and FC Alpha/Low Gamma. (I) Graph shows the Pearson’s correlation (r) for AC Theta/FC Low Gamma and AC Alpha/FC Low Gamma (T1G2: p=0.03); A1G2: p= 0.04). (J) Graph shows the Pearson’s correlation (r) for the FC Theta/AC Low Gamma and FC Alpha/AC Low Gamma (T2G1: p=0.04; A2G1: p=0.03). For power coupling comparisons, animals that moved less than five percent during the resting baseline were excluded from the analysis.
Figure 6. Acute SB-3CT-treatment normalizes anxiety/hyperactivity phenotype associated with Fmr1 KO mice.
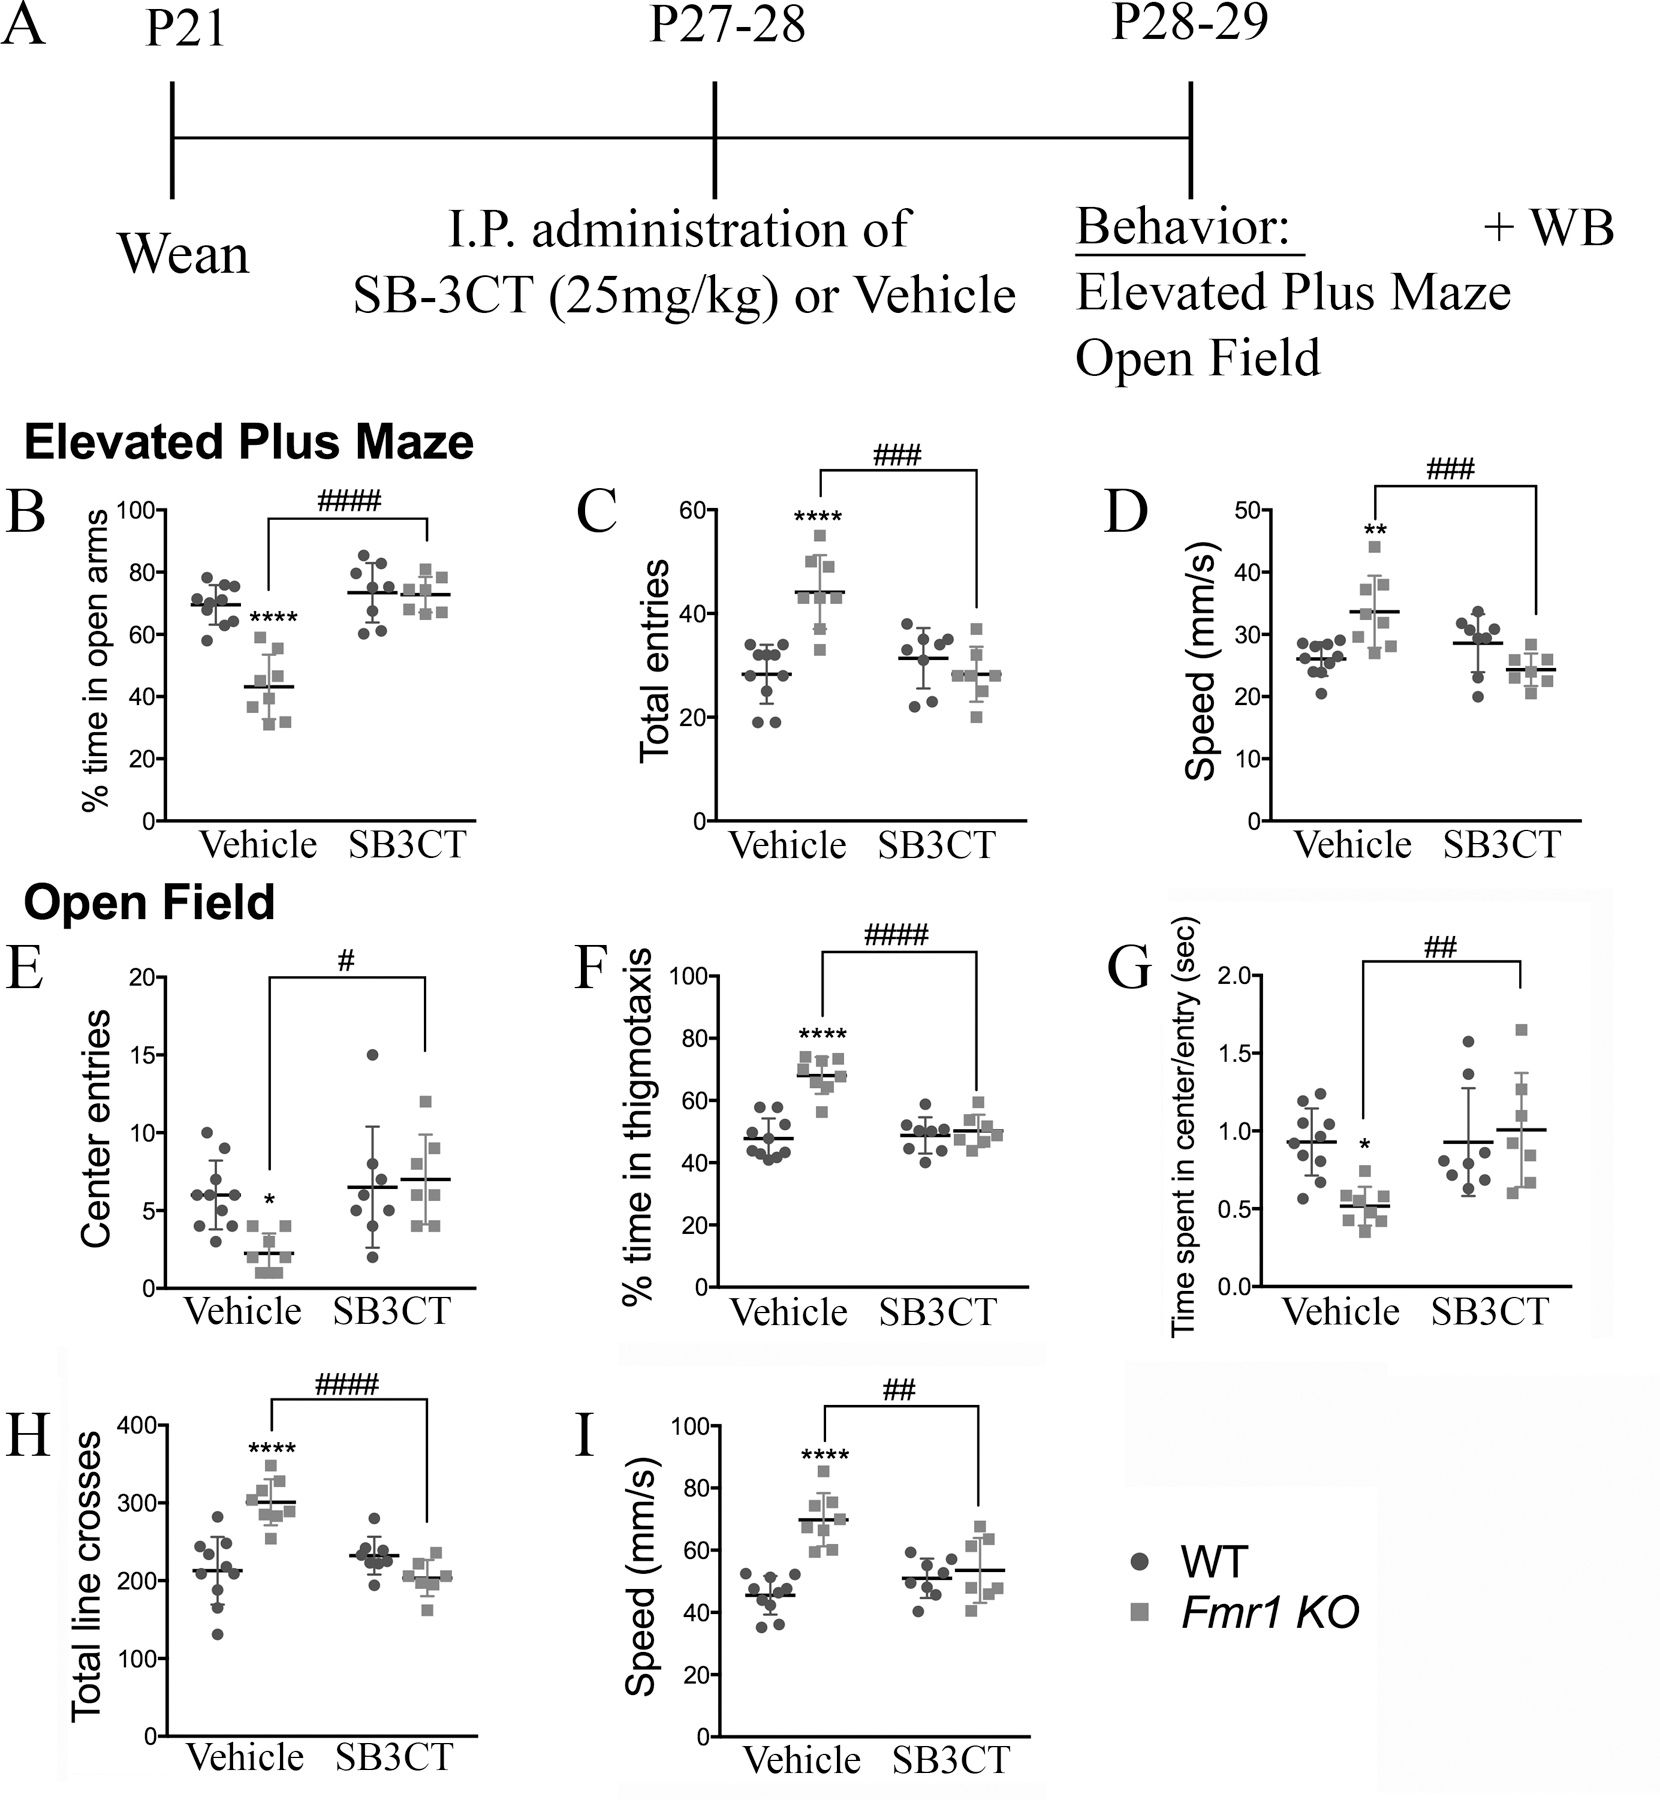
(A) Experimental timeline for behavior and Western blot analysis. For this, mice were given either an intraperitoneal injection of SB-3CT (25mg/kg) or vehicle at P27–28 and were tested for anxiety, locomotor, and hyperactivity using the open field and elevated plus maze test one-day post treatment. Brain samples were collected for Western blot analysis immediately after behavior. (B–D) Graphs show the percent time spent in the open arms (B), total entries into open and closed arms (C), and the average speed (D) in the elevated plus maze. (E–I) Graphs show the total number of center entries (E), the percent time spent in thigmotaxis (F), the time spent in the center per entry (G), the total number of line crosses (H), and the average speed (I) in the open field test. All graphs represent average values and the error bars indicate SEM (WT vs Fmr1 KO: *p<0.05, **p < 0.01, ****p < 0.0001; vehicle-treated vs SB-3CT-treated Fmr1 KO: #p<0.05, ##p<0.01, ###p<0.001, ####p<0.0001, vehicle-treated WT, N=10; SB-3CT-treated WT, N=8; vehicle-treated Fmr1 KO, N=10; SB-3CT-treated Fmr1 KO, N=9).
Figure 7. Acute MMP-9 inhibition reduces gelatinase activity and phosphorylation of Akt, while increasing PV levels and phosphorylation of TrkB in the AC of Fmr1 KO mice.
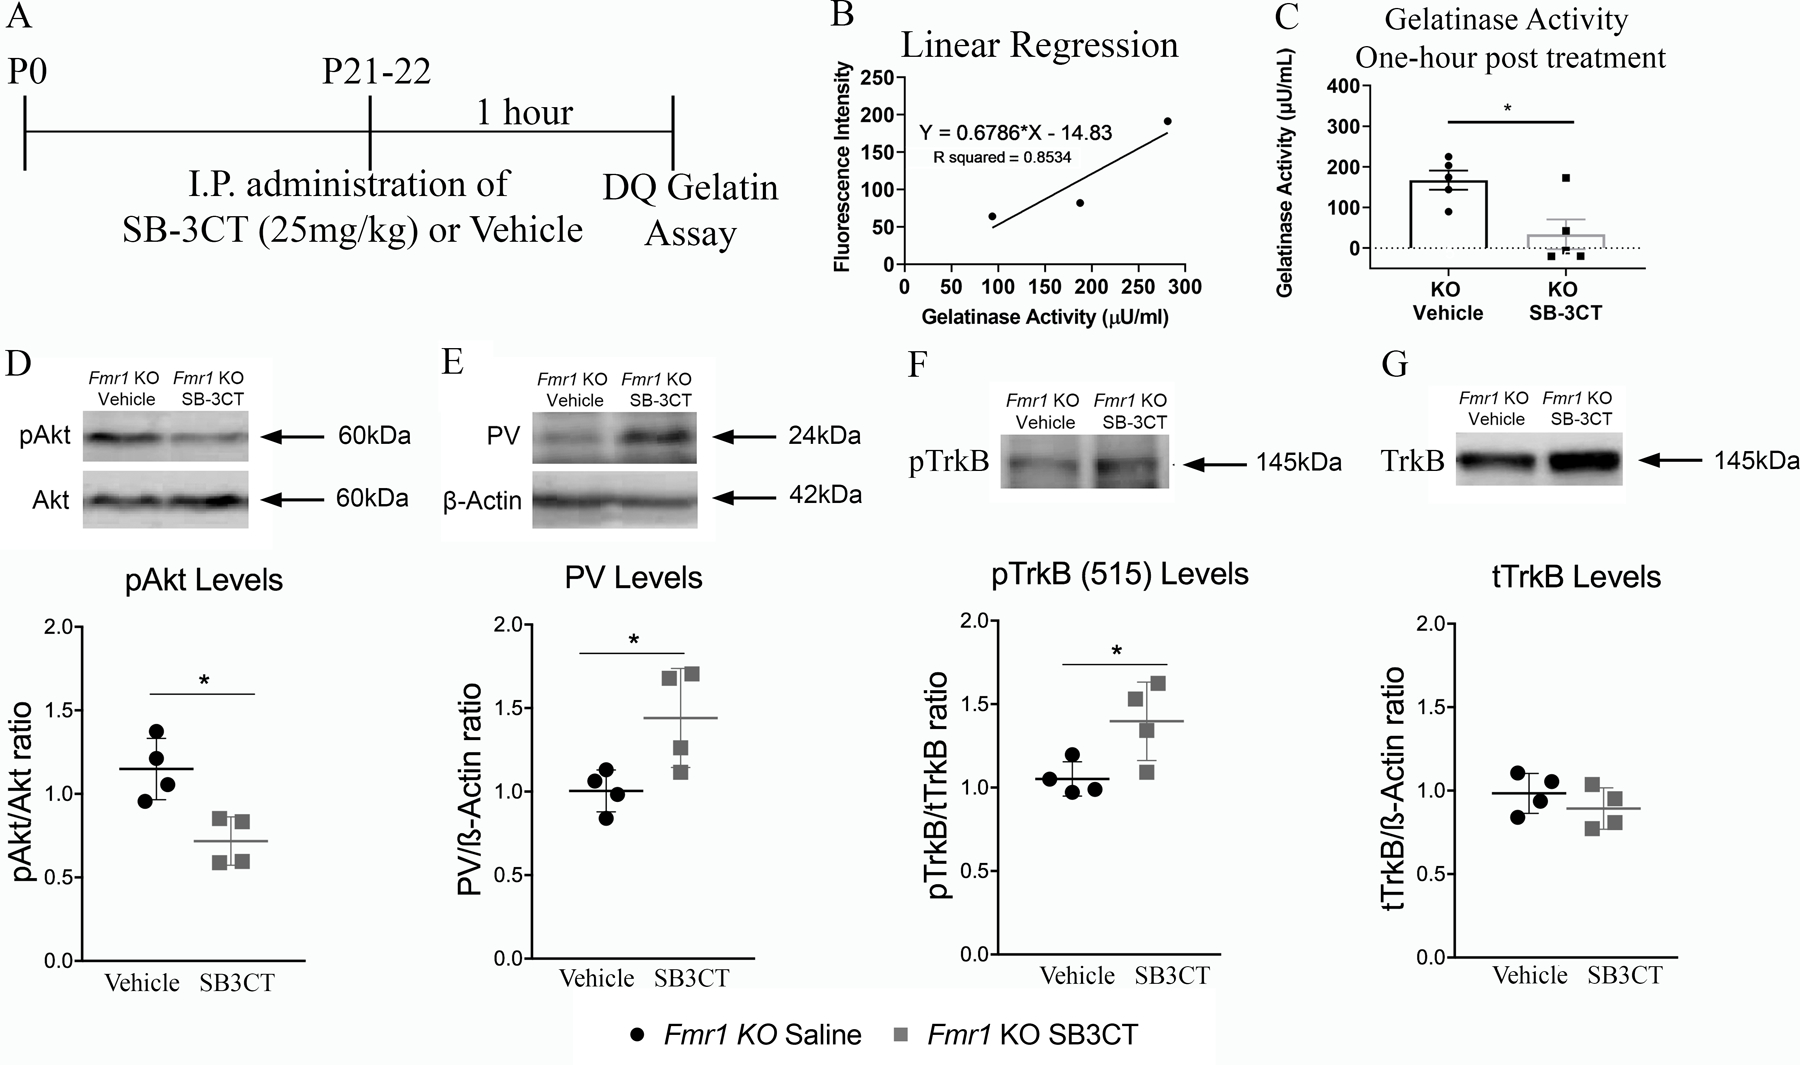
To confirm that the MMP-2/9 inhibitor, SB-3CT, reduced MMP-2/9 activity following treatment, gelatinase activity was measured using a Dye-Quenched (DQ) gelatin assay. (A) Experimental timeline for DQ gelatin assay. Mice (no EEG) were given either an intraperitoneal injection of SB-3CT (25mg/kg) or vehicle at P21–22 and brains were collected for the DQ Gelatin assay one-hour post injection. (B) Graph shows standard curve. (C) Fmr1 KO mice injected with SB-3CT (25 mg/kg) show reduced gelatinase activity compared to vehicle-treated mice 1 h post injection (N=5 per group, t-test, p=0.02). (D–G) Western blots show levels of pAkt and Akt (D), PV and actin (E), pTrkBY515 (F) and TrkB (D). Graphs show pAkt/Akt (D), PV/actin (E), pTrkBY515/TrkB (F), and TrkB/actin (G) ratios in the AC of vehicle-treated and SB-3CT-treated Fmr1 KO mice (N=4 per group) 24 h post injection. All graphs represent average values and error bars indicate SEM (*p<0.05).
Surgery for electroencephalography recordings
Surgical procedures were performed as described in detail previously (Lovelace et al. 2018; Lovelace et al. 2019). Briefly, mice were anesthetized with isoflurane inhalation (0.2–0.5%) and given an intraperitoneal (i.p.) injection of ketamine and xylazine (K/X: 100/20 mg/kg). Toe pinch reflex was used to measure anesthetic state every 10 min throughout the surgery, and supplemental doses, no more than half of the original dose of K/X, were administered as needed. Mice were placed in a stereotaxic frame (model 930; Kopf, CA). Artificial tear gel was applied to the eyes to prevent drying. Once the mouse was anesthetized, a midline sagittal incision was made along the scalp to expose the skull. A Foredom dental drill was used to drill three holes 1mm in diameter in the skull overlying the right AC (−1.6mm, +4.8mm), right frontal lobe (+2.6mm, +1.0mm), and left occipital cortex (−3.5mm, −5.2mm) (coordinate relative to bregma: anterior/posterior, medial/lateral). Three channel electrode posts (Plastics One, MS333–2-A-SPC) were attached to 1-mm stainless steel screws (Plastics One, 8L003905201F) and screws were advanced into the drilled holes until secure. Special care was taken not to advance the screws beyond the point of contact with the dura. Dental cement was applied around the screws, on the base of the post, and exposed skull. Postoperative care included topical application of a triple antibiotic ointment along the edges of the dental cement followed by two subcutaneous injections of buprenorphine (0.05 mg/kg), one immediately after surgery and one 6–10h after surgery. Mice were placed on a heating pad to aid recovery from anesthesia. Mice were group housed, returned to the vivarium and monitored daily until the day of EEG recordings, which allowed 4–5 days recovery post-surgery before recording.
Electrophysiology
All EEG recordings were performed during the hours of 5 AM to 7 PM. Mice were habituated for 20 min in an anechoic foam-lined sound-attenuating chamber (Gretch-Ken Industries Inc.) and connected to the BioPac acquisition system (BIOPAC Systems, Inc) through a 3-channel tether under brief isoflurane anesthesia. The tether was connected to a commutator located directly above the cage. Mice were then allowed to habituate to being connected to the tether for an additional 15 min before EEG recordings were obtained. During the recording session, a piezoelectric sensor placed under the floor of the cage detected mouse movement in the recording arena.
EEG activity was obtained using the BioPac system and Acqknowledge recording software from awake and freely moving mice. The BioPac MP150 acquisition system was connected to two EEG 100C amplifier units (one for each channel) to which the commutator was attached. The lead to the occipital cortex served as a reference for both frontal and auditory cortex screw electrodes. The acquisition hardware was set to high-pass (>0.5 Hz) and low-pass (<100 Hz) filters. Normal EEG output data were collected with gain maintained the same (10,000 X) between all recordings. Data were sampled at a rate of 2.5 kHz using Acqknowledge software and down sampled to 1024 Hz post hoc using Analyzer 2.1 (Brain Vision LLC). Sound delivery was synchronized with EEG recording using a TTL pulse to mark the onset of each sound in a train. Resting EEGs were recorded for five minutes (during this time no auditory stimuli were presented) followed by recordings in response to auditory stimulation. After all EEG experiments were completed, mice were perfused for histology or used for behavioral tasks and Western blot analysis.
Acoustic stimulation
Acoustic stimulation paradigms were similar as those previously used in Fmr1 KO mice (Lovelace et al. 2018; Lovelace et al. 2019), which is analogous to work in humans with FXS. Acoustic stimuli were generated using RPvdsEx software and RZ6 hardware (Tucker-Davis Technologies, FL) and presented through a free-field speaker (MF1 Multi-Field Magnetic Speaker; Tucker-Davis Technologies, FL) located 30 cm away directly above the cage. Sound pressure level (SPL) was modified using programmable attenuators in the RZ6 system. The speaker output was ~70 dB SPL at the floor of recording chamber with fluctuation of +/− 3 dB for frequencies between 5 and 35 kHz as measured with a ¼ in Bruel and Kjaer microphone.
A chirp-modulated signal (henceforth ‘chirp’) to induce synchronized oscillations in EEG recordings was used to quantify fidelity of responses to time varying stimuli. The chirp is a two-second broadband noise stimulus with amplitude modulated (100% modulation depth) by a sinusoid whose frequencies increase (Up-chirp) or decrease (Down-chirp) linearly in the 1–100 Hz range (Artieda et al. 2004; Perez-Alcazar et al. 2008; Purcell et al. 2004). The chirp facilitates a rapid measurement of transient oscillatory response (delta to gamma frequency range) to auditory stimuli of varying frequencies and can be used to compare oscillatory response in different groups in clinical and pre-clinical settings. Inter-trial phase coherence analysis (phase locking factor) can then be used to determine the ability of the neural generator to synchronize oscillations to the frequencies present in the stimulus (Tallon-Baudry et al. 1996). The chirp stimulus may be preferable over the traditional steady state stimulus in studies of children with neurodevelopmental disorders, as it can quickly and efficiently measure multiple modulation frequencies in a shorter period of time.
To avoid onset responses contaminating phase locking to the amplitude modulation of the chirp, the stimulus was ramped in sound level from 0 to 100% over 1 sec (rise time), which then smoothly transitioned into chirp modulation of the noise (see Figure 3C for example). Up and Down chirp trains were presented 300 times each (for a total of 600 trains). Both directions of modulation were tested to ensure any frequency-specific effects were not due to the frequency transition history within the stimulus. Up and Down trains were presented in an alternating sequence. The interval between each train was randomly varied between 1 and 1.5 s.
Figure 3. Fmr1 KO mice are deficient in phase locking to auditory “Up Chirp” stimuli.
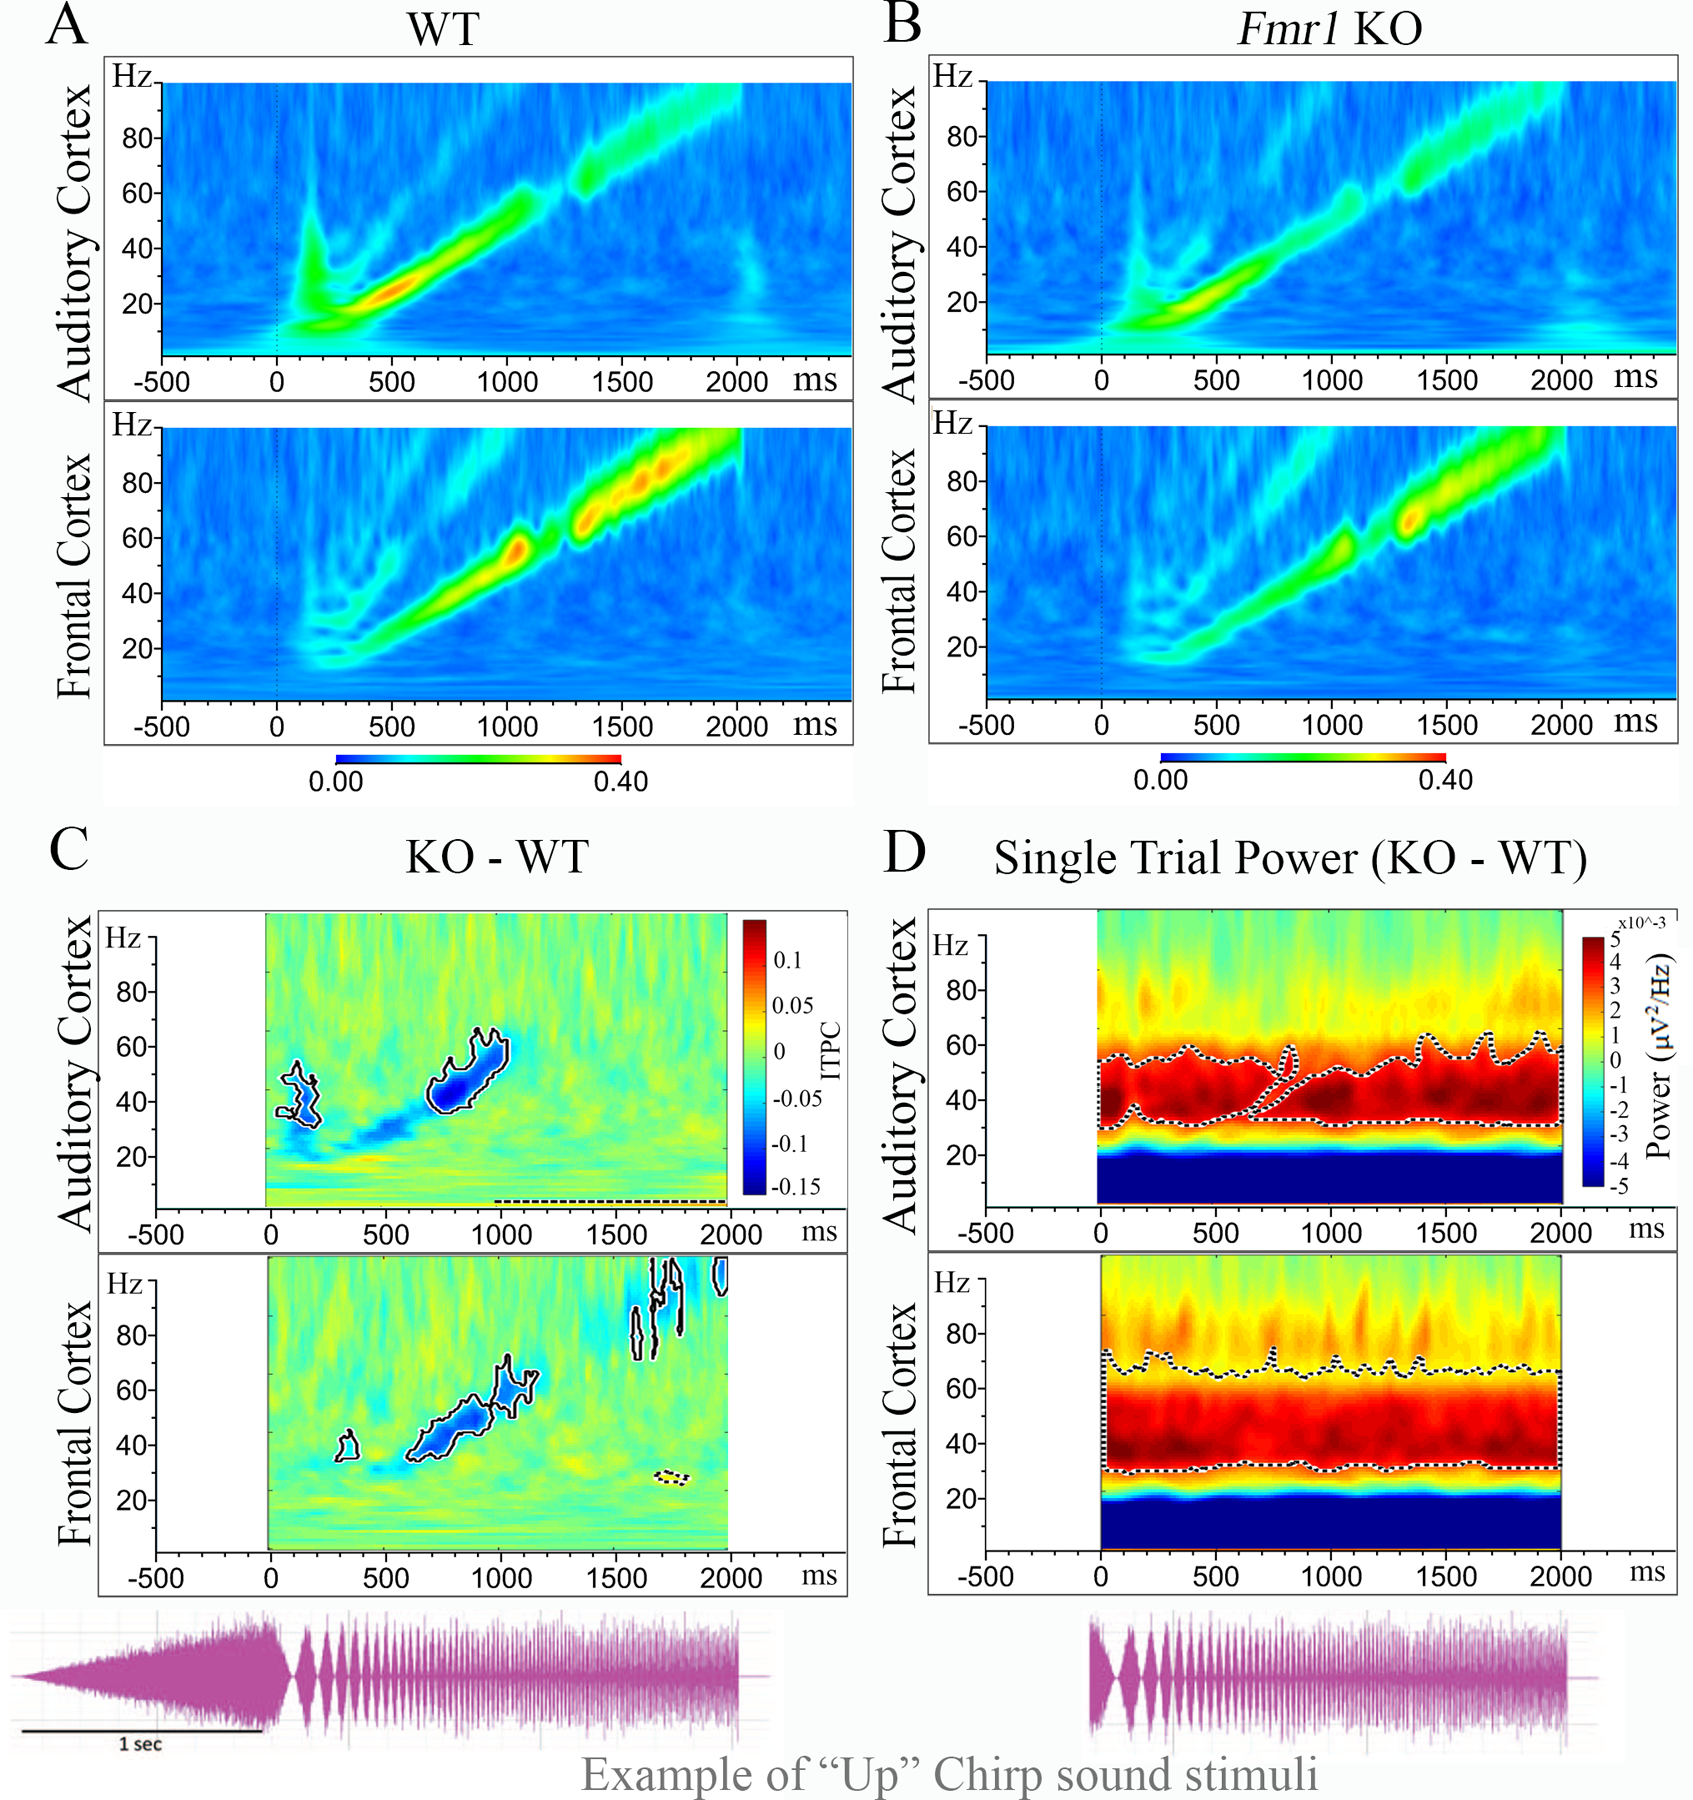
(A–B) Inter Trial Phase Coherence (ITPC: ability to synchronize oscillations to stimulus frequencies) grand average for WT (N=23) and Fmr1 KO (N=19) mice in the AC (top) and FC (bottom). EEG oscillations matched the frequency of the chirp and were seen as increased ITPC along a diagonal, from 0 to 2 s and 1–100Hz. (C) ITPC means for WT PRE were subtracted from Fmr1 KO PRE mice to show the difference between genotypes. Blue areas indicating KO < WT, green areas no difference, and yellow/red KO > WT. Significant clusters (p<0.025) are highlighted by bold-lined contours. (D) Graph shows difference in grand average single trial power (STP) or on-going ‘background’ power during auditory stimulation between WT PRE and Fmr1 KO mice in AC (top) and FC (bottom).
Data Analysis
All EEG data analysis was performed as described previously (Lovelace et al. 2019; Lovelace et al. 2018). Briefly, EEG data was extracted from Acqknowledge and converted to files compatible with Analyzer 2.1 software. All data were notched filtered at 60 Hz to remove residual line noise from recordings. Artifact rejection was performed using BrainVision Analyzer. Several criteria were used to search for artifacts including amplitude, gradient, max-min and low activity. Less than 30% of data were rejected due to artifacts from any single mouse. If more than 30% of the data was rejected, the animal was excluded from analysis (Resting baseline: WT PRE, N=1; Fmr1 KO PRE, N=1; vehicle-treated Fmr1 KO, N=2; vehicle-treated WT, N=2; SB-3CT-treated Fmr1 KO, N=1; Chirp: Fmr1 KO PRE, N=2, vehicle-treated WT, N=1; SB-3CT-treated WT,N=1; Fmr1 KO, N=2, SB-3CT-treated Fmr1 KO, N=1). Notably, no outlier test was performed; instead, animals were excluded based on the exclusion criterion described above or movement percentage.
Resting EEG analysis
Five minutes of EEG data (no auditory stimulus) were divided into 2-sec segments and Fast Fourier Transforms (FFT) were calculated on each segment using 0.5 Hz bins, using a Hanning window, with no overlap, and then average power (μV2/Hz) was calculated for each mouse from 1 to 100 Hz. Power was then further binned into standard frequency bands: We compared genotype mean differences on 6 bands per region: Delta (1–4 Hz), Theta (4–8 Hz), Alpha (8–13 Hz), Beta (13–30 Hz), Low Gamma (30–55 Hz), and High Gamma (65–100 Hz). The gamma band (30–100 Hz) was divided into low (30–60 Hz) versus high (>60 Hz) bands in gamma range because studies show the lower gamma frequency rhythm may be associated with activity of PV cells (Ray & Maunsell 2011; Balakrishnan & Pearce 2014; Dvorak & Fenton 2014), while the higher gamma frequencies may be related to spiking activity near the electrodes (Ray & Maunsell 2011; Buzsaki & Wang 2012). The spectral bands used are based on a number of previous studies on FXS in both mice (Radwan et al. 2016) and humans (Ethridge et al. 2017; Wang et al. 2017; Ethridge et al. 2016).
Responses to chirp trains were analyzed using Morlet wavelet analysis. Chirp trains were segmented into windows of 500ms before chirp onset to 500ms after the end of the chirp sound (total of 3 sec because each chirp was 2 s in duration). EEG traces were processed with Morlet wavelets from 1 to 100 Hz using complex number output (voltage density, μV/Hz) for Inter Trial Phase Coherence (ITPC) calculations, and power density (μV2/Hz) for non-phase locked single trial power (STP). Wavelets were run with a Morlet parameter of 10 as this gave the best frequency/power discrimination. This parameter was chosen since studies in humans found most robust difference around 40 Hz, where this parameter is centered (Ethridge et al. 2017). To measure phase synchronization at each frequency across trials, Inter Trial Phase Coherence (ITPC) was calculated. The equation used to calculate ITPC is:
where f is the frequency, t is the time point, and ĸ is the trial number. Thus, Fk (f,t) refers to the complex wavelet coefficient at a given frequency and time for the ĸth trial. There were no less than 225 trials (out of 300) for any given mouse after segments containing artifacts were rejected.
Statistical analysis and definition of movement states
All statistical analysis was performed as described previously (Lovelace et al. 2018; Lovelace et al. 2019). Statistical group comparisons of chirp responses (ITPC and STP) were quantified by wavelet analysis using MATLAB (MATLAB, RRID:SCR_001622). The analysis was conducted by binning time (2 s segments) into 256 parts and frequency into 100 parts, resulting in a 100 × 256 matrix. Non-parametric cluster analysis was used to determine contiguous regions in the matrix that were significantly different from a distribution of 2000 randomized Monte Carlo permutations based on previously published methods (Maris & Oostenveld 2007). Briefly, if the cluster size of the real genotype assignments (both positive and negative direction, resulting in a two-tailed alpha of p=0.025) were larger than 97.25% of the random group assignments, those clusters were considered significantly different between genotypes. This method avoids statistical assumptions about the data and corrects for multiple comparisons. In all cases, p<0.05 was considered significant for ANOVA and Student’s t-tests. Where t-tests were performed, r was calculated as an effect size. When interactions were found and multiple comparisons for ANOVA were made, data were analyzed on each factor for simple effects and corrected using Bonferroni adjustments. If assumptions of sphericity were violated for repeated measures ANOVA, the Greenhouse-Geiser correction was used.
As movement can alter cortical gain (Niell & Stryker 2010), and Fmr1 KO mice show hyperactivity, a piezoelectric transducer was placed under the EEG recording arena to detect when the mouse was moving. The term ‘resting’ is used to indicate EEGs recorded in these mice without any specific auditory stimuli. The term ‘still’ is used to describe resting EEG when the mouse was stationary. The term ‘moving’ is used to describe resting EEG when the mouse was moving based on a threshold criterion for the piezoelectric signal that was confirmed by analyzing the video recording (under IR light) that was taken throughout the EEG recording procedure. In all cases where genotype means are reported, SEM was used. The genotype differences in resting power were analyzed on 6 dependent variables using one-way Multivariate analysis of co-variance (MANCOVA) with one covariate (movement), Independent Variables (IV): Genotype (Fmr1 KO, WT), dependent variables (DV): 6 frequency bins (delta to high gamma). The proportion of time spent moving during the five-minute recording session was used as a covariate to isolate effects of genotype and control for the effect movement has on cortical gain. When multiple comparisons for MANCOVA were made, genotype comparisons were corrected using Bonferroni adjustments. The divisor for Bonferroni correction for multiple comparisons (for 6 frequency bands) on MANCOVA was set to 6, ɑ = 0.05/6 = 0.0083. Data are often expressed and plotted as ratio of control group values to gauge relative differences in various factors using the same scale. Statistical analysis was done using SPSS software package (SPSS, RRID:SCR_002865).
Treatment
The matrix metalloproteinase 2/9 inhibitor, SB-3CT, in saline containing 10% DMSO (Millipore, Cat. 444274), or vehicle (10% DMSO in saline) was administered intraperitoneally (i.p., 25 mg/kg) to WT and Fmr1 KO mice at P22–23 (for timeline see Figure 1A). For treatment, animals were assigned treatment based on simple randomization. To blind experimenter to treatment, animals were given a numerical identifier with no treatment identification that was used during EEG recording and PV/PNN analysis. A second group of mice that did not undergo EEG surgery or recording received a single treatment of SB-3CT (25 mg/kg) or vehicle injections at P27–28 and were subjected to behavioral tests at P28–29 (Figure 6A). To blind experimenter to treatments during behavior, tests were performed by two experimenters, one experimenter administered treatment and second experimenter was blinded to assigned treatment of each mouse. A third group that did not undergo EEG surgery or recording received a single treatment of SB-3CT (25 mg/kg) or vehicle injections at P21–22 (Figure 7A). To blind experimenter to treatments, one experimenter prepared drugs and assigned a numerical identifier to each treatment/animal and a second experimenter administered the treatment and was blinded to each assigned treatment. Initial number of animals used per group: EEG implant surgery (WT, N=35; Fmr1 KO, N=30), EEG recording (WT PRE, N=23; Fmr1 KO PRE, N=21; vehicle-treated WT, N=18; SB-3CT-treated WT, N=15; vehicle-treated Fmr1 KO, N=14; SB-3CT-treated Fmr1 KO, N=13;), PV/PNN analysis (N=6 per group; vehicle-treated WT, n=18; SB-3CT-treated WT, n=23; vehicle-treated Fmr1 KO, n=20; SB-3CT-treated Fmr1 KO, n=17), behavior (vehicle-treated Fmr1 KO, N=10; SB-3CT-treated Fmr1 KO, N=9; vehicle-treated WT, N=10; SB-3CT-treated WT, N=8), Western blot (vehicle-treated Fmr1 KO, N=4; SB-3CT-treated Fmr1 KO, N=4; vehicle-treated WT, N=4; SB-3CT-treated WT, N=4), DQ gelatin assay (vehicle-treated Fmr1 KO, N=5; SB-3CT-treated Fmr1 KO, N=5; vehicle-treated WT, N=3; SB-3CT-treated WT, N=3).
Dye-Quenched (DQ) Gelatin Assay and Analysis
The dye-quenched (DQ) gelatinase activity assay is a hydrolytic activity assay used to measure MMP-2/9 activity. The DQ gelatin assay measures MMP-2/9 activity by measuring the fluorescent intensity of a FITC-quenched gelatin peptide that fluoresces following cleavage by MMP-2 or MMP-9 to measure MMP-2/MMP-9 proteolytic activity (Vandooren et al. 2011). To confirm that i.p. administration of SB-3CT results in the inhibition of MMP-9 activity in the brain, one hour after treatment with SB-3CT inhibitor or vehicle P22 WT mice (N=3 per group) were euthanized with isoflurane and the auditory cortex and surrounding temporal cortex (average weight of tissue ~20 mg) was dissected based on coordinates (Paxinos and Franklin 2004) and previous electrophysiological and dye-placement studies (Martin del Campo et al. 2012). For an example of auditory cortex dissection, please see Supplemental Figure 2–1. The one-hour time point was chosen based on the ~45 min half-life of SB-3CT (Gooyit et al. 2012). The AC was resuspended in lysis buffer (50mM Tris-HCL (pH = 7.4) buffer containing 150mM NaCl, 5mM EDTA,, 0.05% Triton X-100, 1mM PMSF) containing protease inhibitor cocktail (Sigma-Aldrich, cat. #P8340) and phosphatase inhibitor cocktail (Sigma-Aldrich, cat. #P0044). Lysates were measured for total protein concentrations using the protocol for the BCA colorimetric protein assay (Pierce, cat. #23–235).
Lysates were diluted in reaction buffer and mixed with DQ-gelatin stock, a fluorescence-labeled gelatin substrate (Molecular Probes, E12055) as described previously (Lovelace et al. 2019). Lysates were coded and processed by experimenter blinded to codes. Fluorescence intensity was analyzed using 495nm excitation wavelength and 515nm emission wavelength in a fluorescence microplate reader equipped with standard fluorescein filters (SpectraMax M2, Molecular Devices). The signal from the samples was measured every 20 min during a 3h incubation period. For each time point, background fluorescence intensity was corrected by subtracting the values derived from the blank, which consisted of only reaction buffer and DQ gelatin. A standard curve to assess gelatinase activity was generated using recombinant mouse MMP-9 activity (rmMMP-9, specific activity approx. 1,500 pmol/min/μg, R&D Systems, Cat. # 909-MM-010). A linear regression of rmMMP-9 activity (standard curve) and relative gelatinase activity based on the average fluorescence intensity of three replicates was used to assess gelatinase proteolytic activity in the lysates.
Immunohistochemistry
For histology, mice were euthanized with isoflurane and perfused transcardially with ice-cold phosphate-buffered saline (0.1 M PBS, pH 7.4) and 4% paraformaldehyde (PFA). Brains were sectioned in the coronal plane on a Vibratome (Leica S1000) at 100 μm and sections were stored in PBS before staining. Prior to immunostaining, free-floating sections were post-fixed for an additional 2 h in 4% PFA and then washed in 0.1M PBS. Sections were then quenched with 50mM ammonium chloride for 15 min, permeabilized with 0.1% Triton X-100 for 10 min and blocked for 1 h at room temperature in 5% donkey serum (DS; Sigma-Aldrich Cat# D9663, RRID:AB_2810235), and 1% bovine serum albumin (BSA; Fisher Scientific, Catalog #9048468) in 0.1M PBS. Sections were incubated overnight in primary antibodies and a 1:500 dilution of fluorescein-tagged Wisteria floribunda Lectin (4μg/mL WFA, Vector Laboratories Cat# FL-1351, RRID: AB_2336875) in a 1% DS, 0.5% BSA, and 0.1% Tween-20 solution. Primary antibodies included a 1:1000 dilution of mouse anti-PV antibody (Sigma-Aldrich Cat#P3088, RRID:AB_477329) to label PV interneurons. Sections were incubated in a 1:500 dilution of donkey anti-mouse Alexa Fluor 594 for 1 h. After immunostaining sections were mounted on slides and cover slipped with Vectashield containing DAPI (Vector Laboratories Cat#H-1200, RRID:AB_2336790) and Cytoseal (ThermoScientific, Catalog #8310–16).
Image Quantification
Slices were imaged by confocal microscopy (model LSM 510, Carl Zeiss MicroImagining or Leica SP5) using a series of 10 high-resolution optical sections (1024 × 1024-pixel format) that were captured for each slice at 10X magnification at 1μm step intervals (z-stack). All images were acquired under identical conditions. Each z-stack was collapsed into a single image by projection (ImageJ), converted to a TIFF file and encoded for blind analysis using ImageJ (NIH software, ImageJ, RRID:SCR_003070). The AC was identified using hippocampal landmarks (Supplemental Figure 2–1). This method has been previously validated using tonotopic mapping and dye injection (Martin del Campo et al. 2012) and comparison with the Paxinos mouse atlas and other publications on the mouse AC (Anderson et al. 2009). Nevertheless, the precise boundary between primary AC (A1) and anterior auditory field (AAF) of the mouse AC cannot be clearly established. Both these fields are part of the lemniscal auditory system and comprise the core AC. Therefore, we use the AC to indicate both A1 and AAF. ImageJ was used to identify and count PNN-positive, PV-positive cells and PV/PNN co-localization (N=6 per group; vehicle-treated WT, n=18; SB-3CT-treated WT, n=23; vehicle-treated Fmr1 KO, n=20; SB-3CT-treated Fmr1 KO, n=17) . Cortical layers were identified (Anderson et al. 2009) and used for layer-specific counts (Layers 1–5/6 of the AC). A selection tool was used to measure and specify layers of the AC and the point tool was used to label PNNs, PV cells and added to the ROI manager.
Behavior
Open-field test
Behavioral tests were performed as described previously (Sidhu et al. 2014; Lovelace et al. 2019). Briefly, anxiety-like behavior was tested in P27–28 mice (N=6–7 per group) by quantifying their tendency to travel to the center of an open field and time spent in thigmotaxis (Yan et al. 2005; Yan et al. 2004). A 43cm x 43cm open-field arena with 43-cm-high walls was constructed from clear acrylic sheets. The open field arena was placed in a brightly lit room, and one mouse at a time was placed in a corner of the open field and allowed to explore for 10 min while being recorded with digital video from above. The floor was cleaned with 3% acetic acid, 70% ethanol and water between tests to eliminate odor trails. The mice were tested between the hours of 8:00 AM and 1:00 PM., and this test was always performed prior to the elevated plus maze by the same experimenter. The arena was subdivided into a 4 × 4 grid of squares with the middle of the grid defined as the center. A line 4 cm from each wall was added to measure thigmotaxis. Locomotor activity was scored by the analysis of total line crosses and speed as described previously with some modifications (Yan et al. 2005) using TopScan Lite Software (Clever Sys., Inc., Reston, VA 201090, USA). A tendency to travel to the center (total number of entries into large and small center squares) and the time in thigmotaxis were used as an indicator of anxiety-like behaviors using TopScan Lite software (CleverSys Inc). The analysis was performed in 5 min intervals for the total 10 min exploration duration. Assessments of the digital recordings were performed blind to the condition. Statistical analysis was performed with unpaired t-test using GraphPad Prism 6 software. Data represent mean ± standard error of the mean (SEM).
Elevated plus maze
The elevated plus maze consisted of four arms in a plus configuration. Two opposing arms had 15-cm tall walls (closed arms), and two arms were without walls (open arms). The entire maze sat on a stand 1 m above the floor. Each arm measured 30 cm long and 10 cm wide. Mice were allowed to explore the maze for 10 min while being recorded by digital video from above. The maze was wiped with 3% acetic acid, 70% ethanol and water between each test to eliminate odor trails. This test was always done following the open-field test. TopScan Lite software was used to measure the percent of time spent in open arms and speed. The time spent in open arm was used to evaluate anxiety-like behavior. The velocity and total arm entries were measured to evaluate overall locomotor activity. The analysis was performed in 5 min intervals for the total 10 min exploration duration. Assessments of the digital recordings were done blind to the condition using TopScan Lite software. Statistical analysis was performed with unpaired t-test using GraphPad Prism 6 software. Data represent mean ± standard error of the mean (SEM).
Western Blot Analysis
Western blot analysis was performed as described previously (Lovelace et al. 2019). The AC was removed from each mouse (N=3–4 mice per group), cooled in PBS, and homogenized in ice-cold lysis buffer (50mM Tris-HCl, pH 7.4, 150mM NaCl, 5mM EDTA, 0.05% Triton X-100, and 1mM PMSF) containing protease inhibitor cocktail (Sigma-Aldrich, cat. # P8340) and phosphatase inhibitor cocktail (Sigma-Aldrich, cat. #P0044). The samples were rotated at 4°C for at least 1h to allow for complete cell lysis and then cleared by centrifugation at 13,200 rpm for 15min at 4°C. Supernatants were isolated and boiled in reducing sample buffer (Sigma-Aldrich, Laemmli 2× concentrate, S3401), and separated on 8–16% Tris-Glycine SDS-PAGE precast gels (EC6045BOX, Life Technologies). Proteins were transferred onto Protran BA 85 Nitrocellulose membrane (GE Healthcare) and blocked for 1h at room temperature in 5% skim milk (catalog #170–6404, Bio-Rad). Primary antibody incubations were performed overnight at 4°C with antibodies diluted in TBS/0.1% Tween-20/5% BSA. The following primary antibodies were used: rabbit anti-Akt (Cell Signaling Technology Cat# 9272, RRID:AB_329827); rabbit anti-phospho-Akt (Ser473; Cell Signaling Technology Cat# 9271, RRID: AB_329825); mouse anti-PV (Millipore, Cat#MAB1572, RRID:AB_2174013), mouse anti-total TrkB (1:2000; BD Biosciences Cat# 610101, RRID:AB_397507), rabbit anti-phospho-TrkB (Tyr515) (1:1000, Bioworld, catalog #AP0236), and rabbit anti-βactin at 1:2000 (Abcam Cat #ab8227, RRID:AB_2305186). All primary antibodies were from Cell Signaling Technology and used at a dilution of 1:1000, unless stated otherwise.
Blots were washed 3 × 10 min with TBS/0.1% Tween-20 and incubated with the appropriate HRP-conjugated secondary antibodies for 1h at room temperature in a TBS/0.1% Tween-20/5% BSA solution. The secondary antibodies used were HRP-conjugated donkey anti-mouse IgG (Jackson ImmunoResearch Labs Cat#715–035-150, RRID:AB_2340770) or HRP-conjugated goat anti-rabbit IgG (Jackson ImmunoResearch Labs Cat# 111–035-003, RRID:AB_2313567). After secondary antibody incubations, blots were washed 3 × 10min in TBS/0.1% Tween-20, incubated in ECL 2 Western Blotting Substrate (Thermo Scientific, catalog #80196) and a signal was collected with CL-XPosure film (Thermo Scientific, catalog #34090). For re-probing, membrane blots were washed in stripping buffer (2% SDS, 100mM β-mercaptoethanol, 50mM Tris-HCl, pH 6.8) for 30min at 55°C, then rinsed repeatedly with TBS/0.1% Tween-20, finally blocked with 5% skim milk, and then re-probed. Developed films were then scanned, and band density was analyzed by measuring band and background intensity using Adobe Photoshop CS5.1 software (Adobe Photoshop, RRID:SCR_014199). Four-five samples per group of vehicle vs. SB-3CT WT vs. Fmr1 KO were run per blot. Statistical analysis was performed with unpaired t-test using GraphPad Prism 6 software (GraphPad Prism, RRID:SCR_002798). Data represent mean ± standard error of the mean (SEM).
Statistical Analysis
All statistical analyses for cell density quantification, Western blot, behavior and DQ gelatin assay were done using Prism (GraphPad Software, San Diego, USA). For cell density quantification, theta/gamma ratio, and behavior two-way ANOVA was used to compare Genotype (WT x KO) vs. Treatment (SB-3CT x Vehicle) followed by post hoc pair-wise comparisons with the Bonferroni’s or Tukey’s correction, unless otherwise specified. For Western blot and the DQ gelatin assay, the Student’s t-test was used to assess the effects of treatment in KO or WT mice. For all analyses, “N” = number of animals and “n” = number of coronal sections. No power analysis was performed to calculate sample size for each experiment. The number of animals for each study was determined using previously published studies using similar techniques [EEG (Lovelace et al. 2018; Wen et al. 2019), PV/PNN analysis (Lovelace et al. 2019; Wen et al. 2018), behavior and DQ gelatin (Lovelace et al. 2019)].
Results
In the current study, we examined whether acute pharmacological inhibition of MMP-9 activity during a developmental critical period reduces correlates of auditory hypersensitivity in developing Fmr1 KO mice. First, we evaluated changes in spectral power and synchronization to auditory stimuli using EEG, as well as changes in PV/PNN density. Next, we assessed anxiety-like behaviors and hyperactivity along with changes in key molecular targets associated with FXS, including PV levels and phosphorylation of TrkB and Akt.
Developing Fmr1 KO mice exhibit increased resting state gamma EEG power and abnormal EEG power coupling
Previously, we have shown that adult Fmr1 KO mice exhibit increased resting state gamma power (Lovelace et al. 2018), a phenotype that is similar to that observed in humans with FXS (Ethridge et al. 2017; Wang et al. 2017). Here, we assessed whether developing Fmr1 KO mice on C57BL/6 background [for FVB background, see (Wen et al. 2019)], also exhibit increased resting state gamma power during the P21–28 period when maturation of various neuronal circuits occurs. To do this, mice were implanted with 2-channel EEG electrodes placed in the auditory (AC) and frontal cortex (FC) at P18 (Figure 1A and 1B), allowed to recover for 4–5 days, and baseline EEG activity was recorded at P22 prior to treatment (PRE). Resting EEG data (in the absence of auditory stimulation) were collected for five minutes and were divided into 2-second segments for spectral analysis. Resting EEG raw power (μV2/Hz) was calculated in the AC and FC of WT and Fmr1 KO mice by analyzing all frequency bands during the entire five-minute resting period. Examples of one-second segments of EEG traces for individual WT and Fmr1 KO mice are shown in Figure 1C and 1D, respectively (AC: top; FC: bottom). The group average power spectral densities for the AC and the FC are shown in histogram (Figure 1E) and bar graph format (Figure 1F), respectively. To normalize data for each region and to determine relative changes in power across frequency bands, power values were expressed as a ratio of Fmr1 KO (N=20) to WT (N=22) means (for non-normalized data see Supplemental Figure 1–1). A value of 1 indicates no mean difference in power between WT and Fmr1 KO, while values above 1 indicate Fmr1 KO > WT, and below indicate Fmr1 KO < WT mice.
Statistical analysis was performed using a one-way MANCOVA with the percentage of time spent moving as a covariate. We compared genotype mean differences on six bands per region: Delta (1–4 Hz), Theta (4–8 Hz), Alpha (8–13 Hz), Beta (13–30 Hz), Low Gamma (30–55 Hz), and High Gamma (65–100 Hz). Frequencies from 55–65 Hz were excluded in all analysis, as a 60 Hz notch filter was utilized to eliminate line noise. We confirmed assumptions of equality of covariance using Levene’s test of equality of error variance and no differences between genotypes were observed in error variance (all p>0.05). Since assumptions were not violated, we report an effect of genotype (AC: Pillai’s Trace =2.465, p=0.04; FC: Pillai’s Trace = 2.587, p=0.036) across all six of the combined frequency variables. The low gamma band was the only frequency band significantly different between genotypes in the AC and FC (Figure 1F; AC: low gamma, F (1,27) =10, p=0.003, ɳ2=0.204, FC: low gamma, F (1,27) =9.012, p=0.005, ɳ2=0.188; WT N=22, Fmr1 KO N=20; for all frequency averages see Supplemental Table 1). These results indicate that Fmr1 KO mice exhibit increased resting state low gamma power (30–55 Hz) early in development at P22–23.
Human EEG studies also report power abnormalities in delta, theta, alpha frequencies and impaired coupling between low and high frequency oscillations in individuals with FXS and ASD (Wang et al. 2013; Sinclair et al. 2017). To determine if there are abnormalities in power coupling in early development, a Pearson’s correlation was done during the resting baseline period to assess the relationship between power across different frequencies and/or regions, using the same approach that was used in a study for human FXS (Wang et al. 2013). Results show a negative correlation in power coupling of the AC Theta/Low Gamma and AC Alpha/Low Gamma in WT mice (Figure 1G). These correlations were significantly reduced in Fmr1 KO mice (T1G1: p=0.02; A1G1: p=0.008). Results also show a negative correlation in across region power coupling of the AC Theta/FC Low Gamma and AC Alpha/FC Low Gamma in WT mice (Figure 1I), and FC Theta/AC Low Gamma and FC Alpha/AC Low Gamma (Figure 1J). These correlations were also significantly reduced in Fmr1 KO mice (T1G2: p=0.03; A1G2: p= 0.04; T2G1: p=0.04; A2G1: p=0.03).
Overall, these findings indicate that abnormalities in resting gamma power and EEG power coupling, in particular changes in theta/low gamma and alpha/low gamma power coupling in the AC and cross regional impairments are present in developing Fmr1 KO mice as early as P22–23.
Fmr1 KO mice treated with MMP-9 inhibitor show no effect on resting state EEG gamma power and EEG power coupling
Next, both Fmr1 KO and WT mice received a single i.p. injection of the MMP-2/9 inhibitor, SB-3CT (25mg/kg), or vehicle immediately following EEG recording to assess the efficacy of acute MMP-9 inhibition to normalize resting EEG oscillation pattern (Figure 1A). One day after treatment, resting EEG baseline data was again collected for 5 min and was divided into 2-second segments for spectral analysis. The percentage of time that the mice spent moving during the recording period was not different between genotypes (Supplemental Figure 1–2) or treatment groups (Supplemental Figure 2–7). Figure 2 shows the average spectral power as a ratio of the corresponding control group in histogram (Figure 2A–C) and bar graph format (Figure 2D–F) for each group (AC: top; FC: bottom; for non-normalized data see Supplemental Figure 2–2). To determine resting EEG in vehicle groups, vehicle-treated Fmr1 KO mice were compared to vehicle-treated WT mice. Although resting state low (LG) and high gamma (HG) power was trending higher in the AC of vehicle-treated Fmr1 KO (N=12) compared to vehicle-treated WT (N=16) mice, this was not statistically significant possibly due to large variability in vehicle-injected Fmr1 KO mice (Figure 2D; also see Supplemental Figure 2–4). Although SB-3CT-treated Fmr1 KO (N=12) mice exhibited normal low and high gamma in the AC and FC that was comparable to SB-3CT-treated WT (N=15) mice (Figure 2E), comparison of SB-3CT-treated Fmr1 KO (N=12) mice to vehicle-treated Fmr1 KO (N=12) mice showed a trending reduction in low and high gamma power, but this was not statistically significant (Figure 2F; for summary of all frequency averages see Supplemental Table 2). Vehicle-treated WT mice (N=16) and SB-3CT-treated WT mice (N=15; for non-normalized data see Supplemental Figure 2–3) did not show any significant changes in spectral frequencies compared to WT mice before treatment (PRE) in AC or FC [Supplemental Figure 2–5A and 2–5D (Vehicle-WT) and Supplemental Figure 2–5B and 2–5E (SB-3CT-WT)].
Figure 2. Acute inhibition of MMP-9 activity ameliorates EEG oscillation deficits in Fmr1 KO mice.
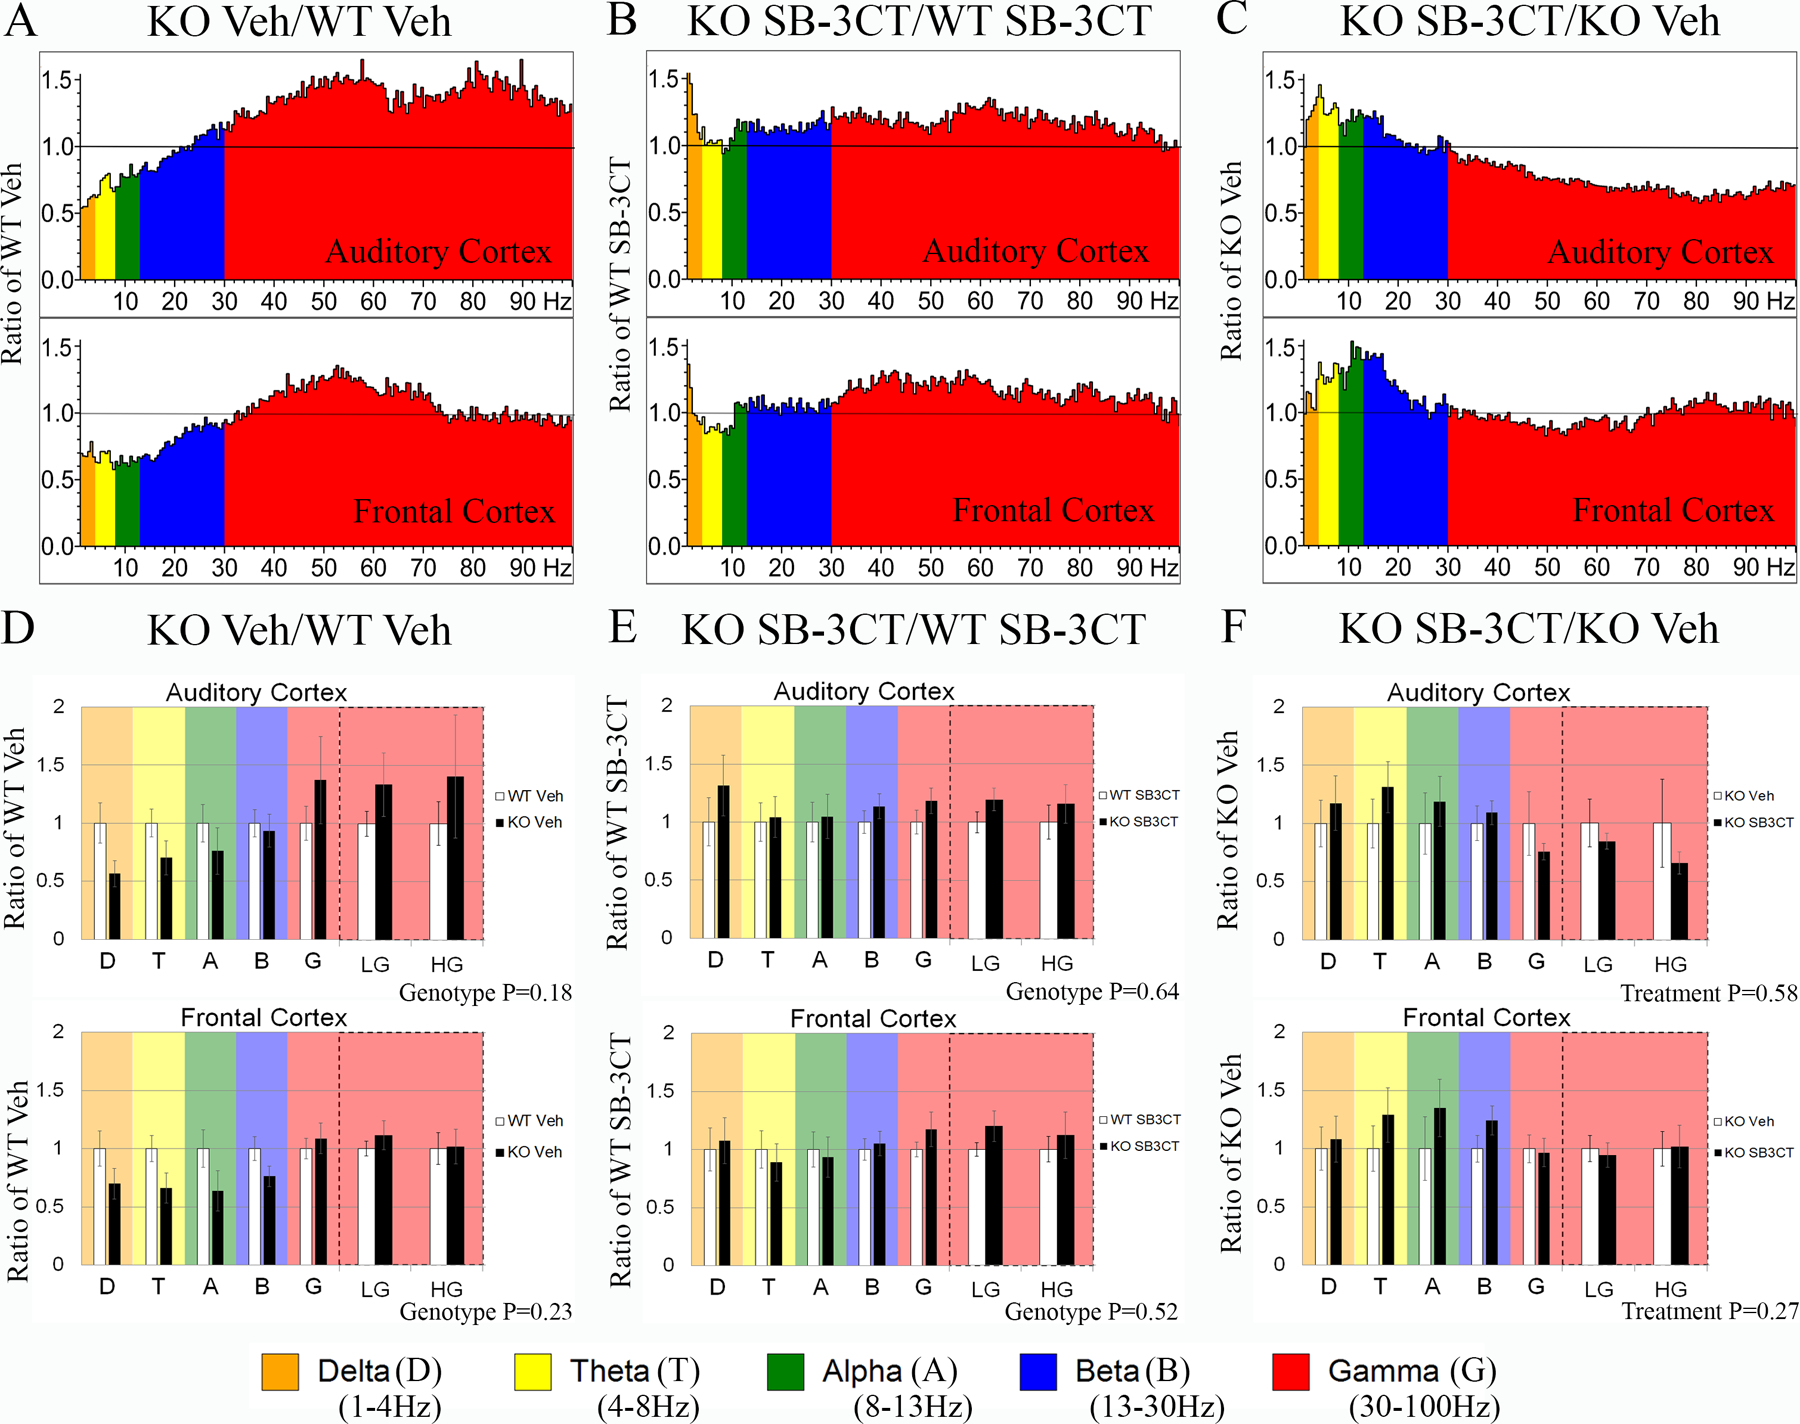
Five minutes of resting EEG activity was recorded from WT and Fmr1 KO mice post treatment at P23–24 (from treatment groups, N=2 from vehicle-treated WT and Fmr1 KO groups respectively, and N=1 from the SB-3CT-treated Fmr1 KO group were excluded from resting baseline EEG analysis). FFT calculated spectral power (μV2/Hz) for each group is shown as a ratio of a corresponding control group. (A, D) Average power in the AC (top) and FC (bottom) of vehicle-treated Fmr1 KO (N=14, excluded N=2) compared to vehicle-treated WT (N=18, excluded N=2). (B, E) Average power in the AC and FC of SB-3CT-treated Fmr1 KO (N=13, excluded N=1) compared to SB-3CT-treated WT (N=15, no excluded animals). (C, F) Average power of SB-3CT-treated Fmr1 KO compared to vehicle-treated Fmr1 KO. All graphs represent average values and the error bars indicate SEM. Delta (D), Theta (T), Alpha, Beta (B), Low Gamma (LG), and High Gamma (HG).
To determine if EEG power coupling abnormalities were ameliorated following treatment with SB-3CT, a Pearson’s correlation was done during the resting baseline period to assess the relationship between power across different frequencies and/or regions. Results show that treatment with SB-3CT did not alter the EEG power coupling profiles in WT or Fmr1 KO mice (Supplemental Figure 2–6).
Together, these results indicate no significant effects of treatment in Fmr1 KO mice when resting EEG power or EEG power coupling was analyzed for individual frequencies between vehicle- and SB3CT-treated groups.
Phase Locking to Auditory “Up Chirp” stimuli is impaired in developing Fmr1 KO mice
To assess whether P22–23 Fmr1 KO mice also exhibit deficits in the consistency of phase locking to time varying stimuli as seen in adult Fmr1 KO mice (Lovelace et al. 2018), and humans with FXS (Ethridge et al. 2017), we recorded responses to chirp stimuli. We tested both up and down chirps to ensure that the differences are specific to modulation frequencies and are not affected by the direction of frequency change in the sound (Lovelace et al. 2019). Following EEG resting state baseline recording, repeated chirp stimuli (300 trials for up, 300 trials for down) was delivered and electrocortical activity was recorded. Inter trial phase coherence (ITPC) was calculated across trials in the time x frequency domain using Morlet Wavelet analysis (Lovelace et al. 2018). After grand average ITPC was calculated for each group, we found EEG oscillations that matched the frequency of the chirp and were seen as increased ITPC along a diagonal, from 0 to 2 s and 1–100Hz. The means for WT PRE (Figure 3A; only ‘up chirp’ data are shown) were subtracted from Fmr1 KO PRE mice (Figure 3B) to show the difference between Fmr1 KO and WT (Figure 3C) in the AC (top) and FC (bottom). For statistical analysis, clusters of p-values were calculated, and significant differences (p<0.025) were overlaid on the chirp response to demonstrate quantitative differences between each genotype after correction for multiple comparisons (Lovelace et al. 2019). We observed a statistical difference between genotypes in one main cluster, which spans the low gamma band ITPC in both the AC (35–55 Hz) and FC (35–65 Hz; significant clusters are highlighted by bold-lined contours in Figure 3C. In the FC, there was also a statistical difference between genotypes in the high gamma band in the FC (80–100 Hz). Similar patterns of statistics of ITPC were observed for both up and down chirps (down chirp data not shown).
To examine whether P22–23 Fmr1 KO mice also exhibit an increase in background gamma power in both the AC and FC during the chirp presentation, similar to adult Fmr1 KO mice (Lovelace et al. 2018), we assessed non-phase locked single trial power (STP) during chirp stimulation in Fmr1 KO mice compared to WT control mice. Using the same statistical cluster analysis as for the chirp ITPC, results indicate that P22–23 Fmr1 KO mice exhibit a significant increase in background gamma power in the AC (~30–55 Hz) and FC (~30–70 Hz) compared to WT control mice (Figure 3D).
Together, these data show that developing Fmr1 KO mice exhibit low and high gamma synchronization deficits and increased background gamma power in both the AC and FC in a manner similar to adult Fmr1 KO mice and humans with FXS.
Acute MMP-9 inhibition improves phase-locking to time varying auditory stimuli in Fmr1 KO mice
To test whether acute treatment of SB-3CT would ameliorate the ITPC deficit to the auditory chirp stimuli, both up and down chirps were presented during EEG recording one day after treatment. Figure 4A and 4B show grand average ITPC values for vehicle-treated and SB-3CT-treated Fmr1 KO, respectively. The mean for vehicle-treated Fmr1 KO mice was subtracted from vehicle-treated WT mice (Figure 4C) to show the difference between ITPC values in Fmr1 KO and WT mice in both the AC and FC. Similarly, the mean for SB-3CT-treated Fmr1 KO mice was subtracted from the mean of vehicle-treated Fmr1 KO mice (Figure 4D). For statistical analysis, clusters of p-values were calculated, and these differences were overlaid on the chirp response to demonstrate quantitative differences between each genotype after correction for multiple comparisons. Monte Carlo statistical method on cluster analysis revealed a significant reduction in average ITPC values between vehicle-treated Fmr1 KO (N=12) mice and vehicle-treated WT (N=17) mice in low gamma band range (~40–50 Hz) in the AC (Figure 4C: top), consistent with the reduction observed in un-treated mice (Figure 3D). Statistical analysis of average ITPC values shows a significant enhancement in the same low gamma band range (~40–50 Hz) ITPC in the AC of SB-3CT-treated Fmr1 KO mice (N=12) to vehicle-treated Fmr1 KO (N=12) mice (Figure 4D: top). However, a significant decrease in ~30–40 Hz gamma band range ITPC band in both AC and FC was observed (time x frequency bands that are significantly different between groups are highlighted in bolded black lines). Grand average ITPC values were also calculated for vehicle-treated (N=17) and SB-3CT-treated WT (N=14) mice (Supplemental Figure 4–1A and 4–1B, respectively). No significant differences were detected in AC or FC for average ITPC values between vehicle-treated WT (N=17) mice and WT PRE (N=23) mice in the low and high gamma ITPC band except for a small decrease in the FC at ~25–35 Hz (Supplemental Figure 4–1C), suggesting the effects of injection on the ~25–35 Hz gamma band range. SB-3CT-treated WT (N=14) mice exhibited a significant increase in high gamma band ITPC in the AC, but not FC, specifically in 70–85 Hz ITPC band compared to WT PRE (Supplemental Figure 4–1D). Similar patterns and statistics of ITPC were observed for both up and down chirps. These results indicate that an acute treatment of the MMP-9 inhibitor, SB-3CT, improves fidelity of temporal responses to auditory stimuli by specifically increasing low gamma band (40–50 Hz) ITPC in developing Fmr1 KO mouse cortex.
Figure 4. Acute SB-3CT treatment improves Inter Trial Phase Coherence (ITPC) to auditory “Up Chirp” stimuli in Fmr1 KO mice.
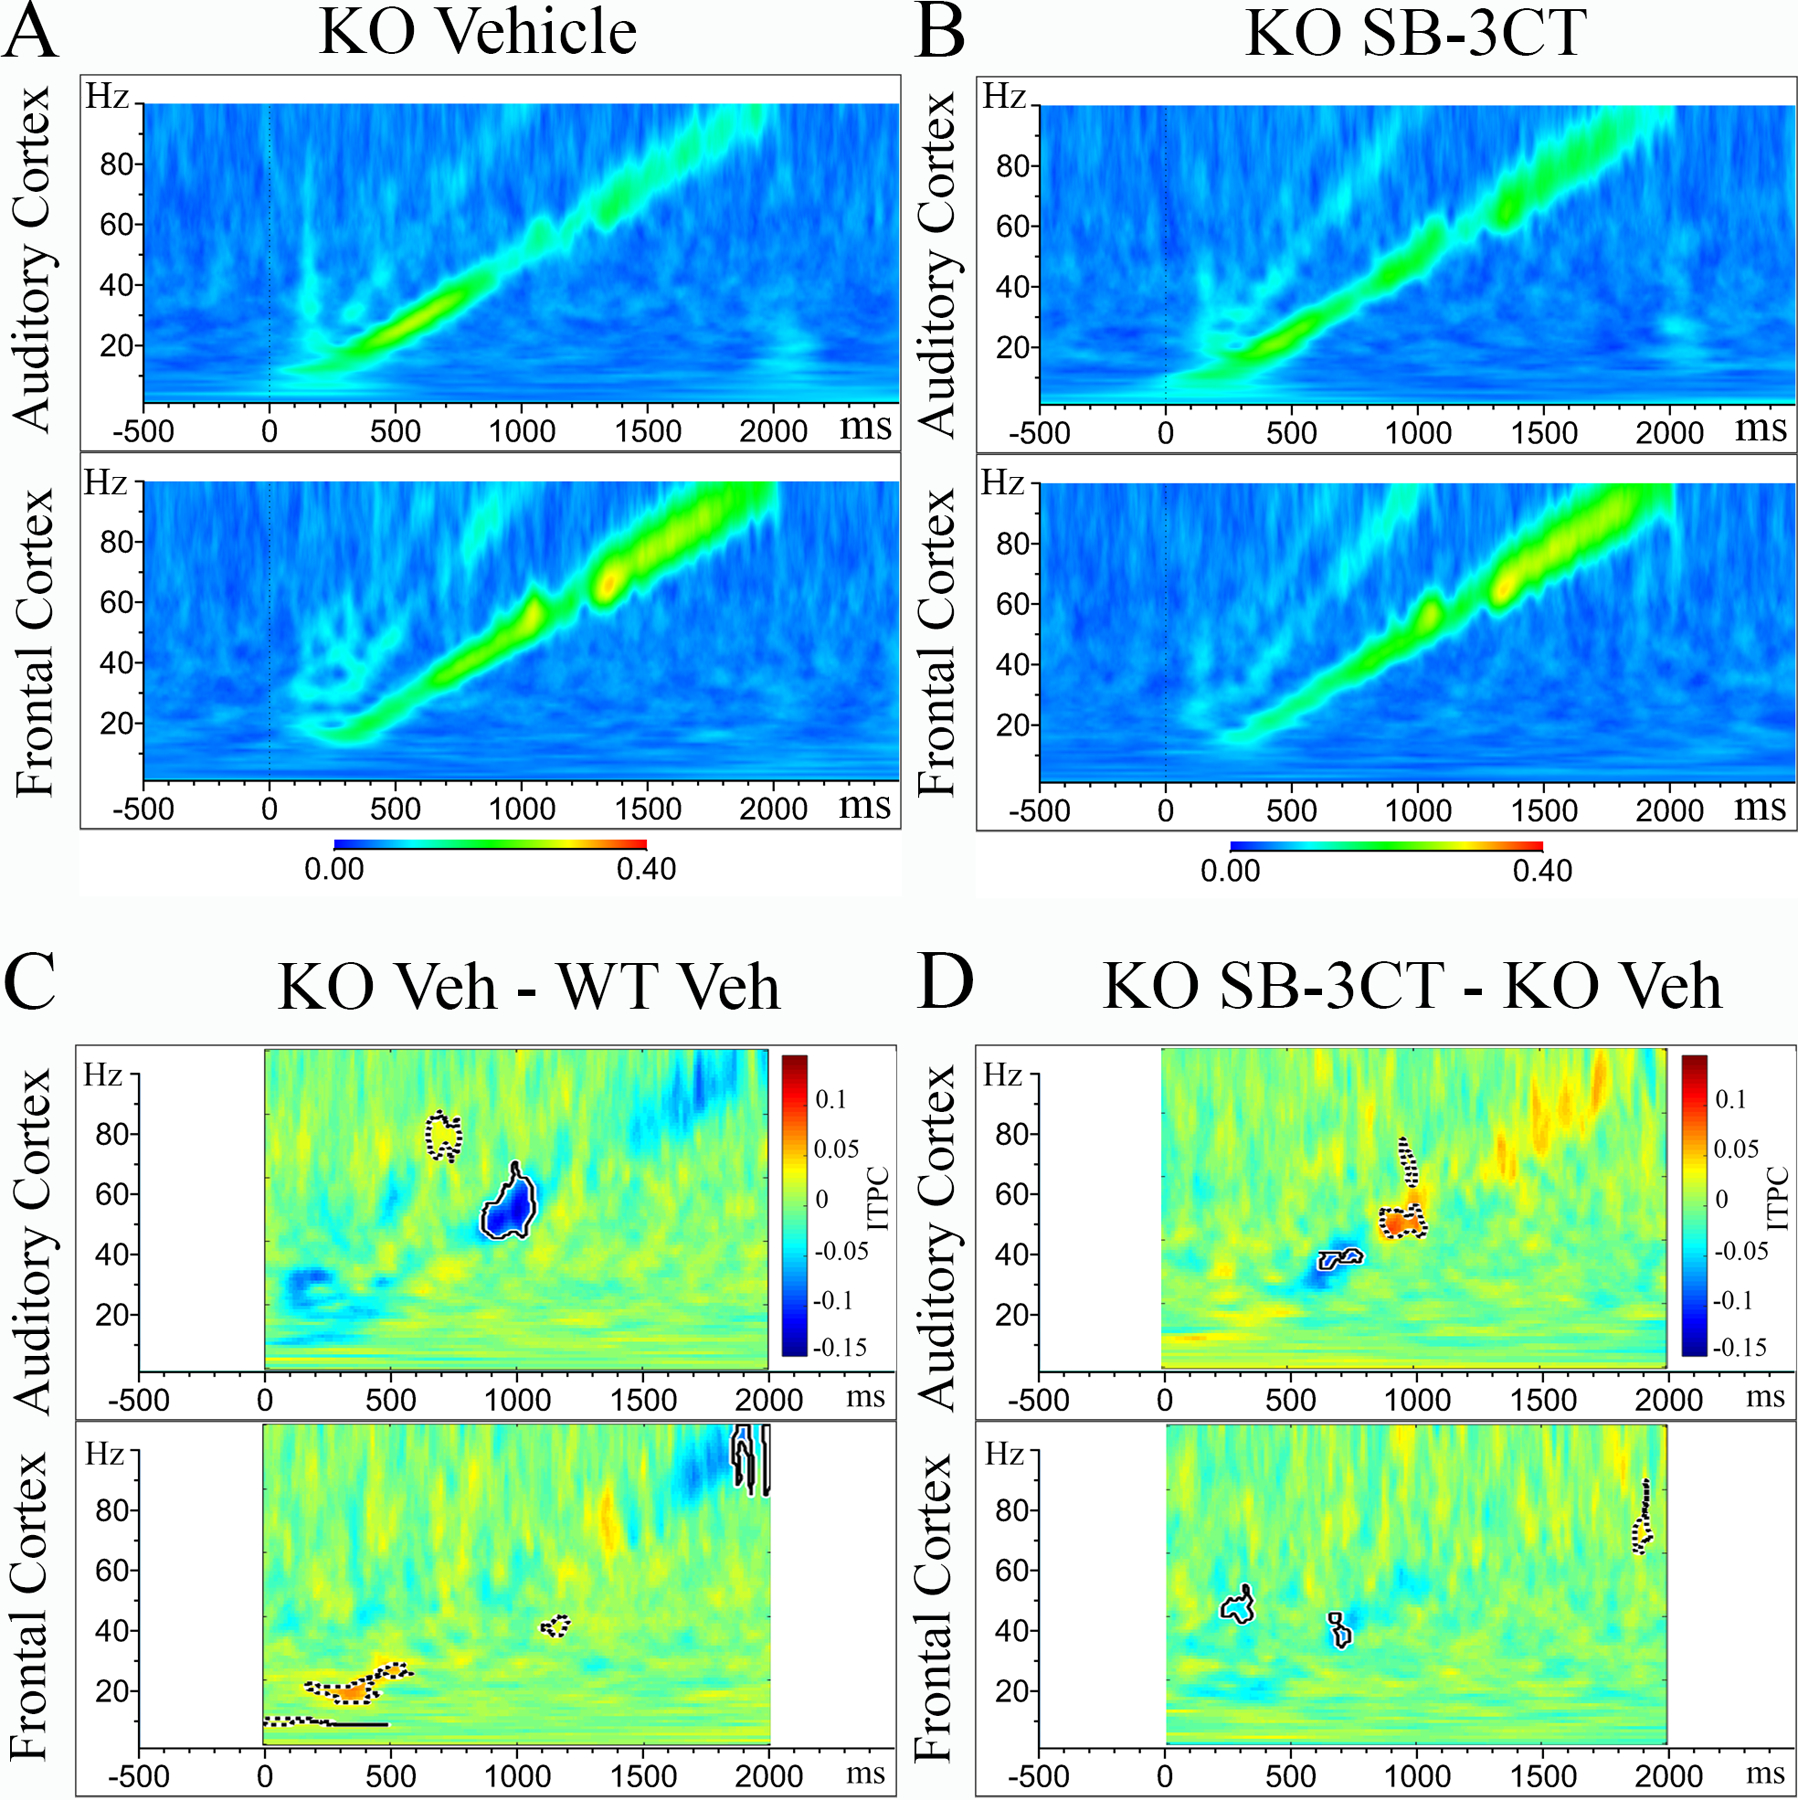
(A, B) Grand average ITPC in AC and FC of vehicle-treated Fmr1 KO (A, N=12) and SB-3CT-treated Fmr1 KO (B, N=12). Warmer colors, yellow/red, represent high ITPC values, while cooler colors, blue/green, represent low ITPC values. Significant clusters (p<0.025) are highlighted by bold-lined contours. (C) Graph shows the difference in ITPC values between vehicle-treated Fmr1 KO (N=12) and vehicle-treated WT (N=17). (D) Graph shows the difference in ITPC values between SB-3CT-treated Fmr1 KO (N=12) and vehicle-treated Fmr1 KO (N=12).
Acute inhibition of MMP-9 enhances PNN formation in the developing auditory cortex of Fmr1 KO mice
Previously, we showed evidence for delayed development of PV interneurons and PNN formation around PV interneurons in layers 2–4 of the developing AC of Fmr1 KO mice (Wen et al. 2018). Here we examined whether acute pharmacological inhibition of MMP-9 would ameliorate the PV/PNN deficits in P22–23 Fmr1 KO mice. To test this, immediately after EEG recordings (one day after treatment), mice were sacrificed, and brains were collected for PV immunostaining and PNN labeling using Wisteria floribunda Agglutinin (WFA; Figure 1A, PV/PNN analysis). We analyzed the density of PV-positive (Figure 5A, 5E, 5I, 5M), PNN-positive (Figure 5B, 5F, 5J, 5N), and PV/PNN co-labeled neurons (Figure 5C, 5G, 5K, 5O) in layer 4 of the AC contralateral to the EEG electrode (for layers 1, 2/3 and 5/6 see Supplemental Figure 5–1). We observed a significant increase of PNN density in SB-3CT-treated Fmr1 KO mice compared to vehicle-treated Fmr1 KO mice (Figure 5R, p=0.02). There was also a significant increase of PNN density in SB-3CT-treated WT mice compared to vehicle-treated WT mice (Figure 5R, p=0.009). Statistical analysis of PV/PNN co-localization revealed a significant increase of PV/PNN co-localization in SB-3CT-treated Fmr1 KO mice compared to vehicle-treated Fmr1 KO mice (Figure 5S, p=0.008). There was also a significant increase of PV/PNN co-localization in SB-3CT-treated WT mice compared to vehicle-treated WT mice (Figure 5S, p=0.04; for all average values and statistics see Supplemental Table 3–4).
Figure 5. Acute SB-3CT treatment enhances PNN formation around PV cells in layer 4 auditory cortex of Fmr1 KO mice.
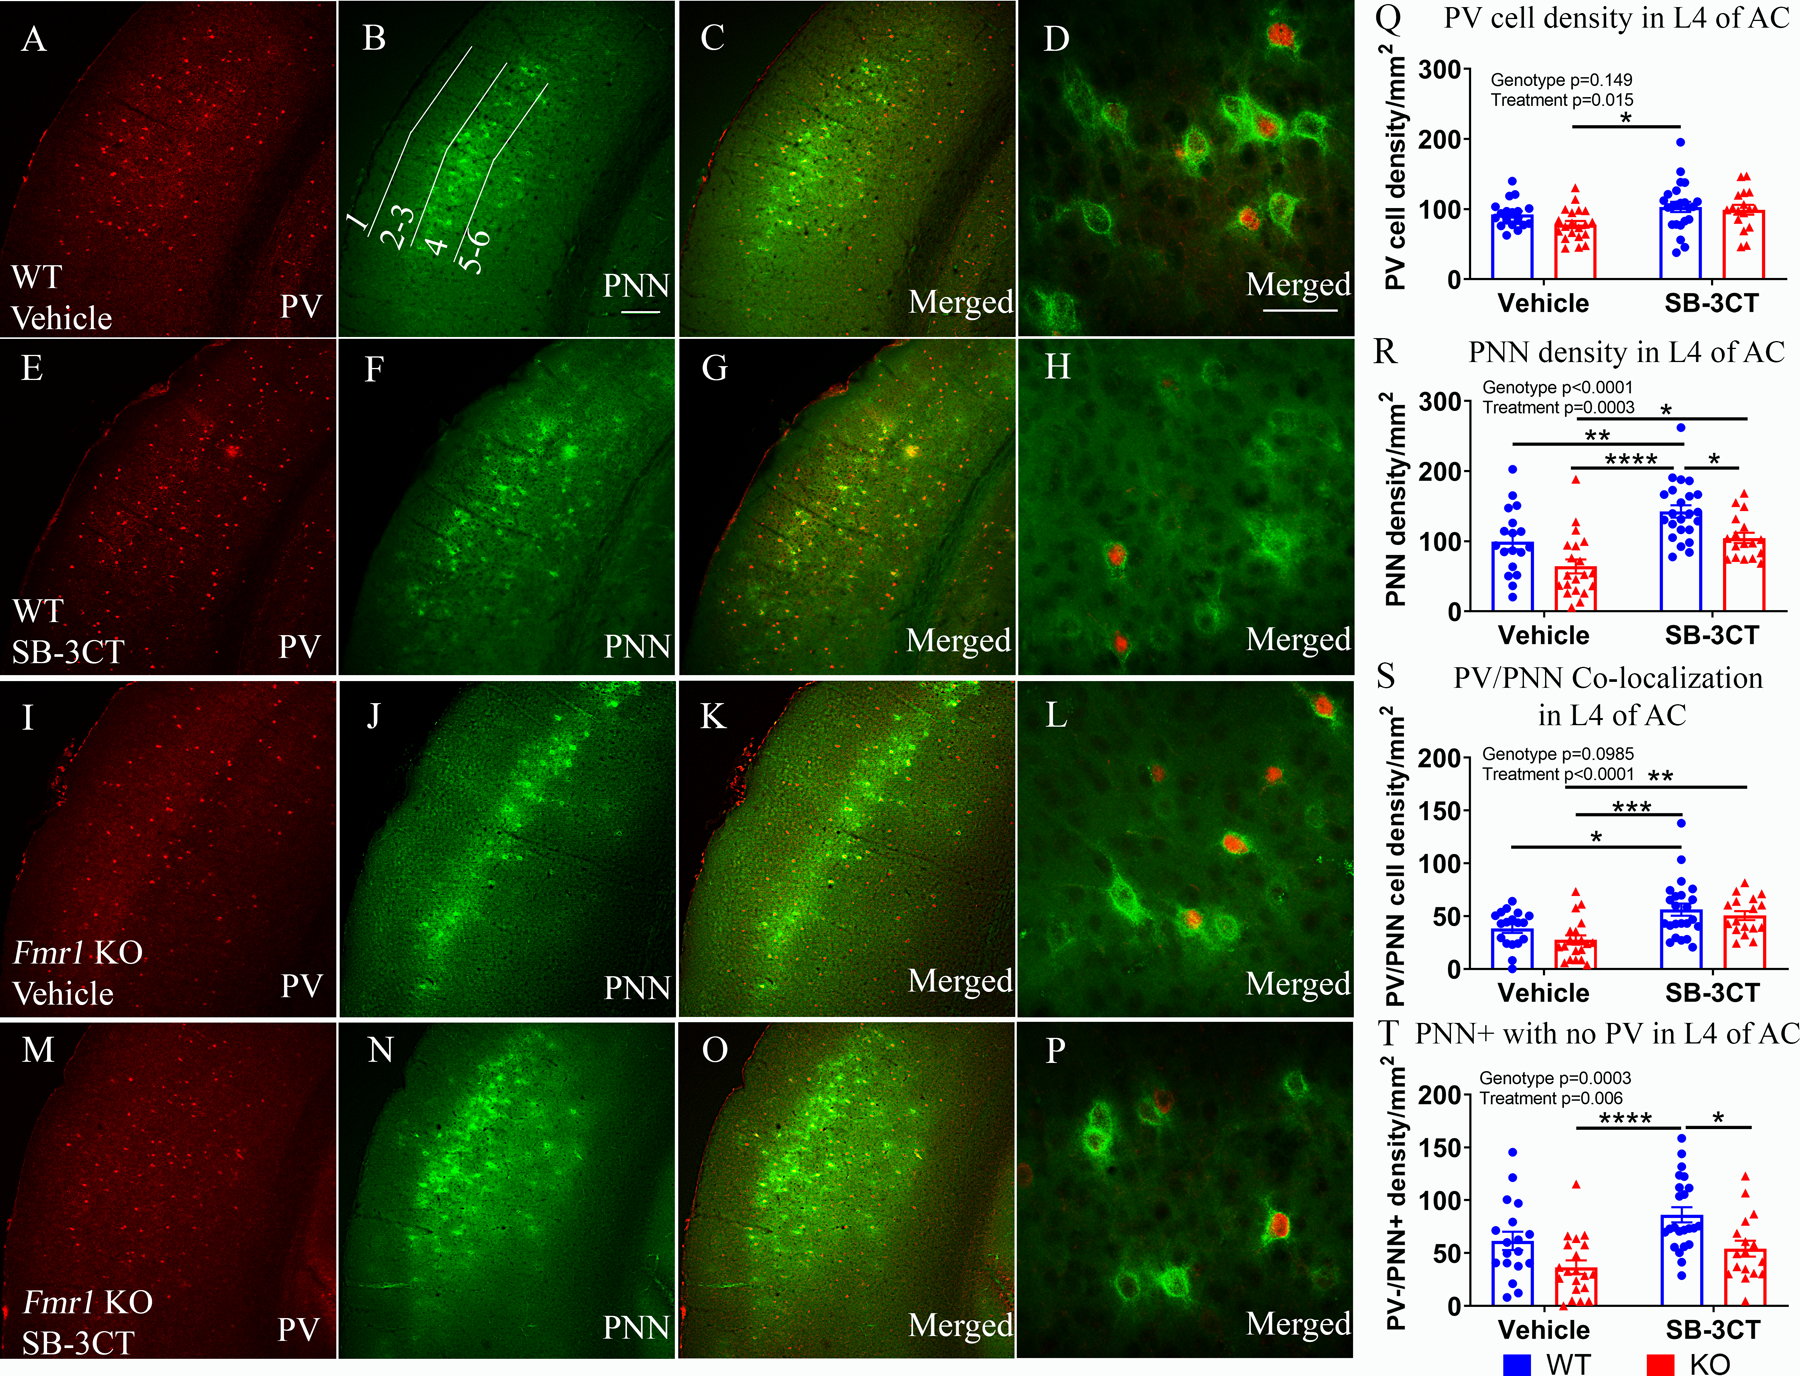
Confocal images of PV immunoreactivity (red; A, E, I, M), PNN labeling with WFA (green; B, F, J, N) and PV/PNN double labeling (C, G, K, O) in vehicle-treated WT (A-D), SB-3CT-treated WT (E-H), vehicle-treated Fmr1 KO (I–L), and SB-3CT-treated Fmr1 KO (M-P). Scale bar, 150 μm. (B) High magnification images of PV/PNN in vehicle-treated WT (D), SB-3CT-treated WT (H), vehicle-treated Fmr1 KO (L), and SB-3CT-treated Fmr1 KO (P). Scale bar, 50 μm. (Q-T) Graphs show density of PV cells (Q), PNN-positive cells (R), PV/PNN co-localization (S) and PV-negative cells with PNN (T). All graphs represent average values and the error bars indicate SEM (n=17–23 per group, N=6 per group; *p<0.05; **p<0.01; ***p<0.001; ****p<0.0001).
Taken together, these data suggest that acute pharmacological inhibition of MMP-9 normalizes PNN development and co-localization of PNN predominantly around PV interneurons in layer 4 of the developing AC of Fmr1 KO mice, consistent with improved phase locking at low gamma band frequencies.
Acute inhibition of MMP-9 ameliorates anxiety and hyperactivity in Fmr1 KO mice
Next, we assessed whether SB-3CT treatment reduces anxiety-like behaviors and hyperactivity in Fmr1 KO mice that received an i.p. injections of SB-3CT (25mg/kg) at P27–28 (for timeline see Figure 6A). Anxiety-like behaviors were assessed on P28–29 mice (one day after treatment) using the elevated plus maze (EPM) and open field (OF). In the EPM, mice were allowed to explore the cross-shaped field for 10 min. TopScan Live software was used to evaluate anxiety-like behaviors by determining the percent of time spent in the open arms (Figure 6B). To evaluate locomotor activity and hyperactivity, the number of total entries into open and closed arms (Figure 6C), and the average speed (Figure 6D) were quantified. Results showed that vehicle-treated Fmr1 KO mice spent less time in the open arms compared to vehicle-treated WT controls (Figure 6B). Statistical analysis using two-way ANOVA revealed significant effect of treatment, genotype, and significant interaction (for statistical comparisons refer to Supplemental Table 5). Post hoc comparisons showed that SB-3CT-treated Fmr1 KO mice spent more time in open arms than vehicle-treated Fmr1 KO mice (Figure 6B, p<0.0001). Treatment with SB-3CT did not alter behavior of WT mice, suggesting specificity of the drug to the Fmr1 KO group. Vehicle-treated Fmr1 KO mice also showed an increase in the number of total entries (Figure 6C, p=0.0001) and speed (Figure 6D, p=0.0030) compared to vehicle-treated WT controls. Treatment of Fmr1 KO mice with SB-3CT reduced the number of total entries (Figure 6C, p=0.0001) and speed (Figure 6D, p=0.0008), yet it did not significantly alter the number of total entries or speed in WT controls (Figures 6C, 6D).
In the OF task, animals were allowed to explore an open field for 10 min. Anxiety-like behaviors were evaluated by measuring the total number of center entries (Figure 6E), the percent of time spent in thigmotaxis (Figure 6F), and the time spent in the center per entry (Figure 6G). Locomotor activity was assessed by determining the number of total line crosses (Figure 6H) and average speed (Figure 6I). All behaviors were quantified using TopScan Live software. Statistical analysis using two-way ANOVA revealed significant main effects of treatment and interaction (for statistical comparisons refer to Supplemental Table 5 and 6). Post hoc comparisons showed that vehicle-treated Fmr1 KO mice made fewer center entries (Figure 6E, p=0.0316), spent more time in thigmotaxis (Figure 6F, p<0.0001) and spent less time in the center per entry (Figure 6G, p=0.0173) compared to vehicle-treated WT controls. However, SB-3CT-treated Fmr1 KO mice made more center entries (Figure 6E, p=0.0101), spent less time in thigmotaxis (Figure 6F, p<0.0001) and more time in the center per entry (Figure 6G, p=0.0086) compared to vehicle-treated Fmr1 KO mice. Statistical analysis using two-way ANOVA also revealed a significant increase in the total line crosses (Figure 6H, p<0.0001) and average speed (Figure 6I, p<0.0001) in vehicle-treated Fmr1 KO mice compared to vehicle-treated WT mice. SB-3CT treatment significantly decreased the total line crosses (Figure 6H, p<0.0001) and average speed (Figure 6I, p=0.0021; for all average values and statistics see Supplemental Table 5–6) of Fmr1 KO mice. SB-3CT treatment did not change the behavior of WT mice in the open field.
These results suggest that acute inhibition of MMP-9 using SB-3CT alleviates anxiety/hyperactivity observed in Fmr1 KO mice, without altering these behaviors in WT mice.
Acute inhibition of MMP-9 with SB-3CT reduces gelatinase activity and phosphorylation of Akt, while increasing PV levels and phosphorylation of TrkB
To confirm that the MMP-2/9 inhibitor, SB-3CT, reduced MMP-2/9 activity following treatment, gelatinase activity was measured using a Dye-Quenched (DQ) gelatin assay. Fmr1 KO mice were injected with SB-3CT (25 mg/kg) or vehicle, the auditory and surrounding temporal cortex (Supplemental Figure 2–1) was collected and homogenized for the DQ gelatin assay 1 h post injection (for timeline see Figure 7A). A mouse recombinant MMP-9 (~1,500 pmol/min/μg) was used as a standard to calculate the approximate MMP-9 activity in the sample using a linear regression curve (Figure 7B). Results reveal that SB-3CT-treated Fmr1 KO mice exhibit significantly decreased levels of gelatinase activity 1 h post injection compared to vehicle-treated Fmr1 KO mice (Figure 7C, t-test, N=5 per group, p=0.02, Supplemental Table 7). SB-3CT-treated WT mice also show significantly reduced gelatinase activity compared to vehicle-treated WT mice (Supplemental Figure 7–1).
Previous studies have shown over-activation and enhanced phosphorylation of Akt/mTOR in the cortex of Fmr1 KO mice (Lovelace et al. 2019), may underlie abnormalities in synaptic functions and hyperexcitability (Klann & Dever 2004; Sharma et al. 2010). In addition, genetic deletion of MMP-9 restored Akt/mTOR phosphorylation to the normal levels in the hippocampus of Fmr1 KO mice, while treatment of WT neurons with active MMP-9 enhanced Akt/mTOR phosphorylation (Sidhu et al. 2014). Therefore, to determine whether acute pharmacological MMP-9 inhibition influenced Akt/mTOR-related signaling, we analyzed Akt phosphorylation in the AC of SB-3CT and vehicle-treated Fmr1 KO mice. Fmr1 KO mouse brains were collected for Western blot analysis at P27–28 immediately after behavior, one-day following treatment (for timeline see Figure 6A). Results show reduced levels of Akt phosphorylation in SB-3CT-treated Fmr1 KO mice compared to vehicle-treated Fmr1 KO mice (Figure 7D; N = 4, t(6) = 4.274, P = 0.0235, t-test). There were no significant changes in Akt phosphorylation in SB-3CT-treated compared to vehicle-treated WT mice (Supplemental Figure 7–2A).
As TrkB signaling is implicated in PV cell development and survival (Nomura et al. 2017; Xenos et al. 2018), we examined the effects of acute MMP-9 inhibition on PV levels and phosphorylation of TrkB using Western blot. Results show that following SB-3CT treatment Fmr1 KO mice exhibit increased PV levels (Figure 7E; N = 4, t(6) = 2.607, P = 0.0479, t-test). We also observed an increase in TrkB phosphorylation on Tyrosine (Y) 515 in SB-3CT treated Fmr1 KO mice compared to vehicle-treated Fmr1 KO mice (Figure 7F; N = 4, t(6) = 2.805, P = 0.0378, t-test), while there was no significant change in total TrkB levels (Figure 7G; for average values see Supplemental Table 8). Comparison of SB-3CT-treated WT versus vehicle-treated WT mice did not reveal any significant changes in PV (Supplemental Figure 7–2B), pTrkBY515 (Supplemental Figure 7–2C), or total TrkB (Supplemental Figure 7–2D).
Discussion
In this study, we show that P22–23 Fmr1 KO mice exhibit abnormal neural oscillation patterns that parallel adult Fmr1 KO mice and humans with FXS including increased resting state gamma power and deficits in gamma synchronization to auditory stimuli. Treatment with the MMP-9 inhibitor, SB-3CT, had no significant effect on resting EEG power or EEG power coupling in Fmr1 KO mice. However, acute inhibition of MMP-9 activity improved fidelity of gamma frequency (~40 Hz) phase locking to time varying auditory stimuli in SB-3CT Fmr1 KO mice compared to vehicle-treated Fmr1 KO mice. At the molecular level, SB-3CT treatment enhanced PNN formation predominantly around PV interneurons in the developing AC of both Fmr1 KO mice and WT mice. Assessment of anxiety/hyperactivity with EPM and OF tests demonstrated that acute inhibition of MMP-9 activity ameliorated anxiety-like behaviors and hyperactivity in Fmr1 KO mice. Lastly, acute inhibition of MMP-9 activity reduced Akt phosphorylation, while increasing PV levels and TrkB phosphorylation. Our data are consistent with previously reported benefits of minocycline treatment in humans with FXS (Schneider et al. 2013), Fmr1 KO mice (Bilousova et al. 2009; Dansie et al. 2013; Toledo et al. 2019), and the Drosophila FXS model (Siller & Broadie 2011), and further suggest that minocycline may alleviate FXS symptoms by suppressing MMP-9. These data support the notion that cellular and electrophysiological abnormalities of sensory processing are present early in development. In addition, treatment during early postnatal developmental period may be beneficial in ameliorating deficits due to higher cortical plasticity. Furthermore, reduction of MMP-9 activity may provide a suitable target to reduce auditory hypersensitivity in FXS and potentially other ASDs.
Developing and adult Fmr1 KO mice exhibit comparable EEG phenotypes
In this study, we show that developing Fmr1 KO mice (P22–23) exhibit increased resting state low gamma power in both the AC and FC (Figure 1) similar to adult Fmr1 KO mice. Unlike adult Fmr1 KO mice, though, developing Fmr1 KO mice do not exhibit increased resting state delta or high gamma power (Lovelace et al. 2018). These results are consistent with data from the FVB strain of mice (Wen et al. 2019), suggesting that abnormal electrophysiological phenotypes are observed as early as P22 in developing Fmr1 KO mice. The consistency of EEG phenotypes across age and genetic backgrounds of mice, and between humans and mice, indicate that these measures can be utilized as objective physiological biomarkers to test the effectiveness of potential drugs. Furthermore, accumulating evidence indicates that increased resting state gamma power is associated with sensory processing and communication deficits in FXS and ASD (Ethridge et al. 2017; Wang et al. 2017; Sinclair et al. 2017; Lovelace et al. 2018; Ethridge et al. 2019; Lovelace et al. 2019). Additional studies also point to abnormalities in theta and alpha power as contributing mechanisms underlying hyperexcitability (Van der Molen & Van der Molen 2013). Theta power is linked to cortical arousal level (Barry et al. 2009). Alpha power has been interpreted to reflect a neural inhibitory mechanism that regulates the processing of external, sensory information (Klimesch 1999; Mathewson et al. 2011). In particular, GABAergic inhibitory activity is thought to contribute to this neural inhibition mediated by alpha oscillations (Jensen & Mazaheri 2010). Together, alpha/theta synchronization have been linked to cognitive function (Klimesch 1999) and ability to inhibit irrelevant sensory information (Van der Molen & Van der Molen 2013). Human EEG studies report an inverted U-shaped pattern of power abnormalities showing reduced alpha frequencies, but increased delta, theta frequencies and high frequency bands (beta, gamma) in children with ASD (Wang et al. 2013; Sinclair et al. 2017). Elevated theta and delta power and reduced alpha power is also observed in individuals with ADHD (Barry et al. 2003; Born et al. 2017). Our study shows a reduced EEG power correlations between Theta and Low Gamma, Alpha and Low Gamma bands within the AC as well as across regions (AC to FC and FC to AC) in Fmr1 KO mice compared to WT mice. Overall, our findings indicate that abnormalities in EEG oscillation pattern, which are associated with hyperexcitability, cognitive performance, and ability to process sensory information, are present in developing Fmr1 KO mice as early as P22–23.
In this study, we show that developing Fmr1 KO mice exhibit decreased ability to produce synchronous stimulus-induced oscillations, similar to adult Fmr1 KO mice (Lovelace et al. 2018), but the impairment is localized specifically to the low gamma frequencies (~30–55 Hz) in the AC and both low and high gamma (~65–100 Hz) frequencies in the FC. Treatment of Fmr1 KO mice with SB-3CT leads to an improvement in phase locking to auditory chirp stimuli, in the same frequency range (~40–50 Hz) where the deficit was observed in vehicle-treated Fmr1 KO AC (Figure 4). This result indicates that SB-3CT may be targeting specific cellular and network mechanisms in the AC resulting in improved phase locked synchronization in developing Fmr1 KO mice.
Molecular mechanisms influencing Fmr1 KO EEG phenotype
It is possible that changes in PV/PNN networks affect inhibitory circuits and neural oscillation patterns. The loss of PNNs is associated with abnormal plasticity and reduced excitability of PV interneurons (Balmer 2016; Lensjo et al. 2017; Chu et al. 2018). This may lead to altered balance of excitatory and inhibitory circuits, and improper network synchronization and hyperexcitability (Contractor et al. 2015). In fact, several studies point altered functionality of GABAergic circuits, specifically fast-spiking PV interneurons in FXS (Selby et al. 2007; Nomura et al. 2017; Goel et al. 2018). Specifically, PV cell density is significantly reduced in the AC (Wen et al. 2018; Kulinich et al. 2019) and somatosensory cortex (Selby et al. 2007) of Fmr1 KO mice compared to WT mice. One recent study demonstrated that passive developmental sound exposure during the maturation of synaptic and intrinsic properties (P9–21) results in enhanced PV cell density and PV/PNN co-localization in the AC of Fmr1 KO mice despite impairment of PNN formation (Kulinich et al. 2019). In contrast, genetic reduction of MMP-9 was shown to enhance the formation of PNNs around PV cells in the AC (Wen et al. 2018). Our study shows that pharmacological inhibition of MMP-9 activity alone during the critical developmental period results in enhanced PNN formation around PV interneurons. While we did not see a significant increase in PV cell density, we did observe an increase in PV levels measured by Western blot, similar to what has been observed in other ASD models (Filice et al. 2016). It is possible that increased PNN formation around PV cells contributed to increased PV levels, which influenced the changes in resting state EEG oscillations in SB-3CT-treated Fmr1 KO mice (Yamada et al. 2015). To more effectively target auditory hypersensitivity a combination of sensory stimulation (Woo & Leon 2013; Kulinich et al. 2019) with pharmacological inhibition of MMP-9 activity (Bilousova et al. 2009) may yield a synergistic effect.
Other studies have employed sound exposure or mGluR5 inhibitors during the late postnatal window (P20–30) to rescue AC plasticity deficits and found that they were only able to rescue sound exposure-induced cortical map plasticity (size of A1 and response latency) when Fmr1 KO mice were exposed to sound between P9–20 in conjunction with daily MPEP injections (Kim et al. 2013). It is possible that inhibition of MMP-9 activity may function as a potent therapeutic for auditory hypersensitivity and anxiety/hyperactivity phenotypes during the critical developmental period. The question remains whether administration of SB-3CT during the critical developmental period has more beneficial effects in regulating resting state EEG oscillations, improving responses to sound and anxiety/hyperactivity related behaviors in Fmr1 KO mice versus administration of SB-3CT in adult Fmr1 KO mice. SB-3CT has only ~45 min half-life (Gooyit et al. 2012). However, even transient inhibition of MMP-9 activity during this specific developmental window was sufficient to trigger structural and functional changes in the auditory cortex of Fmr1 KO mice. One potential benefit may be attributed to the metabolism of SB-3CT, which functions as an irreversible inhibitor yielding covalent modifications that inhibit the activation of MMP-2/9 (Brown et al. 2000).
In addition to the enhanced PNN formation surrounding PV interneurons in the AC, the function of PV interneurons may also be influenced by activity of TrkB receptor. TrkB is shown to play a role in gamma-band synchronization in the hippocampal network (Zheng et al. 2011) and functions as a receptor for brain-derived neurotrophic factor (BDNF). In fact, TrkB is expressed by GABAergic neurons, in particular PV-positive cells (Lewis et al. 2005; Cellerino et al. 1996). BDNF-mediated signaling is involved in mediating cell growth and survival, neuronal differentiation, and activity-dependent regulation of inhibitory synapse development (Hong et al. 2008) and has been linked to maturation of PV cells in the cerebral cortex (Itami et al. 2007). BDNF via TrkB is known to promote the development of GABAergic neurons and induces the expression of GABA-related proteins, including GAD67, GAT1 and PV (Xenos et al. 2018; Nomura et al. 2017). Notably, BDNF-TrkB signaling has been shown to be impaired in Fmr1 KO mice (Castren & Castren 2014). We previously reported decreased phosphorylation of TrkB in the AC of Fmr1 KO mice compared to WT mice, which was up-regulated following developmental exposure to sound (Kulinich et al. 2019). In the current study, we showed that treatment with SB-3CT increased TrkB phosphorylation in Fmr1 KO mice compared to vehicle-treated Fmr1 KO mice (Figure 7). Together, inhibition of MMP-9 activity may preferentially target PV-mediated inhibitory networks by influencing the stability of PV interneurons via increased PNN formation and activation of TrkB receptors.
Inhibition of MMP-9 activity reduces Akt phosphorylation and improves anxiety and hyperactivity phenotypes in Fmr1 KO mice
FXS is characterized by over-activation of group I metabotropic glutamate receptors (Huber 2002), which promote Akt/mTOR signaling leading to aberrant phosphorylation of Akt and mTOR-related proteins, and increased protein synthesis (Sharma et al. 2010; Bear et al. 2004). Studies have shown that genetic reduction of p70 ribosomal S6 kinase 1 (S6K1) prevented elevated phosphorylation of translational control proteins, normalizing protein synthesis, reversing dendritic spine deficits, and improving social interactions, novel object recognition and behavioral flexibility in Fmr1 KO mice (Bhattacharya et al. 2012). In fact, several studies link dysregulation of mTOR signaling with dendritic and synaptic abnormalities, cognitive impairments, and behavioral performance in FXS (Busquets-Garcia et al. 2014; Troca-Marin et al. 2012; Bhattacharya et al. 2012). Furthermore, treatment with the antibiotic minocycline, which is known to inhibit MMP-9, also promotes dendritic spine maturation and improves behavioral performance in developing Fmr1 KO mice (Bilousova et al. 2009). Thus, it is possible that the reduction of Akt phosphorylation observed in Fmr1 KO mice following treatment with SB-3CT may be linked to the changes in dendritic and synaptic profiles affecting protein synthesis, synaptic plasticity, and behavioral performance.
While Fmr1 KO mice display multiple behavioral impairments that parallel human patients with FXS (Bernardet & Crusio 2006), there is wide variability in behavioral results assessing anxiety, hyperactivity, social and cognitive impairments in Fmr1 KO mice. Several studies find these measures to be altered (Sinclair et al. 2017; Bilousova et al. 2009; Ding et al. 2014), while others show no differences (Kazdoba et al. 2014). We show that vehicle-treated Fmr1 KO mice spent less time in the open arms of the EPM, similar to previous studies in our lab (Bilousova et al. 2009), as well as increased percent time in thigmotaxis and decreased center entries in the OF, indicating higher anxiety. Fmr1 KO mice also displayed increased hyperactivity indicated by increased speed in both EPM and OF tests. Interestingly, treatment with SB-3CT reduced both anxiety and hyperactivity measures in Fmr1 KO mice. These results suggest that SB-3CT effectively ameliorates behavioral impairments observed in developing Fmr1 KO mice when MMP-9 activity is inhibited during the specific developmental period.
In conclusion, we have shown that acute inhibition of MMP-9 activity during a specific critical developmental period (P22-P28) may serve to modulate PV neuron-mediated inhibitory circuits, neural oscillatory patterns, and behavioral impairments associated with FXS. These findings implicate MMP-9 as a potent candidate contributing to the FXS phenotype and indicate that targeted inhibition of MMP-9 activity may be a promising therapeutic agent.
Supplementary Material
Acknowledgements:
Supported by National Institute of Mental Health, National Institute of Child Health and Human Development U54 HD082008–01. FRAXA Research Foundation Postdoctoral Fellowship to P.S.P and J.W.L and a University of California President’s Postdoctoral Fellowship to P.S.P. Thank you to the Ethell, Binder, and Razak laboratories. A special thank you to all who contributed to the current research including Teresa H. Wen for training with surgeries, Carrie R. Jonak for assistance in mouse colony maintenance, Anna Kulinich for assistance in creating graphics and illustrations, and Dushan Rakic, Yasmien Hanania, Mark Makar, and Rashid Syed for technical assistance.
Abbreviations:
- AC
Auditory Cortex
- Akt
Protein Kinase B
- ASD
Autism Spectrum Disorders
- EEG
Electroencephalography
- FFT
Fast Fourier Transform
- Fmr1 KO
Fragile X mental retardation 1 gene knock-out
- FXS
Fragile X Syndrome
- FC
Frontal Cortex
- ITPC
Inter trial phase coherence
- mTOR
Mammalian target of rapamycin
- MMP-2/9
Matrix metalloproteinase-2/9
- PV
Parvalbumin
- PNN
Perineuronal net
- RRID
Research resource identifier
- STP
Single trial power
- TrkB
Tropomyosin-related kinase B
Footnotes
Conflict of Interest: The authors declare no competing financial interests.
--Human subjects --
Involves human subjects:
If yes: Informed consent & ethics approval achieved:
=> if yes, please ensure that the info “Informed consent was achieved for all subjects, and the experiments were approved by the local ethics committee.” is included in the Methods.
ARRIVE guidelines have been followed:
Yes
=> if it is a Review or Editorial, skip complete sentence => if No, include a statement in the “Conflict of interest disclosure” section: “ARRIVE guidelines were not followed for the following reason: ”
(edit phrasing to form a complete sentence as necessary).
=> if Yes, insert in the “Conflict of interest disclosure” section:
“All experiments were conducted in compliance with the ARRIVE guidelines.” unless it is a Review or Editorial
References
- Anderson LA, Christianson GB and Linden JF (2009) Mouse auditory cortex differs from visual and somatosensory cortices in the laminar distribution of cytochrome oxidase and acetylcholinesterase. Brain Res 1252, 130–142. [DOI] [PubMed] [Google Scholar]
- Artieda J, Valencia M, Alegre M, Olaziregi O, Urrestarazu E and Iriarte J (2004) Potentials evoked by chirp-modulated tones: a new technique to evaluate oscillatory activity in the auditory pathway. Clin Neurophysiol 115, 699–709. [DOI] [PubMed] [Google Scholar]
- Balakrishnan S and Pearce RA (2014) Spatiotemporal characteristics and pharmacological modulation of multiple gamma oscillations in the CA1 region of the hippocampus. Front Neural Circuits 8, 150. [DOI] [PMC free article] [PubMed] [Google Scholar]
- Balmer TS (2016) Perineuronal Nets Enhance the Excitability of Fast-Spiking Neurons. eNeuro 3. [DOI] [PMC free article] [PubMed] [Google Scholar]
- Barry RJ, Clarke AR, Johnstone SJ, McCarthy R and Selikowitz M (2009) Electroencephalogram theta/beta ratio and arousal in attention-deficit/hyperactivity disorder: evidence of independent processes. Biol Psychiatry 66, 398–401. [DOI] [PubMed] [Google Scholar]
- Barry RJ, Johnstone SJ and Clarke AR (2003) A review of electrophysiology in attention-deficit/hyperactivity disorder: II. Event-related potentials. Clin Neurophysiol 114, 184–198. [DOI] [PubMed] [Google Scholar]
- Bear MF, Huber KM and Warren ST (2004) The mGluR theory of fragile X mental retardation. Trends in Neurosciences 27, 370–377. [DOI] [PubMed] [Google Scholar]
- Bernardet M and Crusio WE (2006) Fmr1 KO mice as a possible model of autistic features. ScientificWorldJournal 6, 1164–1176. [DOI] [PMC free article] [PubMed] [Google Scholar]
- Bhattacharya A, Kaphzan H, Alvarez-Dieppa AC, Murphy JP, Pierre P and Klann E (2012) Genetic removal of p70 S6 kinase 1 corrects molecular, synaptic, and behavioral phenotypes in fragile X syndrome mice. Neuron 76, 325–337. [DOI] [PMC free article] [PubMed] [Google Scholar]
- Bilousova TV, Dansie L, Ngo M, Aye J, Charles JR, Ethell DW and Ethell IM (2009) Minocycline promotes dendritic spine maturation and improves behavioural performance in the fragile X mouse model. J Med Genet 46, 94–102. [DOI] [PubMed] [Google Scholar]
- Born HA, Dao AT, Levine AT, Lee WL, Mehta NM, Mehra S, Weeber EJ and Anderson AE (2017) Strain-dependence of the Angelman Syndrome phenotypes in Ube3a maternal deficiency mice. Sci Rep 7, 8451. [DOI] [PMC free article] [PubMed] [Google Scholar]
- Brown S, Bernardo MM, Li ZH, Kotra LP, Tanaka Y, Fridman R and Mobashery S (2000) Potent and selective mechanism-based inhibition of gelatinases. Journal of the American Chemical Society 122, 6799–6800. [Google Scholar]
- Busquets-Garcia A, Maldonado R and Ozaita A (2014) New insights into the molecular pathophysiology of fragile X syndrome and therapeutic perspectives from the animal model. Int J Biochem Cell Biol 53, 121–126. [DOI] [PubMed] [Google Scholar]
- Buzsaki G and Wang XJ (2012) Mechanisms of gamma oscillations. Annu Rev Neurosci 35, 203–225. [DOI] [PMC free article] [PubMed] [Google Scholar]
- Castren M, Paakkonen A, Tarkka IM, Ryynanen M and Partanen J (2003) Augmentation of auditory N1 in children with fragile X syndrome. Brain Topogr 15, 165–171. [DOI] [PubMed] [Google Scholar]
- Castren ML and Castren E (2014) BDNF in fragile X syndrome. Neuropharmacology 76 Pt C, 729–736. [DOI] [PubMed] [Google Scholar]
- Cellerino A, Maffei L and Domenici L (1996) The distribution of brain-derived neurotrophic factor and its receptor trkB in parvalbumin-containing neurons of the rat visual cortex. Eur J Neurosci 8, 1190–1197. [DOI] [PubMed] [Google Scholar]
- Chu P, Abraham R, Budhu K, Khan U, De Marco Garcia N and Brumberg JC (2018) The Impact of Perineuronal Net Digestion Using Chondroitinase ABC on the Intrinsic Physiology of Cortical Neurons. Neuroscience 388, 23–35. [DOI] [PMC free article] [PubMed] [Google Scholar]
- Contractor A, Klyachko VA and Portera-Cailliau C (2015) Altered Neuronal and Circuit Excitability in Fragile X Syndrome. Neuron 87, 699–715. [DOI] [PMC free article] [PubMed] [Google Scholar]
- Crane L, Goddard L and Pring L (2009) Sensory processing in adults with autism spectrum disorders. Autism 13, 215–228. [DOI] [PubMed] [Google Scholar]
- Crawford DC, Acuna JM and Sherman SL (2001) FMR1 and the fragile X syndrome: human genome epidemiology review. Genet Med 3, 359–371. [DOI] [PMC free article] [PubMed] [Google Scholar]
- Dansie LE, Phommahaxay K, Okusanya AG, Uwadia J, Huang M, Rotschafer SE, Razak KA, Ethell DW and Ethell IM (2013) Long-lasting effects of minocycline on behavior in young but not adult Fragile X mice. Neuroscience 246, 186–198. [DOI] [PMC free article] [PubMed] [Google Scholar]
- Ding Q, Sethna F and Wang H (2014) Behavioral analysis of male and female Fmr1 knockout mice on C57BL/6 background. Behav Brain Res 271, 72–78. [DOI] [PMC free article] [PubMed] [Google Scholar]
- Dvorak D and Fenton AA (2014) On track with two gammas. Neuron 82, 506–508. [DOI] [PubMed] [Google Scholar]
- Dziembowska M, Pretto DI, Janusz A, Kaczmarek L, Leigh MJ, Gabriel N, Durbin-Johnson B, Hagerman RJ and Tassone F (2013) High MMP-9 activity levels in fragile X syndrome are lowered by minocycline. Am J Med Genet A 161A, 1897–1903. [DOI] [PubMed] [Google Scholar]
- Ethridge LE, De Stefano LA, Schmitt LM et al. (2019) Auditory EEG Biomarkers in Fragile X Syndrome: Clinical Relevance. Front Integr Neurosci 13, 60. [DOI] [PMC free article] [PubMed] [Google Scholar]
- Ethridge LE, White SP, Mosconi MW, Wang J, Byerly MJ and Sweeney JA (2016) Reduced habituation of auditory evoked potentials indicate cortical hyper-excitability in Fragile X Syndrome. Transl Psychiatry 6, e787. [DOI] [PMC free article] [PubMed] [Google Scholar]
- Ethridge LE, White SP, Mosconi MW, Wang J, Pedapati EV, Erickson CA, Byerly MJ and Sweeney JA (2017) Neural synchronization deficits linked to cortical hyper-excitability and auditory hypersensitivity in fragile X syndrome. Mol Autism 8, 22. [DOI] [PMC free article] [PubMed] [Google Scholar]
- Filice F, Vorckel KJ, Sungur AO, Wohr M and Schwaller B (2016) Reduction in parvalbumin expression not loss of the parvalbumin-expressing GABA interneuron subpopulation in genetic parvalbumin and shank mouse models of autism. Mol Brain 9, 10. [DOI] [PMC free article] [PubMed] [Google Scholar]
- Gibson JR, Bartley AF, Hays SA and Huber KM (2008) Imbalance of neocortical excitation and inhibition and altered UP states reflect network hyperexcitability in the mouse model of fragile X syndrome. J Neurophysiol 100, 2615–2626. [DOI] [PMC free article] [PubMed] [Google Scholar]
- Gkogkas CG, Khoutorsky A, Cao R et al. (2014) Pharmacogenetic inhibition of eIF4E-dependent Mmp9 mRNA translation reverses fragile X syndrome-like phenotypes. Cell Rep 9, 1742–1755. [DOI] [PMC free article] [PubMed] [Google Scholar]
- Goel A, Cantu DA, Guilfoyle J et al. (2018) Impaired perceptual learning in a mouse model of Fragile X syndrome is mediated by parvalbumin neuron dysfunction and is reversible. Nat Neurosci 21, 1404–1411. [DOI] [PMC free article] [PubMed] [Google Scholar]
- Gooyit M, Suckow MA, Schroeder VA, Wolter WR, Mobashery S and Chang M (2012) Selective gelatinase inhibitor neuroprotective agents cross the blood-brain barrier. ACS Chem Neurosci 3, 730–736. [DOI] [PMC free article] [PubMed] [Google Scholar]
- Hagerman RJ, Rivera SM and Hagerman PJ (2008) The Fragile X Family of Disorders: A Model for Autism and Targeted Treatments. Current Pediatric Reviews 4, 40–52. [Google Scholar]
- Hong EJ, McCord AE and Greenberg ME (2008) A biological function for the neuronal activity-dependent component of Bdnf transcription in the development of cortical inhibition. Neuron 60, 610–624. [DOI] [PMC free article] [PubMed] [Google Scholar]
- Huber KM (2002) Altered synaptic plasticity in a mouse model of fragile X mental retardation. Pro Natl Acad Sci USA 99, 7746–7750. [DOI] [PMC free article] [PubMed] [Google Scholar]
- Itami C, Kimura F and Nakamura S (2007) Brain-derived neurotrophic factor regulates the maturation of layer 4 fast-spiking cells after the second postnatal week in the developing barrel cortex. J Neurosci 27, 2241–2252. [DOI] [PMC free article] [PubMed] [Google Scholar]
- Jensen O and Mazaheri A (2010) Shaping functional architecture by oscillatory alpha activity: gating by inhibition. Front Hum Neurosci 4, 186. [DOI] [PMC free article] [PubMed] [Google Scholar]
- Kaufmann WE, Cortell R, Kau AS, Bukelis I, Tierney E, Gray RM, Cox C, Capone GT and Stanard P (2004) Autism spectrum disorder in fragile X syndrome: communication, social interaction, and specific behaviors. Am J Med Genet A 129A, 225–234. [DOI] [PubMed] [Google Scholar]
- Kazdoba TM, Leach PT, Silverman JL and Crawley JN (2014) Modeling fragile X syndrome in the Fmr1 knockout mouse. Intractable Rare Dis Res 3, 118–133. [DOI] [PMC free article] [PubMed] [Google Scholar]
- Kim H, Gibboni R, Kirkhart C and Bao S (2013) Impaired critical period plasticity in primary auditory cortex of fragile X model mice. J Neurosci 33, 15686–15692. [DOI] [PMC free article] [PubMed] [Google Scholar]
- Klann E and Dever TE (2004) Biochemical mechanisms for translational regulation in synaptic plasticity. Nature reviews. Neuroscience 5, 931–942. [DOI] [PubMed] [Google Scholar]
- Klimesch W (1999) EEG alpha and theta oscillations reflect cognitive and memory performance: a review and analysis. Brain Res Brain Res Rev 29, 169–195. [DOI] [PubMed] [Google Scholar]
- Kulinich AO, Reinhard SM, Rais M, Lovelace JW, Scott V, Binder DK, Razak KA and Ethell IM (2019) Beneficial effects of sound exposure on auditory cortex development in a mouse model of Fragile X Syndrome. Neurobiol Dis 134, 104622. [DOI] [PubMed] [Google Scholar]
- Laggerbauer B (2001) Evidence that fragile X mental retardation protein is a negative regulator of translation. Human Molecular Genetics 10, 329–338. [DOI] [PubMed] [Google Scholar]
- Lensjo KK, Christensen AC, Tennoe S, Fyhn M and Hafting T (2017) Differential Expression and Cell-Type Specificity of Perineuronal Nets in Hippocampus, Medial Entorhinal Cortex, and Visual Cortex Examined in the Rat and Mouse. eNeuro 4. [DOI] [PMC free article] [PubMed] [Google Scholar]
- Lewis DA, Hashimoto T and Volk DW (2005) Cortical inhibitory neurons and schizophrenia. Nature reviews. Neuroscience 6, 312–324. [DOI] [PubMed] [Google Scholar]
- Lovelace JW, Ethell IM, Binder DK and Razak KA (2018) Translation-relevant EEG phenotypes in a mouse model of Fragile X Syndrome. Neurobiol Dis 115, 39–48. [DOI] [PMC free article] [PubMed] [Google Scholar]
- Lovelace JW, Rais M, Palacios AR et al. (2019) Deletion of Fmr1 from Forebrain Excitatory Neurons Triggers Abnormal Cellular, EEG, and Behavioral Phenotypes in the Auditory Cortex of a Mouse Model of Fragile X Syndrome. Cereb Cortex. [DOI] [PMC free article] [PubMed]
- Lovelace JW, Wen TH, Reinhard S, Hsu MS, Sidhu H, Ethell IM, Binder DK and Razak KA (2016) Matrix metalloproteinase-9 deletion rescues auditory evoked potential habituation deficit in a mouse model of Fragile X Syndrome. Neurobiol Dis 89, 126–135. [DOI] [PMC free article] [PubMed] [Google Scholar]
- Maris E and Oostenveld R (2007) Nonparametric statistical testing of EEG- and MEG-data. J Neurosci Methods 164, 177–190. [DOI] [PubMed] [Google Scholar]
- Martin del Campo HN, Measor KR and Razak KA (2012) Parvalbumin immunoreactivity in the auditory cortex of a mouse model of presbycusis. Hear Res 294, 31–39. [DOI] [PubMed] [Google Scholar]
- Mathewson KE, Lleras A, Beck DM, Fabiani M, Ro T and Gratton G (2011) Pulsed out of awareness: EEG alpha oscillations represent a pulsed-inhibition of ongoing cortical processing. Front Psychol 2, 99. [DOI] [PMC free article] [PubMed] [Google Scholar]
- McDiarmid TA, Bernardos AC and Rankin CH (2017) Habituation is altered in neuropsychiatric disorders-a comprehensive review with recommendations for experimental design and analysis. Neurosci Biobehav Rev 80, 286–305. [DOI] [PubMed] [Google Scholar]
- Miller LJ, McIntosh DN, McGrath J et al. (1999) Electrodermal responses to sensory stimuli in individuals with fragile X syndrome: a preliminary report. Am J Med Genet 83, 268–279. [PubMed] [Google Scholar]
- Niell CM and Stryker MP (2010) Modulation of visual responses by behavioral state in mouse visual cortex. Neuron 65, 472–479. [DOI] [PMC free article] [PubMed] [Google Scholar]
- Nomura T, Musial TF, Marshall JJ, Zhu Y, Remmers CL, Xu J, Nicholson DA and Contractor A (2017) Delayed Maturation of Fast-Spiking Interneurons Is Rectified by Activation of the TrkB Receptor in the Mouse Model of Fragile X Syndrome. J Neurosci 37, 11298–11310. [DOI] [PMC free article] [PubMed] [Google Scholar]
- Oswald AM and Reyes AD (2008) Maturation of intrinsic and synaptic properties of layer 2/3 pyramidal neurons in mouse auditory cortex. J Neurophysiol 99, 2998–3008. [DOI] [PMC free article] [PubMed] [Google Scholar]
- Paluszkiewicz SM, Olmos-Serrano JL, Corbin JG and Huntsman MM (2011) Impaired inhibitory control of cortical synchronization in fragile X syndrome. J Neurophysiol 106, 2264–2272. [DOI] [PMC free article] [PubMed] [Google Scholar]
- Perez-Alcazar M, Nicolas MJ, Valencia M, Alegre M, Iriarte J and Artieda J (2008) Chirp-evoked potentials in the awake and anesthetized rat. A procedure to assess changes in cortical oscillatory activity. Exp Neurol 210, 144–153. [DOI] [PubMed] [Google Scholar]
- Purcell DW, John SM, Schneider BA and Picton TW (2004) Human temporal auditory acuity as assessed by envelope following responses. J Acoust Soc Am 116, 3581–3593. [DOI] [PubMed] [Google Scholar]
- Radwan B, Dvorak D and Fenton AA (2016) Impaired cognitive discrimination and discoordination of coupled theta-gamma oscillations in Fmr1 knockout mice. Neurobiol Dis 88, 125–138. [DOI] [PMC free article] [PubMed] [Google Scholar]
- Rais M, Binder DK, Razak KA and Ethell IM (2018) Sensory Processing Phenotypes in Fragile X Syndrome. ASN Neuro 10, 1759091418801092. [DOI] [PMC free article] [PubMed] [Google Scholar]
- Ray S and Maunsell JH (2011) Different origins of gamma rhythm and high-gamma activity in macaque visual cortex. PLoS Biol 9, e1000610. [DOI] [PMC free article] [PubMed] [Google Scholar]
- Rotschafer S and Razak K (2013) Altered auditory processing in a mouse model of fragile X syndrome. Brain Res 1506, 12–24. [DOI] [PubMed] [Google Scholar]
- Schneider A, Leigh MJ, Adams P, Nanakul R, Chechi T, Olichney J, Hagerman R and Hessl D (2013) Electrocortical changes associated with minocycline treatment in fragile X syndrome. J Psychopharmacol 27, 956–963. [DOI] [PMC free article] [PubMed] [Google Scholar]
- Selby L, Zhang C and Sun QQ (2007) Major defects in neocortical GABAergic inhibitory circuits in mice lacking the fragile X mental retardation protein. Neurosci Lett 412, 227–232. [DOI] [PMC free article] [PubMed] [Google Scholar]
- Sharma A, Hoeffer CA, Takayasu Y, Miyawaki T, McBride SM, Klann E and Zukin RS (2010) Dysregulation of mTOR Signaling in Fragile X Syndrome. J Neurosci 30, 694–702. [DOI] [PMC free article] [PubMed] [Google Scholar]
- Sidhu H, Dansie LE, Hickmott PW, Ethell DW and Ethell IM (2014) Genetic removal of matrix metalloproteinase 9 rescues the symptoms of fragile X syndrome in a mouse model. J Neurosci 34, 9867–9879. [DOI] [PMC free article] [PubMed] [Google Scholar]
- Siller SS and Broadie K (2011) Neural circuit architecture defects in a Drosophila model of Fragile X syndrome are alleviated by minocycline treatment and genetic removal of matrix metalloproteinase. Dis Model Mech 4, 673–685. [DOI] [PMC free article] [PubMed] [Google Scholar]
- Sinclair D, Oranje B, Razak KA, Siegel SJ and Schmid S (2017) Sensory processing in autism spectrum disorders and Fragile X syndrome-From the clinic to animal models. Neurosci Biobehav Rev 76, 235–253. [DOI] [PMC free article] [PubMed] [Google Scholar]
- Sohal VS, Zhang F, Yizhar O and Deisseroth K (2009) Parvalbumin neurons and gamma rhythms enhance cortical circuit performance. Nature 459, 698–702. [DOI] [PMC free article] [PubMed] [Google Scholar]
- Talisa VB, Boyle L, Crafa D and Kaufmann WE (2014) Autism and anxiety in males with fragile X syndrome: an exploratory analysis of neurobehavioral profiles from a parent survey. Am J Med Genet A 164A, 1198–1203. [DOI] [PubMed] [Google Scholar]
- Tallon-Baudry C, Bertrand O, Delpuech C and Pernier J (1996) Stimulus specificity of phase-locked and non-phase-locked 40 Hz visual responses in human. J Neurosci 16, 4240–4249. [DOI] [PMC free article] [PubMed] [Google Scholar]
- Toledo MA, Wen TH, Binder DK, Ethell IM and Razak KA (2019) Reversal of ultrasonic vocalization deficits in a mouse model of Fragile X Syndrome with minocycline treatment or genetic reduction of MMP-9. Behav Brain Res 372, 112068. [DOI] [PMC free article] [PubMed] [Google Scholar]
- Troca-Marin JA, Alves-Sampaio A and Montesinos ML (2012) Deregulated mTOR-mediated translation in intellectual disability. Prog Neurobiol 96, 268–282. [DOI] [PubMed] [Google Scholar]
- Van der Molen MJ and Van der Molen MW (2013) Reduced alpha and exaggerated theta power during the resting-state EEG in fragile X syndrome. Biol Psychol 92, 216–219. [DOI] [PubMed] [Google Scholar]
- Vandooren J, Geurts N, Martens E, Van den Steen PE, Jonghe SD, Herdewijn P and Opdenakker G (2011) Gelatin degradation assay reveals MMP-9 inhibitors and function of O-glycosylated domain. World J Biol Chem 2, 14–24. [DOI] [PMC free article] [PubMed] [Google Scholar]
- Verkerk AJ, Pieretti M, Sutcliffe JS et al. (1991) Identification of a gene (FMR-1) containing a CGG repeat coincident with a breakpoint cluster region exhibiting length variation in fragile X syndrome. Cell 65, 905–914. [DOI] [PubMed] [Google Scholar]
- Vreugdenhil M, Jefferys JG, Celio MR and Schwaller B (2003) Parvalbumin-deficiency facilitates repetitive IPSCs and gamma oscillations in the hippocampus. J Neurophysiol 89, 1414–1422. [DOI] [PubMed] [Google Scholar]
- Wang J, Barstein J, Ethridge LE, Mosconi MW, Takarae Y and Sweeney JA (2013) Resting state EEG abnormalities in autism spectrum disorders. J Neurodev Disord 5, 24. [DOI] [PMC free article] [PubMed] [Google Scholar]
- Wang J, Ethridge LE, Mosconi MW, White SP, Binder DK, Pedapati EV, Erickson CA, Byerly MJ and Sweeney JA (2017) A resting EEG study of neocortical hyperexcitability and altered functional connectivity in fragile X syndrome. J Neurodev Disord 9, 11. [DOI] [PMC free article] [PubMed] [Google Scholar]
- Wen TH, Afroz S, Reinhard SM, Palacios AR, Tapia K, Binder DK, Razak KA and Ethell IM (2018) Genetic Reduction of Matrix Metalloproteinase-9 Promotes Formation of Perineuronal Nets Around Parvalbumin-Expressing Interneurons and Normalizes Auditory Cortex Responses in Developing Fmr1 Knock-Out Mice. Cereb Cortex 28, 3951–3964. [DOI] [PMC free article] [PubMed] [Google Scholar]
- Wen TH, Lovelace JW, Ethell IM, Binder DK and Razak KA (2019) Developmental Changes in EEG Phenotypes in a Mouse Model of Fragile X Syndrome. Neuroscience 398, 126–143. [DOI] [PMC free article] [PubMed] [Google Scholar]
- Woo CC and Leon M (2013) Environmental enrichment as an effective treatment for autism: a randomized controlled trial. Behav Neurosci 127, 487–497. [DOI] [PubMed] [Google Scholar]
- Xenos D, Kamceva M, Tomasi S, Cardin JA, Schwartz ML and Vaccarino FM (2018) Loss of TrkB Signaling in Parvalbumin-Expressing Basket Cells Results in Network Activity Disruption and Abnormal Behavior. Cereb Cortex 28, 3399–3413. [DOI] [PMC free article] [PubMed] [Google Scholar]
- Yamada J, Ohgomori T and Jinno S (2015) Perineuronal nets affect parvalbumin expression in GABAergic neurons of the mouse hippocampus. Eur J Neurosci 41, 368–378. [DOI] [PubMed] [Google Scholar]
- Yan QJ, Asafo-Adjei PK, Arnold HM, Brown RE and Bauchwitz RP (2004) A phenotypic and molecular characterization of the fmr1-tm1Cgr fragile X mouse. Genes Brain Behav 3, 337–359. [DOI] [PubMed] [Google Scholar]
- Yan QJ, Rammal M, Tranfaglia M and Bauchwitz RP (2005) Suppression of two major Fragile X Syndrome mouse model phenotypes by the mGluR5 antagonist MPEP. Neuropharmacology 49, 1053–1066. [DOI] [PubMed] [Google Scholar]
- Zheng K, An JJ, Yang F et al. (2011) TrkB signaling in parvalbumin-positive interneurons is critical for gamma-band network synchronization in hippocampus. Pro Natl Acad Sci USA 108, 17201–17206. [DOI] [PMC free article] [PubMed] [Google Scholar]
Associated Data
This section collects any data citations, data availability statements, or supplementary materials included in this article.