Abstract
The Rag GTPases (Rags) recruit mTORC1 to the lysosomal membrane in response to nutrients, where it is then activated in response to energy and growth factor availability. The lysosomal folliculin (FLCN) complex (LFC) consists of the inactive Rag dimer, the pentameric scaffold Ragulator, and the FLCN:FNIP2 (FLCN-interacting protein 2) GTPase activating protein (GAP) complex, and prevents Rag dimer activation during amino acid starvation. How the LFC is disassembled upon amino acid refeeding is an outstanding question. Here we show that the cytoplasmic tail of the human lysosomal solute carrier family 38 member 9 (SLC38A9) destabilizes the LFC and thereby triggers GAP activity of FLCN:FNIP2 toward RagC. We present the cryo-EM structures of Rags in complex with their lysosomal anchor complex Ragulator and the cytoplasmic tail of SLC38A9 in the pre and post GTP hydrolysis state of RagC, which explain how SLC38A9 destabilizes the LFC and so promotes Rag dimer activation.
The mechanistic target of rapamycin complex 1 (mTORC1) couples cell growth to nutrient, energy and growth factor availability1–3. mTORC1 is recruited to the lysosomal membrane when amino acids are replete via the Rag guanosine triphosphatases (GTPases)4–6. Unlike other small GTPases, Rags exist as obligate heterodimers of functionally redundant RagA or B in complex with functionally redundant RagC or D. They exist in two stable states, an inactive (RagA or BGDP:RagC or DGTP) and active (RagA or BGTP:RagC or DGDP) state, during low and high cellular amino acid levels, respectively4,5. Rags interact with the pentameric scaffold Ragulator, which serves as a lysosomal anchor through the lipidation of one of its subunit7,8. Whereas inactive Rags fail to recruit mTORC1, active Rags directly bind to the mTORC1 subunit Raptor and so recruit it to the lysosomal membrane9,10.
The lysosomal membrane protein SLC38A9 is both an amino acid transporter and an Arg-dependent Rag activator11–15. The N-terminal cytoplasmic tail of SLC38A9 (residues 1–119, hereafter, SLC38A9NT) is not required for amino acid transport itself, but it is sufficient to interact with inactive Rags and stimulate mTORC1 activity11,12,16. The N-terminal tail is sequestered in the absence of bound Arg but is liberated and available to bind to Rags in its absence16,17, suggesting a mechanism for amino acid-dependent regulation of Rag GTPases. It has been reported that the SLC38A9 N-terminal tail regulates the Rags directly by serving as a GEF for RagA18. However, we previously found that RagA spontaneously exchanges GDP to GTP, raising the question as to whether a GEF is required in this pathway. Spontaneous nucleotide exchange by RagA is blocked, however, when the Rags are bound in the LFC19.
FLCN GAP activity20, which is blocked in the LFC19,21, is essential for the downregulation of TFE3, a member of the MiT/TFE family of transcription factors controlling lysosomal biogenesis and autophagy19,22–26. Taken together, the LFC both blocks FLCN GAP activity and prevents spontaneous nucleotide exchange by RagA. These observations suggested the hypothesis that disassembly of the LFC is a prerequisite for Rag activation by amino acids, particularly in respect to the mTORC1-dependent downregulation of the MiT/TFE family of transcription factors27,28. Here we show that the cytoplasmic tail of SLC38A9 triggers FLCN GAP activity toward RagC by destabilization of the LFC. We solved the cryo electron microscopy (cryo-EM) structures of Rags in complex with Ragulator and SLC38A9NT in the pre and post GTP hydrolysis state of RagC and discuss their implications on the current model of Rag activation.
Results
SLC38A9NT triggers FLCN GAP activity
We reconstituted a complex comprising Ragulator, inactive Rags and SLC38A9NT from purified components and tested the effect of SLC38A9NT on the FLCN:FNIP2 GAP activity toward RagC (Fig. 1a–c). To individually control the nucleotides bound to RagA and RagC, xanthosine-specific RagC was used throughout this study (RagCD181N)8. FLCN:FNIP2 GAP activity toward RagC was enhanced in the presence of SLC38A9NT, consistent with a positive role in Rag activation. In the presence of SLC38A9NT, RagC-bound XTP was undetectable (Fig. 1c). We termed the complex of inactive Rag-Ragulator with SLC38A9NT the ‘pre-GAP complex’. To assess if SLC38N9NT can actively disassemble the LFC to form the pre-GAP complex, we added SLC38A9NT to a pre-formed LFC and analyzed the resulting complexes after overnight incubation via size exclusion chromatography (SEC) (Fig. 1d). After addition of SLC38A9NT, the peak at 9.7 ml corresponding to the LFC (Fig. 1d, green triangle) is virtually gone (Fig. 1d, yellow trace). Instead, two peaks at 10.5 ml and 11.2 ml are present, which correspond respectively to the isolated FLCN:FNIP2 complex (10.5 ml) and the pre-GAP Rag-Ragulator complex bound to SLC38A9NT (11.2 ml). Taken together, these data show that SLC38A9NT can disassemble the LFC, ultimately triggering FLCN GAP activity toward RagC.
Fig. 1: SLC38A9NT triggers FLCN GAP activity and disassembles the LFC.
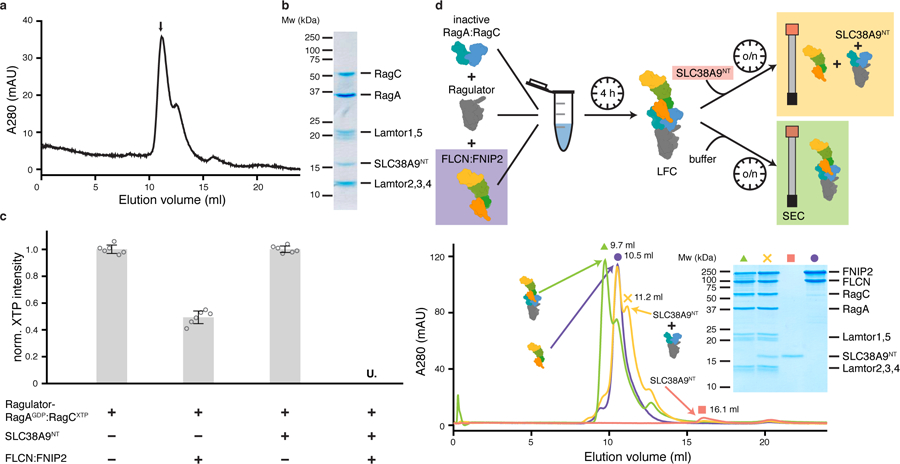
a, SEC profile of the reconstituted SLC38A9NT-RagAGDP:RagCXTPγS-Ragulator complex. XTPγS, non-hydrolyzable XTP analogue. b, SDS-PAGE analysis of the peak fraction indicated in a. c, HPLC-based RagC XTPase assay to measure FLCN GAP activity. Plotted are the mean ± standard deviation (SD) and individual data points of two independent experiments with technical triplicates each (n=6). U. means XTP signal was undetectable; norm., normalized; XTP, xanthosine tri-phosphate serving as a GTP analogue. d, LFC disassembly by SLC38A9NT shown by size exclusion chromatography (SEC). The experimental setup is illustrated (top) and the respective SEC traces and SDS-PAGE analysis it shown (bottom). Green (triangle), LFC; yellow (cross), LFC + SLC38A9NT; red (square), SLC38A9NT in isolation; purple (circle), FLCN:FNIP2 in isolation. Note that in the SDS-PAGE analysis, FLCN:FNIP2 can be detected in the same fraction as the pre-GAP complex because of peak overlap due to the very similar molecular weight of FLCN:FNIP2 and the pre-GAP complex (~187 kDa vs. ~170 kDa) (yellow cross). The presence of SLCN38A9NT in this fraction can only be explained by the fact that it is bound to Ragulator-Rag, as it elutes at 16.1 ml in isolation (red square). Uncropped gel images for panel b and d are shown in the Source Data. Data for graphs in a, c and d are available as source data online.
Structure of the pre-GAP complex
To unravel the molecular mechanism of FLCN:FNIP2 GAP activation by SLC38A9NT, we determined the structure of the pre-GAP complex (Ragulator-RagAGDP:RagCXTPγS-SLC38A9NT) (Figs. 1a, b and 2a) by single-particle cryo-EM. The structure of this ~170 kDa complex was resolved at an overall resolution of 3.2 Å (Fig. 2b, Table 1 and Extended Data Fig. 1). Atomic models of the Ragulator and Rag subunits were readily placed into the density on the basis of previously solved structures19,29,30. The remaining unassigned density was located in the cleft between the two Rag G domains and could be assigned to the central portion of SLC38A9NT (residues 39–97) (Extended Data Fig. 2). The N and C-terminal portions of SLC38A9NT were not resolved, consistent with previous findings that these regions are not involved in Rag binding11.
Fig. 2: Cryo-EM structure of the pre-GAP complex.
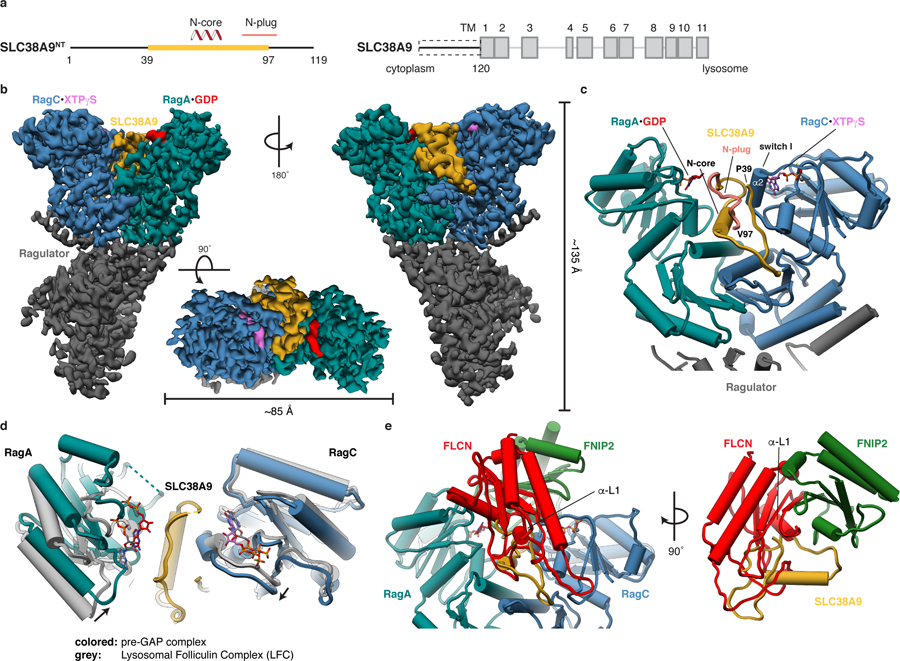
a, Domain organization of SLC38A9. The construct with structural annotations is shown (left, SLC38A9NT) in context of full-length SLC38A9 (right). Domain boundaries and cellular location of N and C-terminus are indicated. Yellow, resolved in the structure; Dashed box, used construct; TM, transmembrane helix. b, Cryo-EM density of the pre-GAP complex. c, Close-up of the SLC38A9-Rag interaction represented as pipes (α-helices) and planks (β-strands). d, Overlay of Rag GTPases from the pre-GAP complex (colored) with the LFC (grey). e, FLCN:FNIP2 (red, green) from the LFC overlaid onto the pre-GAP complex based on the alignment shown in d, illustrating resulting clashes. Rags are omitted for clarity (right).
Table 1:
Cryo-EM data collection, refinement and validation statistics
| Pre-GAP complex (EMD-21686, PDB 6JW2) | Post-GAP complex (EMD-21687, PDB 6WJ3) | |
|---|---|---|
| Data collection and processing | ||
| Magnification | 29,000 | 36,000 |
| Voltage (kV) | 300 | 200 |
| Electron exposure (e–/Å2) | 59 | 60.5 |
| Defocus range (μm) | −0.8 to −2.3 | −1.0 to −2.5 |
| Pixel size (Å) | 0.8522 | 1.137 |
| Symmetry imposed | C1 | C1 |
| Initial particle images (no.) | 1,419,155 | 2,309,565 |
| Final particle images (no.) | 129,553 | 106,659 |
| Map resolution (Å) | 3.2 | 3.9 |
| FSC threshold | 0.143 | 0.143 |
| Map resolution range (Å) | 2.6–11 | 3.4–11 |
| Refinement | ||
| Initial model used | PDB 6NZD | PDB 6WJ2 |
| Model resolution (Å) | 3.5 | 4.4 |
| FSC threshold | 0.5 | 0.5 |
| Map sharpening B factor (Å2) | −32.9 | local amplitude scaling |
| Model composition | ||
| Non-hydrogen atoms | 8,909 | 8,912 |
| Protein residues | 1,167 | 1,168 |
| Ligands | 1 GDP; 1 XTPγS (L8S); 1 Mg2+ | 1 GDP; 1 XDP (U3J) |
| B factors (Å2, min / max / avg) | ||
| Protein | 38.89 / 226.58 / 87.85 | 54.13 / 204.34 / 103.71 |
| Ligand | 49.91 / 65.12 / 57.44 | 96.98 / 113.93 / 105.46 |
| R.m.s. deviations | ||
| Bond lengths (Å) | 0.002 | 0.002 |
| Bond angles (°) | 0.454 | 0.484 |
| Validation | ||
| MolProbity score | 1.91 | 1.76 |
| Clashscore | 3.83 | 7.82 |
| Poor rotamers (%) | 2.81 | 0.00 |
| Ramachandran plot | ||
| Favored (%) | 94.05 | 95.20 |
| Allowed (%) | 5.95 | 4.71 |
| Disallowed (%) | 0.00 | 0.09 |
The ordered core and sole secondary structure element of SLC38A9NT is an α-helical stretch deeply buried in the G domain cleft directly contacting both Rag G and roadblock domains. SLC38A9NT then folds back on top of the N-core making direct contact with the GDP-bound nucleotide to RagA. The most N-terminal resolved residue (Pro39) is located directly adjacent to the RagC switch I helix (α2) (Fig. 2c), whose conformation depends on the nucleotide binding state of RagC. Thus, the interaction of SLC38A9NT with the Rags is intimately connected to their nucleotide binding state. SLC38A9NT contains within it the so-called N-plug, which is inserted into the transmembrane domain of SLC38A9 in the absence of arginine17.
The global architecture of the Ragulator-Rag subcomplex is unchanged compared to the one observed in the LFC but binding of SLC38A9NT has two effects. First, it leads to a slight inward rotation of both Rag G domains and second, it occupies the cleft between the Rag G domains (Fig. 2d). Together, these effects prevent binding of FLCN:FNIP2 in the GAP-incompetent conformation observed in the LFC as multiple loops and α-helix 1 of the FLCN longin domain (α-L1) would clash with SLC38A9NT and the RagA G domain, respectively (Fig. 2e). This explains how SLC38A9NT binding to Rags breaks up the LFC and drives FLCN:FNIP2 into the GAP-active conformation.
To gain further insight into the dynamics of the SLC38A9NT interaction with inactive Rags, we measured its hydrogen-deuterium exchange (HDX) in isolation and bound to inactive Rags. In isolation, SLC38A9NT shows high exchange rates (>50 %) throughout its entire sequence at the earliest time point tested, leading us to conclude the entire region is intrinsically disordered (Extended Data Fig. 3a). Consistent with the assignment from the cryo-EM structure, residues 37–97 of SLC38A9NT became partially protected from H-D exchange when bound to inactive Rags (Fig. 3a). Only residues 50–55 located in a solvent exposed loop were not significantly protected at any of the exchange times (Fig. 3b and Extended Data Fig. 3b). The α-helical N-core is strongly protected, with HDX differences >30 % even after 600 s (Fig. 3a, b and Extended Data Fig. 3b, c). Thus, the HDX results corroborate the cryo-EM structure and show that the order observed for SLC38A9NT is induced by formation of the complex.
Fig. 3: HDX-MS difference of SLC38A9NT reveals pre-GAP complex dynamics.

a, HDX difference plot of SLC38A9NT in complex with inactive Rags and in isolation at 6 s exchange time. Plotted are the mean ± SD of technical replicates (n=4). b, Uptake difference mapped onto SLC38A9NT in the pre-GAP complex structure. Boundaries of the N-core and the solvent exposed loop are indicated. c, Residues shown to be crucial for SLC38A9 function in vivo (red) mapped onto the pre-GAP complex structure. Data for graph in a is available as source data online.
The SLC38A9NT core harbors multiple residues shown to be crucial for the interaction with and activation of Rags in vivo11,12. Alanine mutations of residues Ile68, Tyr71 and Leu74, all located in the N-core, abolished the interaction with Rags12 (Fig. 3c). Mutation of residue His60 located at the solvent exposed start of the N-core had no influence on the interaction with Rags. Mutations of stretches located in the N-plug and the part interacting with RagC α2 also abolished the Rag interaction in vivo11 (Fig. 3c). The high consistency of the cryo-EM and HDX-MS results with the known biology of SLC38A9 mutants validates that the observed structure and dynamics correspond to the state relevant for Rag regulation in cells.
Structure of the post-GAP complex
Having shown that SLC38A9 is capable of disassembling the LFC and activating FLCN to generate the RagAGDP:RagCGDP intermediate, we considered how this complex might progress to the active RagAGTP:RagCGDP dimer. We found that SLC38A9NT, RagAGDP:RagCXDP and Ragulator form a complex that is stable on size exclusion chromatography (Fig. 4a, b) and will refer to it as the post-GAP complex. We used cryo-EM to solve its structure at an overall resolution of 3.9 Å (Fig. 4c, Table 1 and Extended Data Figs. 4 and 5). Aside from the difference in the nucleotide bound to RagC, clearly visible in density, the post-GAP complex structure is nearly identical to the pre-GAP complex structure (Cα r.m.s.d = 0.8 Å) (Fig. 4d, e). The RagC switch I region of the pre and post-GAP complexes are in the same conformation (Fig. 4f). In comparison, the structure of the mTORC1 subunit Raptor in complex with active Rags9, containing RagC bound to GDP as in the post-GAP complex, the RagC switch I region was disordered and could not be resolved (Fig. 4f). In fact, all other known Rag structures bound to GDP have at least partially disordered switch I regions compared to the respective GTP bound structure (Extended Data Fig. 6). This unusual switch I conformation is consistent with intrinsic tryptophan fluorescence data. Trp fluorescence reports on the conformational change of RagC switch I when transitioning from the GTP to the GDP-bound state19,31. Usually, this is triggered by GTP hydrolysis, but we could not detect a FLCN:FNIP2-induced change in RagC Trp fluorescence in the presence of SLC38A9NT, even though GTP hydrolysis was confirmed by the HPLC-based GTPase assay (Fig. 1c and Extended Data Fig. 7a). This observation can be explained by the unaltered RagC switch I conformation between the pre and post-GAP complex cryo-EM structures (Fig. 4d, f). Thus, the Trp fluorescence RagC GTPase assay corroborates the unexpected finding that the double GDP-bound Rag dimer is trapped in the inactive conformation by SLC38A9NT. We conclude that in the post-GAP complex, RagCGDP is uniquely trapped in the GTP conformation through its interaction with SLC38A9. We propose that the free energy stored by this abnormal strained conformation promotes SLC38A9 dissociation. This could occur upon some appropriate trigger, or might be spontaneous at cellular concentrations of these molecules. Furthermore, it cannot be excluded that the transmembrane part of SLC38A9 influences the interaction of SLC38A9NT with Rags in context of the full-length protein.
Fig. 4: Rag GTPases are trapped in the inactive conformation in the post-GAP complex.
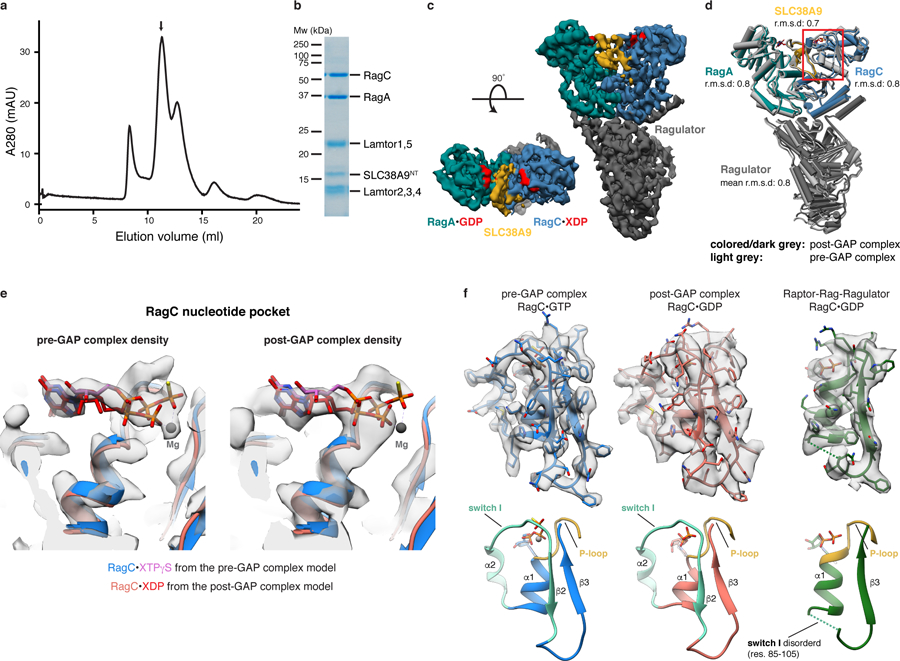
a, SEC profile of the reconstituted SLC38A9NT-RagAGDP:RagCXDP-Ragulator complex. XDP, xanthosine di-phosphate serving as a GDP analogue. b, SDS-PAGE analysis of the peak fraction indicated in a. c, Cryo-EM density of the post-GAP complex. d, Overlay of the post-GAP (dark grey, colored) and pre-GAP (light grey) complex structures represented as pipes and planks. The boxed (red) region is show in e and f. e, Overlay of the pre (blue/pink) and post-GAP (light red/red) complex models focused on the RagC nucleotide pocket. Cryo-EM densities of the pre (left) and post-GAP (right) complexes are compared to highlight the clear distinction between the bound XTPγS and XDP, respectively. f, RagC nucleotide binding region of the pre-GAP (left, blue), post-GAP (middle, red) and Raptor-Rag-Ragulator (right, green, PDB: 6U62, EMD-20660) complex structures and respective cryo-EM density (top). Below, canonical small GTPase elements involved in nucleotide binding are highlighted in the models. Uncropped gel image for panel b is shown in the Source Data. Data for graph in a is available as source data online.
SLC38A9 blocks RagA nucleotide exchange
Given that RagA spontaneously exchanges its nucleotide, that this reaction is inhibited by the LFC19, and that SLC38A9NT directly interacts with the GDP nucleotide bound to RagA suggesting a stabilization rather than destabilization of the nucleotide state, we revisited the report of RagA GEF activity by SLC38A9NT 18. We employed an HPLC-based nucleotide exchange assay to directly measure GTP and GDP bound to RagA. Irrespective of the RagC nucleotide state, spontaneous GDP to GTP exchange in RagA is reduced when SLC38A9NT is present compared to the respective Ragulator-Rag complex in the absence of SLC38A9NT (Fig. 5a). We confirmed this finding with a (2′ or 3′)-O-(N-methylanthraniloyl) (mant) GDP fluorescence-based nucleotide exchange assay where the detected mantGDP fluorescence signal decreases upon its release from Rags into the solution32 (Fig. 5b). These measurements show that SLC38A9NT is not a GEF for RagA but rather antagonizes nucleotide exchange.
Fig. 5: SLC38A9NT blocks spontaneous nucleotide exchange in RagA.
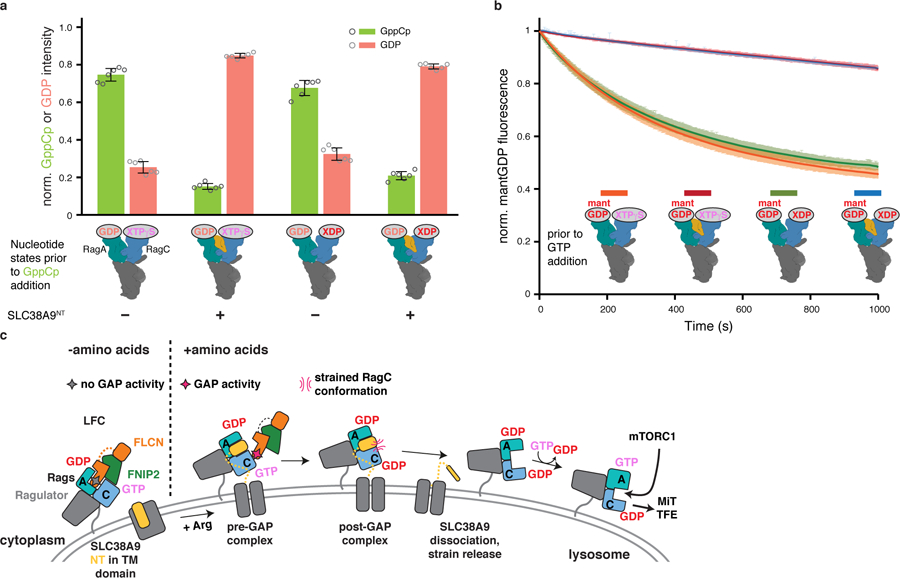
a, HPLC-based RagA nucleotide exchange assay. Amount of GppCp bound to RagA after the assay is illustrated in green, remaining GDP in red. The Rag nucleotide binding states prior to GppCp addition are indicated below the graph. Plotted are the mean ± SD and individual data points of two independent experiments with technical triplicates each (n=6). norm., normalized; GppCp, non-hydrolyzable GTP analogue. b, MantGDP fluorescence-based RagA nucleotide exchange assay of Ragulator-RagAmantGDP:RagCXTPγS or XDP in the absence (orange, green) and presence of SLC38A9NT (red, blue). Plotted is the mean ± SD mantGDP fluorescence at each time point of one experiment performed in quadruplicates (n=4). The experiment has been performed twice with similar results. norm., normalized; mantGDP, fluorescently labelled GDP analogue. c, Model for SLC38A9-mediated Rag GTPase activation and mTORC1 recruitment. NT, N-terminal domain; TM, transmembrane domain. Data for graphs in a and b are available as source data online.
Whereas the HPLC and fluorescence-based assays presented here directly detect the nucleotide bound to RagA in bulk, the cross-linking assay previously interpreted as evidence for SLC38A9NT GEF activity18 only detects a sub-population of radioactively labelled nucleotides after UV crosslinking. With the structures now available, the previous cross-linking data18 can be reinterpreted in a new light. In the pre-GAP complex, SLC38A9NT directly interacts with the RagC switch I region as well as the GDP nucleotide bound to RagA which would very likely impact the crosslinking efficiency of GDP to RagA (Extended Data Fig. 7b). Given the structures and the new biochemical data presented here, the cross-linking data18 are best explained by changes in the accessibility of the nucleotide, rather than exchange.
Discussion
The cleft between the G domains of the Rag GTPase heterodimer emerges as a regulatory platform with a total of three different protein (complexes) shown to directly bind in this region, namely FLCN:FNIP2, SLC38A9 and mTORC1 via the Raptor subunit9,10,19,21. Due to the overlapping binding sites, these interactions cannot occur simultaneously on a Rag heterodimer. The main factor that determines the availability of Rags for interaction with the respective binding partner, is their nucleotide binding state which is indirectly regulated by amino acids. We propose a model in which FLCN:FNIP2 binds to inactive Rag GTPases forming the LFC when amino acid levels are low. During this phase, the N-plug of the cytoplasmic tail of SLC38A9 occludes the arginine binding site of the SLC38A9 transmembrane domain making it unavailable for interaction with inactive Rag GTPases17. Upon increasing amino acid levels, arginine outcompetes N-plug binding in the transmembrane domain leading to LFC disassembly and resulting in activation of FLCN:FNIP2 GAP activity (Fig. 5c). Dissociation of SLC38A9 is likely facilitated by the release of conformational strain in RagC. Our in vitro data raise the possibility that an additional trigger could be involved SLC38A9 dissociation, although it might also occur spontaneously. SLC38A9 dissociation would then enable GDP to GTP exchange on RagA, generating the active Rag dimer. Activation of mTORC1 with respect to the MiT/TFE transcription factors would then lead to the inactivation of MiT/TFE-dependent transcription19,22,25,26, completing the chain of events.
Methods
Protein expression and Purification
RagA:RagCD181N GTPases (MBP tag on RagC) and Ragulator (GST tag on Lamtor1, His tag on Lamtor2) were expressed in Sf9 insect cells via baculovirus infection and purified as described in Su et al30. FLCN:FNIP2 and GATOR1 were expressed in HEK293-GNTI cells and purified as described in Lawrence et al19. In brief, Sf9 and HEK293-GNTI cells were resuspended and lysed in wash buffer (25 mM HEPES, 130 mM NaCl, 2.5 mM MgCl2, 2 mM EGTA, 0.5 mM TCEP, pH 7.4) supplemented with 1 % Triton X-100 and protease inhibitor (Roche, 1 tablet per 100 ml lysis buffer) by gentle rocking at 4 ˚C for 20 min. Lysate was cleared by centrifugation at 30,000 x g and 4 ˚C for 45 min. For RagA:RagCD181N, the supernatant (SN) was applied to amylose resin (NEB), washed with wash buffer (± 200 mM NaCl) and eluted by overnight (o/n) on-column TEV protease (home-made) cleavage. For Ragulator, the SN was applied to Ni-NTA resin (Thermo Scientific), washed with wash buffer (± 200 mM NaCl) and eluted with wash buffer + 250 mM imidazole. The eluate was applied to glutathione resin (GE Healthcare), washed with wash buffer (± 200 mM NaCl) and eluted by o/n on-column TEV protease cleavage. For FLCN:FNIP2 and GATOR1, the SNs were applied to glutathione resin, washed with wash buffer (± 200 mM NaCl, ± 0.1 % CHAPS) and eluted by o/n on-column TEV protease cleavage. All final eluates were concentrated using spin filters (Millipore Sigma) and purified to homogeneity via size exclusion chromatography (SEC) equilibrated with wash buffer.
Codon-optimized DNA coding for SLC38A9NT was cloned into a pCAG-GST vector for expression in HEK293-GNTI cells. HEK293-GNTI cells were transfected with 1 mg DNA and 3 mg PEI (Sigma-Aldrich) per liter of cells at a density of 1.3–1.8E6 cells/ml. Cells were harvested after 48–72 h, resuspended and lysed in wash buffer supplemented with 1 % Triton X-100 and protease inhibitor as described above. After clarification of the lysate by centrifugation (see above), the SN was applied to glutathione resin and incubated for 2 h at 4 ˚C. The resin was washed consecutively with wash buffer supplemented with 1 % Triton X-100, 1 % Triton X-100 and 200 mM NaCl and 0.1 % CHAPS, respectively. Immobilized GST-SLC38A9NT was eluted from the resin by o/n TEV protease cleavage. The eluate was concentrated using spin filters and purified to homogeneity via SEC using a Superdex 75 column (GE Healthcare) equilibrated with wash buffer.
Purified proteins were aliquoted and flash frozen in liquid N2 and stored at −80 ˚C until use.
Rag GTPase nucleotide loading
Rags were first loaded with the respective triphosphate (GTP for RagA, XTP for RagC), non-hydrolyzable triphosphate analogue (XTPγS for RagC) or mant triphosphate (mantGTP for RagA) by diluting purified Rags at least 1:10 (v/v) into calcium and magnesium-free PBS and incubating them for 10 min at room temperature (RT) in the presence of 5 mM EDTA. Then, a 10x molar excess (over Rags) of the respective nucleotides were added. After a 30 min incubation at RT, MgCl2 was added to a final concentration of 20 mM. Unbound nucleotides were removed by buffer exchange into wash buffer using a PD-10 gravity flow column (GE Healthcare). Triphosphate loaded Rags were then concentrated using a spin filter to at least 1 mg/ml. If diphosphate loading (GDP or mantGDP for RagA, XDP for RagC) was desired, the respective triphosphate loaded Rags were treated with the respective GAP (GATOR1 for RagA, FLCN:FNIP2 for RagC) for 30 min at 37 ˚C at a ratio of 200:1 (GATOR1) or 100:1 (FLCN:FNIP2). Correct loading of Rags was confirmed by high-pressure liquid chromatography (HPLC) analysis as described below. Loaded Rags were used for experiments performed on the same day as the loading reaction.
Pre and post-GAP complex assembly
Loaded Rags were incubated with a 1.2x molar excess of Ragulator and SLC38A9NT for 30 min at 4 ˚C. For cryo-EM samples, the assembled complex was injected onto a Superdex 200 column (GE Healthcare) equilibrated with wash buffer. Peak fractions containing all complex components judged by SDS-PAGE analysis were pooled and concentrated using spin filters.
LFC disassembly experiment
RagAGDP:RagCXTPγS (9 µM) were incubated with a 1.2x molar excess of Ragulator and FLCN:FNIP2 for 4 h at 4 ˚C to form the lysosomal folliculin complex (LFC). The sample was split in half and a 1.2x molar excess of SLC38A9NT or the same volume of wash buffer were added respectively. After incubation overnight, both samples were applied to a Superdex 200 Increase (GE Healthcare) column. FLCN:FNIP2 and SLC38A9NT were also applied to the same Superdex 200 Increase column individually to serve as a reference.
Cryo-EM grid preparation and imaging
For pre-GAP complex cryo-EM, 3 μl of sample (0.25 mg/ml) were applied to freshly glow-discharged (PELCO easiGlow, 45 s in air at 20 mA and 0.4 mbar) UltrAuFoil R1.2/1.3 grids (Ted Pella). Grids were plunged into liquid ethane using an FEI Vitrobot Mark IV after 2 s blot time with the relative blot force set to −3, humidity to 100 % and temperature to 4 ˚C. For post-GAP complex cryo-EM, 3 μl of sample (0.5 mg/ml) were applied to freshly glow-discharged (see above) C-flat 2/1–3C-T grids (Electron Microscopy Sciences) and plunged into liquid ethane after 2 s blot time with relative blot force set to 21, humidity to 100 % and temperature to 4 ˚C.
Data acquisition parameters are summarized in Table 1. Data for the pre-GAP complex structure was acquired on a Titan Krios electron microscope (Thermo Fisher Scientific) operated at 300 kV, equipped with a Gatan K3 direct electron detector operating in super-resolution mode and a 100 μm objective aperture inserted. Automated movie acquisition with a 3×3 image shift pattern (9 movies per target/focus) was performed using SerialEM33 with a nominal defocus range of −0.8 to −2.3 μm and a calibrated pixel size of 0.8522 Å. A total of 8,315 movies (59 frames per movie) were acquired with a total dose of 59 e−/Å2 over a 2.1 s exposure. Data for the post-GAP complex structure was acquired on a Talos Arctica electron microscope (Thermo Fisher Scientific) operated at 200 kV, equipped with a Gatan K3 direct electron detector operating in super-resolution mode and a 100 μm objective aperture inserted. Automated movie acquisition with cross-pattern image shift (5 movies per target/focus) was performed using SerialEM with a nominal defocus range of −1.0 to −2.5 μm and a calibrated pixel size of 1.137 Å. A total of 2,160 movies (55 frames per movie) were acquired with a total dose of 60.5 e−/Å2 over a 5.7 s exposure.
Cryo-EM data processing
The cryo-EM data processing work-flows are depicted in Extended Data Fig. 1d (pre-GAP complex) and Extended Data Fig. 4d (post-GAP complex). Super-resolution movies were motion and gain corrected using the Relion334 MotionCor235 wrapper and binned 2x by Fourier cropping. Empty micrographs and micrographs with high levels of contamination or crystalline ice were discarded during visual screening of all micrographs. Pre-GAP complex particles were picked using crYOLO36 with the provided PhosaurusNet model (JANNI). Post-GAP complex particles were first selected reference-free from a random subset of micrographs using gautomatch-v0.53 (http://www.mrc-lmb.cam.ac.uk/kzhang/). After 2D classification in cryoSPARC v237, 8 selected classes were used for template-based autopicking in Relion3. Per-micrograph CTF determination was carried out using CTFFIND4.1.1338. All particle extractions as well as 3D classification, per-particle CTF determination39 and Bayesian particle polishing40 were carried out in Relion3. All 2D classifications, ab-Initio reconstructions, heterogeneous, homogeneous and non-uniform41 refinements were carried out in cryoSPARC v2. Throughout the data processing workflow, particles were discarded from further processing based on 2D classification (obvious ‘junk’) and 3D classification or heterogeneous refinement (incomplete or broken complexes). In a final particle selection step for the pre-GAP complex, heterogeneous refinement was performed against in silico generated reference maps of the complex with and without SLC38A9 bound to the cleft to enrich for particles which had SLC38A9 bound. To avoid template bias, a preliminary coordinate model on which the in silico generated reference maps where based on was generated based on the 3D reconstruction just before heterogeneous refinement (i.e. from the data itself). Furthermore, after the first round of heterogeneous refinement, a second round followed, this time using the 3D reconstructions form the first round instead of the in silico generated maps. During this process, the nominal resolution (FSC 0.143) dropped from 3.15 to 3.26 Å, most likely owed to the 36 % reduction in absolute particle numbers. In spite of the small decline in nominal resolution, the density for the SLC38A9NT part of the map still visually improved (Extended Data Fig. 1d).
For the pre-GAP complex, higher order aberration correction was performed in the final homogeneous refinement with one exposure group per image shift position. The final refinement run for the post-GAP structure was a non-uniform refinement. CryoSPARC v2 database files were converted into Relion star files using UCSF pyem42 and in-house written scripts (https://github.com/simonfromm/miscEM).
Density of the pre-GAP complex has been modified using Phenix ResolveCryoEM43 followed by autosharpening as implemented in Phenix44. Density of the post-GAP complex has been modified and sharpened locally using LocScale45 as implemented in the CCP-EM software suite46.
All stated resolutions are according to the 0.143 cutoff of the respective gold-standard FSC47. Density maps used for atomic coordinate refinement and illustration in all figures along with the respective half maps and masks used during refinement and FSC calculation have been deposited in the Electron Microscopy Data Bank (EMDB) with accession codes EMD-21686 (pre-GAP complex) and EMD-21687 (post-GAP complex).
Atomic model building and refinement
For the pre-GAP complex coordinate model, coordinates of all five Ragulator subunits as well as RagA and RagC are based on the LFC structure (pdb 6NZD) and were rigid body fitted separately into the pre-GAP complex density map using UCSF Chimera48. SLC38A9NT was manually build de novo in Coot49. Atomic coordinates were refined by iteratively performing Phenix real-space refinement and manual inspection and correction of the refined coordinates in Coot. To avoid overfitting, the map weight was set to 1.0 and secondary structure restraints were enabled during automated real-space refinement. In regions with low map quality, mainly located in solvent exposed parts of the Lamtor1 subunit of Ragulator, side-chain atoms were truncated to alanine (Extended Data Fig. 2c). Agreement of the final model with the experimental density was assessed by calculation of a model-map FSC (Extended Data Fig. 2a). To assess potential overfitting, a cross-validation test in which the refined model coordinates were randomly displaced by an average of 0.5 Å and re-refined against half map 1 of the final 3D reconstruction using Phenix real-space refinement with the same parameters used in the coordinate refinement described above. Model-map FSCs of the coordinates re-refined against half map 1 were calculated using the same half map (FSC work) and half map 2 (FSC test). No overfitting could be detected (Extended Data Fig. 2b). The final model was validated using Phenix comprehensive validation including MolProbity50 and EMRinger51 analysis.
The post-GAP complex coordinate model was based on the previously refined pre-GAP coordinate model. After rigid body fitting using UCSF Chimera, coordinates were refined following the protocol described above for the pre-GAP complex with the map weight set to 0.5 during automated real-space refinement to reflect the lower resolution of the density. Model assessment and validation was performed as described for the pre-GAP complex (Extended Data Fig. 5).
All model and validation parameters of the pre and post-GAP coordinate models are summarized in Table 1. Coordinate models have been deposited in the Protein Data Bank (PDB) with accession codes 6WJ2 (pre-GAP complex) and 6WJ3 (post-GAP complex), respectively.
Hydrogen deuterium exchange mass spectrometry
Amide hydrogen exchange was carried out at 30 ˚C for 6, 60, 600 and 60,000 s, respectively by diluting 5 μl of 5 μM SLC38A9NT or SLC38A9NT-RagAGDP:RagCXTPγS with 95 μl deuteration buffer (20 mM HEPES pD 7.4, 130 mM NaCl, 2.5 mM MgCl2, 0.5 mM TCEP, 92.8 % total D2O content). The reaction was stopped after the respective exchange time by addition of 100 μl ice cold quench buffer (0.4 M KH2PO4/H3PO4, pH 2.2) and immediately flash frozen in liquid N2. All exchange reactions were carried out in triplicate or quadruplicate and stored at −80 ˚C until HPLC-MS analysis. Undeuterated reference samples were prepared the same way using wash buffer instead of deuteration buffer. Frozen samples were thawed just prior to injection onto a chilled HPLC setup with in-line peptic digestion and eluted from a BioBasic KAPPA 5 μm Capillary HPLC column (Thermo Fisher Scientific), equilibrated in buffer A (0.05 % TFA), using a 10–90 % gradient of buffer B (0.05 % TFA, 90 % acetonitrile) over 24 min. Desalted peptides were eluted directly onto an Orbitrap Discovery mass spectrometer (Thermo Fisher Scientific) operated with a 3.4 kV spray, 37 V capillary and 120 V tube-lens voltage. The HPLC system was extensively cleaned between samples. Initial peptide identification was performed with undeuterated samples via tandem MS/MS experiments. A Proteome Discoverer 2.1 (Thermo Fisher Scientific) search was used for peptide identification and coverage analysis against entire complex components, with precursor mass tolerance ± 10 ppm and fragment mass tolerance of ± 0.6 Da. Mass analysis of the peptide centroids was performed using HDExaminer (Sierra Analytics), followed by manual verification of each peptide.
HPLC nucleotide analysis
For analysis and quantification of nucleotides bound to Rags, 20 μl of at least 1.0 mg/ml Rags were denatured by incubation at 95 ˚C for 5 min and pelleted by centrifugation for 10 min at 21,000 x g. Released nucleotides in the SN were injected onto an HPLC system with a ZORBAX Eclipse XDB-C18 column (Agilent Technologies). Nucleotides were eluted with HPLC buffer (10 mM tetra-n-butylammonium bromide, 100 mM potassium phosphate pH 6.5, 7.5 % acetonitrile) and detected by absorbance at 260 nm. The area under the peak for quantification was calculated with the Agilent Open Lab CDS ChemStation software operating the HPLC system.
HPLC RagC GTPase assay
The assay was carried out twice with triplicates each in a final volume of 25 μl with 13.5 μM Rags and a 1.2x molar excess of Ragulator and SLC38A9NT. The GTPase reaction was started by addition of FLCN:FNIP2 or buffer to Rags, Ragulator and optionally SLC38A9NT to yield a final FLCN:FNIP2 to Rag ratio of 1:100. Prior to addition of FLCN:FNIP2, the mixed proteins were incubated for 30 min at 4 ˚C to ensure complete complex formation. After addition of FLCN:FNIP2, samples were incubated for 30 min at 37 ˚C. Bound nucleotides after the reaction were analyzed by HPLC as described above. Integrated XTP signal intensity was normalized to the mean of the respective sample without FLCN:FNIP2 addition. Plotted are the mean, standard deviation and each individual data point for each sample.
HPLC RagA nucleotide exchange assay
The assay was carried out twice with triplicates each in a final volume of 25 μl with 14.6 μM Rags and a 1.2x molar excess of Ragulator and SLC38A9NT. Nucleotide exchange was started by the addition of 10 μl of non-hydrolyzable GTP analogue (GppCp) to Rags, Ragulator and optionally SLC38A9NT to yield a final 1.2x molar excess of GppCp over Rags. Prior to addition of GppCp, the mixed proteins were incubated for 30 min at 4 ˚C to ensure complete complex formation. After GppCp addition, samples were incubated for 30 min at RT. Unbound nucleotides were removed after the reaction by buffer exchange into wash buffer using a Zeba spin desalting column (Thermo Fisher Scientific). Bound nucleotides were analyzed by HPLC as described above. Integrated GppCp and GDP signal intensity was normalized to the mean sum of the GppCp and GDP signal of the respective sample. Plotted are the mean, standard deviation and each individual data point for each sample.
Tryptophan fluorescence RagC GTPase assay
Fluorimetry experiments were performed in quadruplicates using a FluoroMax-4 instrument (Horiba) and a quartz cuvette compatible with magnetic stirring (Starna Cells) and a 10 mm pathlength. The Trp fluorescence signal was collected using 297 nm excitation (1.5 nm slit) and 340 nm emission (20 nm slit). Experiments were performed in wash buffer at RT with stirring. The final concentration of Rags was 350 nM. 500 μl of wash buffer were added to the cuvette and after baseline equilibration, 20 μl of a protein mixture containing Rags, 1.2x molar excess of Ragulator and with or without 1.2x molar excess of SLC38A9NT were added. After signal equilibration, the assay was started by addition of 20 μl FLCN:FNIP2 to a final concentration 35 nM and the fluorescence signal was recorded in 1 s intervals for 1,800 s. The signal prior to FLCN:FNIP2 addition was used for baseline subtraction and subsequently normalized to the signal right after FLCN:FNIP2 addition. This served also as the t=0 time point. Plotted are the mean and standard deviation of each time point.
RagA mantGDP nucleotide exchange assay
The assay was carried out with the same instrument and cuvette as the tryptophan fluorescence RagC GTPase assay in quadruplicates (see above). Mant fluorescence was collected using a 360 nm excitation (10 nm slit) and 440 nm emission (10 nm slit). Experiments were performed in wash buffer at RT with stirring. The final concentration of Rags was 100 nM. 500 μl of wash buffer were added to the cuvette and after baseline equilibration, 20 μl of a protein mixture containing Rags, 1.2x molar excess of Ragulator and with or without 1.2x molar excess of SLC38A9NT were added. After signal equilibration, the assay was started by addition of 20 μl of GTP to a final concentration of 10 μM (100x molar excess over Rags) and fluorescence was measured in 1 s intervals for 1,000 s. The signal prior to protein mixture addition was used for baseline subtraction and subsequently normalized to the signal right after GTP addition. This served also as the t=0 time point. Plotted are the mean and standard deviation of each time point.
Extended Data
Extended Data Fig. 1. Pre-GAP complex cryo-EM structure determination.
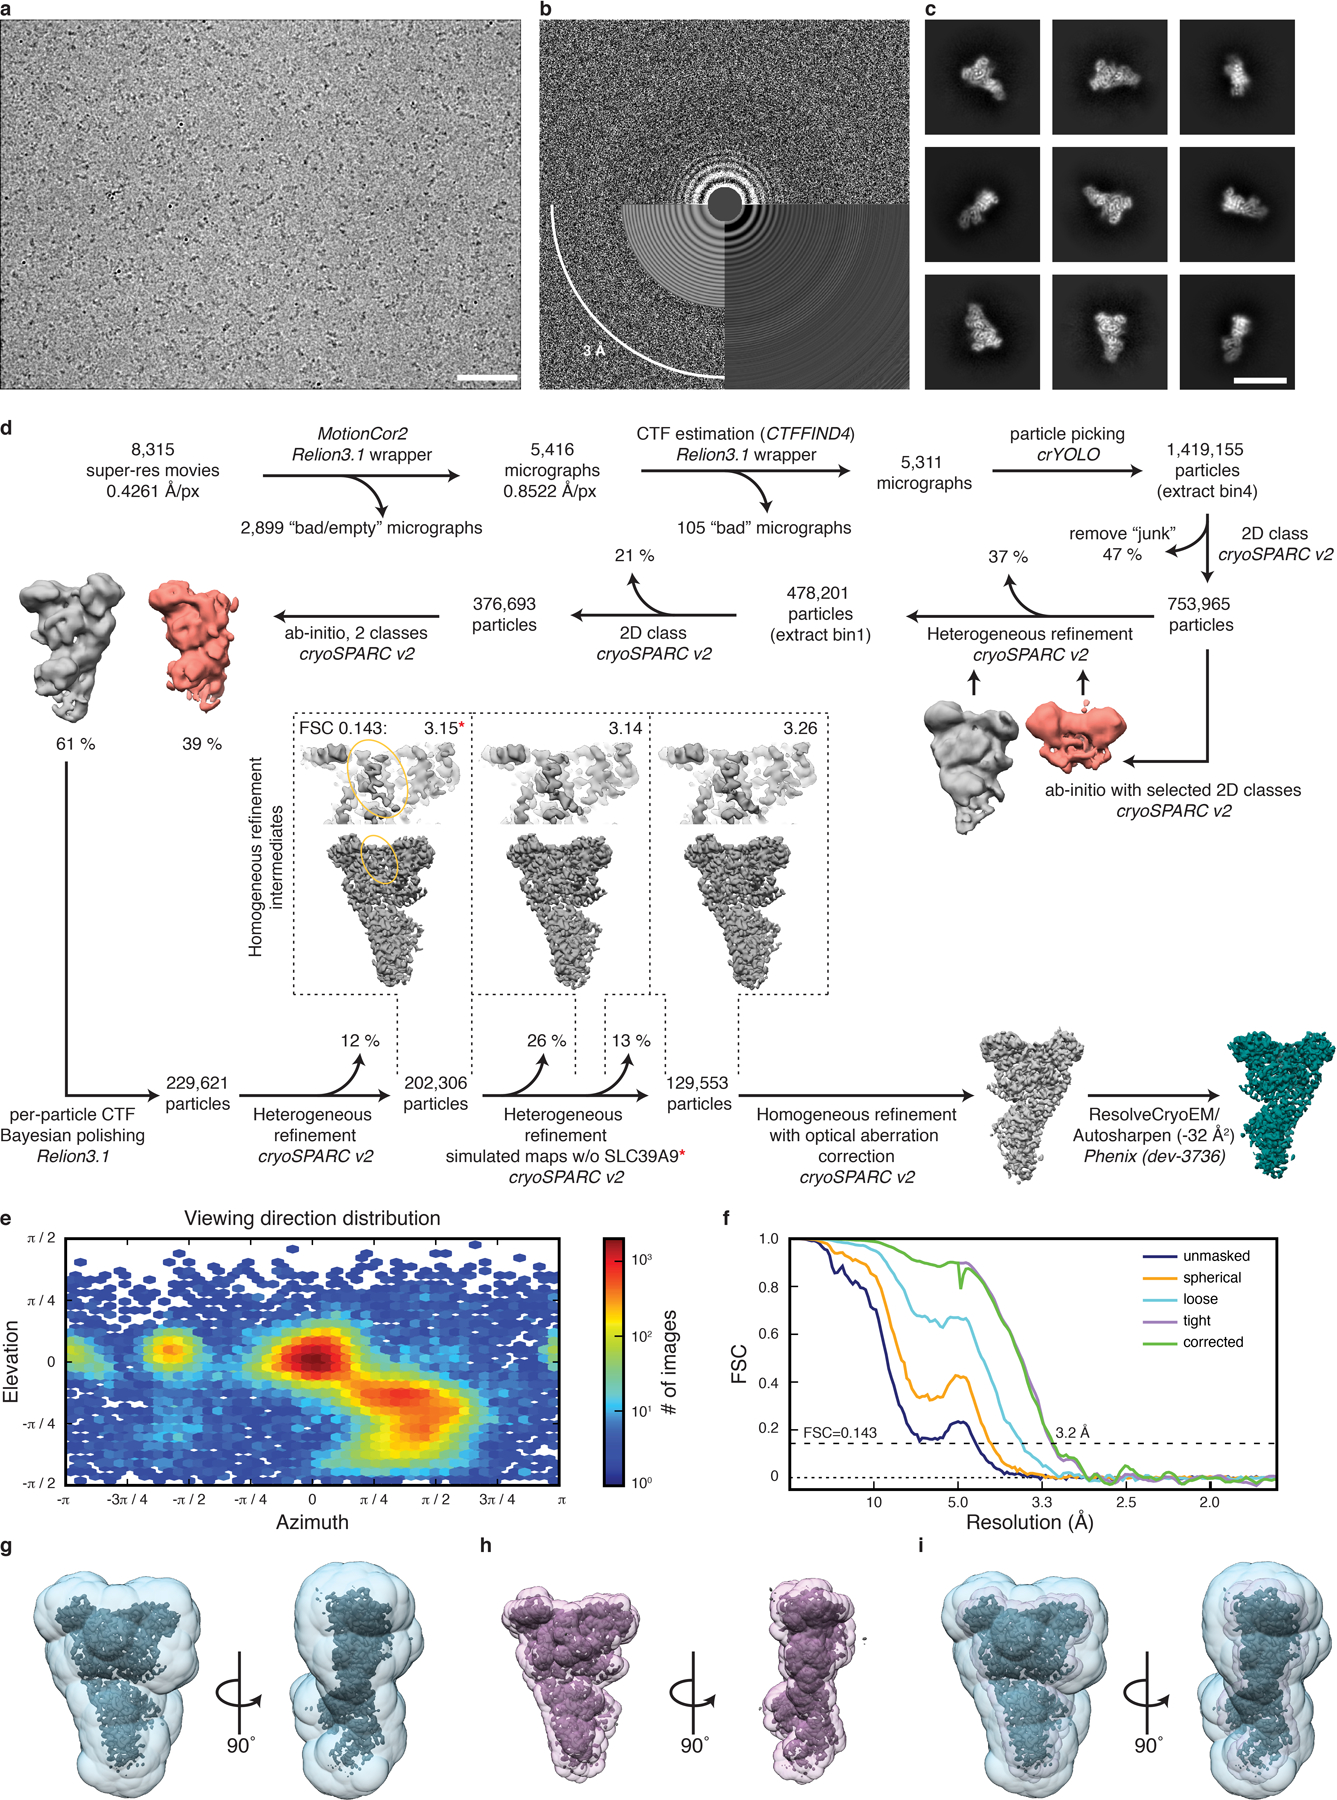
a, Exemplary raw cryo-EM micrograph at −2.2 m defocus. Scale bar 50 nm. b, Power spectrum of micrograph shown in a with CTF estimation. c, Exemplary 2D class averages. Scale bar 150 Å. d, Cryo-EM data processing workflow. Used software is indicated with italic font. Red asterisk indicates the map used for model building to subsequently generate simulated maps w/o SLC38A9. e, Particle orientation distribution of the final particle set. f, Fourier shell correlation (FSC) of the final 3D reconstruction. g–h, Overlay of the final density map with the masks used during refinement (g, blue, transparent), FSC calculation (h, pink, transparent). i, Both masks from g and h overlaid with the final density map.
Extended Data Fig. 2. Pre-GAP complex atomic coordinate building and refinement.
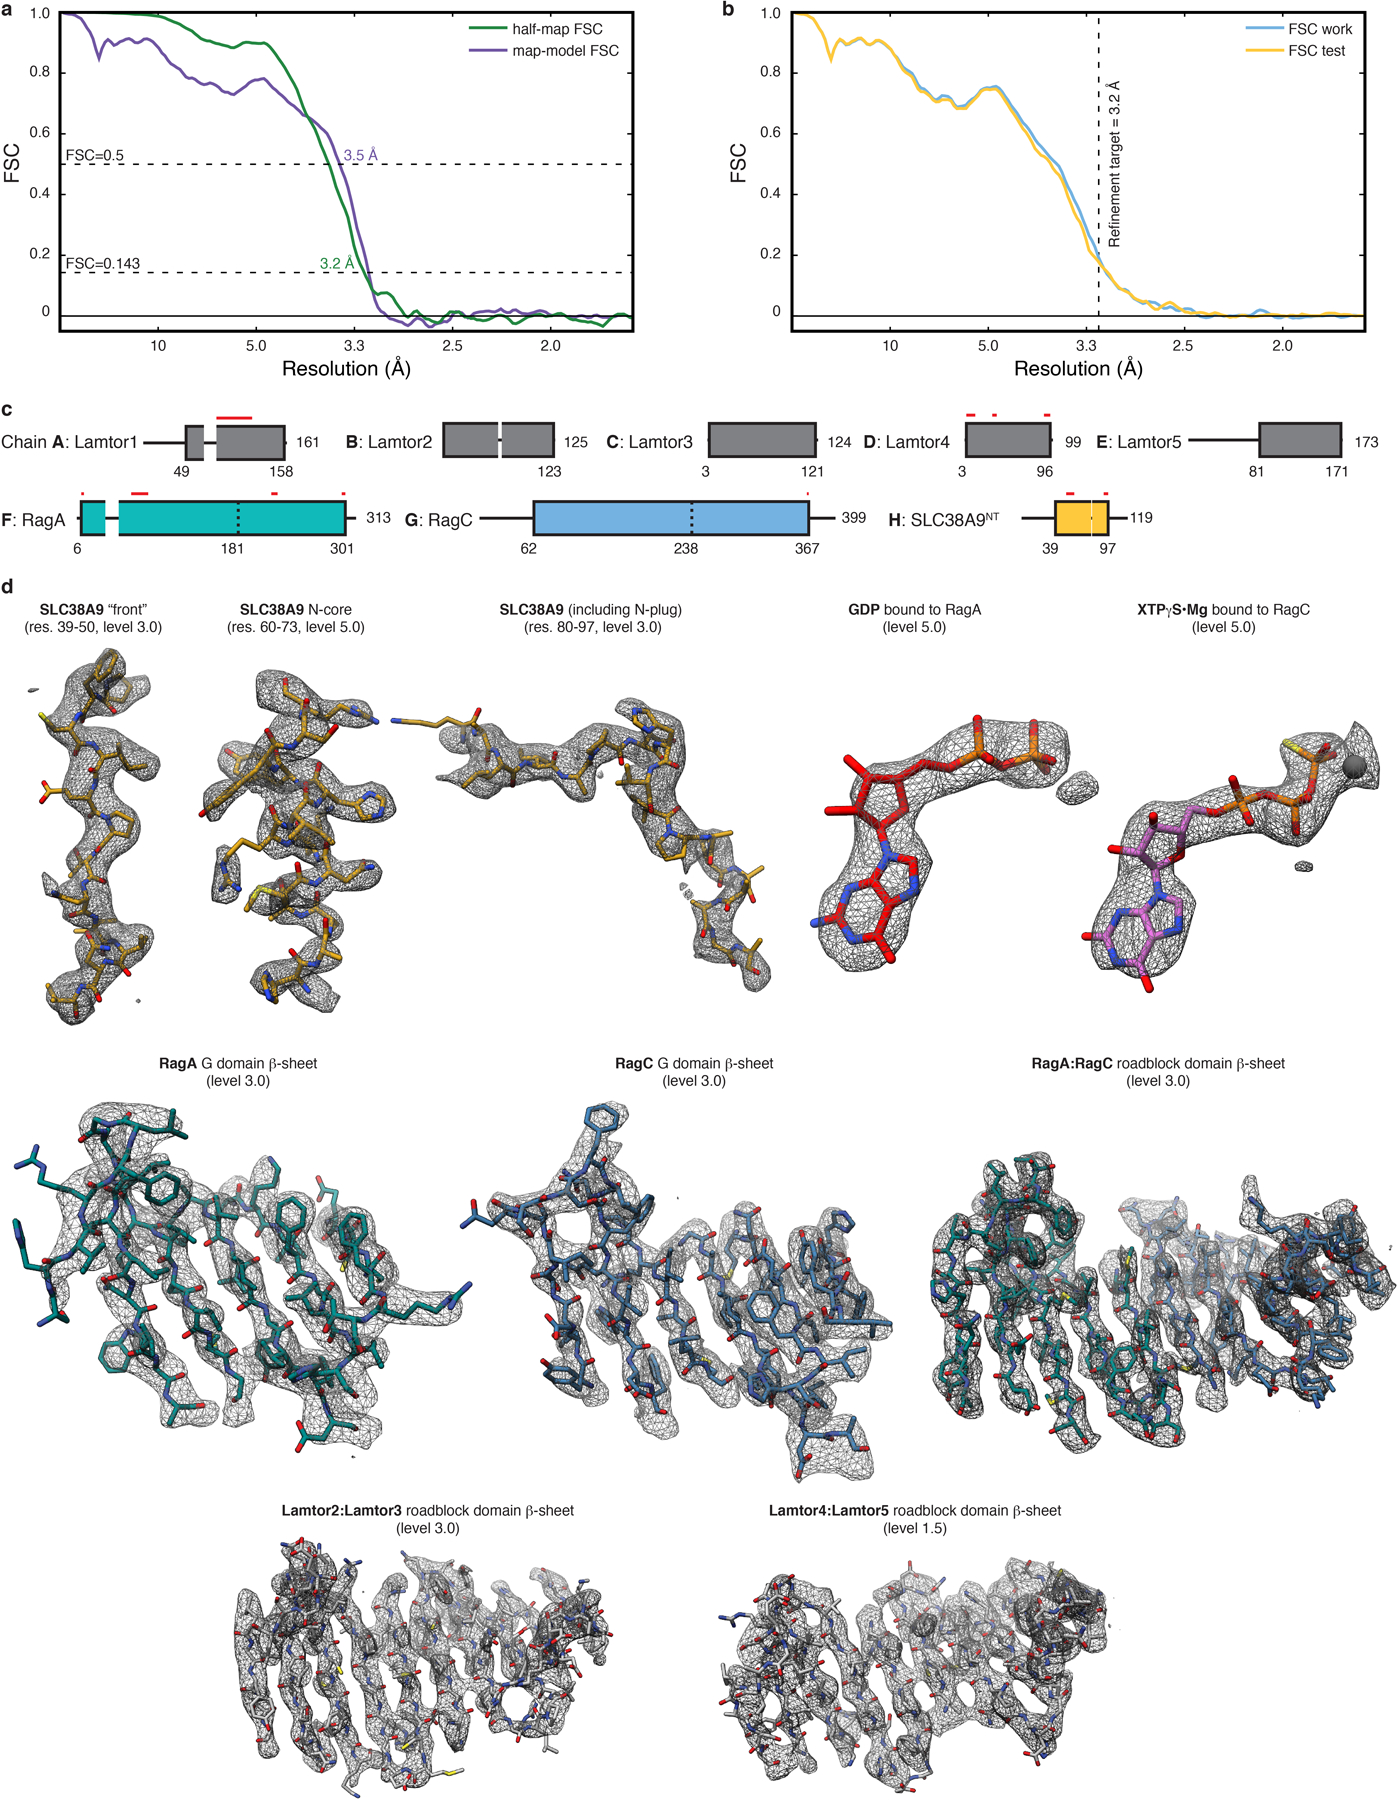
a, Overlay of half-map (green) and map-model (purple) FSC to assess map to model agreement. b, Overlay of FSC work (blue) and FSC test (yellow) of the cross-validation test to assess overfitting. The refinement target resolution is indicated by a vertical dashed line. c, Final model composition and chain assignment. Parts not resolved by the cryo-EM density are represented by thin black lines. Red lines indicate regions where side chains are truncated to alanine. d, Model fit in the cryo-EM density (mesh) of selected regions. The threshold level used to display the density in UCSF Chimera is given in parentheses.
Extended Data Fig. 3. HDX-MS analysis of SLC38A9NT in isolation and bound to Rags.
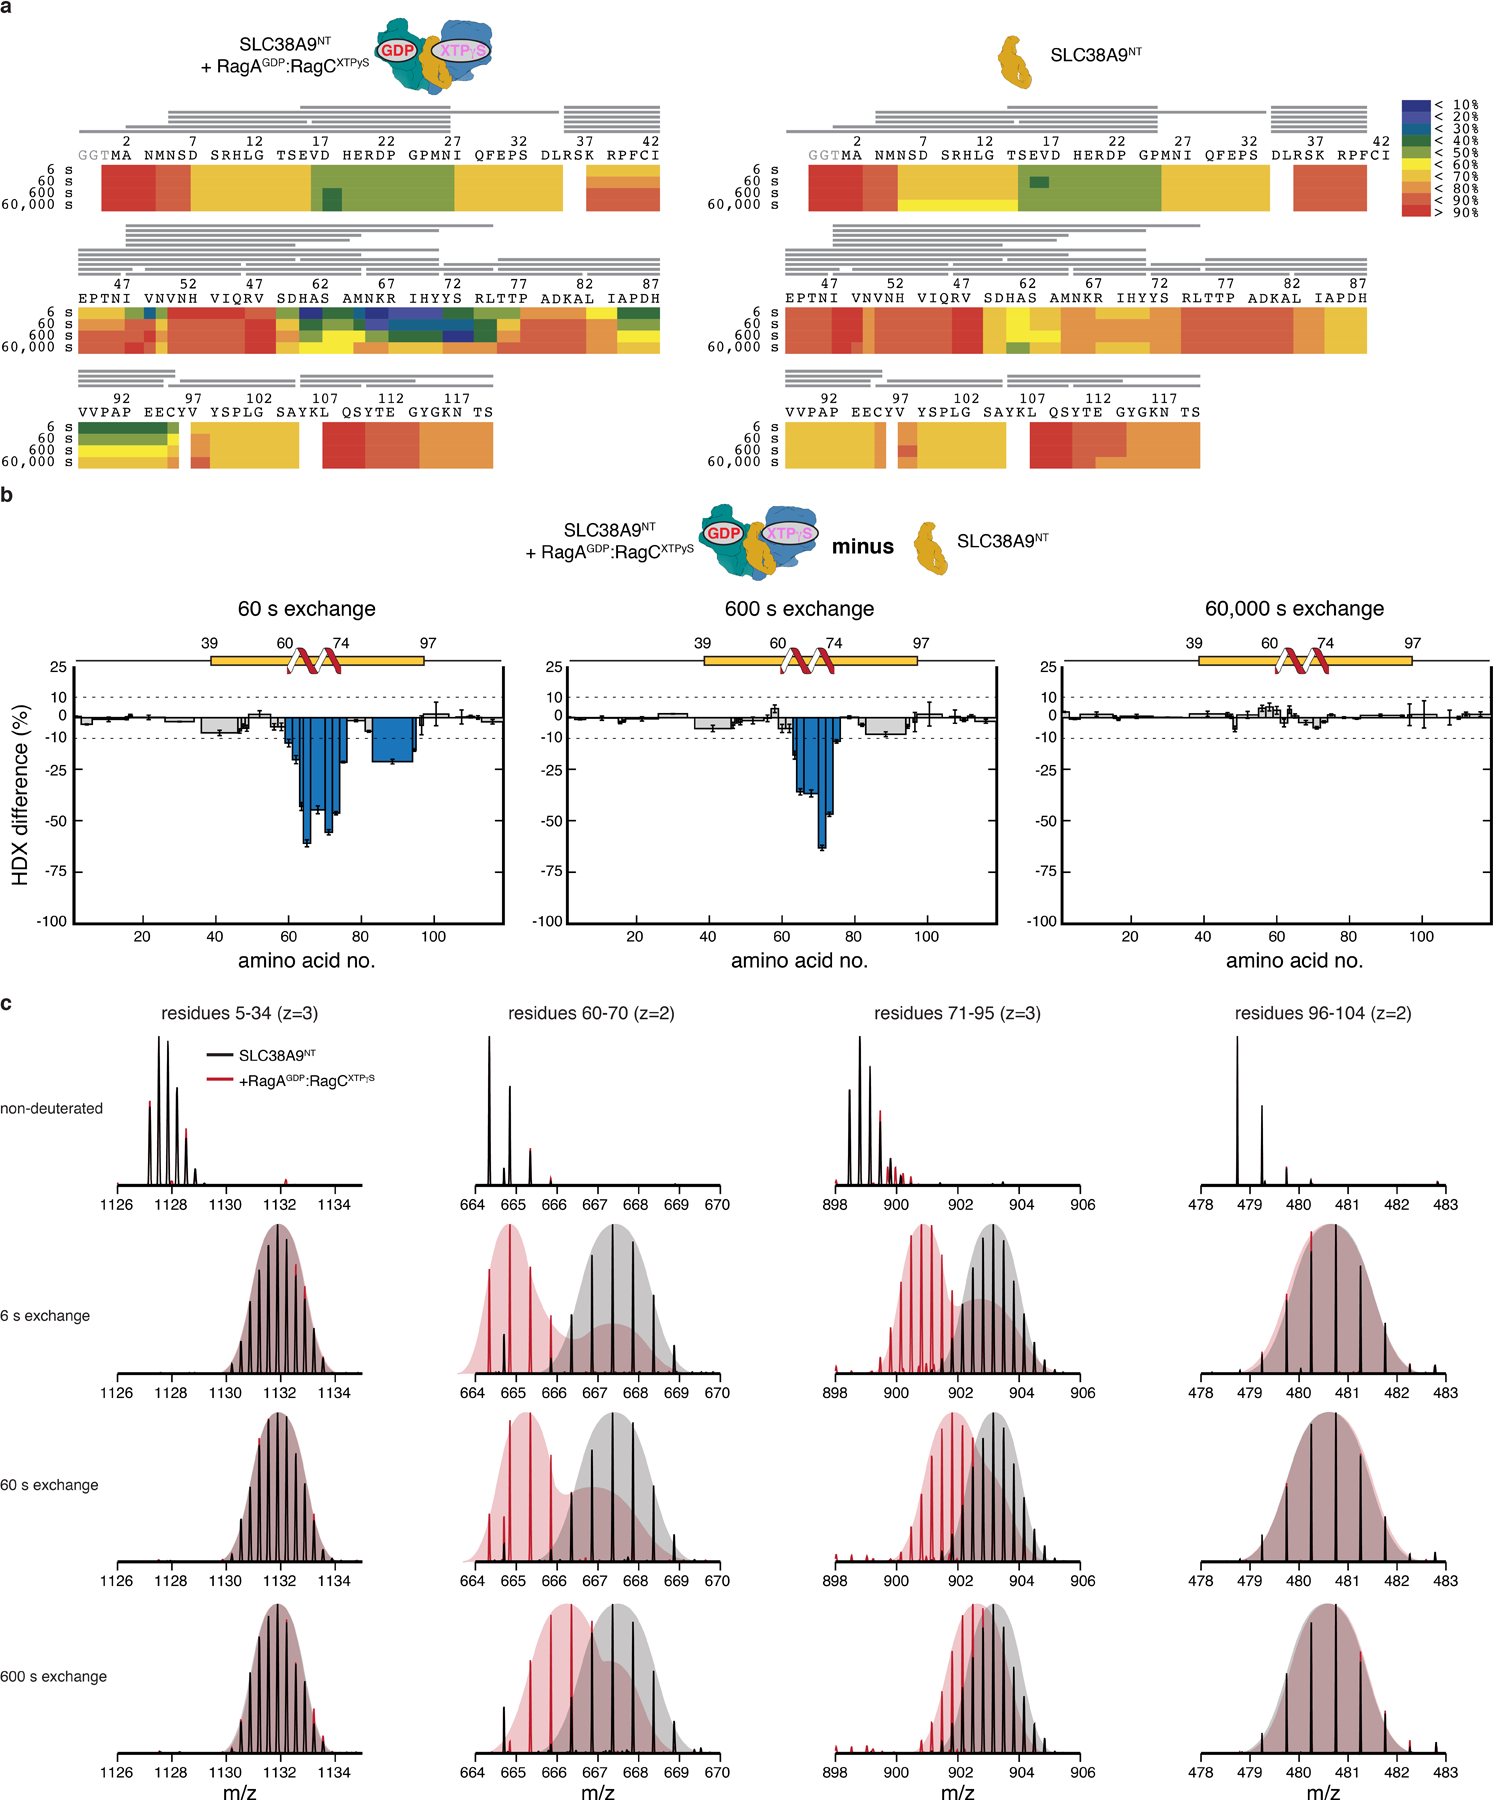
a, Deuterium uptake and peptide coverage (grey lines) of SLC38A9NT in complex with inactive Rags (left) or in isolation (right) at 6, 60, 600 and 60,000 s exchange time. b, HDX difference plots of SLC38A9NT in complex with inactive Rags and in isolation at 60 (left), 600 (middle) and 60,000 s (right) exchange time. Plotted are the mean +/ SD of technical replicates (n=3). c, Individual SLC38A9NT MS peptide spectra of selected peptides in isolation (black) and in complex with inactive Rags (red). Undeuterated reference spectra are shown at the top. Data for graphs in b are available as source data online.
Extended Data Fig. 4. Post-GAP complex cryo-EM structure determination.
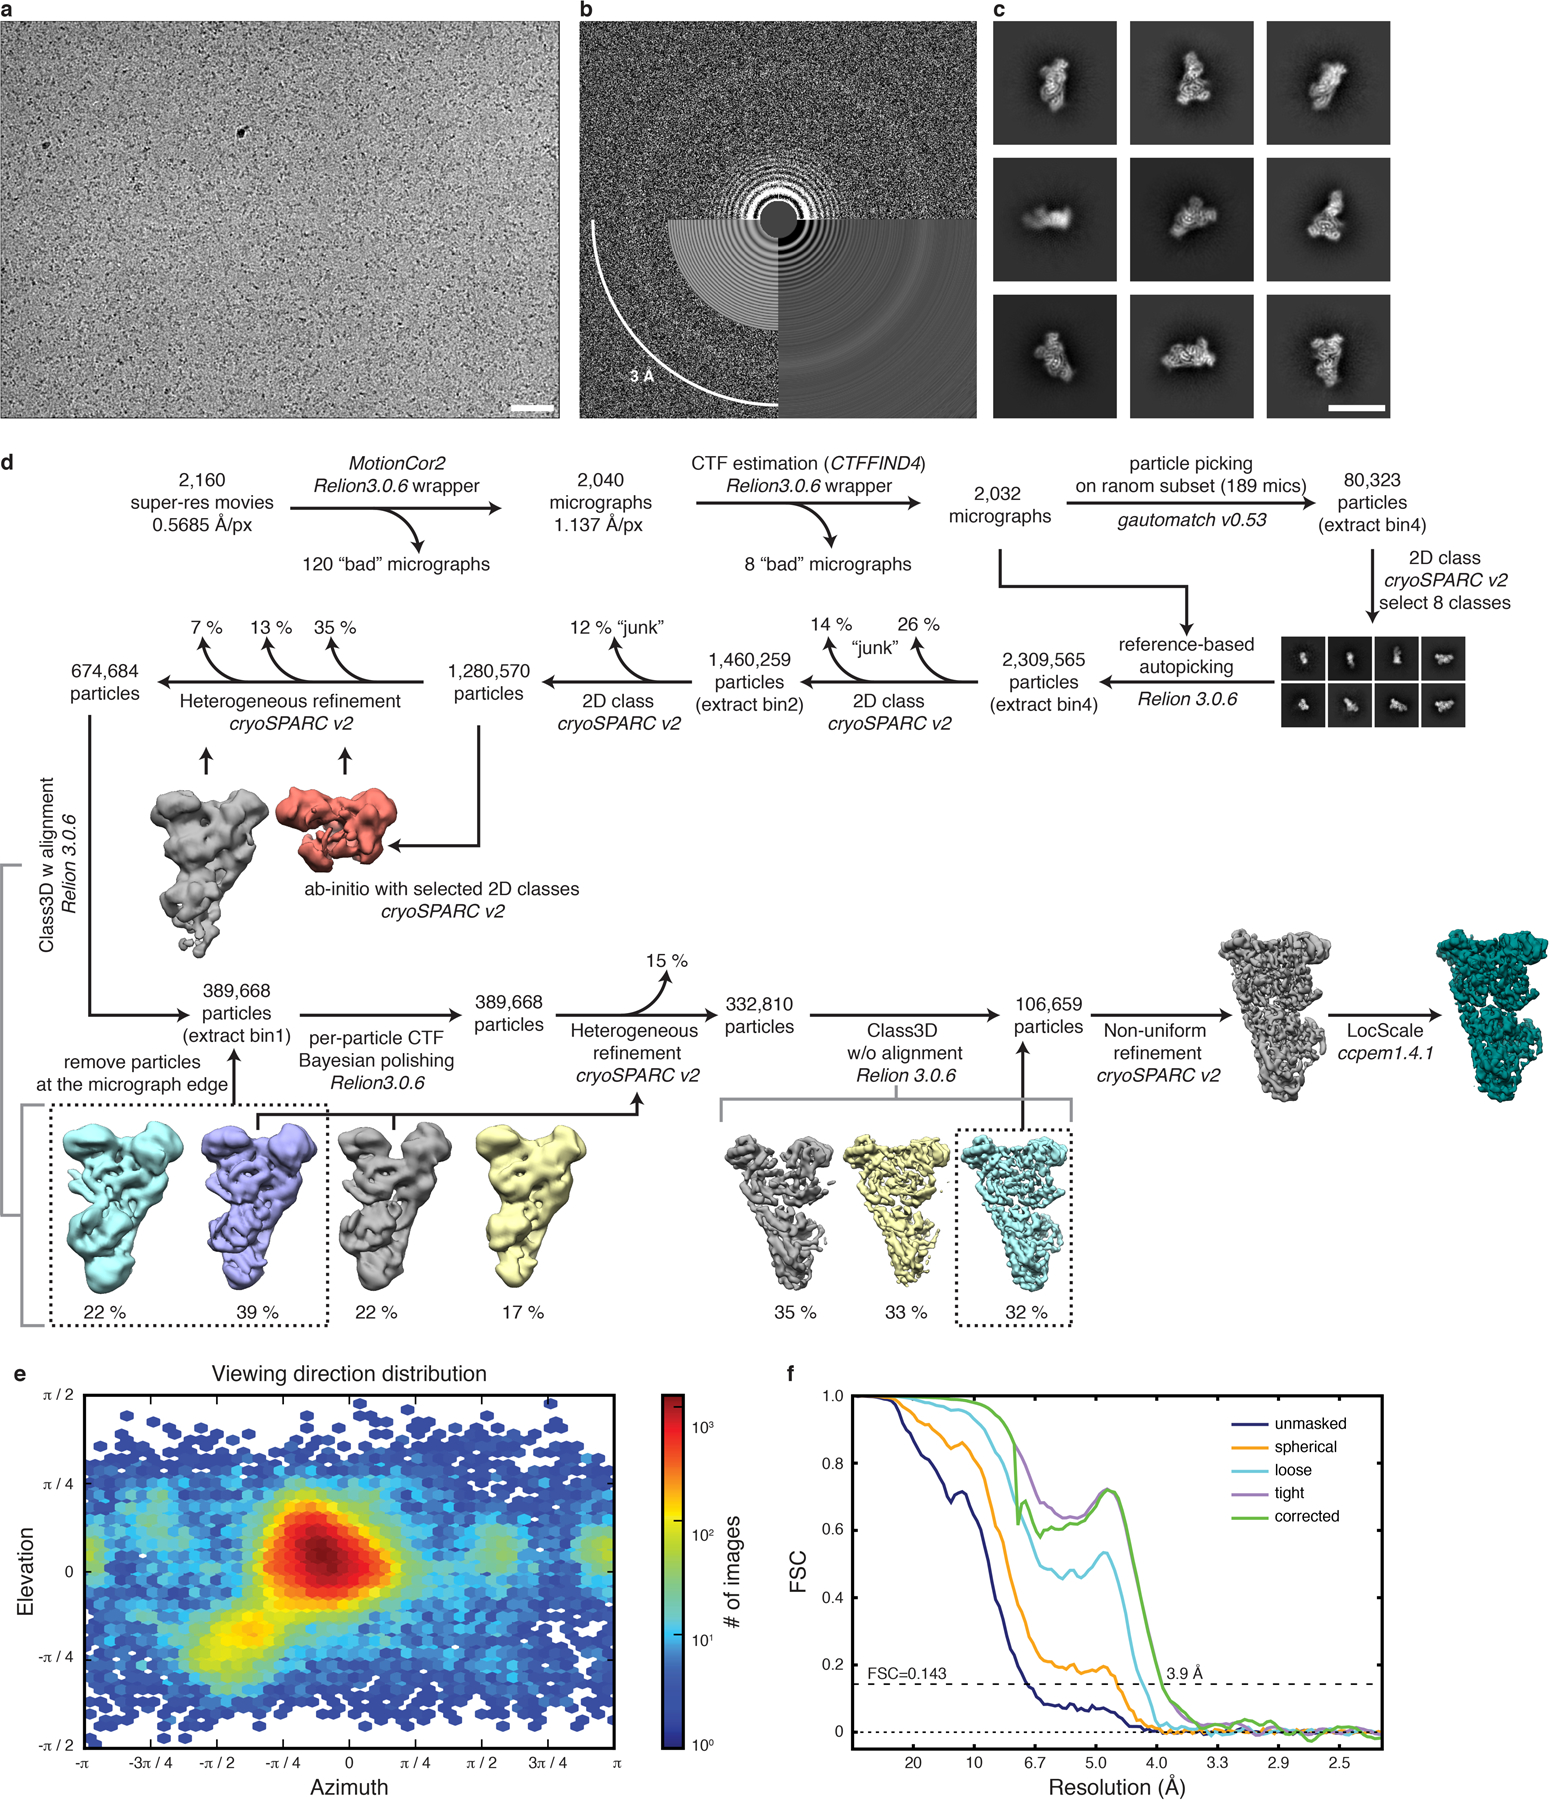
a, Exemplary raw cryo-EM micrograph at −2.2 m defocus. Scale bar 50 nm. b, Power spectrum of micrograph shown in a with CTF estimation. c, Exemplary 2D class averages. Scale bar 150 Å. d, Cryo-EM data processing workflow. Used software is indicated with italic font. e, Particle orientation distribution of the final particle set. f, Fourier shell correlation (FSC) of the final 3D reconstruction.
Extended Data Fig. 5. Post-GAP complex atomic coordinate building and refinement.
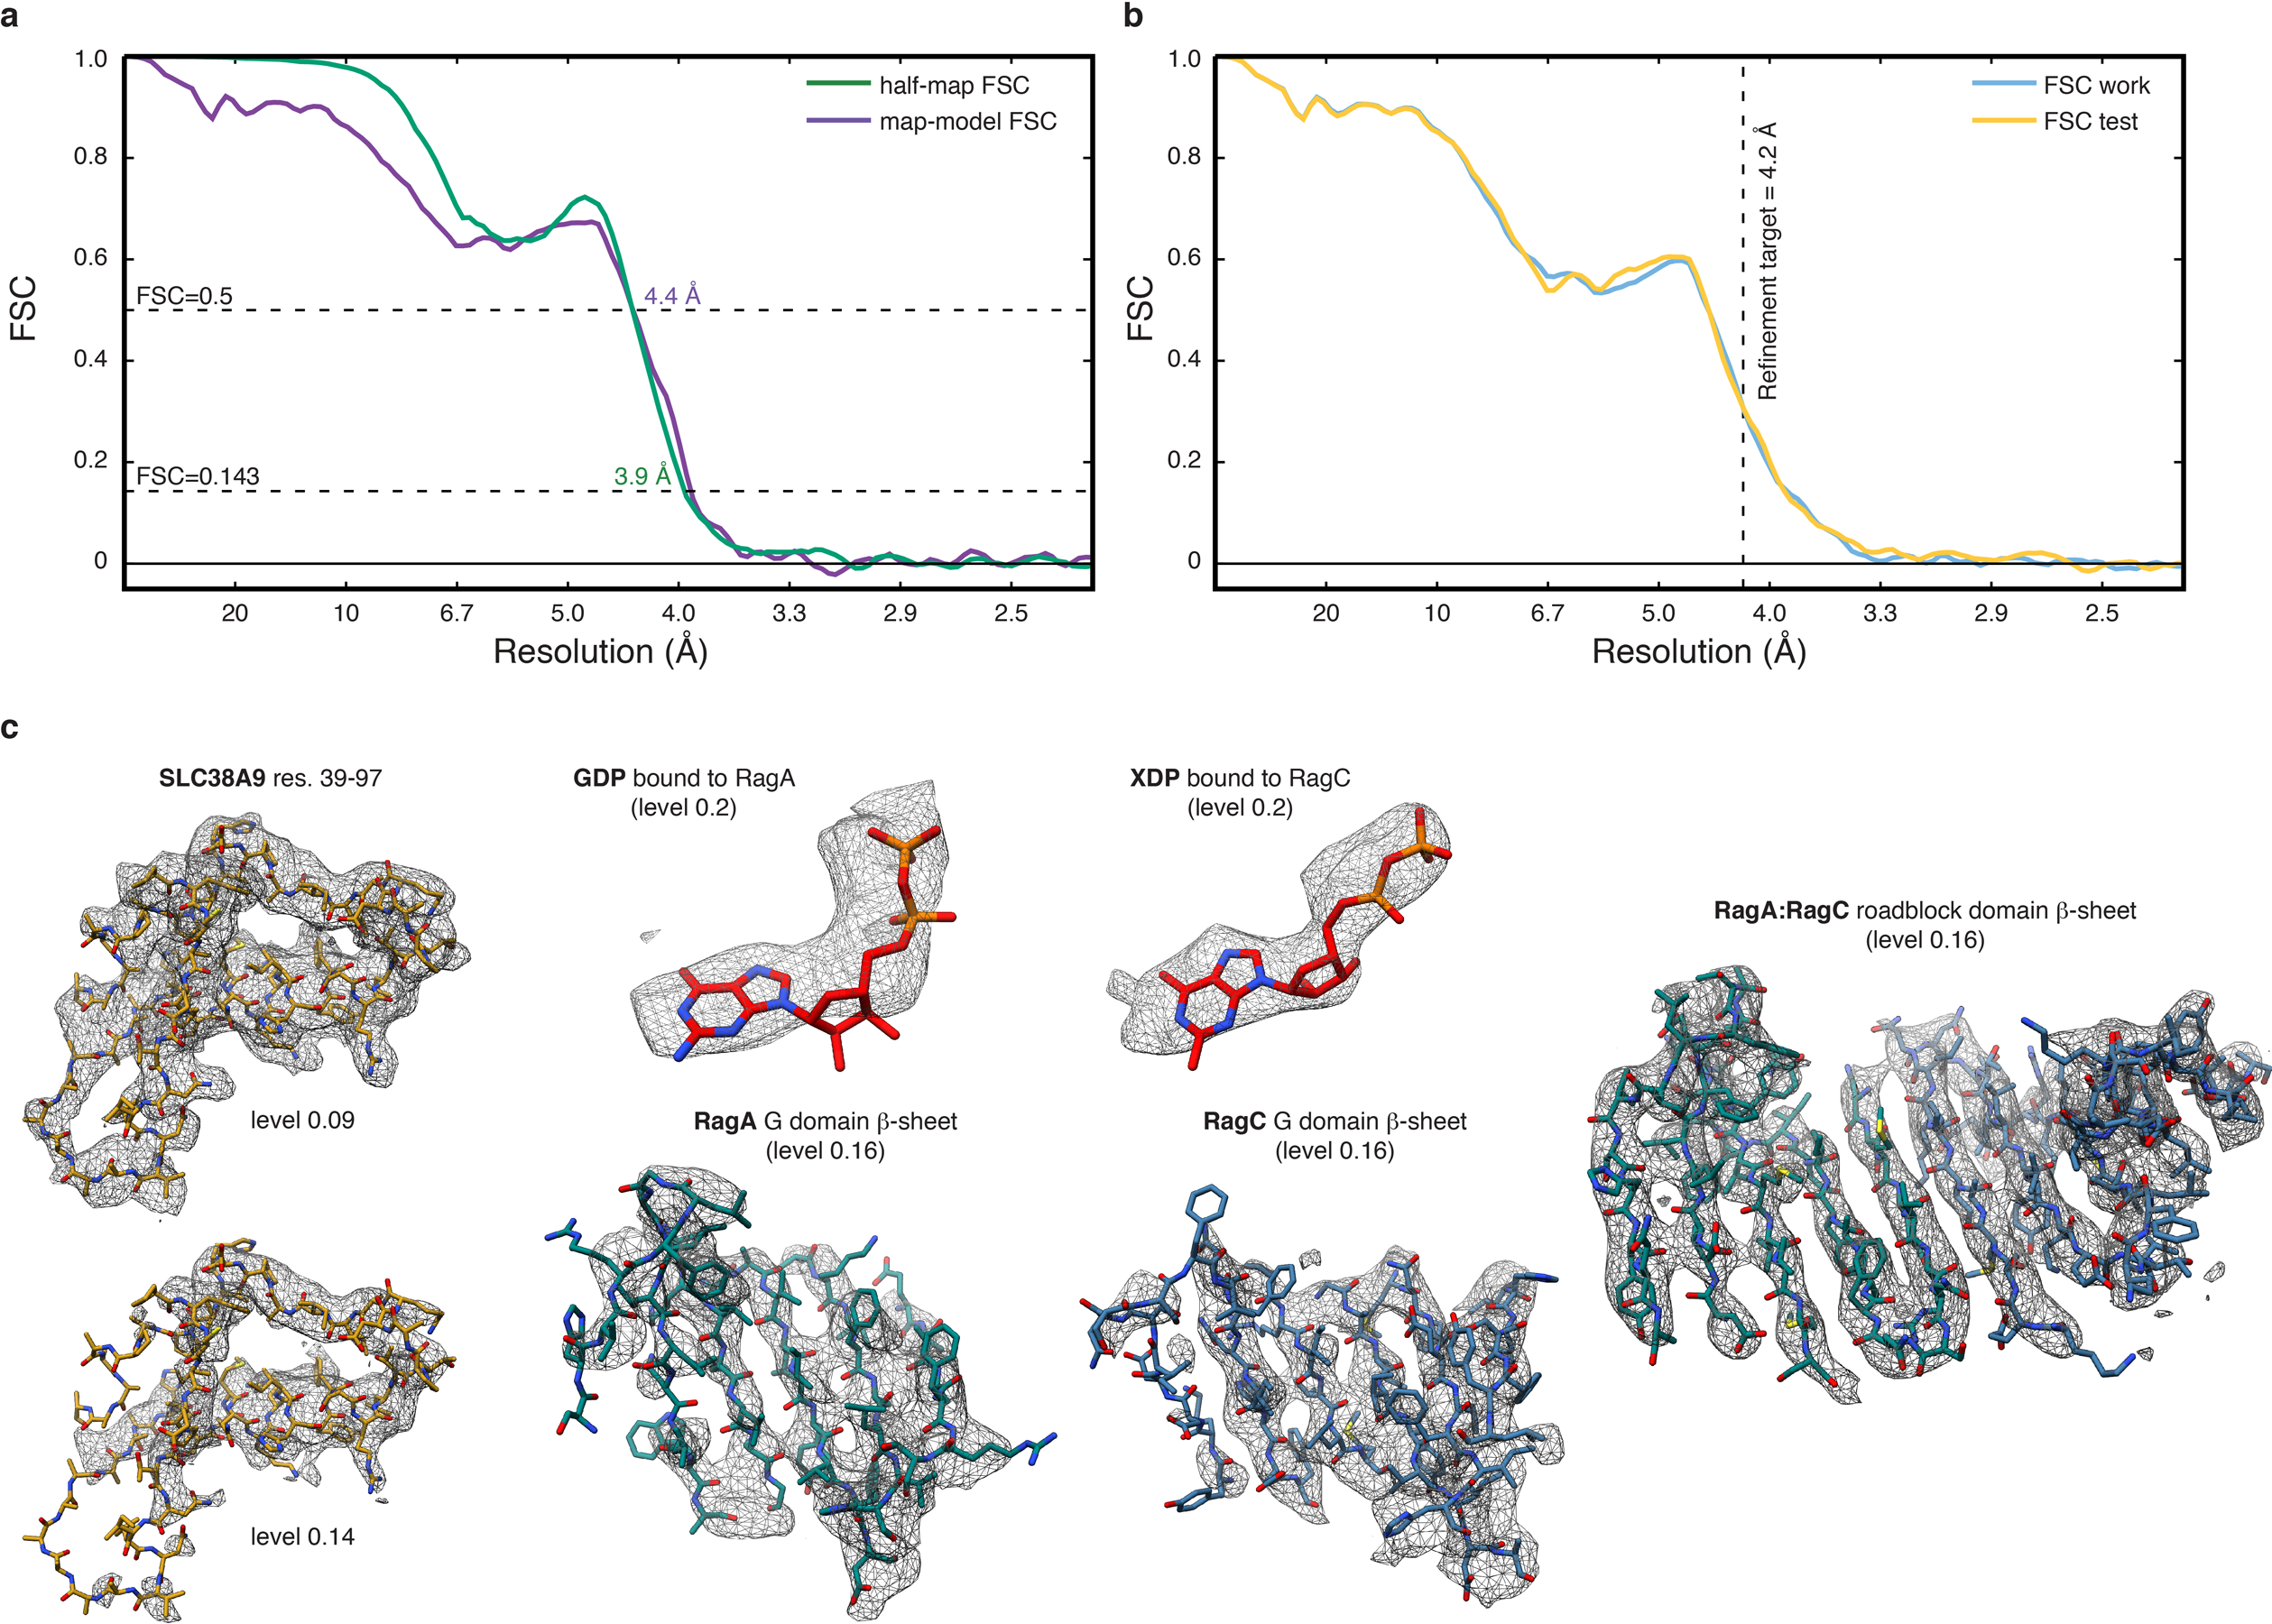
a, Overlay of half-map (green) and map-model (purple) FSC to assess map to model agreement. b, Overlay of FSC work (blue) and FSC test (yellow) of the cross-validation test to assess overfitting. The refinement target resolution is indicated by a vertical dashed line. c, Model fit in the cryo-EM density (mesh) of selected regions. The threshold level used to display the density in UCSF Chimera is given in parentheses.
Extended Data Fig. 6. Overview of Rag GTPase structures in different states.
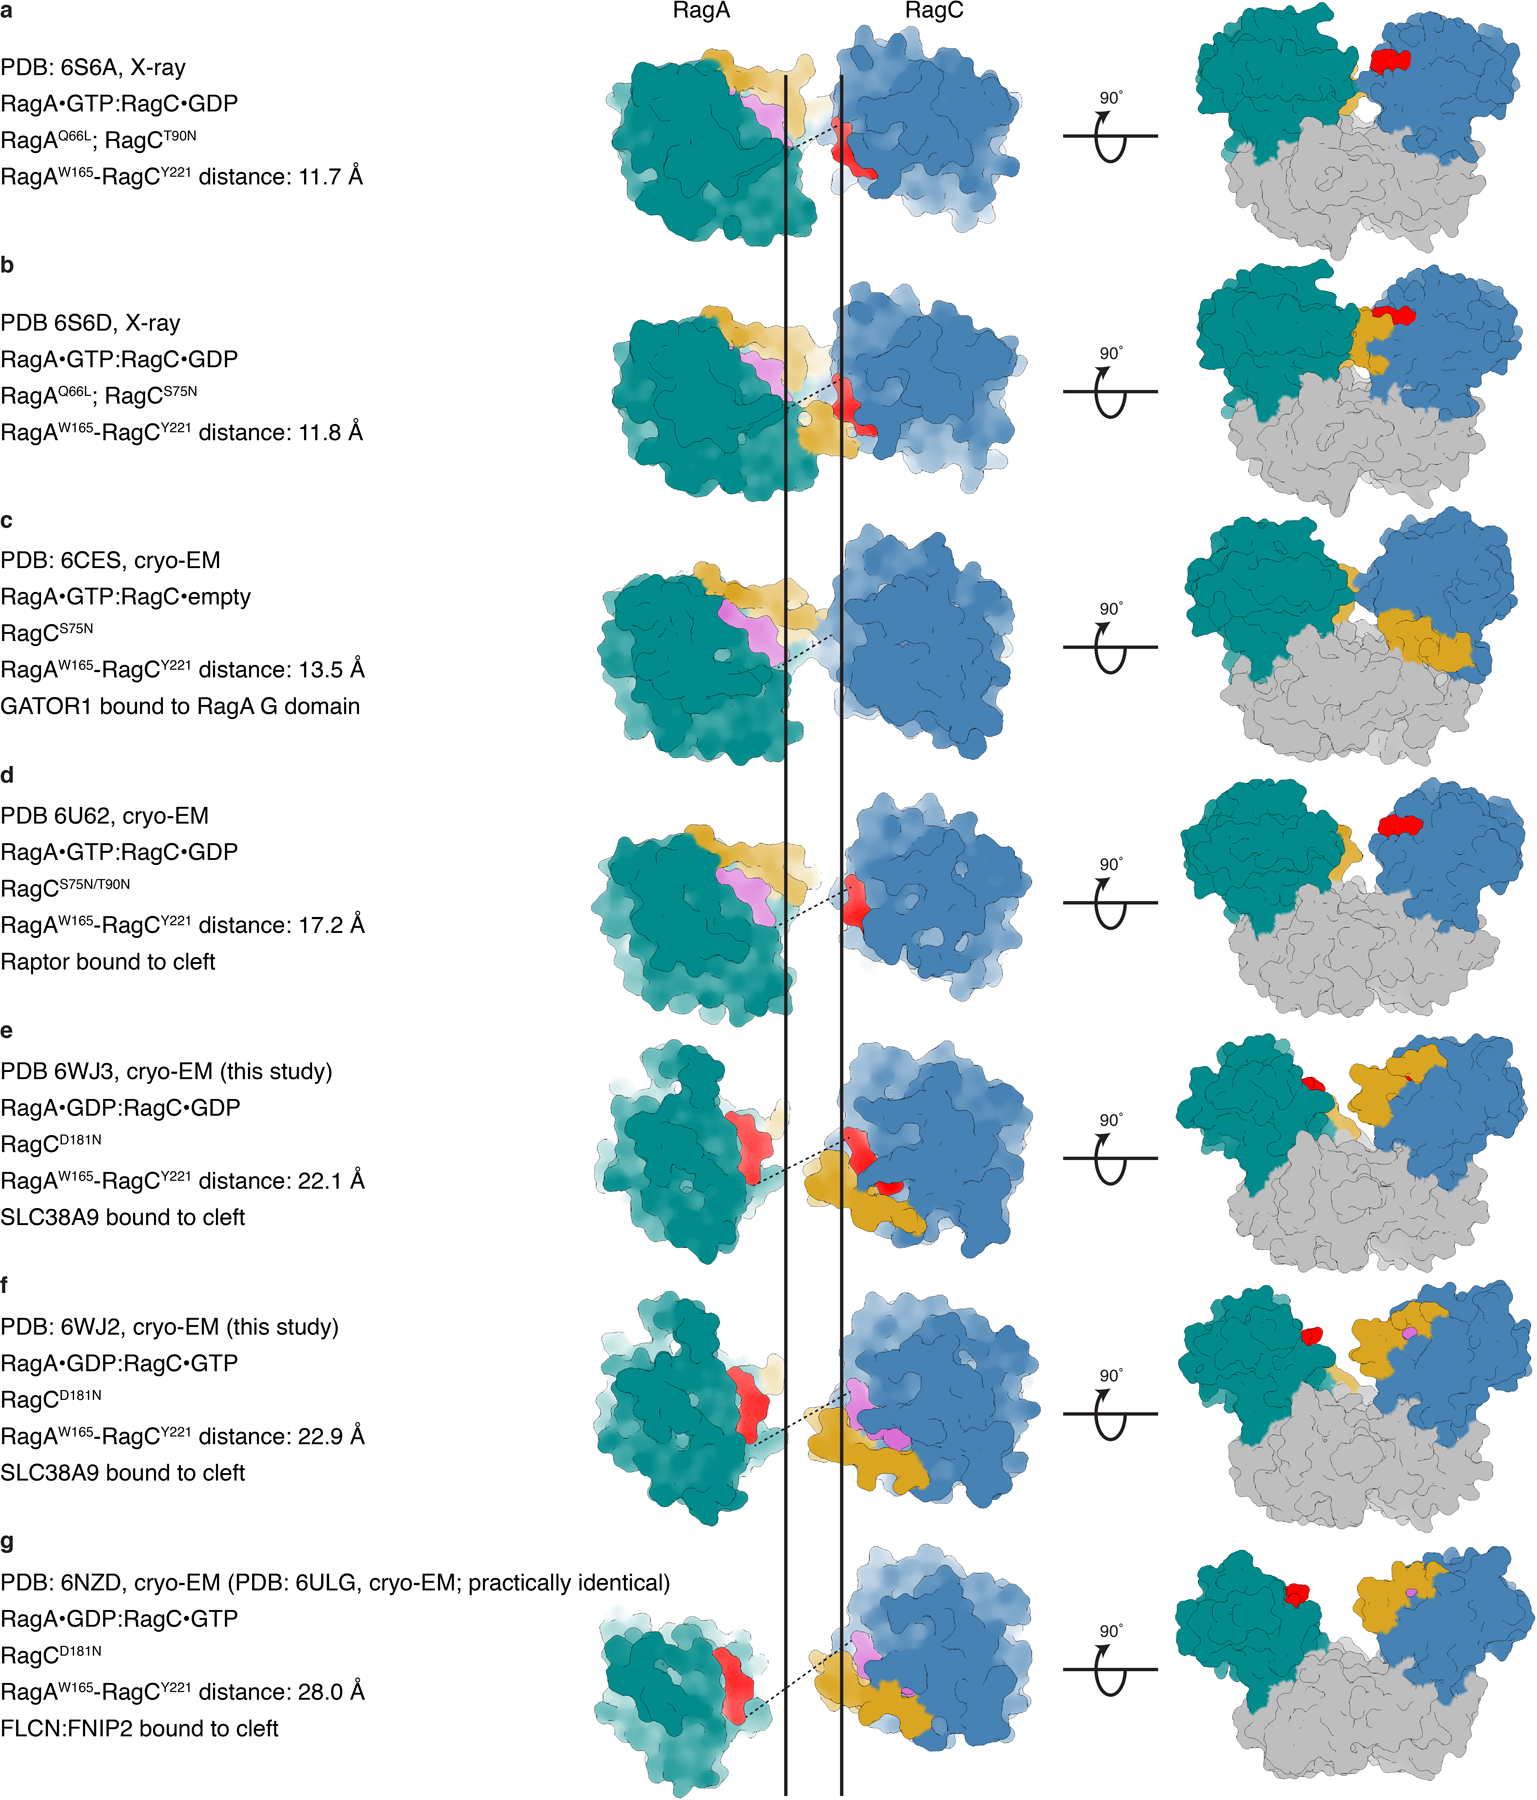
a–g, Top (middle) and side view (right) of published Rag GTPase structures in surface representation (cyan, RagA G domain; blue, RagC G domain; pink, GTP or GTP analogue; red, GDP or GDP analogue; yellow, RagA or RagC switch I region; grey, RagA or RagC C-terminal roadblock domain). The dashed line connects the Cα atoms of RagA Trp165 and RagC Tyr221 representing the width of the G domain cleft. The two vertical solid lines represent the RagA Trp165 and RagC Tyr221 Cα position in a. PDB codes, experimental method, de facto nucleotide state and Rag binding partners (if any) are summarized on the left.
Extended Data Fig. 7. Tryptophan fluorescence-based RagC XTPase assay.

a, Intrinsic tryptophan fluorescence based RagC XTPase assay of Ragulator-RagAGDP:RagCXTP in the absence (blue) and presence (orange) of SLC38A9NT. Tryptophan fluorescence of a Ragulator-RagAGTP:RagCXTP substrate used in the same assay serves as a positive control (green). Plotted is the mean ± SD mantGDP fluorescence at each time point of one experiment performed in quadruplicates (n=4). The experiment has been performed twice with similar results. norm., normalized. b, Top view of the pre-GAP complex structure illustrating the SLC38A9NT-RagC switch I and GDP (RagA, red) interaction. SLC38A9 (yellow) and RagC switch I (blue) are displayed in surface representation. Data for graph in a is available as source data online.
Acknowledgements
We thank R. Zoncu for comments on the manuscript, C. Hecksel for assistance in pre-GAP complex cryo-EM data acquisition which was performed at the Stanford-SLAC Cryo-EM Center (S2C2) supported by the NIH Common Fund Transformative High Resolution Cryo-Electron Microscopy program (U24 GM129541), D. Toso, J. Remis and P. Tobias for assistance in post-GAP complex cryo-EM data acquisition. This work was supported by NIH R01GM111730 (J.H.H), an EMBO Long-Term Fellowship (S.A.F.) and a University of California Cancer Research Coordinating Committee Predoctoral Fellowship (R.E.L.).
Footnotes
Competing interests
J.H.H. is a scientific founder and receives research funding from Casma Therapeutics.
Data availability
EM density maps have been deposited in the EMDB with accession numbers EMD-21686 (pre-GAP complex) and EMD-21687 (post-GAP complex). Atomic coordinates have been deposited in the PDB with accession numbers 6WJ2 (pre-GAP complex) and 6WJ3 (post-GAP complex). Source data are available with the paper online.
Reporting summary
Further information on experimental design is available in the Nature Research Reporting Summary linked to this article.
References
- 1.Liu GY & Sabatini DM mTOR at the nexus of nutrition, growth, ageing and disease. Nature reviews. Molecular cell biology, doi: 10.1038/s41580-019-0199-y (2020). [DOI] [PMC free article] [PubMed]
- 2.Kim J & Guan KL mTOR as a central hub of nutrient signalling and cell growth. Nature cell biology 21, 63–71, doi: 10.1038/s41556-018-0205-1 (2019). [DOI] [PubMed] [Google Scholar]
- 3.Lawrence RE & Zoncu R The lysosome as a cellular centre for signalling, metabolism and quality control. Nature cell biology 21, 133–142, doi: 10.1038/s41556-018-0244-7 (2019). [DOI] [PubMed] [Google Scholar]
- 4.Sancak Y et al. The Rag GTPases bind raptor and mediate amino acid signaling to mTORC1. Science 320, 1496–1501, doi: 10.1126/science.1157535 (2008). [DOI] [PMC free article] [PubMed] [Google Scholar]
- 5.Kim E, Goraksha-Hicks P, Li L, Neufeld TP & Guan KL Regulation of TORC1 by Rag GTPases in nutrient response. Nature cell biology 10, 935–945, doi: 10.1038/ncb1753 (2008). [DOI] [PMC free article] [PubMed] [Google Scholar]
- 6.Sancak Y et al. Ragulator-Rag complex targets mTORC1 to the lysosomal surface and is necessary for its activation by amino acids. Cell 141, 290–303, doi: 10.1016/j.cell.2010.02.024 (2010). [DOI] [PMC free article] [PubMed] [Google Scholar]
- 7.Teis D, Wunderlich W & Huber LA Localization of the MP1-MAPK scaffold complex to endosomes is mediated by p14 and required for signal transduction. Developmental cell 3, 803–814 (2002). [DOI] [PubMed] [Google Scholar]
- 8.Bar-Peled L, Schweitzer LD, Zoncu R & Sabatini DM Ragulator is a GEF for the rag GTPases that signal amino acid levels to mTORC1. Cell 150, 1196–1208, doi: 10.1016/j.cell.2012.07.032 (2012). [DOI] [PMC free article] [PubMed] [Google Scholar]
- 9.Rogala KB et al. Structural basis for the docking of mTORC1 on the lysosomal surface. Science, doi: 10.1126/science.aay0166 (2019). [DOI] [PMC free article] [PubMed]
- 10.Anandapadamanaban M et al. Architecture of human Rag GTPase heterodimers and their complex with mTORC1. Science 366, 203–210, doi: 10.1126/science.aax3939 (2019). [DOI] [PMC free article] [PubMed] [Google Scholar]
- 11.Rebsamen M et al. SLC38A9 is a component of the lysosomal amino acid sensing machinery that controls mTORC1. Nature 519, 477–481, doi: 10.1038/nature14107 (2015). [DOI] [PMC free article] [PubMed] [Google Scholar]
- 12.Wang S et al. Metabolism. Lysosomal amino acid transporter SLC38A9 signals arginine sufficiency to mTORC1. Science 347, 188–194, doi: 10.1126/science.1257132 (2015). [DOI] [PMC free article] [PubMed] [Google Scholar]
- 13.Jung J, Genau HM & Behrends C Amino Acid-Dependent mTORC1 Regulation by the Lysosomal Membrane Protein SLC38A9. Molecular and cellular biology 35, 2479–2494, doi: 10.1128/MCB.00125-15 (2015). [DOI] [PMC free article] [PubMed] [Google Scholar]
- 14.Wyant GA et al. mTORC1 Activator SLC38A9 Is Required to Efflux Essential Amino Acids from Lysosomes and Use Protein as a Nutrient. Cell 171, 642–654 e612, doi: 10.1016/j.cell.2017.09.046 (2017). [DOI] [PMC free article] [PubMed] [Google Scholar]
- 15.Scalise M et al. Insights into the transport side of the human SLC38A9 transceptor. Biochimica et biophysica acta. Biomembranes 1861, 1558–1567, doi: 10.1016/j.bbamem.2019.07.006 (2019). [DOI] [PubMed] [Google Scholar]
- 16.Lei HT, Ma J, Sanchez Martinez S & Gonen T Crystal structure of arginine-bound lysosomal transporter SLC38A9 in the cytosol-open state. Nature structural & molecular biology 25, 522–527, doi: 10.1038/s41594-018-0072-2 (2018). [DOI] [PMC free article] [PubMed] [Google Scholar]
- 17.Ma J, Lei H-T & Gonen T A conformational change in the N terminus of SLC38A9 signals mTORC1 activation. bioRxiv, 339937 (2018). [DOI] [PMC free article] [PubMed]
- 18.Shen K & Sabatini DM Ragulator and SLC38A9 activate the Rag GTPases through noncanonical GEF mechanisms. Proceedings of the National Academy of Sciences of the United States of America 115, 9545–9550, doi: 10.1073/pnas.1811727115 (2018). [DOI] [PMC free article] [PubMed] [Google Scholar]
- 19.Lawrence RE et al. Structural mechanism of a Rag GTPase activation checkpoint by the lysosomal folliculin complex. Science 366, 971–977, doi: 10.1126/science.aax0364 (2019). [DOI] [PMC free article] [PubMed] [Google Scholar]
- 20.Tsun ZY et al. The folliculin tumor suppressor is a GAP for the RagC/D GTPases that signal amino acid levels to mTORC1. Molecular cell 52, 495–505, doi: 10.1016/j.molcel.2013.09.016 (2013). [DOI] [PMC free article] [PubMed] [Google Scholar]
- 21.Shen K et al. Cryo-EM Structure of the Human FLCN-FNIP2-Rag-Ragulator Complex. Cell 179, 1319–1329 e1318, doi: 10.1016/j.cell.2019.10.036 (2019). [DOI] [PMC free article] [PubMed] [Google Scholar]
- 22.Hong SB et al. Inactivation of the FLCN tumor suppressor gene induces TFE3 transcriptional activity by increasing its nuclear localization. PLoS One 5, e15793, doi: 10.1371/journal.pone.0015793 (2010). [DOI] [PMC free article] [PubMed] [Google Scholar]
- 23.Sardiello M et al. A gene network regulating lysosomal biogenesis and function. Science 325, 473–477, doi: 10.1126/science.1174447 (2009). [DOI] [PubMed] [Google Scholar]
- 24.Wada S et al. The tumor suppressor FLCN mediates an alternate mTOR pathway to regulate browning of adipose tissue. Genes & development 30, 2551–2564, doi: 10.1101/gad.287953.116 (2016). [DOI] [PMC free article] [PubMed] [Google Scholar]
- 25.Betschinger J et al. Exit from pluripotency is gated by intracellular redistribution of the bHLH transcription factor Tfe3. Cell 153, 335–347, doi: 10.1016/j.cell.2013.03.012 (2013). [DOI] [PMC free article] [PubMed] [Google Scholar]
- 26.Napolitano G et al. A substrate-specific mTORC1 pathway underlies Birt–Hogg–Dubé syndrome. Nature, doi: 10.1038/s41586-020-2444-0 (2020). [DOI] [PMC free article] [PubMed]
- 27.Settembre C et al. A lysosome-to-nucleus signalling mechanism senses and regulates the lysosome via mTOR and TFEB. EMBO J 31, 1095–1108, doi: 10.1038/emboj.2012.32 (2012). [DOI] [PMC free article] [PubMed] [Google Scholar]
- 28.Napolitano G et al. mTOR-dependent phosphorylation controls TFEB nuclear export. Nature communications 9, 3312, doi: 10.1038/s41467-018-05862-6 (2018). [DOI] [PMC free article] [PubMed] [Google Scholar]
- 29.de Araujo MEG et al. Crystal structure of the human lysosomal mTORC1 scaffold complex and its impact on signaling. Science 358, 377–381, doi: 10.1126/science.aao1583 (2017). [DOI] [PubMed] [Google Scholar]
- 30.Su MY et al. Hybrid Structure of the RagA/C-Ragulator mTORC1 Activation Complex. Molecular cell 68, 835–846 e833, doi: 10.1016/j.molcel.2017.10.016 (2017). [DOI] [PMC free article] [PubMed] [Google Scholar]
- 31.Antonny B, Beraud-Dufour S, Chardin P & Chabre M N-terminal hydrophobic residues of the G-protein ADP-ribosylation factor-1 insert into membrane phospholipids upon GDP to GTP exchange. Biochemistry 36, 4675–4684, doi: 10.1021/bi962252b (1997). [DOI] [PubMed] [Google Scholar]
- 32.Ahmadian MR, Wittinghofer A & Herrmann C Fluorescence methods in the study of small GTP-binding proteins. Methods Mol Biol 189, 45–63, doi: 10.1385/1-59259-281-3:045 (2002). [DOI] [PubMed] [Google Scholar]
- 33.Mastronarde DN Automated electron microscope tomography using robust prediction of specimen movements. Journal of structural biology 152, 36–51, doi: 10.1016/j.jsb.2005.07.007 (2005). [DOI] [PubMed] [Google Scholar]
- 34.Scheres SH A Bayesian view on cryo-EM structure determination. Journal of molecular biology 415, 406–418, doi: 10.1016/j.jmb.2011.11.010 (2012). [DOI] [PMC free article] [PubMed] [Google Scholar]
- 35.Zheng SQ et al. MotionCor2: anisotropic correction of beam-induced motion for improved cryo-electron microscopy. Nature methods 14, 331–332, doi: 10.1038/nmeth.4193 (2017). [DOI] [PMC free article] [PubMed] [Google Scholar]
- 36.Wagner T et al. SPHIRE-crYOLO is a fast and accurate fully automated particle picker for cryo-EM. Commun Biol 2, 218, doi: 10.1038/s42003-019-0437-z (2019). [DOI] [PMC free article] [PubMed] [Google Scholar]
- 37.Punjani A, Rubinstein JL, Fleet DJ & Brubaker MA cryoSPARC: algorithms for rapid unsupervised cryo-EM structure determination. Nature methods 14, 290–296, doi: 10.1038/nmeth.4169 (2017). [DOI] [PubMed] [Google Scholar]
- 38.Rohou A & Grigorieff N CTFFIND4: Fast and accurate defocus estimation from electron micrographs. Journal of structural biology 192, 216–221, doi: 10.1016/j.jsb.2015.08.008 (2015). [DOI] [PMC free article] [PubMed] [Google Scholar]
- 39.Zivanov J et al. New tools for automated high-resolution cryo-EM structure determination in RELION-3. Elife 7, doi: 10.7554/eLife.42166 (2018). [DOI] [PMC free article] [PubMed] [Google Scholar]
- 40.Zivanov J, Nakane T & Scheres SHW A Bayesian approach to beam-induced motion correction in cryo-EM single-particle analysis. IUCrJ 6, 5–17, doi: 10.1107/S205225251801463X (2019). [DOI] [PMC free article] [PubMed] [Google Scholar]
- 41.Punjani A, Zhang H & Fleet DJ Non-uniform refinement: Adaptive regularization improves single particle cryo-EM reconstruction. bioRxiv (2019). [DOI] [PubMed]
- 42.Asarnow D, Palovcak E & Cheng Y UCSF pyem v0.5. Zenodo, doi: 10.5281/zenodo.3576630 (2019). [DOI]
- 43.Terwilliger TC, Ludtke SJ, Read RJ, Adams PD & Afonine PV Improvement of cryo-EM maps by density modification. BioRxiv, 845032 (2019). [DOI] [PMC free article] [PubMed]
- 44.Liebschner D et al. Macromolecular structure determination using X-rays, neutrons and electrons: recent developments in Phenix. Acta Crystallogr D Struct Biol 75, 861–877, doi: 10.1107/S2059798319011471 (2019). [DOI] [PMC free article] [PubMed] [Google Scholar]
- 45.Jakobi AJ, Wilmanns M & Sachse C Model-based local density sharpening of cryo-EM maps. Elife 6, doi: 10.7554/eLife.27131 (2017). [DOI] [PMC free article] [PubMed] [Google Scholar]
- 46.Burnley T, Palmer CM & Winn M Recent developments in the CCP-EM software suite. Acta Crystallogr D Struct Biol 73, 469–477, doi: 10.1107/S2059798317007859 (2017). [DOI] [PMC free article] [PubMed] [Google Scholar]
- 47.Scheres SH & Chen S Prevention of overfitting in cryo-EM structure determination. Nature methods 9, 853–854, doi: 10.1038/nmeth.2115 (2012). [DOI] [PMC free article] [PubMed] [Google Scholar]
- 48.Pettersen EF et al. UCSF Chimera--a visualization system for exploratory research and analysis. Journal of computational chemistry 25, 1605–1612, doi: 10.1002/jcc.20084 (2004). [DOI] [PubMed] [Google Scholar]
- 49.Emsley P, Lohkamp B, Scott WG & Cowtan K Features and development of Coot. Acta Crystallogr D Biol Crystallogr 66, 486–501, doi: 10.1107/S0907444910007493 (2010). [DOI] [PMC free article] [PubMed] [Google Scholar]
- 50.Williams CJ et al. MolProbity: More and better reference data for improved all-atom structure validation. Protein Sci 27, 293–315, doi: 10.1002/pro.3330 (2018). [DOI] [PMC free article] [PubMed] [Google Scholar]
- 51.Barad BA et al. EMRinger: side chain-directed model and map validation for 3D cryo-electron microscopy. Nature methods 12, 943–946, doi: 10.1038/nmeth.3541 (2015). [DOI] [PMC free article] [PubMed] [Google Scholar]


