

Abstract
Nuclear compartments play diverse roles in regulating gene expression, yet the molecular forces and components driving compartment formation remain largely unclear1. The long non-coding RNA Xist establishes an intra-chromosomal compartment by localizing at a high concentration in a territory spatially close to its transcription locus2 and binding diverse proteins3–5 to achieve X-chromosome inactivation (XCI)6,7. The XCI-process therefore serves as paradigm for understanding how RNA-mediated recruitment of diffusible proteins induces a functional compartment. Interestingly, the properties of the inactive X (Xi)-compartment change over time because upon initial Xist spreading and transcriptional shutoff a state is reached where gene silencing remains stable even if Xist is turned off8. Here, we show that the Xist RNA-binding-proteins (RBPs) PTBP19, MATR310, TDP4311, and CELF112 assemble on the multivalent E-repeat-element of Xist7 and, via self-aggregation and heterotypic protein-protein interactions, form a condensate1 in the Xi. This condensate is required for gene silencing and anchoring of Xist to the Xi-territory and can be sustained in the absence of Xist. Notably, these E-repeat-binding RBPs become essential coincident with transition to the Xist-independent XCI-phase8, indicating that the condensate seeded by the E-repeat underlies the developmental switch from Xist-dependence to Xist-independence. Taken together, our data reveal that Xist forms the Xi-compartment by seeding a heteromeric condensate consisting of ubiquitous RBPs and uncover an unanticipated mechanism for heritable gene silencing.
Although many Xist-interacting proteins have a defined function during XCI initiation3,5,6,13, the induction of X-linked gene silencing is largely unaffected when the Xist-interacting RBPs PTBP1, MATR3, TDP-43 or CELF1 are depleted (Extended Data Fig. 1a–c), raising the question of what role(s) these proteins play in XCI (Supplementary Note 1). Interestingly, in addition to their known functions in RNA-processing9–12, these RBPs can form higher-order assemblies, particularly when concentrated by RNAs containing multivalent protein binding sites15–17. Because Xist contains several highly repetitive sequences7, we hypothesized that interactions between Xist, PTBP1, MATR3, CELF1, and TDP-43 might create a higher-order assembly within the Xi and thereby contribute to the formation of the Xi-compartment.
We first examined whether the depletion of PTBP1, MATR3, CELF1, or TDP-43 impacts Xist localization. SiRNA-mediated knockdown of each factor during XCI initiation in female differentiating embryonic stem cells (ESCs) revealed significant nuclear dispersal of Xist and defects in the Xist-dependent accumulation of the H3K27me3 Xi-mark18,19, with only small changes in Xist transcript or splicing levels (Extended Data Fig. 1d,e; 2a–f). PTBP1 knockdown in ESCs expressing Xist from an inducible cDNA transgene lacking introns, resulted in similar dispersal of the Xist RNA FISH signal (Extended Data Fig. 2g). These findings demonstrate that these four RBPs mediate Xist localization on the forming Xi, independently of their RNA-processing activities.
To determine where on Xist these factors bind, we applied CLIP-seq during XCI-initiation. This yielded a striking accumulation of PTBP1, MATR3 and CELF1 reads over the E-repeat of Xist, which comprises over 50 C/U/G-rich elements predicted to serve as PTBP1, MATR3 and CELF1 binding sites (Extended Data Fig. 3a–c)20–22. We confirmed homomeric binding of recombinant (r)PTBP1 to the E-repeat RNA by EMSA (Extended Data Fig. 3d). PTBP1 ChIP-seq revealed a PTBP1 peak primarily over the genomic E-repeat region upon induction of Xist expression (Extended Data Fig. 3a), indicating that PTBP1 engages Xist co-transcriptionally. The Xist CLIP-seq profiles of PTBP1 and PTBP2, the neural homologue of PTBP1, in differentiated cells were strikingly similar to that of PTBP1 during XCI initiation, and TDP-43 in embryonic mouse brain displayed strongest binding at the 3’ end of the E-repeat where multiple (GU)n tracts presumably serve as binding motifs (Extended Data Fig. 3a,c)11. Together, these data show that the E-repeat serves as a multivalent binding platform for PTBP1, MATR3, CELF1, and TDP-43; that binding of TDP-43 and PTBP1 to the E-repeat persists once XCI initiation completes; and that family members can replace PTBP1 on Xist.
Next, we asked whether recruitment of PTBP1, MATR3, CELF1 or TDP-43 by Xist could be microscopically detected within the Xi during XCI initiation and upon transition to the Xist-independent phase of XCI after day 3 of differentiation8. We observed an Xi-accumulation of CELF1 that increases in intensity from day 3 to day 7 of female ESC differentiation and noted a mesh-like pattern of PTBP1 localization within the Xi-territory of some cells at day 7 of differentiation (Extended Data Fig. 4a–e). Although MATR3, TDP-43, and PTBP1 did not enrich in the Xi in most cells, they were not depleted (Extended Data Fig. 4e–h) (Supplementary Note 2). Thus, PTBP1, MATR3, and TDP-43 are present, and CELF1 gradually concentrates, within the Xi-territory; findings that are consistent with the time-dependent formation of a spatially concentrated protein assembly.
If PTBP1, MATR3, CELF1 and TDP-43 control the Xi-accumulation of Xist, loss of the E-repeat should disrupt XCI by reducing Xist enrichment within the X-chromosome territory. In support of this hypothesis, it has been shown that Xist exon 7 containing the E-repeat is required for persistent localization of Xist on the Xi in differentiating ESCs23. We tested this possibility by deleting the E-repeat on the 129 allele in a polymorphic 129/cas female ESC line that also harbors 11 copies of an MS2-RNA tag within Xist, yielding the X129Xist ΔE, MS2 XCasXist WT genotype (ΔE ESCs) (Fig. 1a, Extended Data Fig. 5). RNA FISH revealed that the number of cells containing an Xist-coated X-chromosome increased gradually until differentiation day 4 in both wild-type (WT) and ΔE cells (Fig. 1b,c). Surprisingly, the proportion of ΔE cells with an Xist enrichment then declined compared to WT, reaching a significant ~50% reduction by day 7 (Fig. 1c). This reduction was specific to the 129Xist ΔE, MS2 allele as revealed by RNA FISH against the MS2 tag (Fig. 1d), and occurred without significant difference in Xist-MS2 abundance or half-life compared to WT (Extended Data Fig. 6a,b). RNA FISH against an intronic Xist sequence labeled the nascent transcription site and not the Xist cloud (Extended Data Fig. 6c), indicating that the RNA coating the Xi in WT and ΔE cells is processed. Thus, the loss of the ΔE-Xist accumulation over the X-territory is not a consequence of decreased Xist abundance, splicing defects, or reduced RNA stability.
Fig. 1: The E-repeat mediates Xist sequestration and controls Xist foci number.
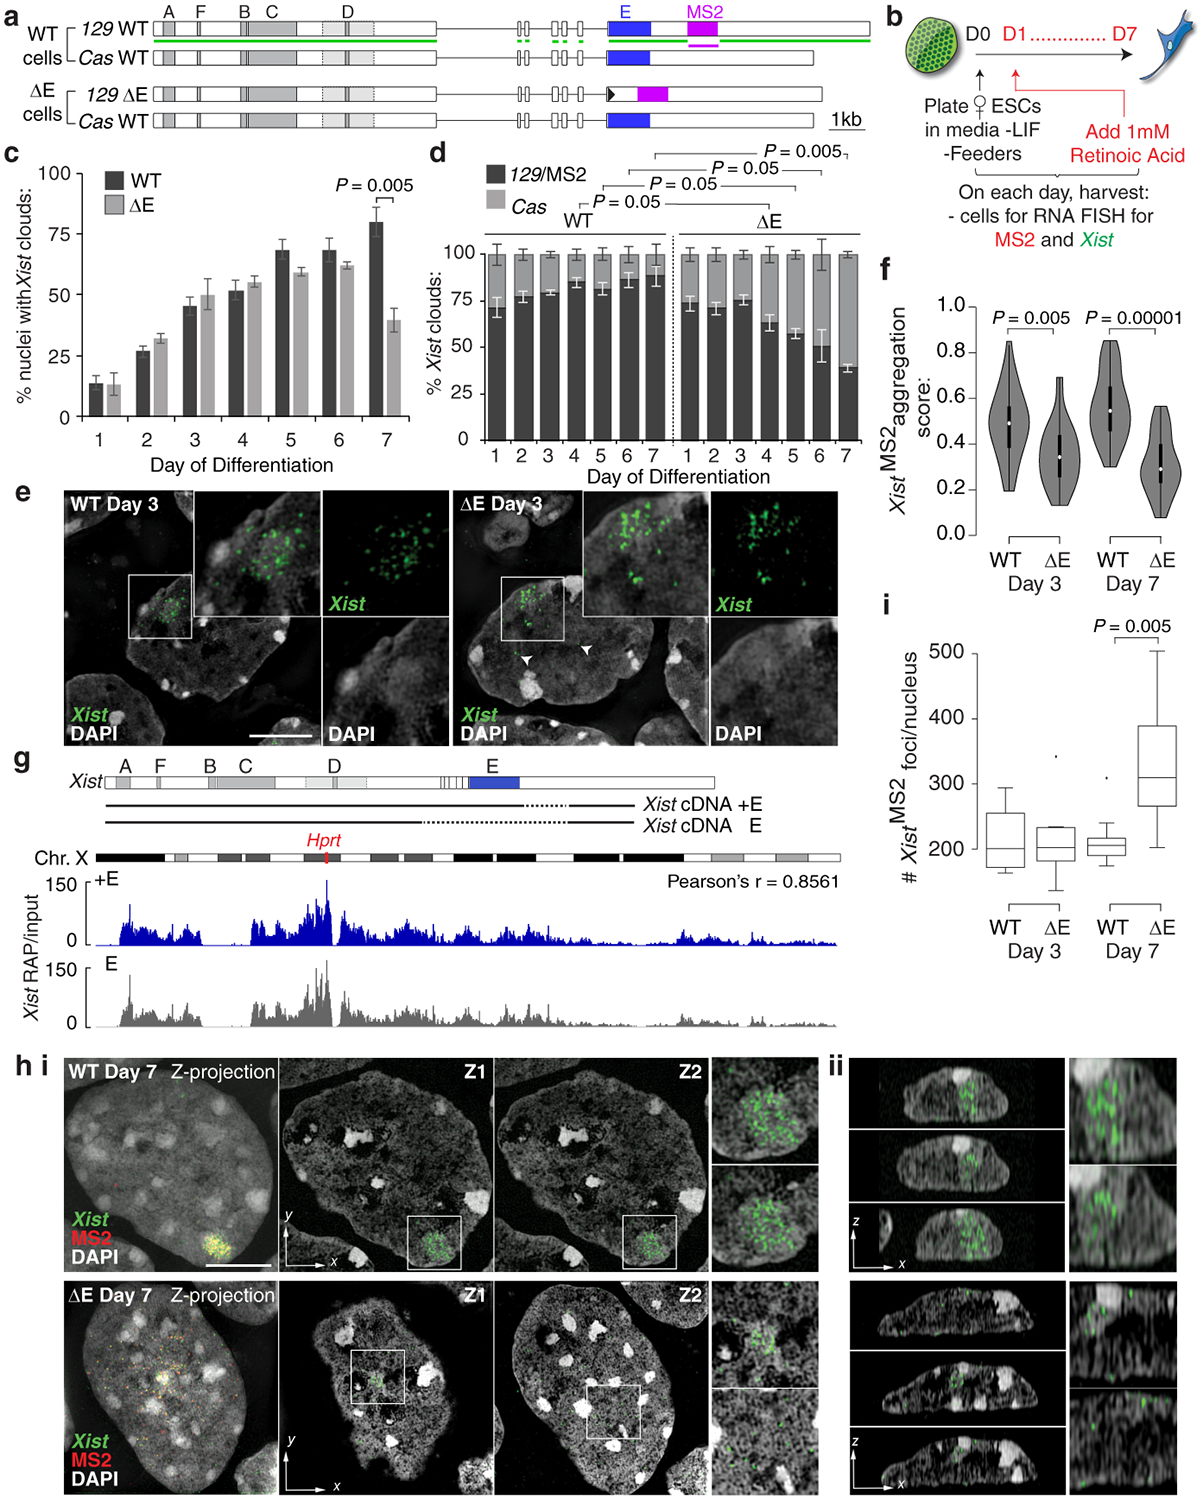
a, Xist alleles in female WT and ΔE ESCs. Green (Xist) and magenta (MS2) lines indicate FISH probes.
b, Experimental schematic.
c, Graph showing number of nuclei with an Xist cloud (n=100) at the indicated day of WT and ΔE ESC differentiation. Error bars indicate s.e.m across 3 replicates; 2-tailed students t-test.
d, Graph showing allelic origin of Xist clouds (n=50). Error bars represent s.e.m; 2-tailed students t-test.
e, 3D-SIM sections showing Xist RNA FISH signals from the MS2+Xist129 allele at differentiation day 3 in WT and ΔE cells. Arrowheads indicate ΔE-XistMS2 foci located away from the Xist cloud. Inset: Enlargement of marked region. Right: Same as inset with DAPI and Xist signals separated. Bar; 5μm.
f, Violin plots showing aggregation scores of MS2+Xist129 clouds (n=30) from one replicate in (d); test: 2-sample KS. Violin plots depict median (white) and interquartile range (black), trimmed (grey) to represent data minimum and maximum values.
g, Top: Tet-inducible Xist cDNA transgenes inserted into Hprt locus in male ESCs. Dashed lines indicate deleted regions. Bottom: RAP-seq profile of +E- and ΔE-Xist across the X-chromosome after 6h of dox treatment in ESCs (from one experiment).
h i, Left panel: 3D-SIM Z-projection of Xist and MS2 RNA FISH signals from WT or ΔE MS2+Xist clouds at differentiation day 7, merged with DAPI. Bar; 5μm. Next large panels: Xist/DAPI signals from two different Z-planes. Right small panels: Enlargements of Xist signal from each Z-plane. ii, Y-plane sections through cells in (i) showing Xist localization relative to the nuclear lamina. Right: Enlargements of the area with Xist.
i, Box plot of the distribution of Xist RNA foci number from the WT or ΔE MS2+Xist allele (n=10); test: 2-sample KS. Horizonal lines denote the median, whiskers indicate 1.5x the interquartile range, dots represent outliers.
A closer inspection of Xist localization at differentiation day 3 showed that ΔE-Xist enriched over the X-chromosome with aggregation measurements (see methods) revealing only a modest defect in ΔE-Xist localization compared to WT (Fig. 1e,f,). RAP-seq2 revealed highly correlated patterns of Xist association across the X-chromosome for WT and ΔE-Xist (Fig. 1g), indicating that the E-repeat is not involved in the initial transfer of Xist across the X-chromosome. However, ΔE-Xist was strikingly and significantly dispersed within the nucleus at day 7 compared to WT, often localizing at the nuclear lamina (Fig. 1f,h, Extended Data Fig. 6d–j). Super-resolution 3D-SIM imaging additionally revealed a significant increase in the number of individual Xist-MS2 foci in ΔE compared to WT cells at differentiation day 7; a difference not seen on day 3 (Fig. 1i). As this increase occurred without an increase in ΔE-Xist transcript abundance compared to WT Xist (Extended Data Fig. 6a), our imaging data support a model in which the E-repeat is required for integration of multiple Xist transcripts into individual Xist foci and for stabilizing these foci within the X-chromosome compartment.
Consistent with the emerging Xist localization defects, we observed lower H3K27me3 enrichment and reduced chromatin compaction over the Xi-territory at differentiation day 7 in ΔE cells, despite normal establishment at day 3 (Extended Data Fig. 7a–e). The ΔE-Xist localization phenotype arises as the enrichment of the PRC2 complex on the Xi normally decreases18,19 (Extended Data Fig. 7f), suggesting that it is associated with a reorganization of the X-chromosome compartment (Supplementary Note 3). Together, these results reveal a transition in the mechanisms that enrich Xist on the X-chromosome during XCI initiation, switching from a largely E-repeat-independent to an E-repeat-dependent phase.
As the control of Xist localization switches upon transition to the Xist-independent-phase of XCI-initiation8, we addressed whether X-linked gene silencing was affected by loss of the E-repeat. We examined nascent transcripts from five X-linked genes subject to XCI: Gpc4, Rnf12, Mecp2, Chic1, and Atrx (Fig. 2a,b). We observed little difference in the extent of gene silencing between WT and ΔE cells early during differentiation (Fig. 2c,d; Extended Data Fig. 8). However, at later stages of differentiation (days 4–7) ΔE-Xist expressing cells failed to maintain silencing of the five genes (Fig. 2c,d; Extended Data Fig. 8). Moreover, RNA PolII, which was excluded from the ΔE-Xist-marked territory during early differentiation, intermingled with the ΔE-Xist foci at later times (Fig. 2e; Extended Data Fig. 7g–i). The E-repeat is thus essential for sustaining Xist coating, silencing of X-linked genes and exclusion of RNA-PolII beyond the initial wave of transcriptional shutoff. Moreover, the Xist-independent state of XCI initiation8 is not established in the absence of the E-repeat, demonstrating that Xist generates the epigenetic memory for gene silencing through the E-repeat.
Fig. 2: The E-repeat establishes heritable gene silencing.
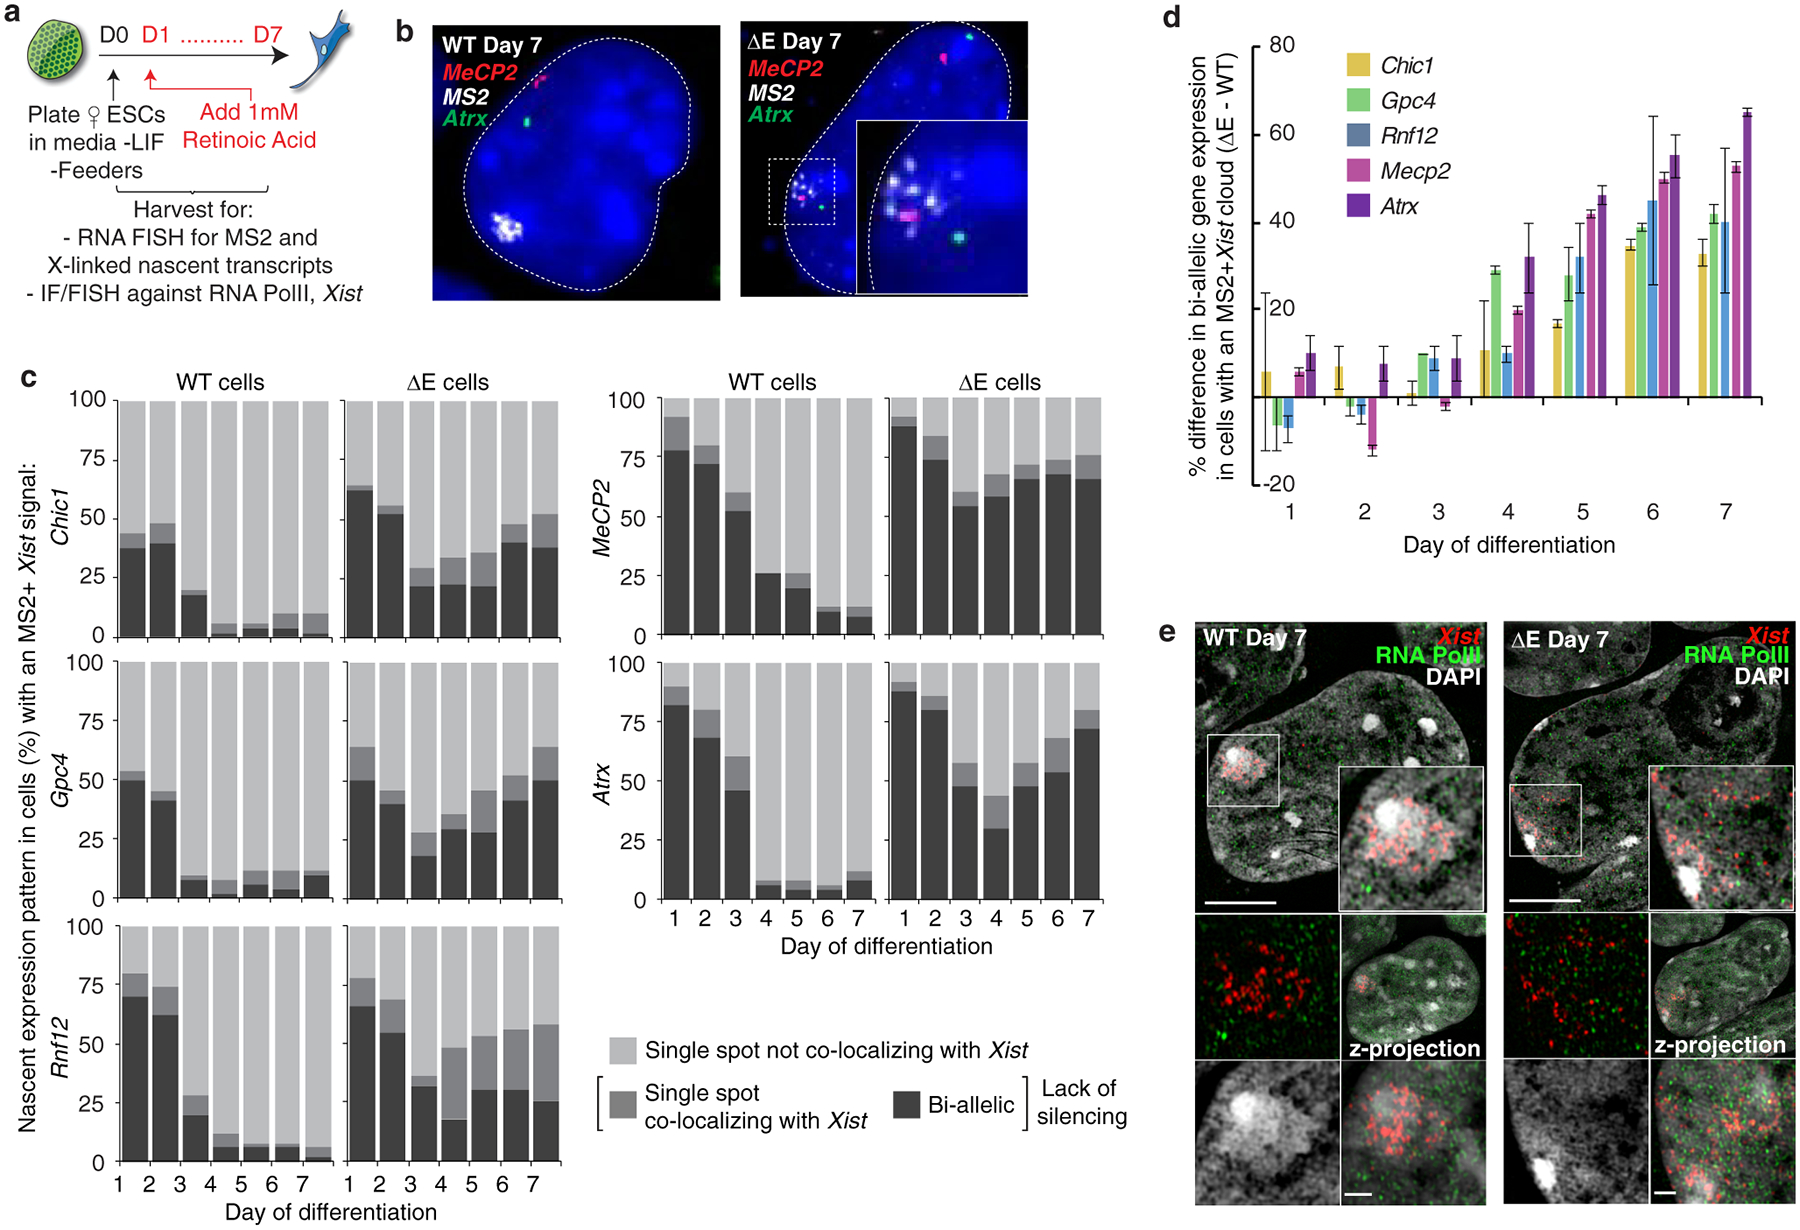
a, Experimental schematic.
b, Epifluorescence images showing the predominant nascent expression pattern of X-linked genes Mecp2 (red) and Atrx (green) in WT (mono-allelic expression from Xa) and ΔE cells (bi-allelic expression) with MS2+Xist signal (white) at differentiation day 7. Inset: enlargement of marked region highlighting the fainter, dispersed ΔE-Xist MS2 signal.
c, Quantification of nascent expression patterns of indicated X-linked genes in WT and ΔE cells displaying an MS2+Xist-coated X-chromosome (n=50), across 7 days of differentiation. Results were replicated three times.
d, Graph showing the mean percentage difference in bi-allelic nascent gene expression (lack of silencing) between ΔE and WT cells with an MS2+Xist cloud, across 7 days of differentiation. Error bars represent the s.e.m..
e, 3D-SIM sections through WT and ΔE cells expressing MS2+Xist at differentiation day 7, stained for RNA-Pol II (green) and DAPI (grey), probed for Xist (red). Inset: Magnification of the marked region. Four small images below the large image, clockwise starting at top left: same as inset without DAPI; z-projection of the whole nucleus; z-projection of the inset; same as inset only showing DAPI. Bars: 5μm; inset:1μm.
To test a causal relationship between the E-repeat-binding RBPs, Xist localization and gene silencing, we synthetically fused PTBP1, MATR3, CELF1, or TDP-43 to the MS2-coat protein (MCP) to recruit these proteins to ΔE-Xist via the 11xMS2-tag (Fig. 3a; Extended Data Fig. 9a–d). Continued expression of the MCP-PTBP1, MCP-MATR3, MCP-TDP-43, or MCP-CELF1 fusion proteins during differentiation in ΔE cells rescued Xist localization, silencing of Gpc4 and Atrx, and H3K27me3 enrichment on the 129ΔE,MS2 X-chromosome at differentiation day 7 (Fig. 3b–e; Extended Data Fig. 9e,f). These data demonstrate that the E-repeat controls Xist localization, gene silencing, and heterochromatin formation via its interacting proteins PTBP1, MATR3, TDP-43 and CELF1.
Fig. 3: PTBP1, MATR3, TDP-43 and CELF1 confer the gene silencing and Xist sequestration function on the E-repeat.
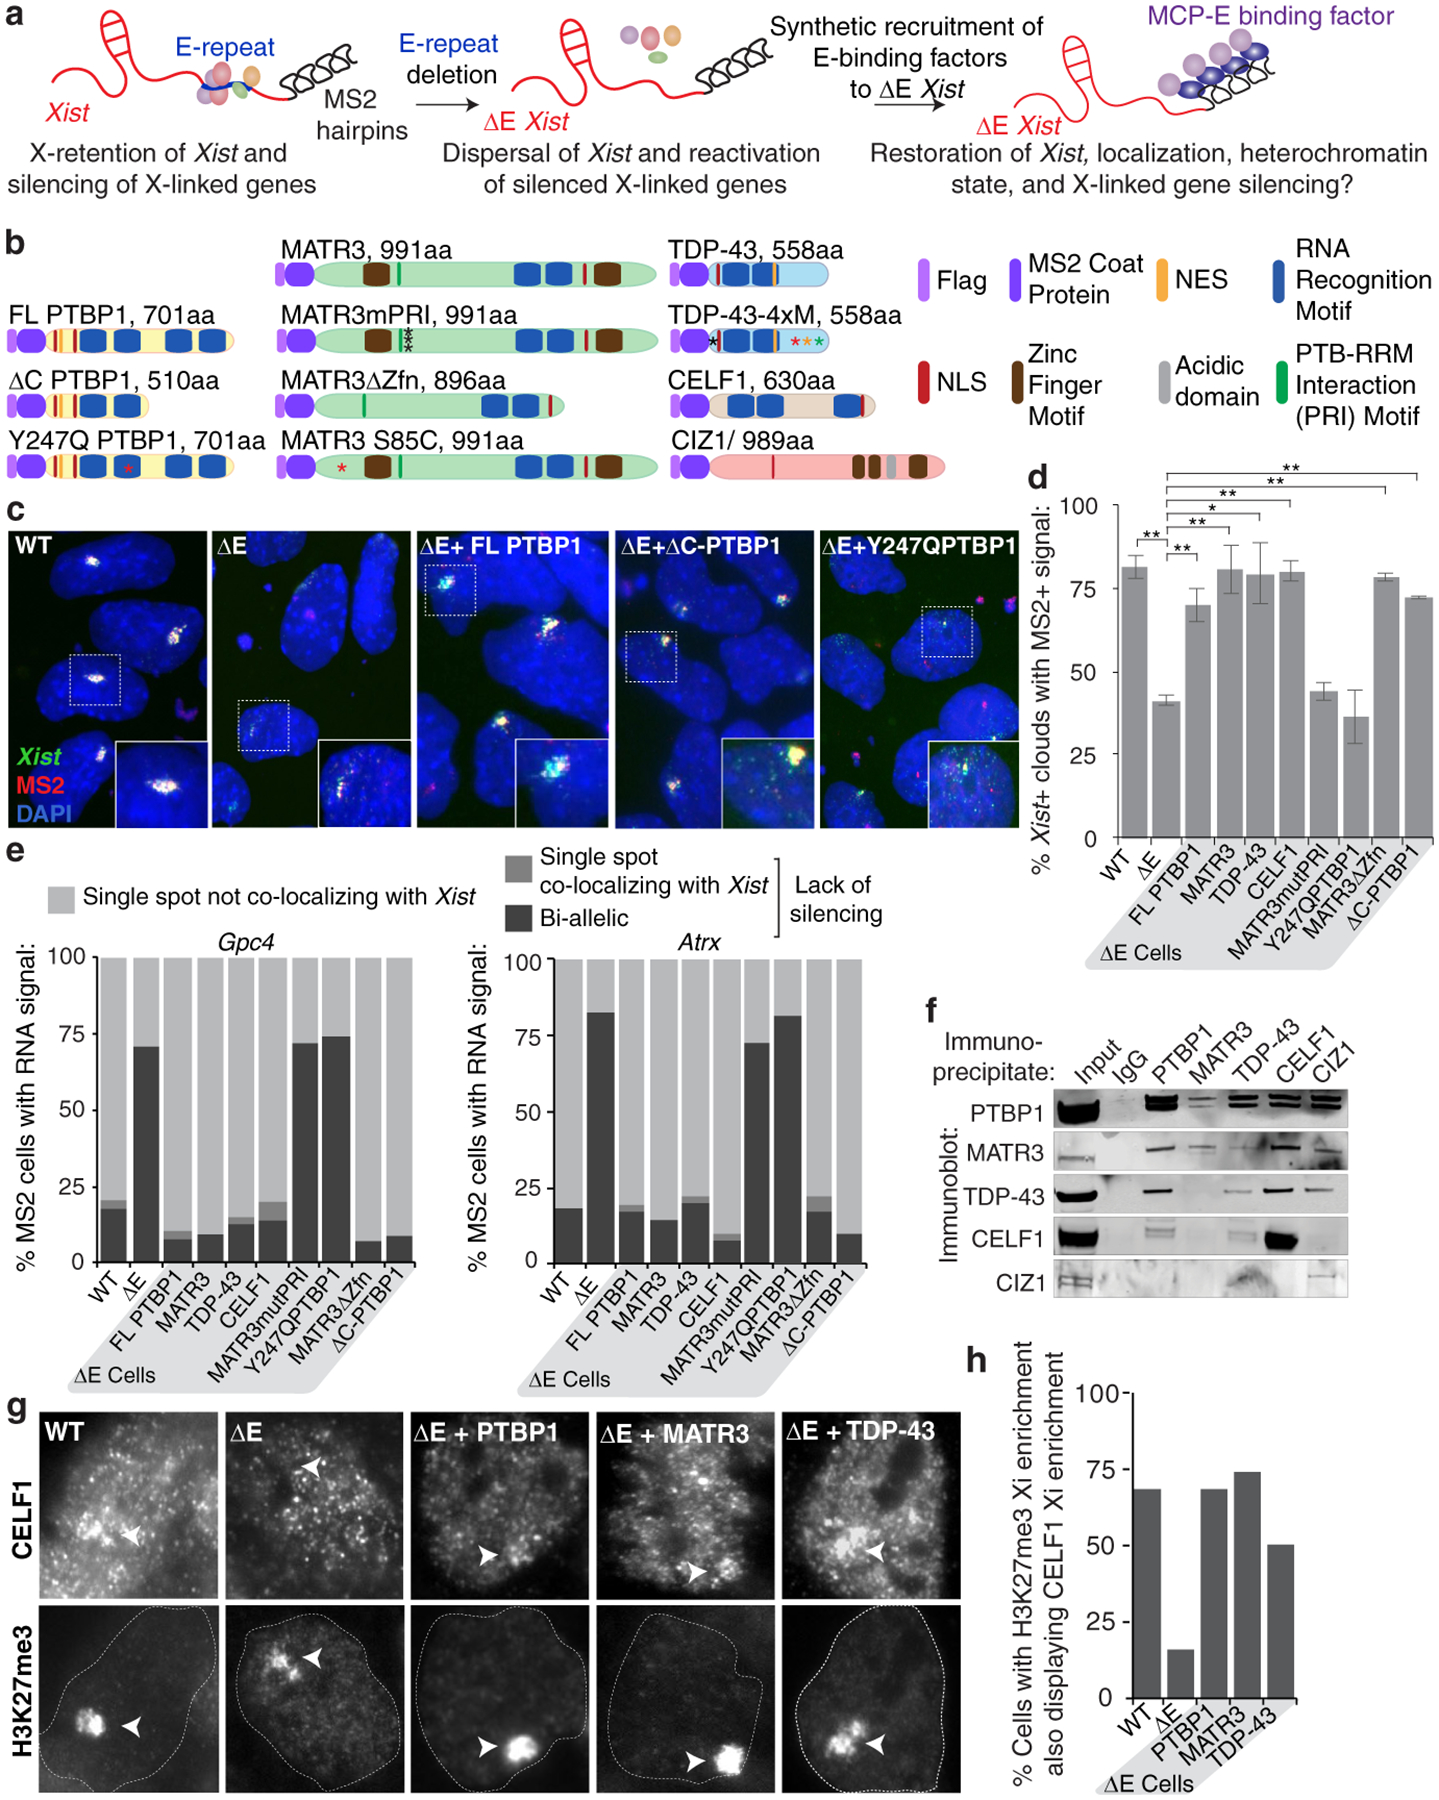
a, MCP-fusion protein rescue approach for ΔE-MS2 Xist.
b, Illustration of Flag-tagged MCP-fusion proteins and mutants. Point mutations are indicated with asterisks. Length of fusions includes the Flag and MCP sequences.
c, Representative epifluorescence images of RNA FISH against Xist and MS2 in day 7 differentiated WT, ΔE, and ΔE lines expressing variants of MCP-PTBP1 fusions. Inset: enlargement of marked region.
d, Histogram showing the proportion of nuclei with an Xist FISH signal (n=80) that also displayed a co-localizing MS2 signal at differentiation day 7 in WT, ΔE, or ΔE lines expressing the indicated MCP-fusion proteins. Error bars represent the s.e.m from two independent experiments; *P <0.05, ** P< 0.005, 2-tailed students t-test.
e, Quantification of nascent Gpc4 or Atrx expression pattern in cells expressing MS2+Xist (n=50) at differentiation day 7. Experiment was repeated twice with similar results.
f, Immunoprecipitation of PTBP1, MATR3, CELF1, TDP-43 and CIZ1 from ESC extracts (no RNase) and detection of co-precipitated proteins by immunoblotting, using the same antibodies. Similar results were obtained from three independent trials; for source data see Supplementary Fig. 1.
g, Representative epifluorescence images showing CELF1 enrichment on the Xi in WT, ΔE or ΔE rescue-cell lines expressing MCP-PTBP1, -MATR3 or -TDP-43 at day 7 of differentiation. Arrowheads indicate the Xi marked by H3K27me3-enrichment.
h, Histogram showing the percentage of WT, ΔE or ΔE rescue-cell lines with H3K27me3 Xi-enrichment that also display a co-localizing accumulation of CELF1 at differentiation day 7 (n= 50, from one experiment).
Next, we addressed whether PTBP1, MATR3, TDP-43 and CELF1 act together to control these processes. Making use of a known direct interaction between PTBP1 and MATR320, we found that MCP-MATR3 harboring a mutant PTBP1-RRM-Interaction (PRI) sequence (MATR3mPRI)20 partially rescued H3K27me3 enrichment, but was unable to rescue the Xist localization and gene silencing defects observed upon loss of the E-repeat (Fig. 3b,d,e; Extended Data Fig. 9c–f). Similar results were observed with the converse mutation in PTBP1 (Y247Q)20 that prevents interaction of PTBP1 with MATR3 (Fig. 3b–e; Extended Data Fig. 9c–e). These findings are supported by co-immunoprecipitation experiments demonstrating that PTBP1, MATR3, CELF1 and TDP-43 co-precipitate one another in the presence of RNA, whereas only PTBP1 and MATR3 robustly interact after RNase treatment (Fig. 3f; Extended Data Fig. 9g). These data uncover that a specific direct interaction between PTBP1 and MATR3 is critical for XCI and consequently show that these factors act non-redundantly in this process. Furthermore, that CELF1 enriches on the Xi in ΔE rescue cells expressing MCP-PTBP1, MCP-MATR3 or MCP-TDP-43 (Fig. 3g,h), indicates that each of these RBPs can initiate the formation of a heteromeric protein assembly within the Xi.
The protein CIZ1 was previously suggested to anchor Xist to chromatin via the E-repeat24,25. Although PTBP1 and MATR3 can interact with CIZ1, expression of MCP-CIZ1 in ΔE cells did not rescue Xist cloud formation or X-linked gene silencing (Fig. 3f; Extended Data Fig. 9g, 10a–e). Moreover, the Xi-accumulation of CIZ1 observed in WT cells was not detected in ΔE cells expressing MCP-PTBP1, -MATR3, or -TDP-43 (Extended Data Fig. 10f) (Supplementary Note 4), indicating that the rescue of ΔE-Xist phenotypes by PTBP1, MATR3, TDP-43 and CELF1 is independent of CIZ1 and that distinct functional complexes assemble on the E-repeat. A bivalent MCP-GFP-MCP fusion was also unable to rescue the Xist localization and silencing defects in ΔE cells (Extended Data Fig. 10g–k), consistent with linkages formed by the four factors not simply tethering Xist transcripts together.
In defining additional specific activities conferred by the recruited proteins that could facilitate compartmentalization of Xist and downstream events in XCI, we found that rescue of the ΔE-Xist phenotypes by MATR3 is independent of its zinc fingers (MATR3ΔZfn) (Fig. 3b,d,e; Extended Data Fig. 9c–f). We also noted that expression of PTBP1 lacking RNA recognition motifs (RRMs) 3 and 4 (ΔC-PTBP1) in ΔE cells rescued defects resulting from E-repeat loss, although closer inspection of the ΔE-Xist clouds binding MCP-ΔC-PTBP1 revealed dispersed Xist foci within the nucleus (Fig. 3b–e and Extended Data Fig. 9c–e). This finding implicates binding valency as a functional parameter of the PTBP1-Xist assembly.
The formation of an Xist territory containing PTBP1 was interesting given that PTBP1 can undergo liquid-liquid de-mixing in vitro when incubated at high concentration with a binding RNA15. Therefore, we asked whether rPTBP1 forms liquid-droplets upon interaction with the Xist E-repeat. Addition of 3.2μM E-repeat RNA to 60μM rPTBP1 produced aggregate-like assemblies15,16 whereas lower RNA concentrations (0.1–0.5uM) resulted in droplets resembling phase-separated liquids that could fuse with each other (Fig. 4a,b; Extended Data Fig. 11a,b) (Supplementary Note 5). In contrast, smaller droplets were produced by a control RNA (containing 5 short CU-tracts that could bind PTBP1), with no observed aggregation at the highest RNA concentration (Fig. 4a). These findings indicate that the multivalent binding of PTBP1 to the E-repeat strongly promotes its condensation. A lack of droplet formation at near-physiological concentrations of rPTBP1 (20–40uM), suggested that additional proteins promote the E-repeat induced condensation of PTBP1 in vivo (Fig. 4c; Extended Data Fig. 11c), which is consistent with the interdependence of MATR3, PTBP1, CELF1 and TDP-43 function described above. We tested this idea by adding 20uM rCELF1 to solutions containing 0.5μM E-repeat RNA and varying concentrations of rPTBP1. Whereas aggregates formed at high rPTBP1 concentrations, lowering the rPTBP1 concentration decreased the size of the aggregates until they resolved into small spherical structures at 20μM (Extended Data Fig. 11d,e). These observations are consistent with the formation of a higher-order protein condensate in the Xi that forms via multivalent binding of several RBPs to the E-repeat and suggest that the involvement of multiple RBPs lowers the concentration of each factor for condensate induction.
Fig. 4: Self-association of E-repeat binding RBPs is critical for Xi-compartment formation.
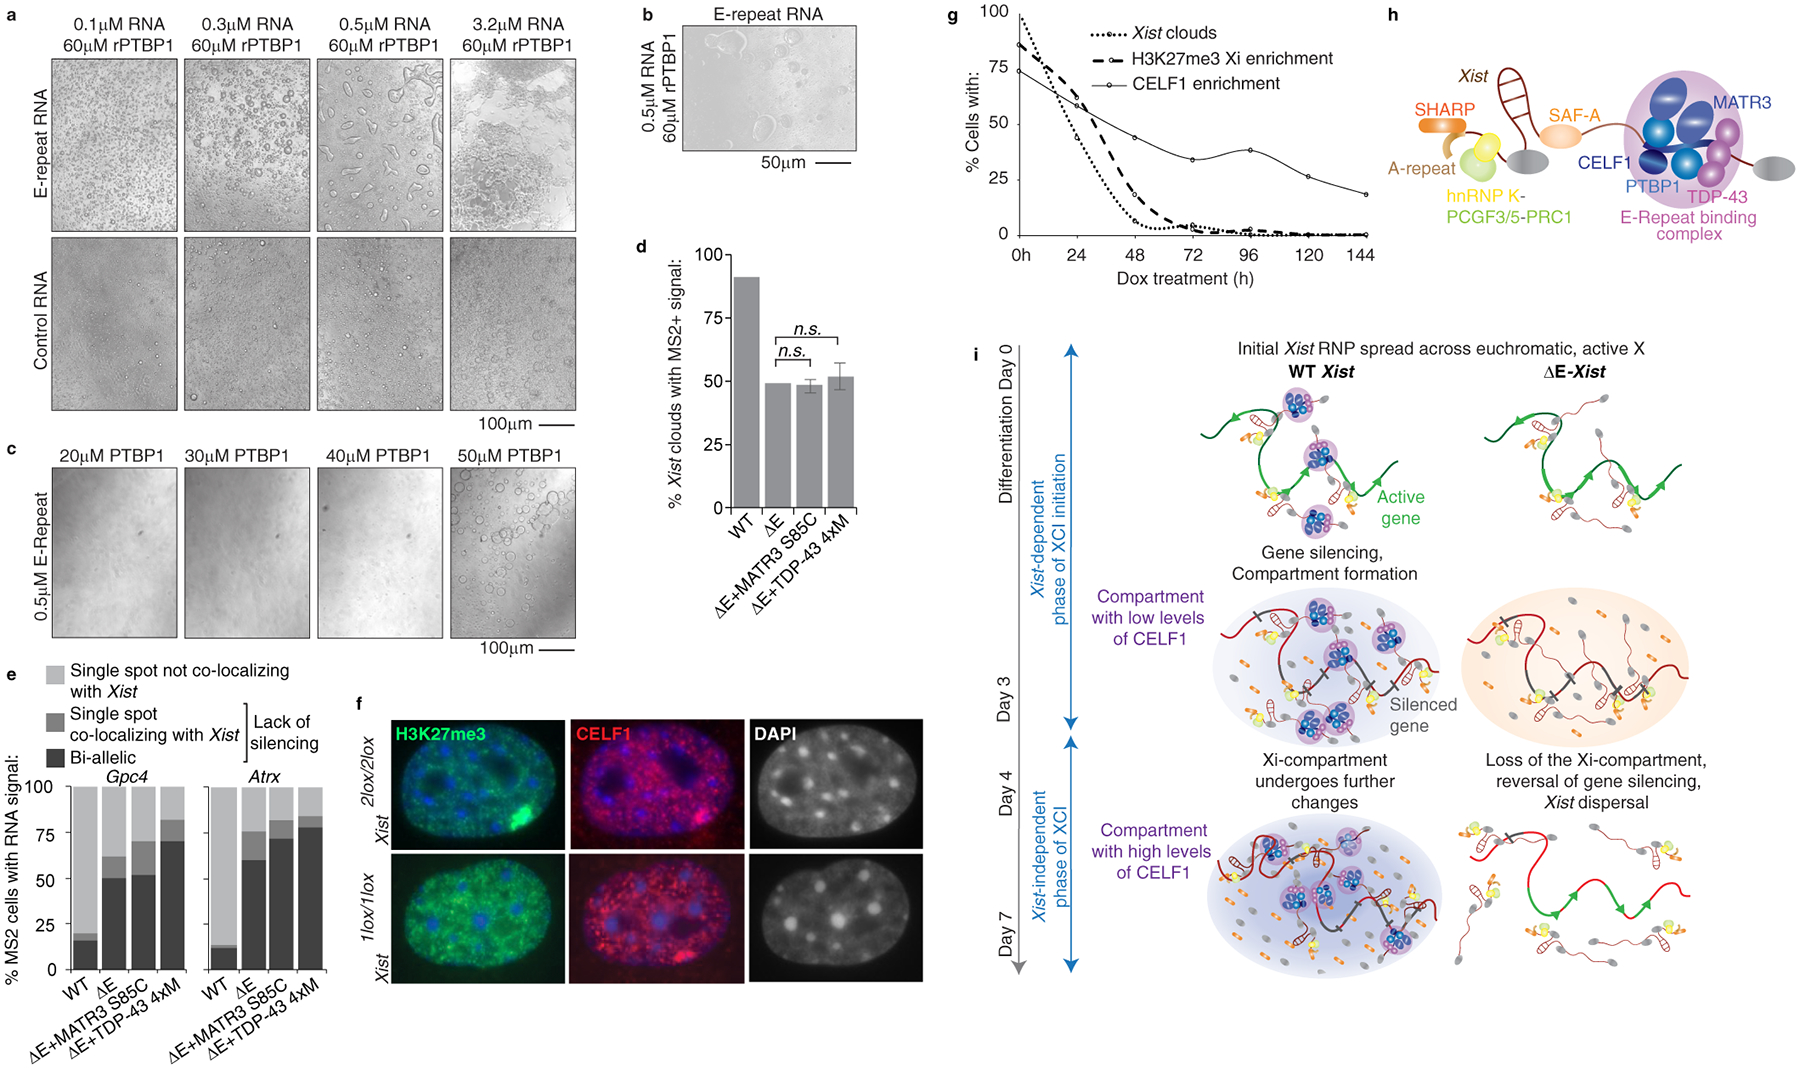
a, Brightfield images of droplets formed with rPTBP1 and E-repeat or control-RNA.
b, Brightfield image of droplets undergoing fusion (arrows).
c, Brightfield images of droplets formed with 0.5μM E-repeat-RNA and decreasing amounts of rPTBP1. For a-c, images were taken after 40 minutes.
d, Graph showing the number of nuclei with an Xist FISH signal (n=100) at differentiation day 7 that also displayed a co-localizing MS2 signal in WT, ΔE, or ΔE lines expressing indicated MCP-fusion proteins. Error bars represent s.e.m. from two independent experiments; 2-tailed students t-test.
e, Histograms showing nascent Gpc4 or Atrx expression patterns in cells described in (d) expressing MS2+Xist; (n=50, from one experiment).
f, Representative images showing H3K27me3, CELF1 and DAPI staining in Xist2lox/2lox, Rosa26M2rtTA/tetO-Cre-recombinase MEFs before (2lox/lox) or after 96h of dox addition (1lox/1lox).
g, Graph showing the percentage of MEFs described in (f) with an H3K27me3 or CELF1 Xi-enrichment over a 144h time-course of dox treatment; (n = 50) from one experiment.
h, Illustration of the E-repeat-bound Xist ribonucleoprotein complex (RNP) with PTBP1, CELF1, MATR3, and TDP-43 binding to the E-repeat and undergoing additional protein-protein interactions. Other Xist-interactors are indicated.
i, Model for Xi-compartment formation via protein condensation (Supplementary Note 6). WT Xist: Upon differentiation, the Xist RNP spreads across the X-chromosome and induces the formation of a higher-order assembly by recruiting additional protein molecules into the Xist-territory through extensive homo- and heterotypic protein-protein interactions (background purple oval). We postulate that the condensate, in addition to E-repeat-interactors, integrates other proteins (grey) including SHARP3 (orange). The assembly changes over time as indicated by low and high CELF1 levels, respectively. ΔE-Xist: Without the E-repeat, Xist localization and X-linked gene silencing initiate normally (middle), potentially through non-E-repeat-dependent protein condensation events (orange oval), yet, cannot be reinforced later, despite the Xist-independence of XCI at this point.
We reasoned that self-association of proteins might also increase the local concentration of E-repeat interactors. To this end, we assessed whether self-assembly of TDP-43 affected XCI. TDP-43 forms higher-order complexes that undergo liquid-liquid phase separation and this activity is reduced by several mutations: S48E, W334G, W385G and W412G11. Unlike WT TDP-43, MCP-TDP-43–4xM fusion harboring these mutations did not rescue phenotypes associated with ΔE-Xist (Fig. 3b, 4d,e; Extended Data Fig. 11f–h), suggesting that self-association of TDP-43 permits the few available TDP-43 sites to support recruitment of multiple TDP-43 monomers. Similar results were obtained with a MATR3 S85C mutant which was previously shown to impair droplet formation, and TDP-43 recruitment, by MATR317 (Fig. 3b, 4d,e; Extended Data Fig. 11f–h). Thus, through high-density binding to the E-repeat, Xist concentrates PTBP1, MATR3, TDP-43 and CELF1, which use homo- and heterotypic interactions to establish a physical condensate that compartmentalizes Xist and enforces X-linked gene silencing.
Our results implied that the condensate established by the E-repeat is crucial for the Xist-independent phase of XCI after day 3 of differentiation8, leading to the hypothesis that the PTBP1, MATR3, TDP-43 and CELF1-containing condensate can be retained in the Xi in the absence of Xist. To test this idea, we confirmed that CELF1 shows Xi-enrichment in primary female mouse embryonic fibroblasts carrying a conditional Xist allele (Fig. 4f). Upon Xist deletion, loss of H3K27me3 Xi-accumulation closely followed the loss of Xist over time (Fig. 4f,g; Extended Data Fig. 11i–k). Strikingly, CELF1 enrichment remained in 25–40% of cells even after Xist or H3K27me3 Xi-enrichment became undetectable (Fig. 4g and Extended Data Fig. 11i–k). CELF1 enrichment was dependent upon PTBP1, MATR3 and TDP-43, as their depletion in the absence of Xist resulted in fewer cells with CELF1 Xi-accumulation (Extended Data Fig. 11l–q).
We conclude that the E-repeat-seeded protein condensate is stable without Xist and is critical for the enforcement of silencing during the Xist-independent phase of XCI in differentiating ESCs. Our findings uncover a mechanism for the establishment of a functional RNA-seeded nuclear compartment and reveal an unanticipated mechanism for RBP-mediated gene regulation and epigenetic memory (Fig 4h,i; Supplementary Note 6).
Methods
Cell Culture
All mouse ESC lines were cultured in knockout DMEM (Life Technologies) supplemented with 15% FBS (Omega), 2 mM L-glutamine (Life Technologies), 1× NEAA (Life Technologies), 0.1 mM Beta-Mercaptoethanol (Sigma), 1xPenicillin/Streptomycin (Life Technologies), and 1000 U/mL murine LIF (homemade) on 0.3% gelatinized plates (porcine skin gelatin, Sigma) pre-plated with irradiated male DR4 feeders (homemade from day 14.5 embryos with appropriate protocols in place ensuring the ethical treatment of animals). For 3D-SIM microscopy experiments (see below), ESCs were maintained in 2i culture conditions without feeders, prior to differentiation26. No differences in results upon cell differentiation were observed between the ESC propagation conditions. ESCs were maintained as small colonies and passaged with trypsin and single cell dissociation at 80% confluency.
Female ESC Differentiation
Female WT F1 2–1 MS2129 (and derivatives thereof)27 were trypsinized to single cells and counted. Cells were seeded in 2mL of mouse embryonic fibroblast (MEF) medium [DMEM (Invitrogen) supplemented with 10% FBS (Omega), 2 mM L-glutamine (Life Technologies), 1× NEAA (Life Technologies), 0.1 mM Beta-Mercaptoethanol (Sigma) and 1xPenicillin/Streptomycin (Life Technologies)] at a density of 20,000 – 200,000 cells/4cm2 (depending on the experiment) on tissue culture plates for Western Blotting or onto 18mm sterile glass coverslips for IF/FISH experiments, both of which were pre-coated with sterile 0.3% gelatin (porcine skin gelatin, Sigma) or Matrigel (Corning, diluted 1:100). 24 hours post-seeding, the culture medium was changed and supplemented with 1μM all-trans Retinoic Acid (Sigma), which was changed daily thereafter until the cells were harvested for analysis.
Female MEF culture
Female MEFs (Xist2lox/2lox, R26M2rtTA/tetO-Cre-Recombinase)28 were maintained in MEF medium. To delete Xist, cells were treated with 2μg/mL doxycycline (Sigma) for up to 144h to induce expression of Cre-recombinase.
Male ESC culture
Male ESCs were maintained as described above. To express Xist, ESCs were trypsinized to single cells and counted. Cells were seeded in 2mL of mouse embryonic cell media (see above) at a density of 20,000 – 200,000 cells/4cm2 (depending on the experiment) on tissue culture plates for Western Blotting and RNA collection or onto 18mm sterile glass coverslips for IF/FISH experiments, both of which were pre-coated with sterile 0.3% gelatin (porcine skin gelatin, Sigma) or Matrigel (Corning, diluted 1:100 in cold DMEM media). For knockdown experiments, siRNA’s were added upon plating (see below). For Xist expression, doxycycline (Sigma) was added to a final concentration of 2μg/mL for 6–24h, depending on the experiment.
RNA FISH
FISH against Xist RNA was performed using both RNA and DNA probes. FISH against the MS2-insert, Atrx, Gpc4, Mecp2, Rnf12 and Chic1 was performed using DNA probes. In undifferentiated ESCs, the DNA probe against Xist additionally detects Tsix.
RNA Probe Preparation:
Strand-specific RNA probes were generated using a T3 in vitro transcription kit (Promega) in the presence of Chromatide AlexaFluor-UTP (ThermoFisher). Six ~700nt transcription templates were generated from Xist exon 1 (Primers UCLA 1416 – 1429, Supplementary Table 1), and used in transcription reactions containing 0.5mM ATP, CTP, GTP, 0.1mM UTP, and 0.05mM Chromatide AlexaFluor488-UTP (Life Technologies) along with 1x T3 transcription buffer supplemented with 10mM DTT, 500U RNase inhibitor, 170U T3 RNA polymerase and 5μg of pooled template DNA in a final volume of 500μL at 37°C overnight in the dark. The transcription reaction was treated with 15U RNase-Free DNase for 15 minutes at 37°C prior to probe purification. To purify the probes, 1/3 of the transcription reaction was loaded on a pre-spun (700xg, 5minutes) Chromaspin-100 column (Clontech) and centrifuged (700g, 5 minutes). The eluates were combined and precipitated with 100% EtOH in the presence of 100mg tRNA and 1/10th volume of sodium acetate (Sigma). We sometimes also purified RNA probes using a 2.5x volume of AMPure beads (ThermoFisher 09-981-123, reconstituted according to29), which were washed twice on a magnet with 80% ethanol before elution of the probes from the beads with 50μL water, followed by ethanol precipitation. The RNA pellet was washed twice in 70% ethanol, resuspended in 400μL of RNase Free water, to which 1mL EtOH was added for storage at −20C. To make the final probe mix, 1/7th of the Probe/EtOH solution was added to 90μL Salmon Sperm DNA (Sigma), 90μL mouse Cot1 DNA (Life Technologies), 40μL 3M RNase Free Sodium Acetate (Sigma), 40μL 10mg/mL tRNA (Life Technologies) and 1mL EtOH. After vigorous shaking, the solution was centrifuged at maximum speed for 10 minutes. The pellet was washed once with 70% EtOH and then once with 100% EtOH, allowed to dry completely, and then resuspended in 200μL deionized Formamide (VWR) and 200μL 2x Hybridization buffer [20% dextran sulfate (Sigma), 4x SSC (Ambion), 0.1M NaH2PO4]. Probes were stored at −80C and denatured at 95°C for 5 minutes before use.
DNA Probe Preparation:
For 3D-SIM and Airyscan experiments, FISH probes were labelled by nick translation as described previously30 using p15 cDNA plasmid as template and home-labelled Atto488-, Cy3- or Texas Red-conjugated dUTPs31. For all other experiments, DNA probes were synthesized using the CGH Bioprime Array Kit (ThermoFisher) according to manufacturer’s instructions. Briefly, a 40μL solution containing 100ng of template DNA was denatured in the presence of 1x random primers at 95°C for 5 minutes and snap cooled on ice. 5μL of nucleotide mix, 5μL of 488, 555-, or 594- dUTP or dCTP chromatide fluorphore (Life Technologies) and 5U Klenow exo- enzyme were then added and incubated in the dark at 37°C for 6 hours, after which an additional 5U of Klenow Exo- were added. The reaction was incubated at 37°C overnight, quenched with 10μL stop solution, and then purified over a Chromatide-100 column or AMPure beads as described above. The eluate was precipitated in the presence of 100mg yeast tRNA (Life Technologies) and sodium acetate (Sigma). The final DNA probe mix was then prepared as above to yield 400μL of probe solution in formamide/hybridization buffer.
The MS2 DNA template for DNA probe preparation was PCR amplified from genomic DNA purified from WT F1 2–1 MS2129 female ESCs (see Supplementary Table 1 for primers). For Xist, the DNA probe was synthesized using a full-length mouse Xist cDNA plasmid (p15A-31–17.9kb Xist, unpublished). The intron probe in Extended Data Fig. 6c was against intron 1, which is the longest intron within the gene. We were unable to get probes against other introns to work well in this assay presumably due to their short length and labile nature. Probes against X-linked genes were synthesized using BACs RP23–467J21 (Gpc4), RP23–265D6 (Atrx), WIBR1–2150D22 (Chic1), WIBR1–2704K12 (Rnf12) and W11–894A5 and W11–1189K18 (Mecp2) (all obtained from CHORI-BACPAC). Note that the use of 2 BAC’s for the Mecp2 probe sometimes resulted in nascent FISH signals from one X-chromosome that appeared as doublets (see Fig. 2b, WT panel).
RNA FISH Procedure for Epifluorescence Microscopy:
Culture medium was changed 10 minutes prior to harvesting cells to remove dead cells and stimulate transcription. Upon collection, culture medium was aspirated, and coverslips were gently rinsed twice with cold 1xPBS. Coverslips were then transferred to a new culture dish containing 1xPBS, which was then aspirated, and the cells were fixed in 4% paraformaldehyde (PFA) (Electron Microscopy Sciences) in 1× PBS for 10 minutes at room temperature (RT) under standard laboratory safety practices. After fixation, the cells were permeabilized in 0.5% Triton X-100 (Acros) in 1xPBS with 2mM Vanadyl Ribonucleoside Complex (NEB) for 10–20 minutes on ice. Coverslips were then stored in 70% ethanol at −20°C for 1 hour or until samples from all time points had been collected. Prior to hybridization with probe, the coverslips with cells were brought back to 4°C and serially dehydrated by 5-minute incubations in ice-cold 80%, 95% and 100% ethanol. Coverslips were removed from 100% ethanol and allowed to air dry prior to incubation with probe for 48 hours at 37°C in a sealed chamber humidified with 2xSSC / 50% Formamide. For RNA probes, coverslips were washed 3× 5 minutes in 50% formamide (Fisher) / 2xSSC (Ambion) and 3× 5 minutes in Wash Buffer II (10mM Tris, 0.5M NaCl, 0.1% Tween-20), prior to a 45 minutes incubation with 25 μg/mL RNaseA (ThermoFisher) in Wash Buffer II at 37°C. After RNaseA treatment, coverslips were washed 2× 5 minutes in Wash Buffer II, 2× 5 minutes in 50% formamide / 2× SSC, 3× 5 minutes in 2× SSC and 3× 5 minutes in 1× SSC before briefly drying excess 1× SSC off and mounting with Vectashield mounting media lacking DAPI (Vector Labs). Coverslips were sealed with Biotium Covergrip coverslip sealant (Thermo Fisher). For DNA probes, coverslips were washed 3× 5 minutes in 50% Formamide / 2xSSC, 3× 5 minutes in 2xSSC and 3× 5 minutes in 1xSSC prior to mounting. A 1:10,000 dilution of DAPI (0.5mg/mL) was included in all penultimate 1xSSC washes. All washes were conducted at 42°C, cells were protected from light. All procedures were performed, and used reagents disposed of, according to standard laboratory safety procedures.
The Xist RNA FISH probe used in our study covers the ~17.9kb exonic regions of Xist. The MS2 tag is ~1.1kb long and the MS2 FISH probe was designed to cover the entirety of the tag (see Fig.1a). Differences in the length of sequence targeted by these probes made the Xist probe signal much brighter than the MS2 probe signal when visualized microscopically. Consequently, in our RNA FISH experiments, we used both probes to differentiate between the cas (detected by the Xist probe only) and the 129 allele (detected by the Xist and MS2 probes) in both WT and ΔE cells. Using the Xist probe allowed for better detection of the extent of dispersal of the ΔE-Xist transcripts, which was important for our aggregation score calculations (see Extended Data Fig. 1e and below).
In the RNA FISH assay for the nascent transcripts of X-linked genes (Fig. 2b, c, d, Extended Data Fig. 8), the presence of two nuclear nascent transcript foci (or spots) is indicative of bi-allelic expression of the respective X-linked gene as is observed in undifferentiated ESCs that do not express Xist and have not yet initiated XCI (see Extended Data Fig. 8a,b). In cells expressing Xist, one focus on the X-chromosome lacking Xist indicates silencing (see Fig. 2b, WT cell). Conversely, we interpreted a single focus co-localizing with the X-chromosome expressing Xist (or MS2) as a lack of silencing. Cells expressing Xist with bi-allelic X-linked gene expression were also considered to have defective silencing (see Fig. 2b, ΔE cell).
RNA FISH Procedure for 3D-SIM and Improved-Resolution microscopy:
All coverslips were processed according to32.
Immunofluorescence Staining
The cell culture medium was changed 10 minutes prior to harvesting. Upon collection, culture medium was aspirated, and coverslips were gently rinsed twice with cold 1xPBS. Coverslips were then transferred to a new culture dish containing cold 1xPBS. If cells were CSK treated (MS2-CP-GFP expressing wild-type WT F1 2–1 MS2129 ESCs; Extended Data Fig. 9b), then coverslips were gently treated with 1mL (added dropwise) ice-cold CSK buffer [100mM NaCl, 300mM sucrose, 3mM MgCl2, 10mM PIPES pH 6.8] and incubated on ice for 30 seconds before aspiration. Coverslips were then similarly treated with 1mL ice-cold CSK-Trt Buffer (CSK+0.5% Triton X-100) for 30 seconds, followed with a second ice-cold CSK treatment. Coverslips were then processed as described in33. See Supplementary Table 2 for antibody information.
Immunofluorescence Staining combined with RNA FISH
Where immunostaining and RNA FISH were combined, immunostaining preceded FISH.
Combined Staining for Epifluorescence Microscopy:
The immunostaining protocol was followed as outlined above, but coverslips were not mounted. Instead, after the last round of washes (omitting DAPI in the penultimate wash), coverslips were re-fixed in 4% PFA in 1× PBS for 10 minutes at RT and then dehydrated through a 70-85-95-100% ice-cold ethanol series prior to overnight incubation with probe as described above in the RNA FISH procedure section.
Combined Staining for 3D-SIM and Improved-Resolution microscopy:
Plasmid Construction and Cell Line Generation
Xist-ΔE Targeting Construct:
To create the targeting vector pCR2.1-Puro-XistΔE, 3kb upstream and 1.2kb downstream of the mouse Xist E repeat were PCR amplified from mouse genomic DNA using primers WRM163–166, modified for In-Fusion cloning (Clontech) using Kapa polymerase (Kapa biosystems) according to the manufacturer’s instructions. The upstream homology arm was integrated at the EcoR1 site and the downstream homology arm at the BamH1 site, in a 4-piece InFusion cloning reaction, into a vector containing a floxed puromycin resistance cassette (PCR2.1-loxP-pGK-Puro-pA-loxP). Positive recombinants were identified by restriction digest of with HindIII and sequencing.
E-repeat Deletion in WT F1 2–1 MS2129 ESCs:
The Xist E repeat was deleted in female WT F1 2–1 MS2129 ESCs derived from an F1 cross of mice from pure bread 129 and castaneous background, and then targeted to contain a 11x tandem repeat of the MS2 hairpin located 1.2kb downstream of the E-Repeat27 via homologous recombination. The WT F1 2–1 MS2129 female ESCs also harbor an M2-reverse tetracycline TransActivator (M2rtTA) cassette within the Rosa26 locus that confers neomcyin resistance on the cells. Cells obtained from ½ of a confluent T75 flask of WT F1 2–1 MS2129 female ESCs were electroporated with 40μg of PciI linearized PCR2.1-Puro XistΔE targeting plasmid (800v, 0.2ms, 4mm cuvette, Biorad X-Cell electroporation module) and plated at varying dilutions on 10cm plates of confluent irradiated DR4 feeders. 36 hours after plating, the cells were selected with 1μg/mL puromycin for 10 days. 100 clones were picked, expanded and subjected to southern blot analysis using a Sac1 digest and an external probe (amplified using primers WRM193/194 (Supplementary Table 1) as outlined in Extended Data Fig. 5. The positive clone #35 was expanded in culture, then transfected with a Cre-recombinase plasmid using Lipofectamine 2000 according to the manufacturer’s protocol (Thermo Fisher), to delete the floxed puromycin resistance cassette. Transfected cells were serially diluted, 100 clones were picked, expanded and replica plated for growth in the presence or absence of puromycin. Sub-clone #96 was sensitive to puromycin. PCR analysis of genomic DNA confirmed the deletion of the puromycin cassette with primers APJ439/440 (Supplementary Table 1). Subsequent southern blot analysis and sequencing of WT Xist and ΔE Xist PCR amplicons from genomic DNA (Intron 6 to Exon 7 using APJ248/631 (Extended Data Fig. 5, Supplementary Table 1) showed that the ΔE targeting construct integrated on the 129 allele of Xist upstream of the MS2 tag, preserving the 3’ splice site of intron 6, to yield the heterozygous E-repeat deletion ESC line X129 Xist ΔE,MS2 XCas Xist WT (=ΔE ESCs) (Extended Data Fig. 5 and data not shown). Sequencing of the exon 6 - exon 7 RT-PCR amplicon (obtained from cDNA of differentiated ESCs) derived from the 129MS2 Xist transcript, revealed the use of a cryptic 3’ splice site downstream of the LoxP site (Extended Data Fig. 5). The use of the cryptic splice site extended the E-repeat deletion within the Xist transcript (as initially designed) by 42nt and removed the LoxP site and additional vector sequences present in the genomic DNA from mature ΔE Xist transcripts, resulting in a scar-less ligation of the 3’ terminus of exon 6 to nucleotide 1479 of Exon 7 (Extended Data Fig. 5 and data not shown). We ensured that ΔE ESCs maintained two X chromosomes throughout the targeting process and differentiated equally to WT as judged by changes in morphology, and loss of NANOG and Tsix expression upon induction of differentiation (Extended Data Fig. 5 and 8).
Engineering of WT and ΔE ESCs with a FLP-FRT Recombination Platform for Rescue Experiments:
WT F1 2–1 MS2129 ESCs and ΔE ESCs described above (½ of a confluent T75 flask) were electroporated with 40μg of Fsp1 linearized Flp-IN homing plasmid that integrates a FRT landing site downstream of the Col1A locus and carried a puromycin resistance cassette for targeting34 at 800v, 0.2ms, 4mm cuvette using a Biorad X-Cell electroporation module before being serially diluted on 10cm plates, pre-coated with irradiated DR4 feeders. 36 hours after plating, the cells were selected with 2μg/mL puromycin for 10 days after which 200 clones were picked and expanded. Genomic DNA was isolated and EcoRI digested, before being subjected to southern analysis with the Col1A Xba/Pst1 3’ probe. Positive clones 1–61 (WT) and 137 (ΔE) were used for all subsequent experiments (Extended Data Fig. 9a).
Generation of Flp-In Plasmids encoding Flag-MS2-CP Fusion Proteins:
The MS2 Coat Protein (MCP) coding sequence was PCR amplified with a forward primer encoding a 3xFlag tag downstream of a Kozak-ATG start signal from the pHMM vector (Addgene, #67717). The reverse primer contained an in frame Nhe1 site (primers APJ526/570 (Supplementary Table 1)) such that any fragment ligated into the site would be expressed in frame with the MCP protein, separated by a 3-amino acid (Gly-Leu-Gly) linker. The Flag-MCP-Nhe1 fragment was inserted into the EcoRI site of the pBS32 vector using Infusion cloning. This vector is similar to the pgkATGfrt vector described in34 except that the tet-inducible promoter was replaced with a CAGGS promoter, allowing constitutive expression of the fusion protein. The coding sequence for each protein (GFP, PTBP1, MATR3, TDP-43, and CELF1) was PCR amplified from cDNA with infusion overhangs, or synthesized (see below, Genewiz), and ligated into the Nhe1 site of the pBS32-Flag-MCP parent plasmid using InFusion cloning (Clontech). The PTBP1 Y247Q, MATR3mutPRI and MATR3ΔZfn mutants were generated using primer-directed mutagenesis. The WT PRI sequence (GILGPPP) was mutated to create the mutant PRI sequence (GAAAPPA)17. The coding sequences for the CELF1, MATR3 S85C, TDP43 4xM and MS2CP-GFP-MS2CP fusions were synthesized (Genewiz). All plasmids were verified by sequencing.
The ΔC-Terminal PTBP1 fragment that is fused to Flag-MCP in our rescue system, is comprised of the first 299 amino acids of PTBP1, which includes the first two RRMs as well as the MATR3 interaction site, followed by 68 amino acids that are out of frame, and do not encode a functional linker region. A premature stop codon terminates the protein at residue 367.
Generating WT and ΔE ESCs expressing Flag-MCP-fusions via Flp-In Recombination:
33μg of the pBS32 plasmid DNA encoding the Flag-MCP-Fusions and 26μg of plasmid encoding the flpase FlpO were electroporated into WT ESCs carrying the FRT homing site (clone 1–61) for the GFP fusion and ΔE ESCs with the FRT homing site (clone 137) for all other fusion constructs (1/2 of a confluent T75 flask of ESCs per electroporation) (Extended Data Fig. 9a). Cells were plated on confluent irradiated DR4 feeders in a 10cm dish and 36 hours after plating selected with 170μg/mL hygromycin for 14 days, after which all colonies were picked and expanded. The resulting clones were tested for protein expression by immunoblot of lysates (RIPA buffer in 1X SDS lysis buffer (ThermoFisher)) using an anti-Flag antibody as well as antibodies against the respective fusion protein (Supplementary Table 2). Immunostaining confirmed nuclear localization of all fusion proteins that failed to rescue the phenotypes associated with loss of the E-Repeat. All clones used maintained two X chromosomes, as determined by FISH against Tsix in undifferentiated cells. For all rescue experiments, at least two clones were analyzed, which revealed that the data are robust. Due to space limitations, often only the results from one rescue clone per protein or mutant are shown.
Generation of tet-inducible Xist ΔTsix V6.5 male ESCs:
Tet-On Xist male V6.5 ESCs carrying a tet-inducible promoter in place of the endogenous Xist promoter and a M2rtTA trans-activator as well as puromycin resistance in the R26 locus2 (½ of a confluent T75 flask) were electroporated with 40μg of Not1 linearized paa2Δ1.7 plasmid DNA35 (800v, 0.2ms, 4mm cuvette using a Biorad X-Cell electroporation machine) and plated on confluent irradiated DR4 feeders, to stop Tsix expression. 36 hours after plating, the cells were selected with Neomycin/G418 for 10 days after which 100 clones were picked and subjected to southern analysis described in 35 (data not shown). Positive clone 70 was used for the PTBP1 ChIP-seq experiments.
siRNA Treatments
Silencer Select siRNAs (Thermo Fisher) against PTBP1 (s72337), MATR3 (s69629), CELF1 (s64632), TDP-43 (s106686) were diluted to 20nM in 1x siRNA buffer (60mM KCl, 6mM HEPES pH 7.5 0.2mM MgCl2), aliquoted and stored at −80C until further use. Under sterile conditions at RT, 2.5μL of 20nM siRNA were added to 80μL of fresh Opti-MEM solution (Gibco). 1.6μL siRNA MAX transfection reagent (Life Technologies) were added to 80μL Opti-MEM solution and subsequently added to the siRNA/opti-MEM solution after 5 minutes of incubation. The resulting solution was mixed by pipetting and left to incubate at RT for 20 minutes. The solution was then added to 200,000 cells in 0.8mL of culture medium and plated in 1 well of a 12 well plate on 18mm gelatinized coverslips and left overnight at 37C. For female ESCs undergoing differentiation, cells were plated in MEF medium and after 24h, the culture medium was changed (with the addition of 1μM all-trans Retinoic Acid, Sigma) and a second round of siRNA treatment was performed. Knockdown efficiency was assessed by immunoblotting (Supplementary Table 2).
Immunoblotting
Cells were harvested by trypsinization, pelleted (1000xg, 5 min), resuspended in 500μL 1xPBS to wash, and re-pelleted. The washed cell pellet was lysed in 5 pellet volumes of RIPA buffer and 40U benzonase (Novogen) and incubated at 4C overnight. The lysate was centrifuged at max speed to pellet the remaining insoluble material and the supernatant was transferred to a new tube and mixed with 4x Novex sample buffer containing 5% 14.3M Beta-mercaptoethanol (Sigma) to a final concentration of 1x. The samples were then denatured for 5 min at 95C and loaded onto a 4–12% Novex Bis-Tris acrylamide gel with 1x MES running buffer (Life Technologies) run at 120V for 1.5–2h. The gels were transferred to a protran BA-85 nitrocellulose membrane (Whatman) using a Novex XCell II transfer system for 2h at 30V, 4C (or overnight at 4C at 10V) in transfer buffer (25mM Tris-HCl, 192mM glycine, 20% methanol). Membranes were probed with primary antibody (Supplementary Table 2) in 1x Odyssey blocking buffer (LI-COR) overnight at 4C, washed 3×5 minutes in PBS+0.2% tween-20 (ThermoFisher) and then incubated with appropriate secondary antibodies (1:10,000 dilution, Odyssey 700 and 800nm antibodies) in the dark at room temperature for 30 minutes before being washed again and scanned on a LI-COR infrared imaging system.
Co-Immunoprecipitation
For co-immunoprecipitation experiments, Rabbit IgG and antibodies against PTBP1, MATR3, CELF1, CIZ1, TDP-43 (Supplementary Table 2) were crosslinked to ProteinG-Dynabeads (ThermoFisher) using the protocol provided by Abcam (http://www.abcam.com/protocols/cross-linking-antibodies-to-beads-protocol) with minor modifications. Briefly, 20μL of bead slurry were isolated on a magnet and washed 3× 5 minutes in 5 volumes of 1xPBS. Beads were then washed once in 5 volumes of binding buffer (100μL, 1xPBS containing 1mg/mL of BSA (NEB)) for 10 minutes and incubated in 100μL binding buffer supplemented with 5μg of Rabbit IgG or antibodies against PTBP1, MATR3, CELF1, CIZ1 or TDP43. Samples were rotated for 1 hour at 4°C. Beads were then washed in binding buffer for 5 minutes, followed by an additional 5-minute wash in 1xPBS. Next, the antibody was crosslinked by incubating in a 100μL of 1xPBS solution containing 0.2M triethanolamine (Sigma) and 6.5mg/mL Dimethyl pimelimidate (DMP) (Sigma) pH 8.5 for 30 minutes with rotation at RT. Beads were then washed in 250μL 0.2M triethanolamine in 1xPBS for 5 minutes. DMP incubation and wash steps were repeated two more times before samples were quenched in 100μL of 50mM ethanolamine in 1xPBS for 5 minutes. The quenching step was repeated, and excess non-crosslinked antibody removed with 2 × 10 minutes incubations in fresh 1M glycine pH 3.0. Beads were washed in 1xPBS 3× 5 minutes before use in immunoprecipitations. Immunoprecipitations were performed under non-denaturing conditions according to the Abcam protocol (http://www.abcam.com/ps/pdf/protocols/immunoprecipitation%20protocol%20(ip).pdf). 4×15cm plates of confluent WT F1 2–1 MS2129 female ESCs were lysed by pipetting in 3mL of lysis buffer (10M Tris-HCl pH8, 137mM NaCl, 1% NP40, 2mM EDTA) supplemented with 1x Complete EDTA-free Protease Inhibitors (Roche) and incubated for 1h on ice with or without RNase (10μg/mL RNase A) (Thermo Fisher). Lysate was centrifuged at 4°C, 14,000rpm in a tabletop microfuge for 15 minutes to pellet insoluble material. The supernatant was transferred to new tubes and precleared with 20μL of washed ProteinG-dynabeads per 1mL of lysate with rotation at 4°C for 1 hour. 500μL of lysate were then added to each crosslinked antibody-proteinG Dynabead prep (described above) and rotated at 4°C overnight. The next day, crosslinked antibody-proteinG Dynabeads were isolated on a magnet and washed 4× 5 minutes in ice-cold wash buffer (10mM Tris-HCl pH 7.4, 1mM EDTA, 1mM EGTA, 150mM NaCl, 1% TritonX-100) supplemented with 1x Complete EDTA-free Protease Inhibitors. The co-purified proteins were eluted by boiling in 1x NuPage Protein Loading buffer (Thermo Fisher) supplemented with 5% Beta-mercaptoethanol, at 95°C for 5 minutes. Samples were assessed by immunoblotting. Input represents 4% of lysate added per immunoprecipitate. 1/4th of eluate was loaded per lane.
In Vitro RNA transcription (IVT)
For several in vitro experiments (Droplet assays, EMSA), RNAs encoding the E-repeat and other sequences were obtained by in vitro transcription (IVT). Templates for IVT were amplified from DNA using KAPA polymerase according to manufacturer’s instructions (KAPA Biosystems), and then gel purified and concentrated over AMPure beads (homemade)29. See Supplementary Table 1 for primer information. RNA was transcribed and UREA-PAGE purified as described in36. For biotinylated RNAs, Biotin-UTP (Ambion) comprised 18% of the total UTP.
Droplet Assays
rPTBP1 Purification:
Recombinant 6x-His tagged PTBP1 was expressed by IPTG induction from plasmid pQE-80L-PTBP4 (human PTBP1, isoform 4) (Douglas Black Lab) in BL21 bacterial cultures and purified using Ni-NTA agarose (Invitrogen) according to manufacturer’s instructions. The purified protein was dialyzed and stored in Buffer DG (20 mM HEPES-KOH pH 7.9, 80 mM K. glutamate, 20% glycerol, 2.2 mM MgCl2, 1 mM DTT, and 0.1 mM PMSF) at a stock concentration of 36mg/mL.
rCELF1 Purification:
Recombinant 6xHis-tagged CELF1 was expressed by IPTG induction from plasmid pET28a-CELF1 (human) in Rosetta bacterial cultures and purified over His-Trap and Superdex 200 gel filtration columns. Purified protein was concentrated and stored in a buffer containing 50 mM Tris-HCl pH7.5, 150 mM NaCl and 10% glycerol at a stock concentration of 5mg/mL. pET28a-CELF1 was constructed via In-fusion, using a fragment encoding the CELF1 coding region (see Supplementary Table 1 for primers) into the PET-28a plasmid. The CELF1 coding region was amplified from a fragment synthesized by Genewiz (see above) with primers modified for the pET-28a plasmid. The plasmid was sequence verified before use.
Droplet Assays:
10μL droplets were assembled in 1.5mL Eppendorf tubes as described in37. Briefly, 5μL of a 2x buffer containing 200mM NaCl, 40mM Imidazole, 2mM DTT and 20% glycerol was supplemented with the E-Repeat or control IVT RNA (varying concentrations), rPTBP1 (to a maximum concentration of 60μM) and/or rCELF1 (maximum concentration of 38μM) and water to 10μL (final volume). The solution was mixed by pipetting and transferred to one well of an 8 well glass chamber slide (Ibidi) that had been pre-coated with 3% BSA, washed 3x with RNase-Free water and dried. Droplets were imaged at 10x – 20x magnification.
Electrophoretic Mobility Shift Assays
EMSAs were performed as described in38 except that 40,000cpm of 5’ end labeled RNA was used per condition.
Quantitative RT-PCR and ActinomycinD treatment
In several experiments we determined the levels of Xist by RT-PCR. For experiments with ActinomcyinD treatment, the drug was dissolved in DMSO at 1mg/mL and added to the culture medium to a final concentration of 1μg/mL. For RT-PCR, cells were harvested in 1mL TRIzol (Thermo Fisher), after culture medium removal and PBS wash. RNA was purified over RNAeasy columns (Qiagen). 1μg total RNA was used in a reverse-transcription (RT) reaction with SuperScript III and appropriate strand-specific reverse primer, according to manufacturer’s instructions (ThermoFisher). 1/20th of the RT reaction was used in a quantitative PCR reaction, using either 480 SYBR Green LightCycler PCR mix (Roche), SsoAdvanced Universal SYBR mix (Bio-Rad) or SYBR Green Master Mix (Applied Biosystems) and appropriate primers (see Supplementary Table 1), in triplicate reactions. RT-qPCR experiments were normalized against Gapdh or Rrm2 transcripts.
Crosslinking and Immunoprecipitation of RNA and High-Throughput Sequencing (iCLiP-Seq) for MATR3 and PTBP1
PTBP1, PTBP2 and TDP-43 iCLIP in differentiated cells was obtained from published datasets39,40. PTBP1 and MATR3 iCLIP experiments in ESCs were performed as described in41. iCLiP-Seq all washes were conducted for 5 minutes per wash, at 4°C with ice cold buffers. Three confluent 15cm plates of male tetO-Xist V6.5 (pSM33) ESCs2 were used per immunoprecipitation upon 6 hours of induction of Xist expression with 2μg/mL doxycycline, and crosslinking was performed at 100mJ/cm2 at 4°C in a Stratalinker 1800 (Stratagene). Crosslinked cells where harvested by scraping in cold 1xPBS and pelleted at 700xg for 2min. Cell pellets were lysed in ice cold lysis buffer [20 mM HEPES-KOH pH 7.5 (Sigma), 150 mM NaCl (Sigma), 0.6% Triton X-100 (Sigma), 0.1% SDS (Sigma), 1 mM EDTA (GIbco), and 0.5 mM DTT (Sigma)] and sonicated in a bioruptor (Diagenode) for 2× 15 minutes (30 sec ON, 30 sec OFF) on high setting at 4°C. Sonicated lysates were cleared by centrifugation at 20,000g, 5min, 4C, supernatants transferred to 15mL falcon tubes and diluted in 5 volumes of buffer containing 20mM HEPES-KOH pH 7.5, 150 mM NaCl, 0.5 mM DTT, 1.25x complete protease inhibitors EDTA-free (Roche), 50 μg/ml yeast tRNA (Life Technologies) and 400U RNAase out (Life Technologies). Samples were briefly mixed and rotated overnight at 4°C. To prepare beads for pulldown, a magnet was used to isolate beads from 200μL of proteinG-dynabead slurry, which were then washed 3x in WB150 [20 mM HEPES-KOH pH 7.5, 150 mM NaCl, 0.1% Triton-X100] and incubated overnight at 4°C with 50μg antibody α-MATR3 (Abcam ab151714), α-PTBP1 (Abcam, ab5642) in 700μL WB150. Beads were washed 3x in WB750 (20mM HEPES-KOH pH 7.5, 750mM NaCl, 0.1% Triton-X100) and 1x with WB150 (20mM HEPES-KOH pH 7.5, 150mM NaCl, 0.1% Triton-X100) prior to incubation with lysate. After overnight incubation in lysate, beads were collected at the bottom of the falcon tube with a magnet and the supernatant was removed. Beads were then transferred to a 1.5mL eppendorf tube with 1mL of WB150, washed 5x in WB750 and 2x in PNK buffer (20 mM HEPES-KOH pH 7.5, 10 mM MgCl2, 0.2% Tween-20). The immunoprecipitated RNA was fragmented in 100 μl of 1x MNase buffer (NEB) containing 5.0 μg of yeast tRNA that was pre-warmed to 37°C in a thermomixer (Eppendorf) set to shake for 15sec ON/15 sec OFF at 750rpm (or minimum speed required to prevent settling of the beads). 50 μl of 1xMNase buffer containing 60 gel units/ml (6 Kunz units/ml) of Micrococcal nuclease (NEB M0247S) were added and incubated for exactly for 5 min. The reaction was stopped with the reaction with 500 μl of EGTA buffer (20 mM HEPES-KOH pH 7.5, 150 mM NaCl, 20 mM EGTA, 0.1% TritonX-100). The beads were then washed 4x in EGTA buffer and 2x in cold PNK buffer. The fragmented RNA was dephosphorylated in 100 μl of 1x FastAP buffer (Fermentas) containing 0.15 U/μl of Fast alkaline phosphatase (Thermo Scientific, EF0651) and 0.2 U/μl of RNaseOUT (LifeTechnologies, 10777–019), incubated in a thermomixer for 90 min at 37 °C, 15 sec shaking/20 sec rest. Beads were washed 4x in WB750 and 2x in cold PNK buffer. The dephosphorylated RNA was then ligated to a 3’biotinylated linker RNA in 40μL of buffer containing 1 mM ATP, 25% PEG4000 (Sigma, 202398), 0.5 U/μl T4 RNA ligase1 (NEB M0204S), 0.5 U/μl RNaseOUT, and 6.0 μM L3 linker (Supplementary Table 1). The ligation reaction was incubated in a thermomixer overnight at 16°C, 15 sec ON/4 min OFF at a speed that prevents beads from settling. The next day, beads were washed 4x in WB150 and 2x with cold PNK buffer. The RNA was then 5’ end labeled in 24μL PNK wash buffer with 16μL of 1x PNK buffer (NEB) containing 150μCi of gamma P32-ATP, 10U PNK and 1U/μL of RNase OUT. The reaction was incubated in a thermomixer for 20 minutes at 37°C set to shake for 15sec ON/20 sec OFF. The beads were then washed 3x with WB150. The immunoprecipitated complexes were eluted off the dynabeads in 50μL of buffer (100mM Tris-HCl pH7.5, 0.6% SDS, 5mM EDTA, 50mM DTT and 50ng/μL yeast tRNA) incubated for 10min at 85°C shaking continuously at 900rpm. The elute was transferred to a new tube and the beads were rinsed with 1200μL of buffer (50mM Tris-HCl pH 7.5, 150mM NaCl, 1.25x complete protease inhibitors (Roche), 50ng/μL yeast tRNA and 0.1% Triton X-100) which was added to the first eluate. The combined eluates were centrifuged for 5min at 4°C at maximum speed and the supernatant transferred to a new tube to prevent carry over of any remaining dynabeads. To prevent IgG heavy chain contamination that co-migrate with many proteins of interest, the biotinylated RNA-protein complexes were bound to monomeric avidin beads. To do this, 10μL packed monomeric avidin agarose beads (Thermo Fisher) were washed 3x with WB150. Beads were pelleted after each wash by spinning in a swing bucket rotor at 1000xg, 4°C (use of the swing bucket rotor helps prevent loss of agarose beads). One packed bead volume was mixed with an equal volume of WB150 and 15μL of the bead slurry was added to each combined eluate and rotated at 4°C for 4 hours. The beads were then pelleted as above and washed 3x with WB150. After the final wash, carefully remove the remaining 5–20μL of supernatant with a p10 pipette. The complexes were eluted off avidin beads by incubation in 30μL of buffer (10mM Tris-HCl pH 7.5, 10% glycerol, 2.2% SDS, 5mM EDTA) at 85°C for 10 minutes in a thermomixer shaking at 900rpm. After centrifugation to pellet the beads, the supernatant was transferred to a new tube and mixed with 5μL of 1xLDS sample buffer (Life Technologies) with 300mM DTT. Samples were incubated at 90C for 10min and then loaded on a pre-run (75v, 10min) NuPAGE Bis-Tris Gel (Life Technologies NP0307) with 1x MOPS running buffer and run for 10–15min at 75v and then 120V until each sample has been satisfactorily separated. The gel was then incubated in transfer buffer (25mM Bis-Tris, 25mM Bicine, 1mM EDTA pH7.2, 20% methanol) for 5 minutes and then transferred onto a protran BA-85 nitrocellulose membrane using a semi-dry transfer apparatus (Biorad 170–3940) for 75min at 400mA (not exceeding 15V). After completion of the transfer, the membrane was briefly washed in milli-Q water, wrapped in plastic film and exposed on a phosophoimager screen for 1 hour. The regions of interest were then excised from the membrane and transferred to an eppendorf tube. The RNA was eluted from the membrane by incubation in 300μL of buffer (100mM Tris-HCl pH 7.5, 50mM NaCl, 10mM EDTA and 2μg/μL proteinase K) for 30 minutes at 55°C in a thermomixer, shaking continuously. 300μL of pre-warmed buffer (100mM Tris-HCl pH 7.5, 50mM NaCl, 10mM EDTA, 7M urea and 2μg/μΛ proteinase K) was then added to the tube and incubated for a further 30min at 55°C. The supernatant was then transferred to a new tube and extracted with an equal volume of phenol:chloroform (5:1, pH 4.5). The separated aqueous phase was precipitated with 0.5μL of Glycblue (Life Technologies), 60μL Sodium Acetate pH 5.4 and 600μL isopropanol overnight at −20C. Next day, the RNA was pelleted by centrifugation at 4°C for 30min at max speed. The pellet was then washed with 1mL 75% EtOH before air drying for 2 minutes and dissolved in 5.70 μL RNAse free water and left on ice for 5–10 minutes before being reverse transcribed. To do this, 0.5μL of 10mM dNTPs and 0.5μL of 2μM RT primer (Supplementary Table 1) were added to the RNA, mixed by pipetting and denatured for 5 min at 70°C before being snap cooled on ice. The RT primers contain an 11nt Unique Molecule Identifier (UMI) used in sequence analysis (see below). The sample was then equilibrated at 25C in a PCR machine before 3.5μL of RT mix were added (2μL 5x First Strand Buffer, 0.5μL 100mM DTT, 0.5μL 100U/μL Superscript III (Life Technologies) and 0.5μL 40U/μL RNase OUT (Life Technologies)) and incubated for 5 minutes at 25°C and then for 20 minutes at 42C, and then 20 minutes at 48°C. The reverse transcription reaction was then transferred to a new Eppendorf tube containing 100μL TE, 11μL 3M Sodium Acetate and 2.5volumes of 100% EtOH. The cDNA was precipitated overnight at −20°C, pelleted and washed as described above, dissolved in 5μL RNase-free water and then mixed with 7.5μL of formamide containing 10mM EDTA, bromophenol blue and xylene cyanol tracking dyes. For size determination, ladder was prepared as follows: 2μL GeneScan 500LIZ size marker (Life Technologies 4322682), 3μL H20, 15μL Formamide containing 10mM EDTA with NO tracking dyes. The samples and ladder were denatured for 5min at 85°C and then loaded on a pre-run 5.5% (19:1 Bis:acrylamide) UREA-PAGE gel (1xTBE, 7.5M UREA) for 20 min at 21V. The gel was then scanned and a gel slice in the range of 70–120nt was excised, chopped into 1mm cubes and the cDNA eluted in 700μL of TE buffer rotating at RT overnight. The next day, the cDNA was precipitated overnight as described above. The washed pellet was then dissolved in 6.7μL of RNase free water and left on ice for 5–10 minutes before being transferred to a PCR tube. Subsequently, the RNA was circularized by addition of 1.5 μl of: 0.8μL of circligase II buffer, 0.4μL 50mM MnCl2 and 0.3μL of 100U/μl CicrLigase II ssDNA ligase (Epicentre CL9021K) and incubated in a PCR machine at 60°C for 60 minutes. The circularized cDNA was then digested with BamHI by addition of 30μL of: 4μL 10x FastDigest Buffer, 0.9μL of 10μM cut_oligo and 25.1μL RNase Free water. This mix was incubated for 4 minutes at 95C after which the temperature was decreased 1C each minute until 37°C after which 2μL of FastDigest BamH1 (Thermo Scientific FD0054) was added and incubated at 37°C for a further 30 minutes. The sample was transferred to an Eppendorf tube and pelleted as described above. The pelleted DNA was dissolved in 12 μL RNase free water. 2μL were used to prepare a 42μL PCR mix, containing 1x PFU buffer, 0.2mM dNTPs, 0.2μM P3 and P5 solexa primers, and 0.5U PFU polymerase. A negative control containing water instead of cDNA was also prepared. The 42μL reaction was then split into 4×10μL reactions and PCR amplified for 20, 24, 28 and 32 cycles (94°C/3’; 94°C/30s; 63.5°C/15s; 72°C/30s; with final extension at 72°C for 7 minutes). The PCR amplicons were run on a 2% agarose gel in 0.5X TBE/EtBr and the number of cycles required to produce 50–200ng of PCR product from the remaining 10μL of cDNA template was calculated. The PCR reaction was repeated using 10μL remaining ssDNA template, run on a 2% gel as before and the 150–210bp size range was excised and purified using Zymoclean Gel DNA recovery kit (Zymo Research D4007). DNA concentration was determined by qubit using the dsDNA Broad Range assay and prepared for sequencing on an Illumina HiSeq2000 machine using a single end 100bp protocol.
Enhanced Crosslinking and Immunoprecipitation of RNA and High-Throughput Sequencing (eCLIP-Seq) for CELF1
eCLIP experiments against CELF1 (α-CELF1 (ab129115) were performed as described in42 with a few modifications. As with iCLIP, male tet-inducible -Xist V6.5 ESCs (pSM33)2 were induced with 2μg/mL doxycycline for 6 hours prior to crosslinking at 100mJ/cm2 at 4°C in a Stratalinker 1800 (Stratagene). Cells were then processed according to the eCLIP protocol for input and immunoprecipitated samples until cDNA was obtained. We then followed the iCLIP protocol from the gel-purification of the cDNA through to amplification and purification of the DNA library. For eCLIP samples were sequenced on an Illumina HiSeq2000 machine using the single end 50bp protocol.
CLIP-seq Analysis
CLIP-seq results were mapped using TopHat and processed with the publicly available fastq-tools, fastx-toolkit, Samtools, Bedtools, DeepTools and UCSC scripts43–45. The first 11 bases of each sequenced read correspond to a UMI, composed of a library specific barcode (3 nt) flanked by 4 degenerate nucleotides. The UMI permitted removal of PCR duplicates from the total sequenced reads with the fastq-uniq command-line tool. The Fastx-toolkit was then used to clip 3’ adapter sequences. Sequences shorter than 20 nt were discarded. Reads were then de-multiplexed and mapped to the iGenome mm9 reference genome by Tophat with high stringency settings. Library-depth normalized counts were generated, and data were converted to bigWig format to visualize tracks in IGV. Peaks were called using CLIPper45 using the --superlocal option. Scrips available: github.com/ShanSabri/iCLIP.
ChIP-Seq
3× 15 cm plates of male tetOXist-ΔTsix V6.5 ESCs (~100 million cells) were used to prepare chromatin for PTBP1 ChiP-seq. Cells were induced for 0 or 20 hours with 2μg/mL doxycycline to induce Xist prior to harvesting by trypsinization. Cells were then pelleted by centrifugation at 700g for 5 minutes at RT and resuspended in a total volume of 10mL PBS. The wash step was repeated twice before resuspending in 10 mLs of 1x PBS and transferring to a 50mL falcon tube to which Disuccinimidyl glutarate (DSG) (Pierce) in DMSO was added for crosslinking to a final concentration of 2mM and incubated for 10 minutes at room temperature with gentle mixing under standard laboratory safety practices. Cells were then pelleted, and the supernatant was safely disposed of. Cells were re-suspended in 10mL ESC medium and incubated for 10 minutes with 1% formaldehyde (16% methanol free, Pierce) at room temperature with gentle mixing under standard laboratory safety practices. The reaction was quenched by addition of freshly made 0.125M Glycine (Sigma) for 5 minutes at room temperature. Cells were pelleted and supernatant was safely disposed of. Cells were washed twice in 50mL PBS with protease inhibitors (Complete EDTA free, Roche) before being pelleted and flash frozen in liquid nitrogen and stored at −80C. The frozen pellets were processed for ChIP-seq as described in46.
ChIP-Seq analysis
Reads were mapped using Bowtie to the iGenome mm9 reference genome. Duplicate reads were removed, and length extended to 49 nt. Normalized reads count were generated across 50nt bins. Tracks were visualized in IGV in bigWig format.
RNA Affinity Purification (RAP)
RAP was performed as described in2. For the RAP-seq experiment, we used male T20 ESCs47 carrying a homing site in the Hprt locus on the single X-chromosome as well as a tetracycline- inducible transactivator in the R26 locus. The Hprt homing site includes a bidirectional, tetracycline-inducible promoter for expression of a control gene (EGFP) and of the Xist cDNA transgene introduced later by site-specific recombination, as well as a loxP site neighboring the tet-promoter and linked to a truncated neomycin-resistance gene lacking a promoter and translation initiation codon8. We integrated two different Xist cDNA transgenes into the homing site by electroporation of the respective Xist cDNA encoding plasmid and a Cre expression plasmid. The Xist transgene plasmid contained a promoter-less Xist sequence followed by a poly-adenylation signal and a PGK promoter and translation initiation codon linked to a loxP site. Site-specific recombination of the loxP sites in the Xist cDNA plasmid and the homing site linked the translation initiation codon and Pgk1 promoter to the neo gene, which restored the antibiotic resistance marker. A single copy of the Xist cDNA transgene was thus integrated under the control of the inducible promoter. In this study, we employed a ~14.5kb Xist cDNA with either a 4122 nucleotide deletion between BstEii sites within the Xist cDNA, deleting the E-repeat and surrounding sequences, or a 1237 nucleotide deletion ending at a similar region with Xist and not including the E-repeat, which was generating by deleting internal sequences within the cDNA by SnaBI digestion and re-ligations (Fig. 1g and data not shown). Cells were induced with 2μg/mL dox for 6h, prior to fixation for RAP-seq. Cells were induced with 2μg/mL dox for 6h, prior to fixation for RAP-seq. RAP libraries were sequenced on the Illumina platform. Adaptor trimming was performed using cutadapt version 1.15 in paired-end mode with the following parameters: “-a AGATCGGAAGAGC -A AGATCGGAAGAGC”. Read mapping was performed using bwa version 0.7.17-r1188 and samtools version 1.4 with the following command: “bwa mem -t 30 -T 0 ${INDEX} ${R1} ${R2} | samtools view -b - | samtools sort -O sam -T tmp -n - | samtools fixmate -O sam - - | samtools sort -O bam -T tmp - > ${BAM}”. Read filtering was performed using samtools version 1.4 with the following command: “samtools view -b -q 30 ${BAM} | samtools rmdup - - | samtools view -b -L ${BED} - | samtools sort -O bam -T ${tmp} - > ${FILT_BAM}”. The ${BED} variable is a path to a .bed file containing all chromosomes except for the Xist locus (chrX:103460216–103483359). Library-depth-normalized tracks were generated using bedtools v2.27.1 with the following commands: “bamToBed -i ${FILT_BAM} | sort -u -k 1,1 -k 2,2 -k 3,3 > ${FILT_BED}; genomeCoverageBed -split -bga -scale ècho 1000000000/$(wc -l ${FILT_BED} | awk ‘{print $1}’) | bc` -i ${FILT_BED} -g ${CHROM_SIZES} > ${BG}; bedGraphToBigWig ${BG} ${CHROM_SIZES} ${BW}”. Sample library-depth-normalised tracks were divided by the library-depth-normalized input (SRR850637 from2) in R v3.5 using rtracklayer 1.42.2 to import the tracks as Rle and export the divided tracks as bigwig. Input-normalised tracks were smoothed using deeptools version 3.4.3 and bedtools version v2.27.1 with the following command: “multiBigwigSummary bins -b ${NORM_BW} -out res.npz -bs 1000 --outRawCounts ${NORM_BG}; bedGraphToBigWig ${NORM_BG} ${CHROM_SIZES} ${SMOOTHED_NORM_BW}”.
Microscopy
Epifluorescence Imaging:
Cells with immunofluorescence and RNA FISH stainings were imaged using a Zeiss AxioImager M1 microscope with a 63x objective and acquired with AxioVision software. Epifluorescence images shown are sections and were analyzed, merged and quantified using ImageJ or Adobe Photoshop.
3D-Structured Illumination Microscopy (3D-SIM):
3D-SIM super-resolution imaging was performed on a DeltaVision OMX V3 system (Applied Precision, GE Healthcare) equipped with a 100 Å~/1.40 NA Plan Apo oil immersion objective (Olympus, Tokyo, Japan), Cascade II:512 EMCCD cameras (Photometrics, Tucson, AZ, USA) and 405, 488 and 593 nm diode lasers. Image stacks were acquired with a z-distance of 125 nm and with 15 raw images per plane (five phases, three angles). The raw data were computationally reconstructed with the soft-WoRx 6.0 software package (Applied Precision) using a wiener filter set at 0.002 and channel-specifically measured optical transfer functions (OTFs) using immersion oil with different refractive indices (RIs) as described in33. Images from the different channels were registered using alignment parameters obtained from calibration measurements with 0.2μm diameter TetraSpeck beads (Invitrogen) as described in48.
Improved Confocal Microscopy:
Improved confocal laser scanning microscopy was performed on a LSM880 platform equipped with 100x/1.46NA or 63x/1.4 NA plan Apochromat oil objectives and 405/488 diode and 594 Helium-Neon lasers using the Airyscan detector (Carl Zeiss Microscopy, Thornwood, NY). An appropriate magnification was used in order to collect image stacks from a region that encompassed the nucleus of interest thereby optimizing imaging time and reducing photobleaching. The pixel size and z-optical sectioning were set to meet the Nyquist sampling criterion in each case. Airyscan raw data were linearly reconstructed using the ZEN 2.3 software.
Quantitative Image Analysis
All image analysis steps were performed using Fiji/ImageJ49,50 or IMARIS (Oxford Instruments, Tubney Woods, Abingdon, United Kingdom).
Xist Aggregation Analysis:
To quantify the aggregation of Xist clouds, images were taken as Z-stacks and transformed in a Maximum Intensity Projection (MIP) image to detect the entire Xist FISH signal in one plane. The background was removed using a rolling ball radius of 50 pixels. Xist RNA cloud areas were measured by creating a binary mask over the Xist RNA FISH signal for each analyzed Xist cloud. Edges of each Xist cloud signal were determined by selecting a central pixel and all associated pixels of same intensity value (+/− 5 units). The ImageJ FracLac51 plugin was then used to calculate the area of a circle encompassing each cloud signal. The ratio of the Xist cloud area over its bounding circle area approximates the compaction of the Xist RNA cloud. Significant differences between WT/ΔE ESC or siRNA treated samples were tested with the non-parametric 2 sample Kolmogorov-Smirnov (K-S) test.
Imaris Measurements:
Raw z-stack 3D-SIM images were converted to an Imaris compatible format using the Imaris File Converter module. Prior to analysis, all images were adjusted to ensure identical intensity/brightness levels. Using the Imaris MeasurementPro module, 50 linear 3D distances between 100 randomly chosen Xist foci were measured per cell, across 5 cells per sample.
CELF1 Intensity Plot Profiles:
Airyscan image stacks were imported into ImageJ and converted to 16-bit composites. The 3D-stacks were reduced into 2D images and 2μm intensity line plots were used to extract the intensity profiles over the Xi enriched signal in the CELF1 channel. The same line-plot was used in a random nucleoplasmic region to select for the average nuclear CELF-1 intensities. The ratio of the top 10% intensities of the signals were plotted after diving over the nucleoplasmic signal.
Xi DAPI Intensities Quantification:
Wide-field image stacks were generated from 3D-SIM raw data of H3K27me3 and DAPI stained cells by average projection of five consecutive phase-shifted images from each plane of the first angle and subjected to an iterative 3D deconvolution using soft-WoRx 6.0 software. The reconstructed image stacks were imported to ImageJ and converted to 8-bit files. In order to measure the Xi underlying DAPI intensity, binary masks from the H3K27me3 channel were created to define the Xi territory of day 7 WT and ΔE ESC nuclei. A threshold was carefully applied selecting the boarder of H3K27me3 enriched region that demarcates the Xi territory. Subsequently the grey values of the corresponding masked region in the DAPI channel were extracted and plotted.
Segmentation of Xist RNA Foci from 3D-SIM Data Sets:
The 32-bit reconstructed 3D-SIM image stacks were imported into ImageJ were grey values were shifted to the positive range and converted to 16-bit composites after subtracting the mode grey value to remove background noise. Segmentation of Xist RNA foci was performed by using the TANGO plugin52 on ImageJ according to the pipelines described in33. In brief, nuclear masks were created by using the nucleus processing chain. Xist foci were segments by first pre-filtering with a TopHat filter with a radius of 1 pixel in all three dimensions (xyz), followed by a Laplace of Gaussian filter with a radius of 1-pixel (x,y,z). Segmentation of foci was performed using the spot detector 3D with Otsu auto-thresholding. Segmented objects were post-filtered with a size and edge filter of 5 pixels per spot and an SNR above 2.
Amira Reconstructions:
3D-reconstructions were performed using Amira 2.3 (Mercury Computer Systems, Chelmsford, Massachusetts, United States). Image stacks were imported into Amira as separate channels. Xist FISH or antibody stainings were reconstructed as surface renderings while DAPI was reconstructed as volume rendering using the Volren module that allows visualization of intensity in color maps.
Genomics data
Genomics data (CLIP-seq, ChIP-seq and RAP-seq) have been deposited in the GEO database under accession number GSE137305.
Reporting Summary
Further information on research design is available in the Nature Research Reporting Summary linked to this paper.
Extended Data
Extended Data Fig. 1: Depletion of PTBP1, MATR3, CELF1 and TDP-43 does not strongly affect gene silencing during the Xist-dependent stage of XCI initiation.
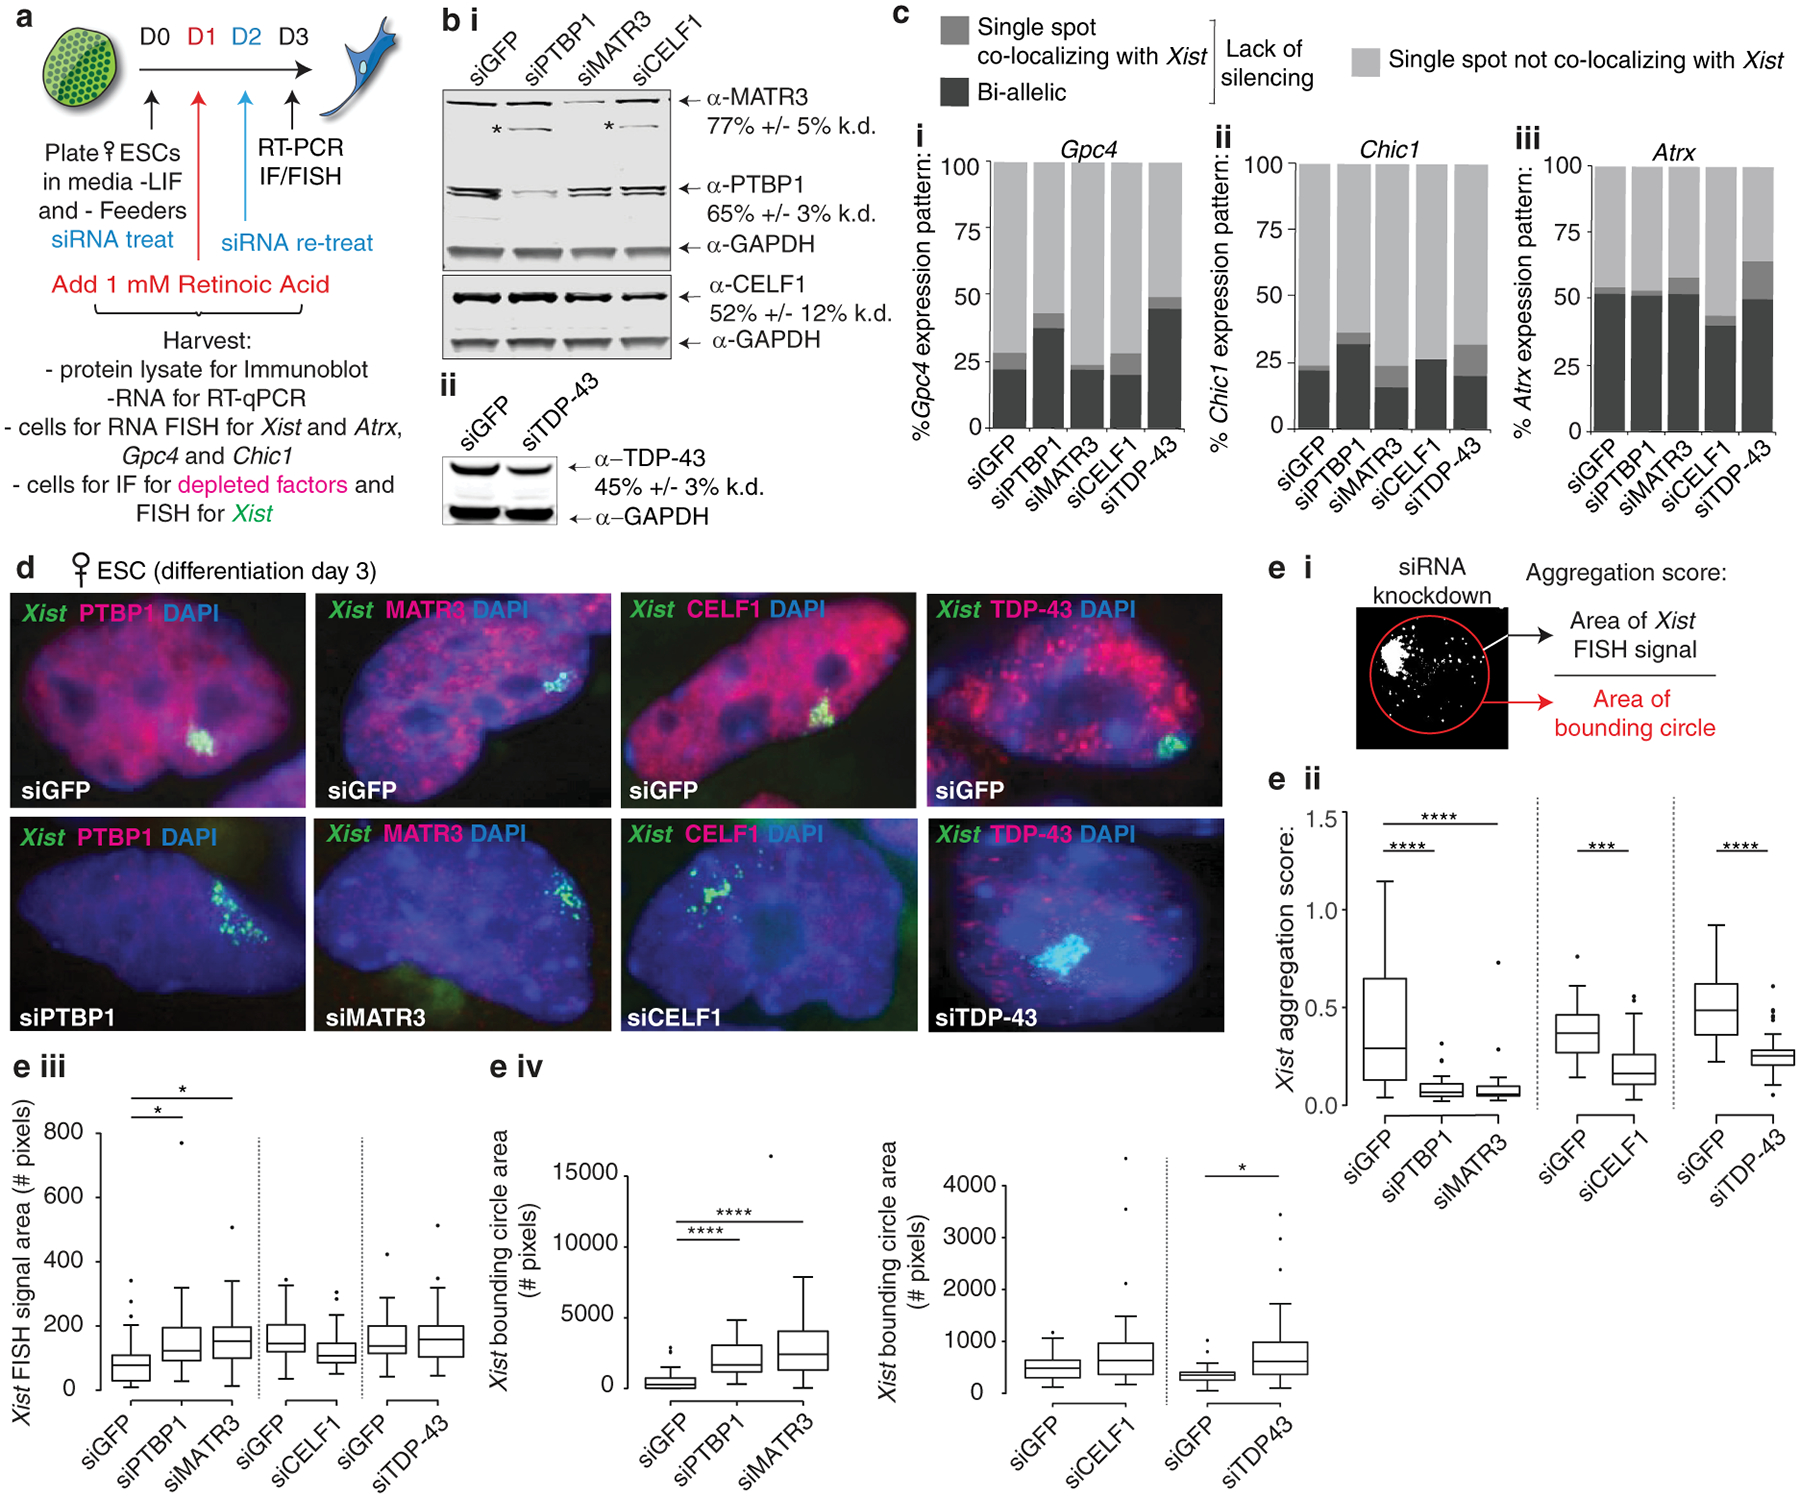
a, Experimental schematic.
b i, Immunoblot confirming the siRNA-mediated knockdown of PTBP1, MATR3, and CELF1, normalized to GAPDH. Asterisks indicate non-specific bands. ii, As in (i), except for TDP-43. Error represents the s.e.m. from three independent experiments. For source data see Supplementary Fig. 1.
c i, Graph showing nascent transcription patterns of the X-linked gene Gpc4 after 3 days of differentiation and knockdown of the indicated factor (spot refers to nascent transcription event on one chromosome) (n = 50 from 1 experiment). ii, Same as (i) except for Chic1. iii, Same as (i) except for Atrx.
d, Representative images of siRNA-treated differentiating cells immunostained for indicated proteins (red), probed for Xist (green) and DAPI stained (blue).
e i, Schematic for Aggregation score calculation. ii, Box plots showing Xist aggregation scores upon depletion of indicated proteins. Independent siGFP controls were used for CELF1 and TDP-43 experiments. iii, Box plots showing the Xist mask values used to calculate the aggregation scores in (ii). iv, Box plots showing the bounding circle area values encompassing the Xist mask used to calculate the Xist aggregation scores in (ii). For box plots in (ii-iv): (n = 25): * P <0.05, *** P <0.0005, **** P < 0.00005; 2-tailed KS-test from one replicate in (b). Horizontal lines denote the median, whiskers indicate 1.5x the interquartile range, dots represent outliers.
Extended Data Fig. 2: Depletion of PTBP1, MATR3, CELF1 and TDP-43 affects Xist localization during XCI initiation without strongly altering Xist processing.
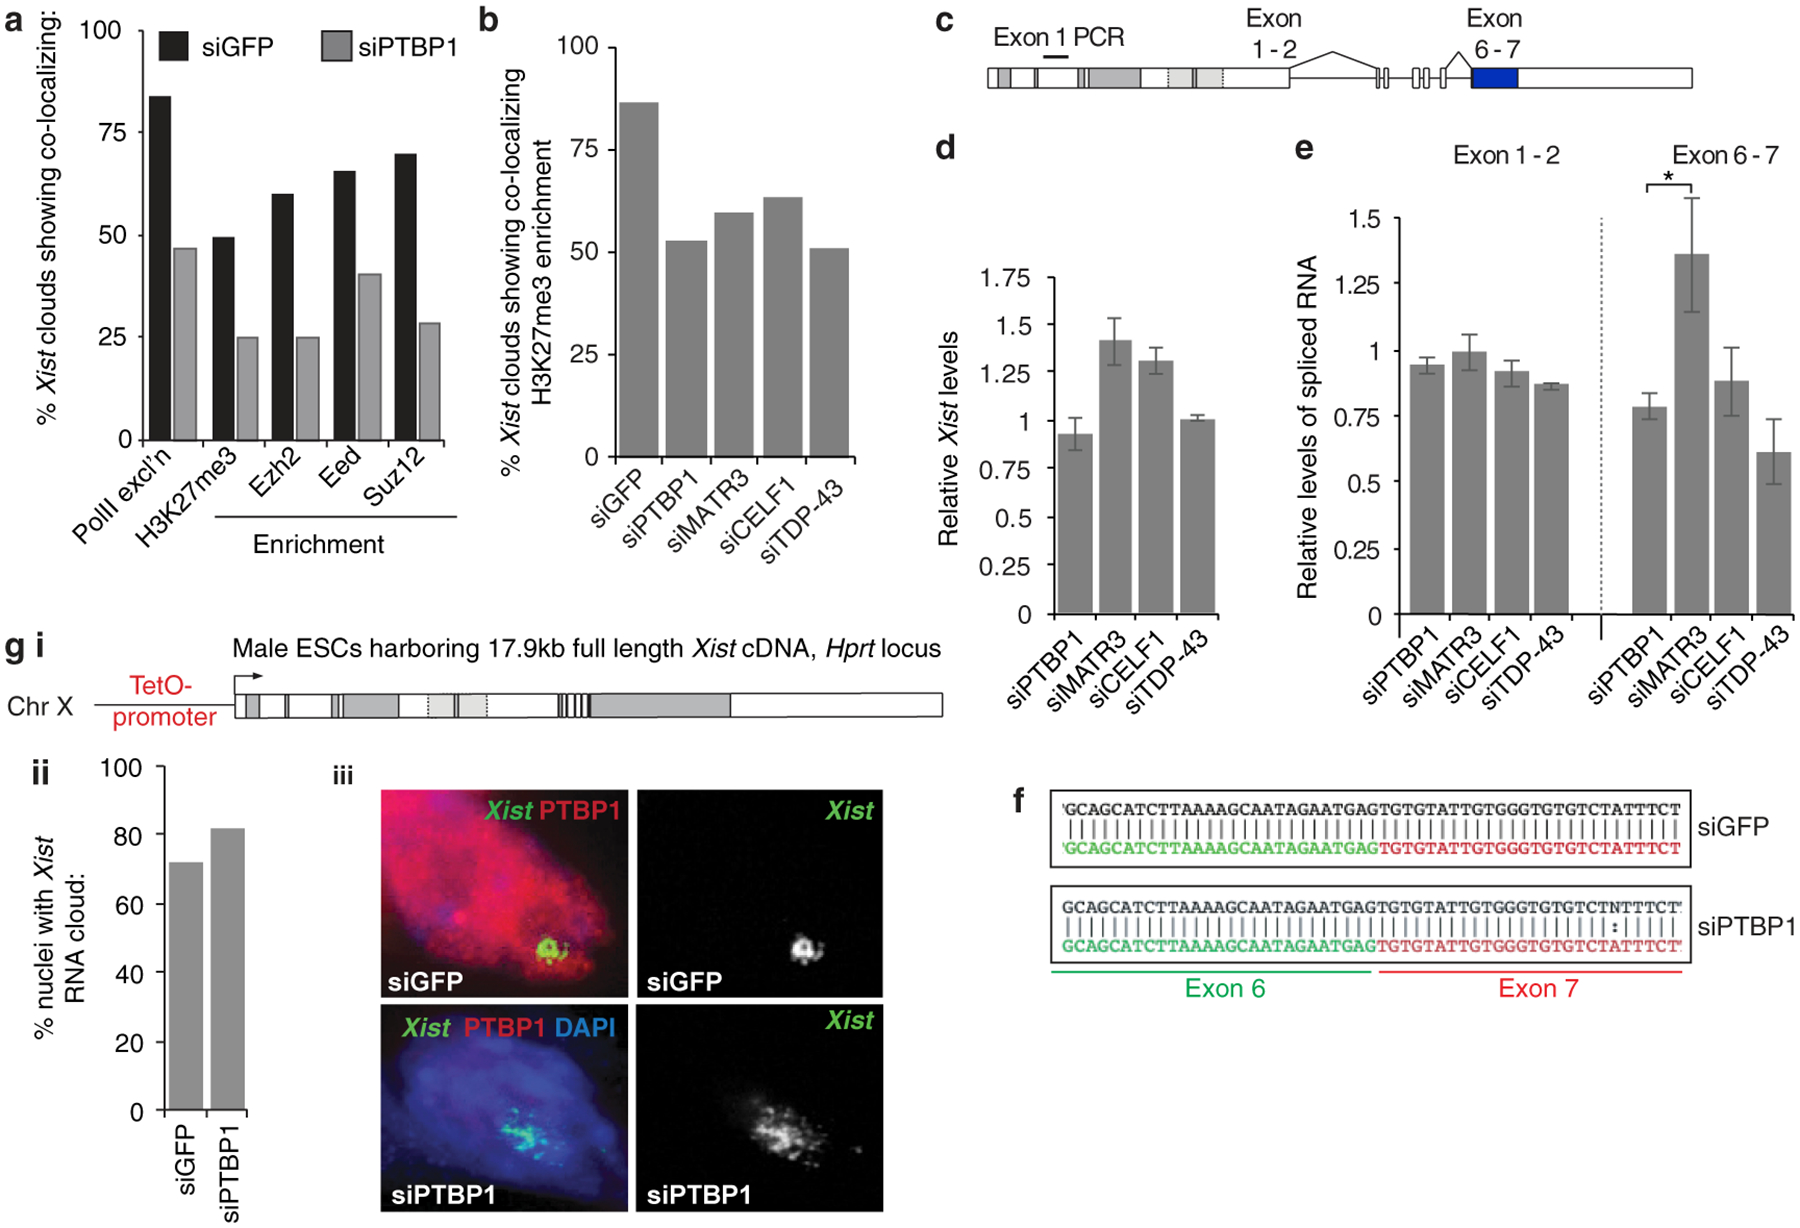
a, Proportion of Xist-positive cells with co-localizing exclusion of RNA-Pol II or enrichment of H3K27me3 or the PRC2 components EZH2, EED, SUZ12 on the Xi, in female ESCs differentiated for 3 days and treated with siGFP or siPTBP1 (n=50 from one experiment).
b, Percentage of Xist-positive cells with H3K27me3 Xi-enrichment in day 3 differentiated female ESCs treated with siRNAs against GFP, PTBP1, MATR3, TDP-43 or CELF1 (n=100, from one experiment). The siPTBP1 sample is independent from that in (a).
c, Xist splicing events assessed below.
d, Histogram showing Xist abundance (exon 1 PCR above) upon siRNA-mediated knockdown of indicated RBPs in female ESCs at differentiation day 3.
e, As in (d), except for the abundance of spliced Xist exon 1–2 and exon 6–7 amplicons upon knockdown. For d and e, samples were normalized against siGFP and Snrnp27 RNA and assessed in triplicate from three independent experiments. Error bars: s.e.m; *P < 0.05, 2-tailed students t-test.
f, Snapshot of expected spliced exon 6 (green) to exon 7 (red) sequence. Correct exon 6–7 ligation occurs after 72h of siGFP or siPTBP1 treatment in differentiating female ESCs (black sequence) in two independent experiments.
g i, A tet-inducible full-length Xist cDNA transgene was inserted into the X-linked Hprt locus in male ESCs. ii, Percentage of cells with an Xist cloud after 48h of siPTBP1, and dox treatment starting at 24h of siRNA treatment, in cells described in (i) (n = 80, from one experiment). iii, Representative RNA FISH images of Xist, co-immunostained for PTBP1 and DAPI labelled, in cells described and treated as in (i,ii). Note Xist dispersal upon PTBP1-knockdown despite absence of Xist-splicing.
Extended Data Fig. 3: PTBP1, MATR3, CELF1 and TDP-43 directly bind the Xist E-repeat, comprised of a tandem array of 20–25nt C/U/G-rich elements.
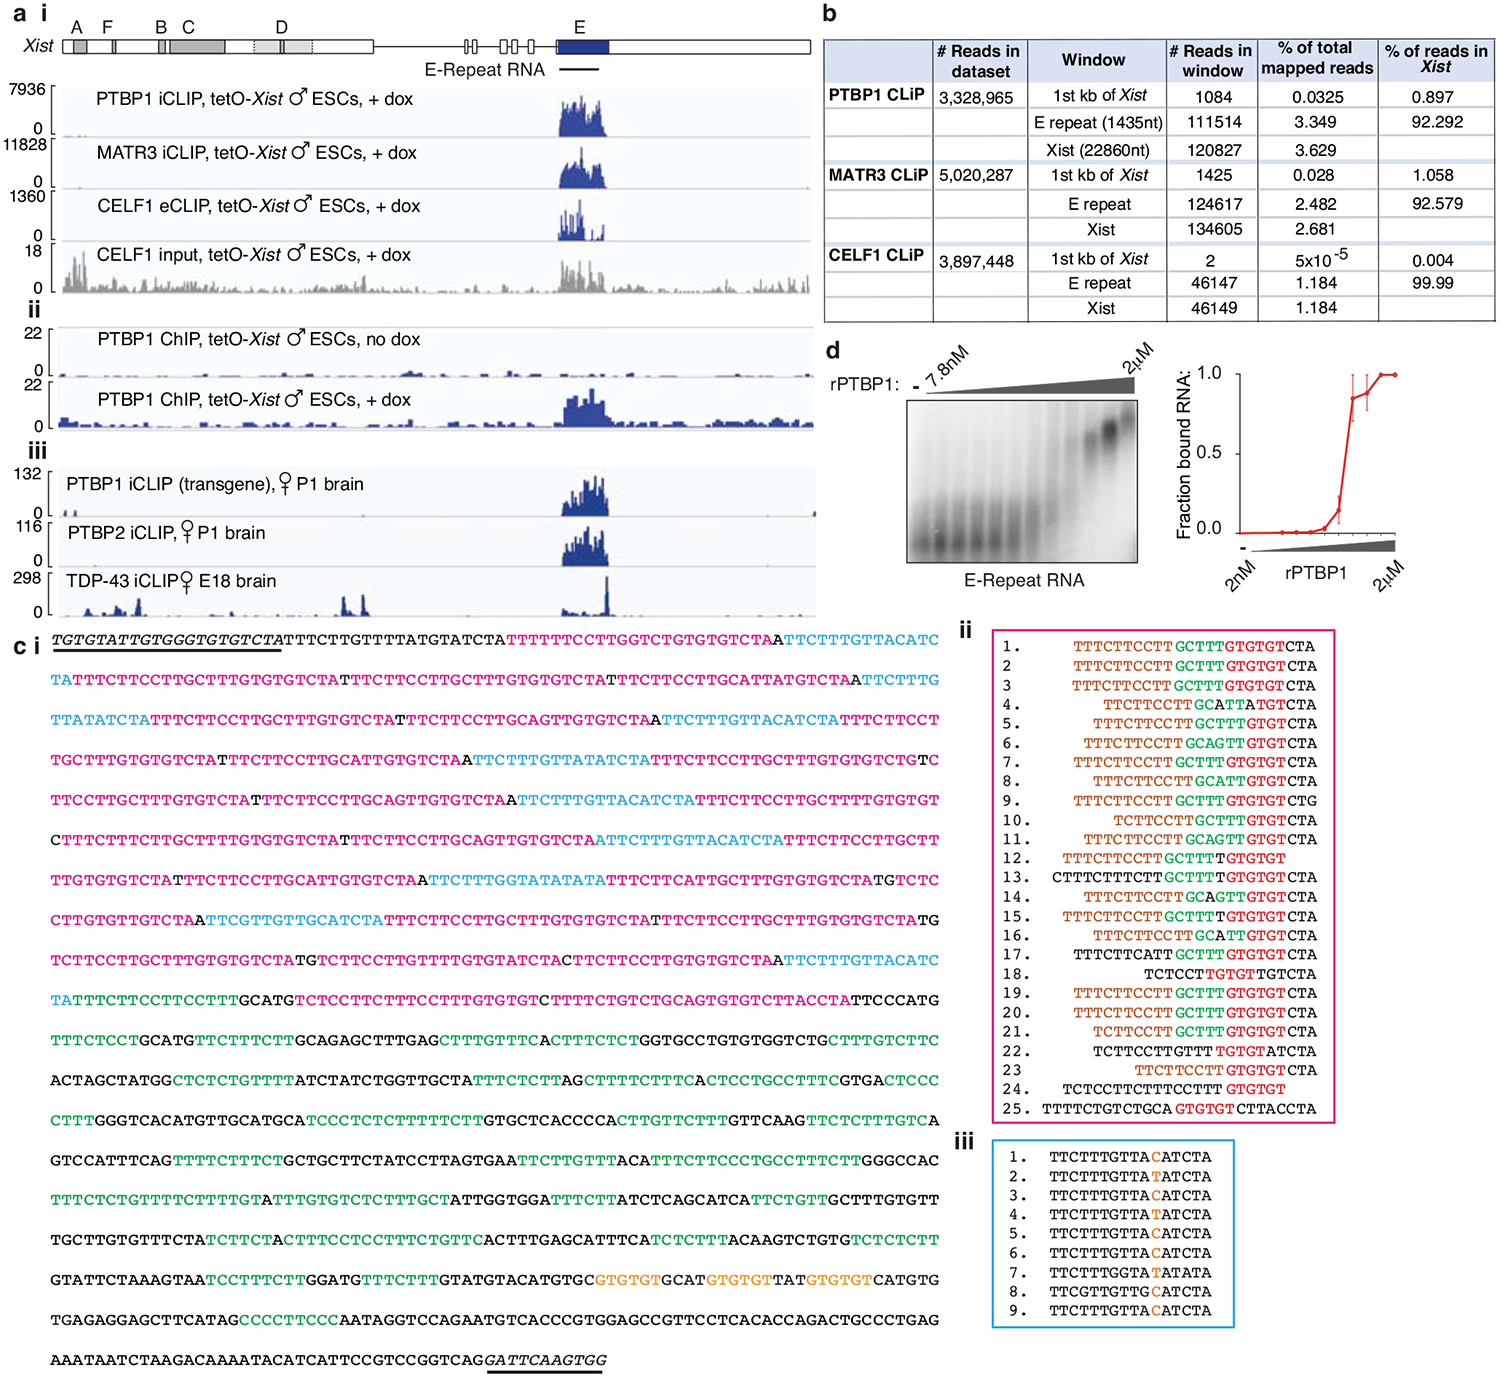
a i, Top: Diagram of the Xist genomic locus. The IVT E-repeat RNA used in (d) is indicated. Bottom: PTBP1, MATR3 and CELF1 i/eCLIP-seq profiles across the Xist locus in male tetO-Xist ESCs after 6h of dox induction. CELF1 input profile is shown, read counts indicated on left. ii, PTBP1 ChIP-seq profiles across the Xist locus before or after 20h of dox treatment in male tetO-Xist ESCs. iii, PTBP1, PTBP2 and TDP-43 iCLIP-seq profiles across the Xist locus in female mouse brain.
b, Table of mapping statistics for PTBP1, MATR3 and CELF1 i/eCLIP-seq data in (a). Note that Xist is overexpressed in this experiment, which influences the number of reads mapping to the locus.
c i, The first 1500nt of exon 7 of Xist are shown, capturing the E-repeat. The sequence remaining after splicing of the Xist-ΔE transcript is underlined and italicized. The C/U/G tandem repeats within the 5’ half of the E-repeat are indicated (pink-full and blue-truncated repeats) as are the CU-tracts (green) in the 3’ half. Potential TDP-43 sites are indicated in orange. ii, Alignment of the 25 full C/U/G-tandem repeats (pink) from (i). Brown tracts encode putative PTBP1/MATR3 binding sites, red tracts putative CELF1/TDP-43 binding sites. iii, Alignment of the 9 truncated C/U/G-tandem repeats (blue) from (i). Orange colored nucleotides are variable within each truncated repeat unit.
d, Left: EMSA of IVT E-repeat RNA (see (a)) and either none, or increasing amounts of rPTBP1 (0, 1.95nM, 3.9nM, 7.8nM, 15.6nM, 31.3nM, 62.5nM, 125nM, 250nM, 500nM, 1μM and 2μM). Right: Quantification of the bound RNA fraction (Kd ~ 200nM, from two independent experiments, with s.e.m shown). For source data see Supplementary Fig. 1.
Extended Data Fig. 4: CELF1 and PTBP1 localize within the Xist-coated territory.
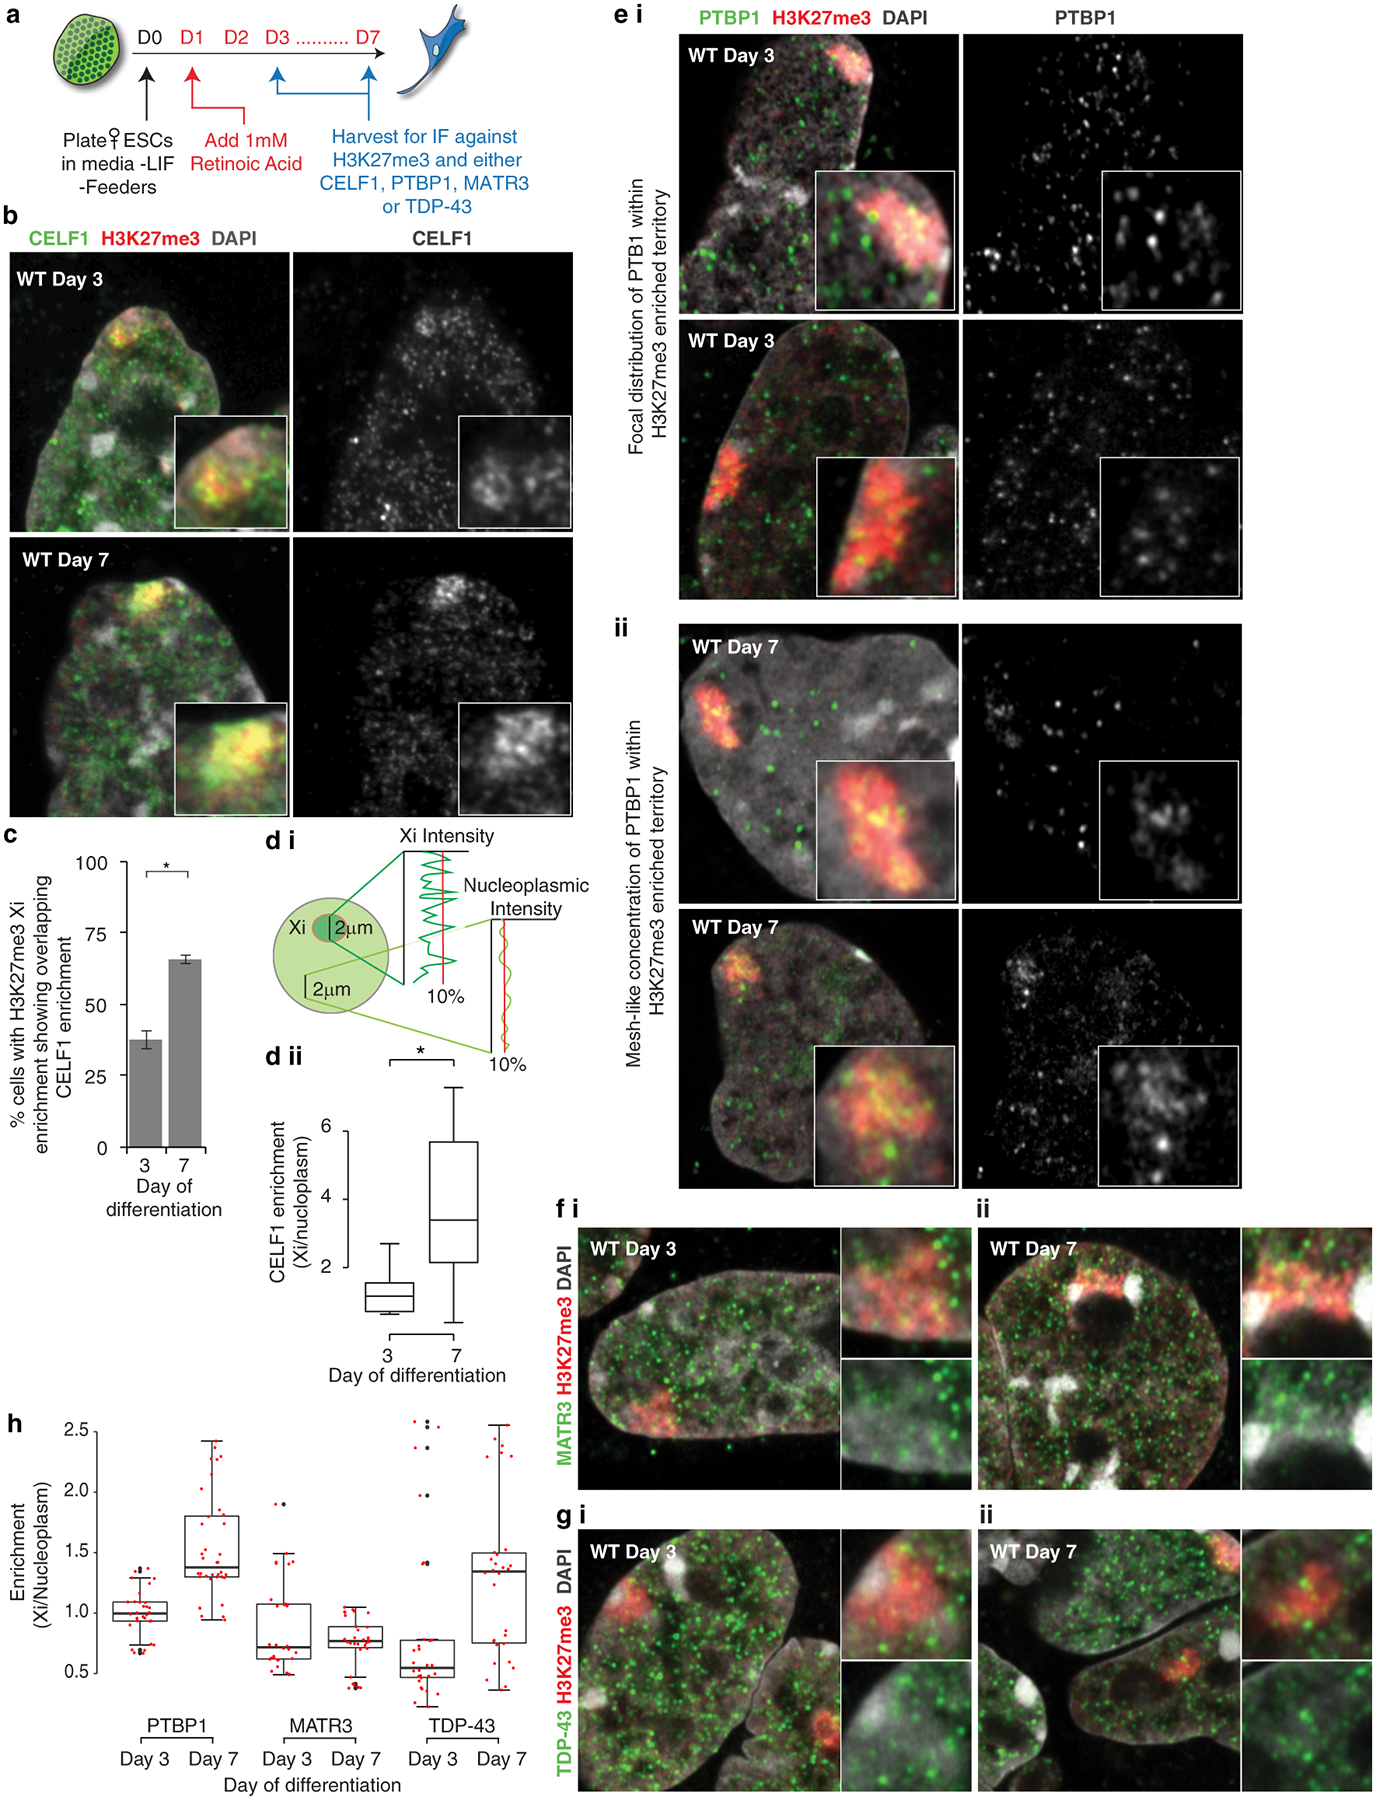
a, Experimental schematic.
b, Left: Confocal-airyscan sections of WT ESCs at differentiation day 3 and 7, immunostained for CELF1 and H3K27me3. Inset: Enlargement of the Xi-territory. Right: CELF1 staining in greyscale.
c, Histogram showing the proportion of H3K27me3-marked Xi’s with a co-localizing CELF1 enrichment. Error bars indicate s.e.m. (n=50 from 3 coverslips across 2 independent differentiations); * P<0.05, 2-tailed students t-test.
d i, Intensity values for CELF1 fluorescence were recorded across a 2μm line over the Xi (identified based on the H3K27me3 Xi-staining) or within the nucleoplasm of the same nucleus in z-stack projections. ii, Box plot showing the distribution of the ratio between the top 10% CELF1 Xi intensity values compared to the top 10% intensity values from the nucleoplasm (n=12, from one experiment); * P<0.05, 2-sample KS test.
e i, Left: Like (b) except showing PTBP1 immunostaining at differentiation day 3. Right: PTBP1 staining in greyscale. ii, Same as in (i), except at differentiation day 7. Note these images highlight a mesh-like PTBP1 concentration within the Xi observed in a small fraction of cells, distinct from that observed in the nucleoplasm of these cells or from the pattern within the Xi at day 3.
f i, Same as (e-i) except showing MATR3 immunostaining and Xi-zoom ins. ii, Same as in (e-ii), except showing MATR3 immunostaining.
g, Same as in (f) except for TDP-43.
h, Same as (d-ii) except showing data for PTBP1, MATR3 and TDP-43, (n=5, from one experiment). Red dots - data points for the top 10% Xi/Nucleoplasmic intensity values from 5 cells. For Box Plots in d-ii and h, horizontal lines denote the median, whiskers indicate 1.5x the interquartile range, dots represent outliers.
Extended Data Fig. 5: ΔE ESCs undergo differentiation similar to WT ESCs and splicing of Xist-intron 6 proceeds in the absence of the E-repeat.
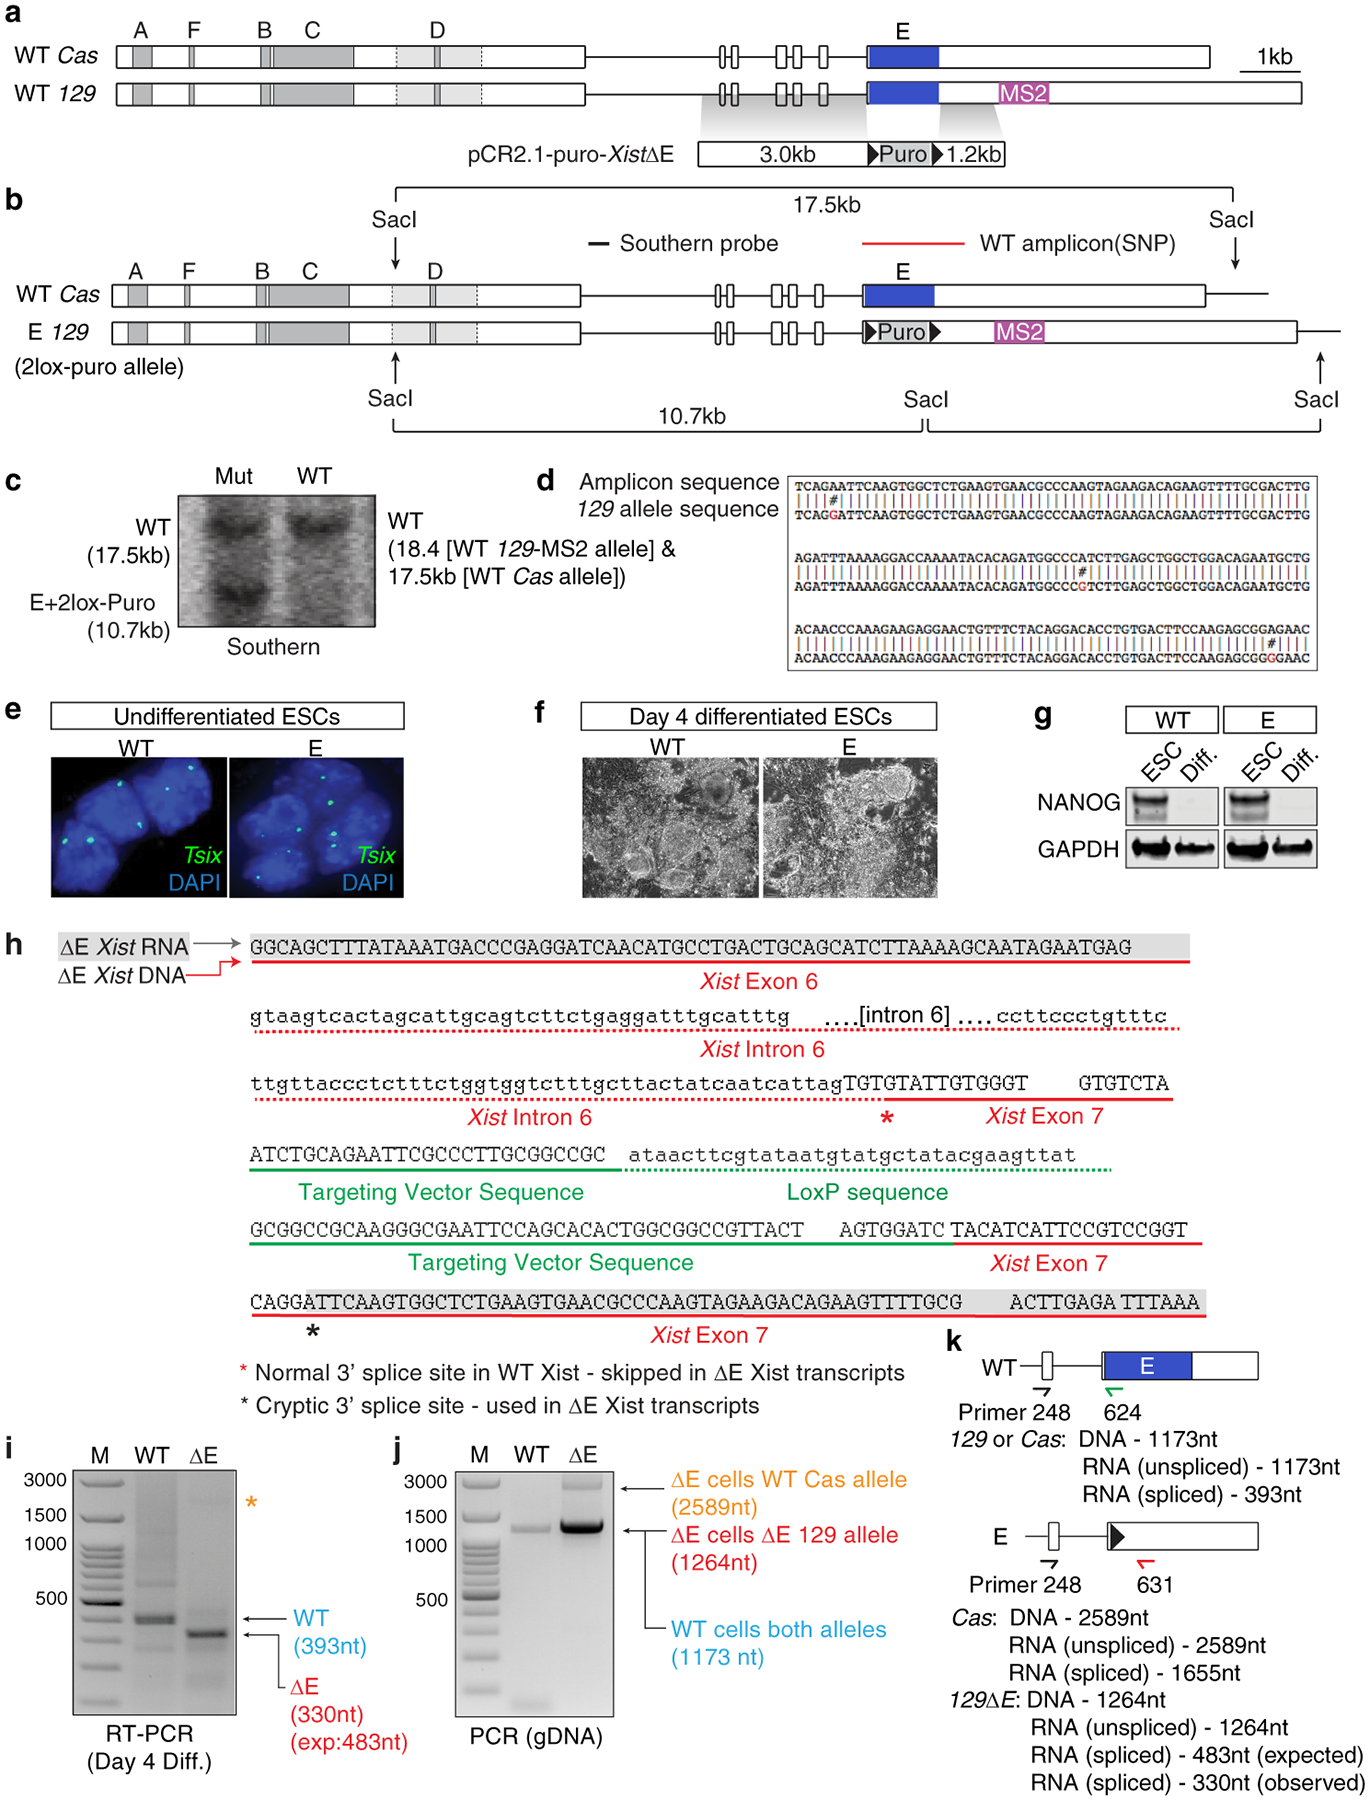
a, Homologous recombination strategy used to delete the Xist E-repeat in female ESCs.
b, Southern blot strategy with a 5’ external probe for identification of deletion clones.
c, Southern blot (described in (b)) on targeted ESCs with a loxP-flanked puromycin cassette in place of the E-repeat on one Xist allele.
d, Sequencing analysis (black) of the WT Xist-PCR amplicon in ΔE cells (red line in (b)). 129-allele SNPs are shown in red and do not match those in PCR amplicon, confirming E-repeat deletion on the 129-Xist-MS2 allele.
e, Tsix RNA FISH on undifferentiated WT and ΔE ESCs confirms the presence of two Tsix nascent transcription units, used as a proxy to confirm targeted cells maintain two X-chromosomes.
f, Brightfield images of WT and ΔE ESCs at day 4 of differentiation, showing that differentiating cells are morphologically similar.
g, Immunoblot of differentiation day 2 WT and ΔE cell lysate, showing equal loss of NANOG expression.
h, Sequence of genomic and cDNA amplicons of the ΔE Xist allele after puromycin cassette removal, confirming correct targeting and the use of a cryptic splice site in ΔE cells.
i, Exon 6 to 7-RT-PCR amplicons generated from RNA isolated from day 4 differentiated WT (primers APJ248/624) or ΔE (primers APJ248/631) cells. The ΔE PCR amplicon was shorter than expected. Sequencing revealed a cryptic 3’ splice site downstream of the LoxP site which extended the E-repeat deletion within the Xist transcript (but not the Xist genomic DNA) by 42nt (see (h)).
j, PCR amplicons from WT or ΔE genomic DNA using the same primers as in (i). The intron 6-containing products can be amplified, indicating non-detection of intron 6-containing Xist transcripts is not due to amplification problems.
k, Schematic outlining primers used to assess Xist gDNA and RNA in (i) and (j).
For c, g, i and j, see Supplementary Fig. 1 for source data.
Extended Data Fig. 6: E-repeat loss does not affect Xist abundance, splicing or stability.
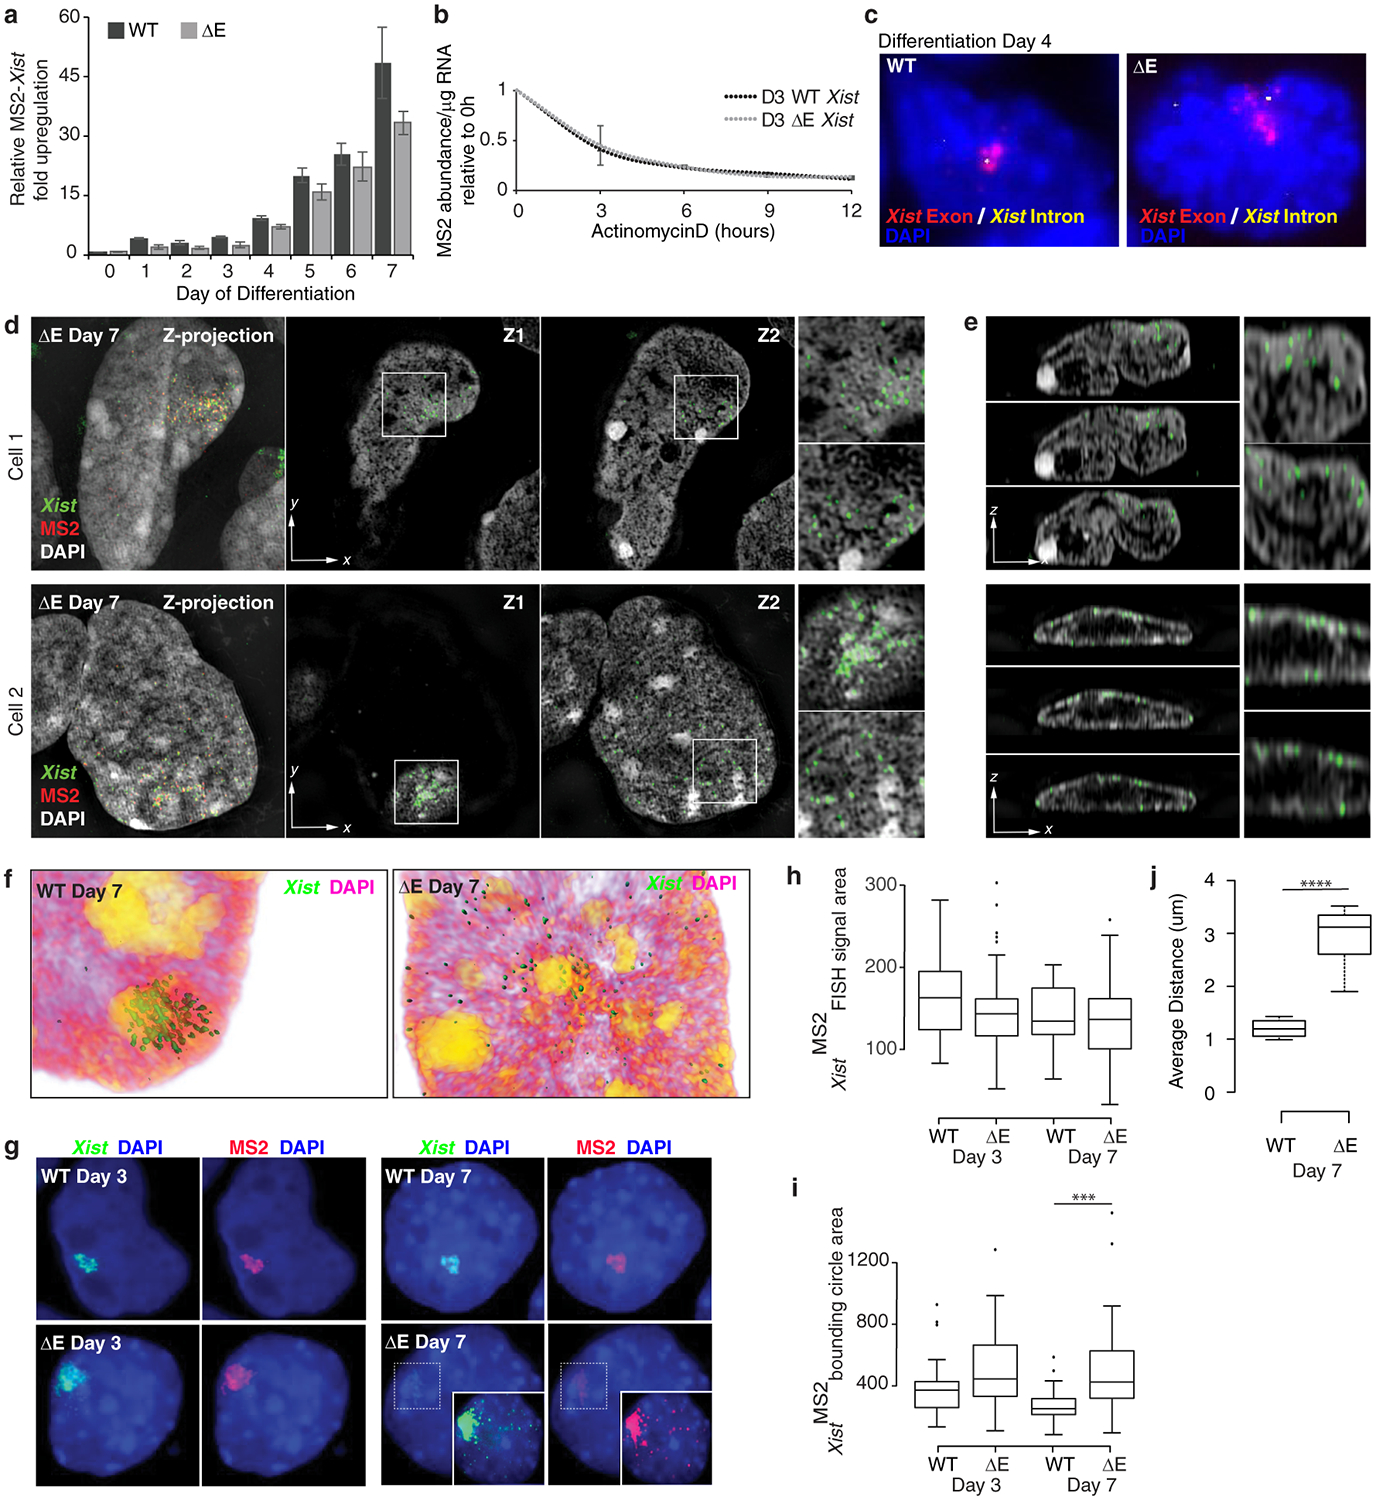
a, RT-qPCR quantification of the fold upregulation of MS2+Xist RNA during differentiation of WT or ΔE cells normalized against undifferentiated samples and an internal control (Rrm2).
b, RT-qPCR measurements of MS2+Xist RNA half-life (upon ActinomycinD treatment) at day 3 of differentiation in WT or ΔE cells, calculated as MS2 transcript copy number/μg of total RNA. For a and b, error bars represent the s.e.m. (n=3, measured in triplicate). Differences were not significant by 2-tailed students t-test.
c, Epifluorescence images of differentiation day 4 WT and ΔE cells probed for exonic regions of Xist (red) or Xist intron 1 (yellow), and DAPI stained, indicating that the Xist ΔE transcripts within the cloud are spliced.
d, Same as Fig. 1h–i, except two additional ΔE Xist-expressing nuclei are shown. Scale bar: 5μm.
e, Same as Fig. 1h-ii, except for the nuclei in (d). Note aberrant localization of ΔE Xist at the nuclear lamina.
f, 3D Amira reconstructions of the cells shown in Fig. 1h–i.
g, Representative epifluorescence images of RNA FISH against Xist and MS2 with DAPI staining for comparison to super-resolution images in d-e and Fig. 1e–h. Inset: Enhanced image of the marked area.
h, Box plot showing the distribution of the area (in pixels) covered by Xist RNA FISH signal, used to calculate the Xist aggregation score in Fig. 1f, (n=30, from one experiment).
i, Same as (h) except showing distribution of the bounding circle area, (n=30, from one experiment); *** P<0.00005, 2-sample KS-test.
j, Box plot of the average distance between Xist foci within MS2+Xist clouds in differentiation day 7 WT and ΔE ESCs, as measured by IMARIS. 50 measurements were made per cell, 5 cells per sample; **** P<0.000005, 2-sample KS-test. For h-j, horizontal lines denote the median, whiskers indicate 1.5x the interquartile range, dots represent outliers.
Extended Data Fig. 7: The ΔE-Xist-coated X-chromosome displays decreased DAPI staining and less compact H3K27me3-accumulation at differentiation day 7.
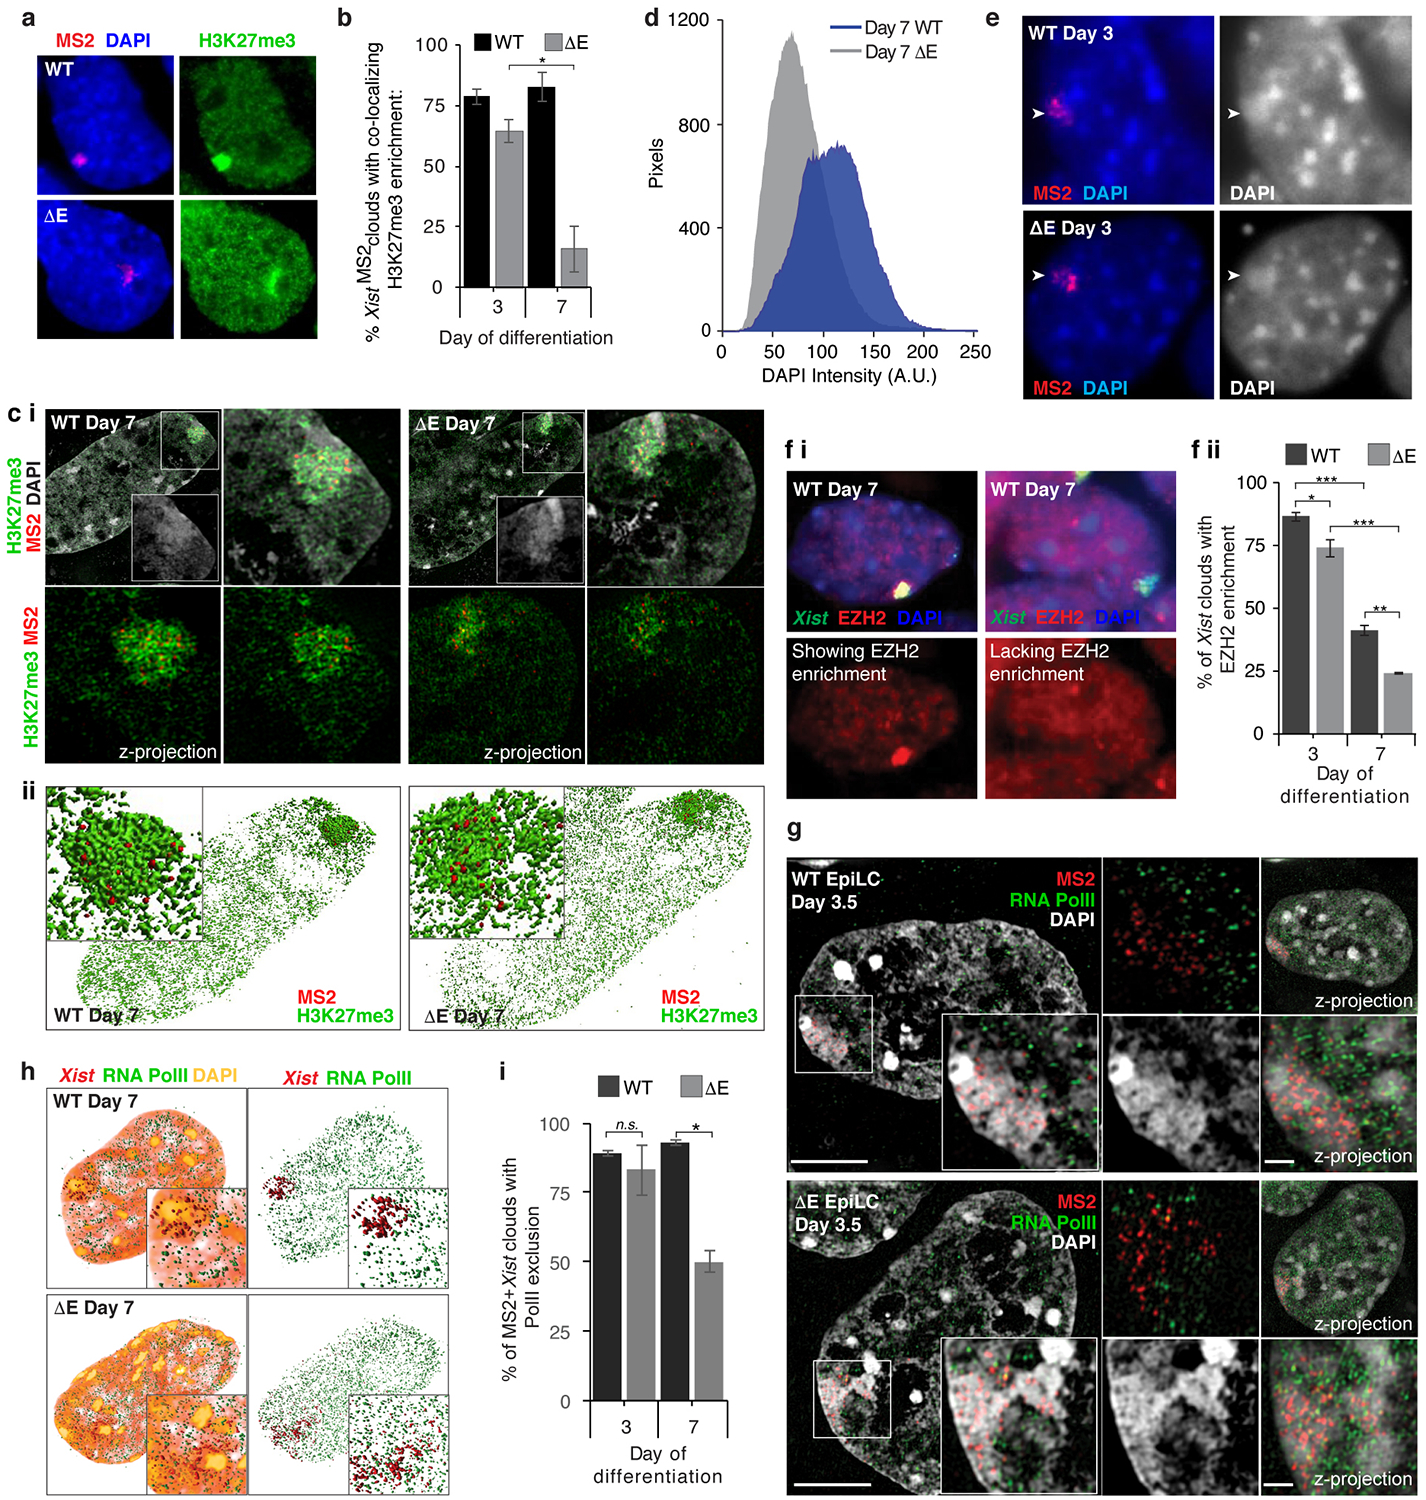
a, Epifluorescence images of cells immunostained for H3K27me3 and probed for MS2.
b, Quantification of MS2+Xist RNA FISH clouds with a co-localizing accumulation of H3K27me3 at day 3 or 7 of differentiation in WT or ΔE cells (n=60/coverslip, 3 coverslips over 2 experiments); *P = 0.05, 2-sample students t-test.
c i, Top left: 3D-SIM section of WT and ΔE cells at differentiation day 7 stained for H3K27me3 and DAPI and probed for MS2. Inset: DAPI staining of marked region. Right: Magnification of inset area with (top) or without DAPI (bottom). Bottom left: Z-stack projection of inset without DAPI. ii, 3D Amira reconstruction of images in (i).
d, Graph showing the number of pixels with indicated DAPI fluorescence intensity from MS2-Xist-expressing X-chromosome in WT and ΔE cells, masked by H3K27me3 enrichment (n=10, from one experiment).
e, Epifluorescence images of WT and ΔE cells probed for MS2. Arrowheads point to the Xist cloud and highlight the DAPI-bright staining for the X-territory.
f i, Epifluorescence images of WT cells stained for EZH2 and Xist, with (left) and without (right) EZH2 Xi-enrichment at differentiation day 7. ii, Histogram of the percentage of Xist clouds with co-localized EZH2 enrichment (n=60/coverslip, 3 coverslips from 2 experiments), *P <0.05, ** P < 0.005, ***P <0.0005, 2-sample students t-test.
g, 3D-SIM sections through day 3.5 differentiated WT or ΔE ESCs (EpiLC differentiation), immunostained for RNA PolII and probed for Xist, showing RNA PolII exclusion from the X-territory. Inset: Signals derived from marked area. Small images: top left: same as inset without DAPI; bottom left: same as inset only DAPI; top right: Z-stack projection of the cell; bottom right: Z-stack projection of the Xist-coated X. Scale bar: 5μm, Inset: 1μm.
h, 3D Amira reconstruction of cells in Fig. 2e. Inset: Enlargement of the MS2-Xist-expressing X. Right: Same as left without DAPI.
i, Quantification of RNA PolII exclusion from XistMS2-coated territory (n=50/coverslip, 2 coverslips from 1 experiment), *P=0.05, 2-tailed students t-test.
Extended Data Fig. 8: Loss of the E-repeat prevents continued gene silencing in differentiating ESCs.
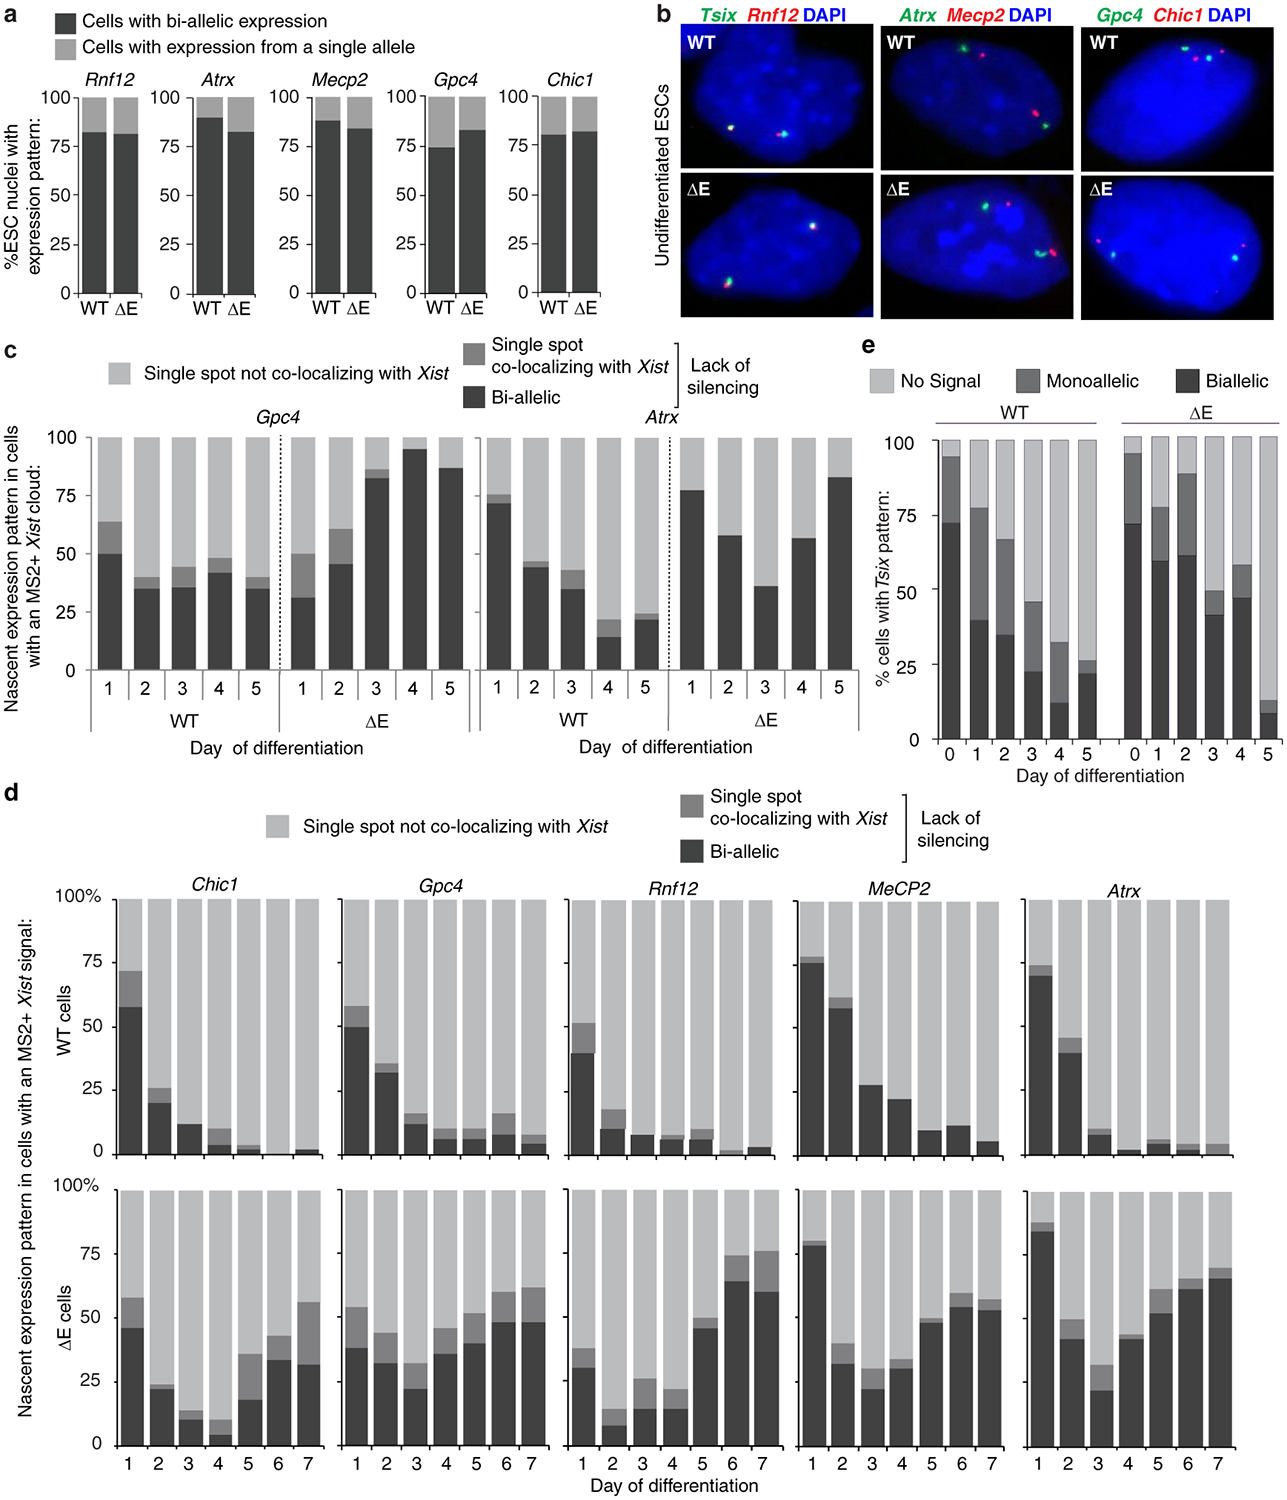
a, Histograms of nascent transcription pattern of indicated X-linked genes (Rnf12 (Rlim), Atrx, Mecp2, Gpc4 and Chic1) in undifferentiated WT and ΔE ESCs, demonstrating that heterozygous deletion of the E-repeat does not interfere with X-linked gene expression in undifferentiated ESCs (n=60, from one experiment).
b, Representative epifluorescence images of cells counted in (a). Tsix, the antisense transcript of Xist was also detected here to identify both X’s. Co-localized foci appear yellow.
c, Histograms of nascent expression patterns of the X-linked genes Gpc4 and Atrx in WT and ΔE cells displaying an MS2+Xist-coated X-chromosome (n=50), across 5 days of differentiation. These data were derived from an independent differentiation from that shown in Fig. 2c.
d, Histograms of nascent expression patterns of indicated X-linked genes in WT and ΔE cells displaying an MS2+Xist-coated X-chromosome (n=50), across 7 days of differentiation derived from an independent differentiation from that shown in (c) and Fig. 2c.
e, Histogram of nascent expression patterns of the X-linked gene Tsix in WT and ΔE cells across 5 days of differentiation. Note that these data were not scored relative to XistMS2 expression (i.e. the monoallelic Tsix signal can be derived from either the 129 or cas allele (n=70, except for the ΔE cells at day 5 with only 47 cells counted).
Extended Data Fig. 9: A site-specific recombination-based approach to rescue phenotypes associated with loss of the E-repeat.
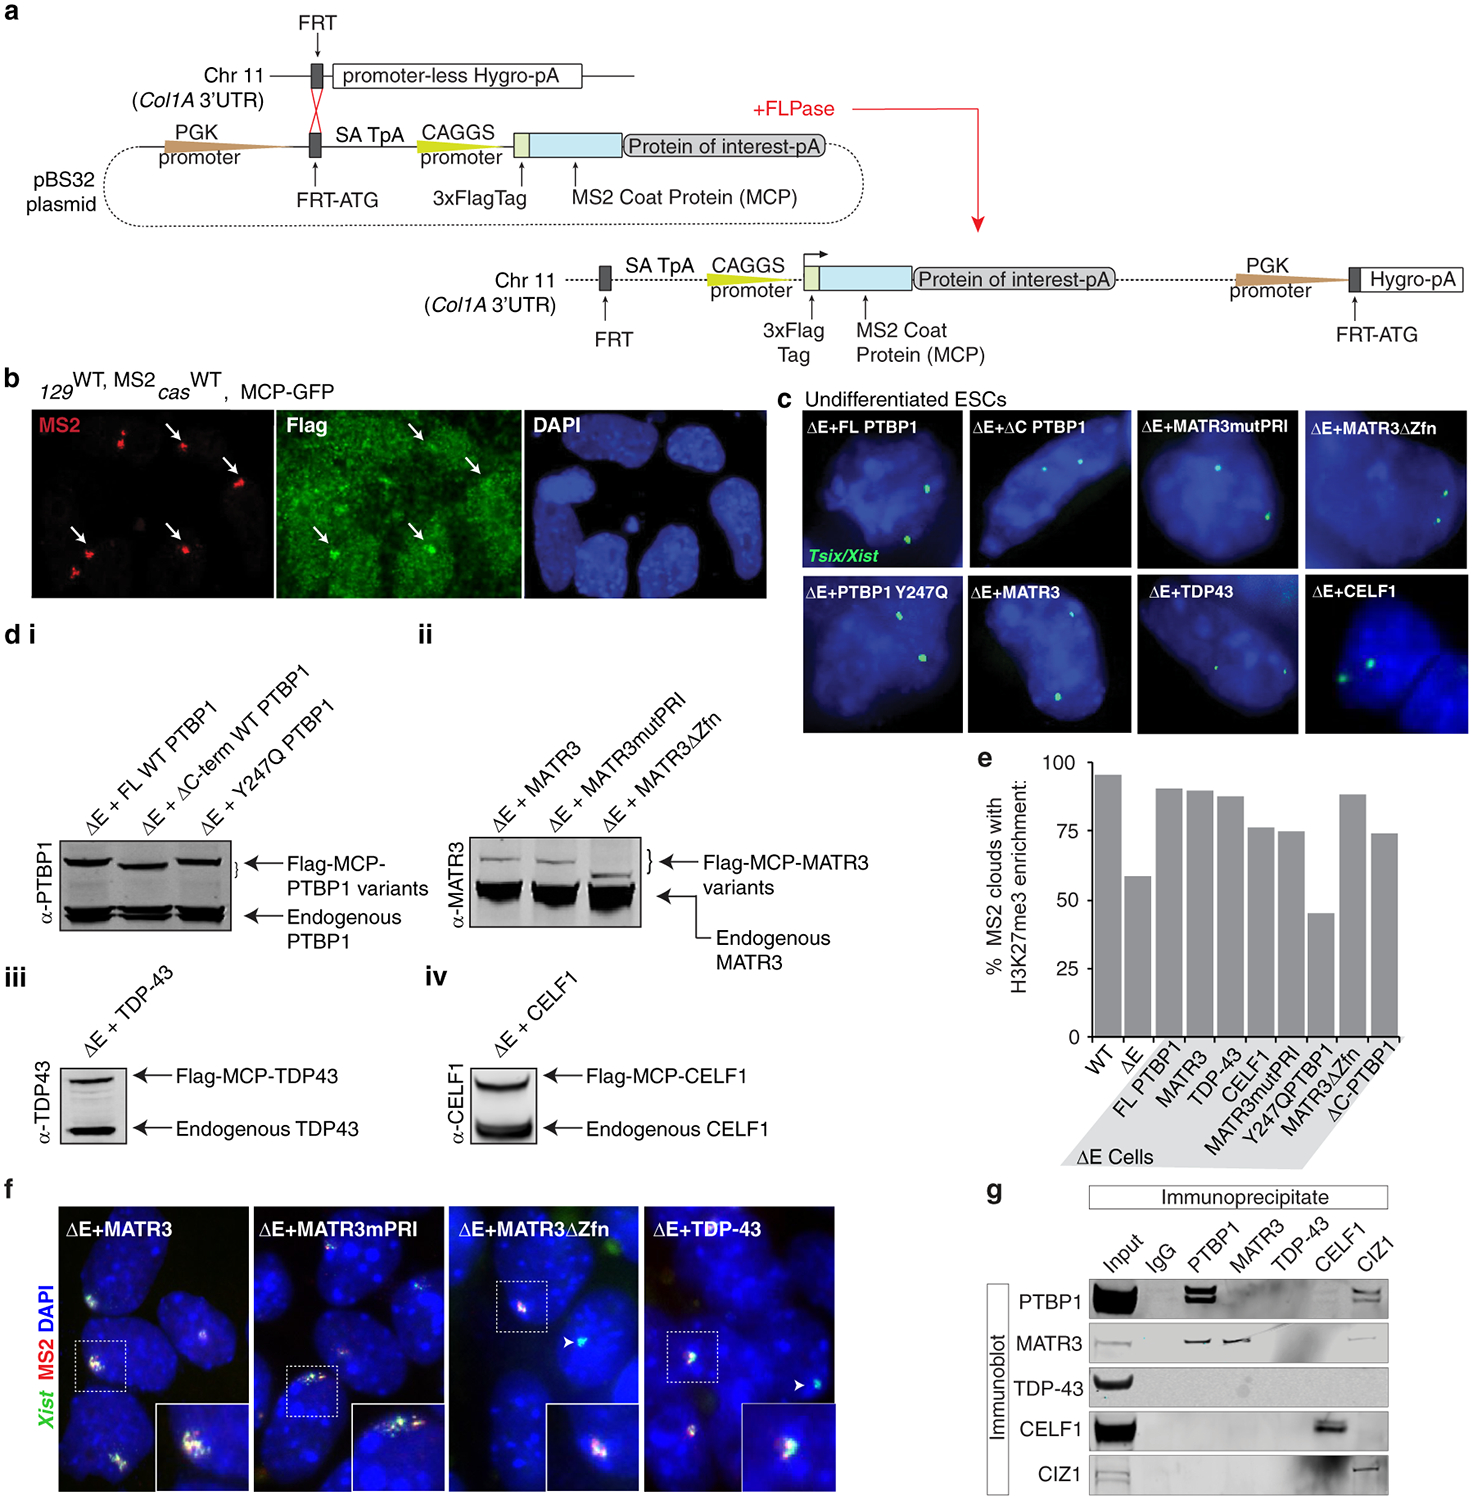
a, Flp-In approach taken to constitutively express Flag-tagged MCP fusion proteins in ESCs (methods). The Flag-MCP-GFP fusion protein was only expressed in WT ESCs. All other rescue constructs were expressed in ΔE ESCs.
b, Flag-MCP-GFP fusion protein recruitment to MS2+Xist in WT ESCs at differentiation day 7 shown with representative epifluorescence images. Arrows indicate MS2+Xist129 clouds with co-localizing Flag-MCP-GFP enrichment.
c, Tsix expression was used as a proxy to confirm presence of two X-chromosomes in rescue ESC lines.
d i, PTBP1-probed immunoblot on lysates from undifferentiated ΔE-ESCs expressing full-length MCP-PTBP1 or MCP-PTBP1 mutants. ii, as in (d-i) except for MATR3 immunoblot for various MATR3 rescue lines. iii, TDP-43-probed immunoblot on lysates from undifferentiated ΔE-ESCs expressing MCP-TDP-43. iv, CELF1-probed immunoblot on lysates from undifferentiated ΔE-ESCs expressing MCP-CELF1.
e, Histogram of the percentage of MS2+Xist clouds that also show enrichment of H3K27me3 in WT or ΔE cells, or ΔE cells expressing the indicated MCP-fusion protein at differentiation day 7 (n=80, from one experiment).
f, Representative epifluorescence images of RNA FISH against Xist (green) and MS2 (red) in day 7 differentiated ΔE cell lines expressing the indicated variants of MCP fusion proteins. Inset: enlargement of marked area. Arrowheads indicate WT Xist clouds in ΔE cells, derived from the cas allele.
g, Immunoprecipitation of PTBP1, MATR3, CELF1, TDP-43 and CIZ1 from ESC nuclear extracts (RNase treated) and detection of co-precipitated proteins with the same antibodies by immunoblotting (to go with Fig. 3f).
For images in d and g, see Supplementary Fig. 1 for source data.
Extended Data Fig. 10: Expression of MCP-CIZ1 or MCP-GFP-MCP does not rescue phenotypes due to loss of the E-repeat.
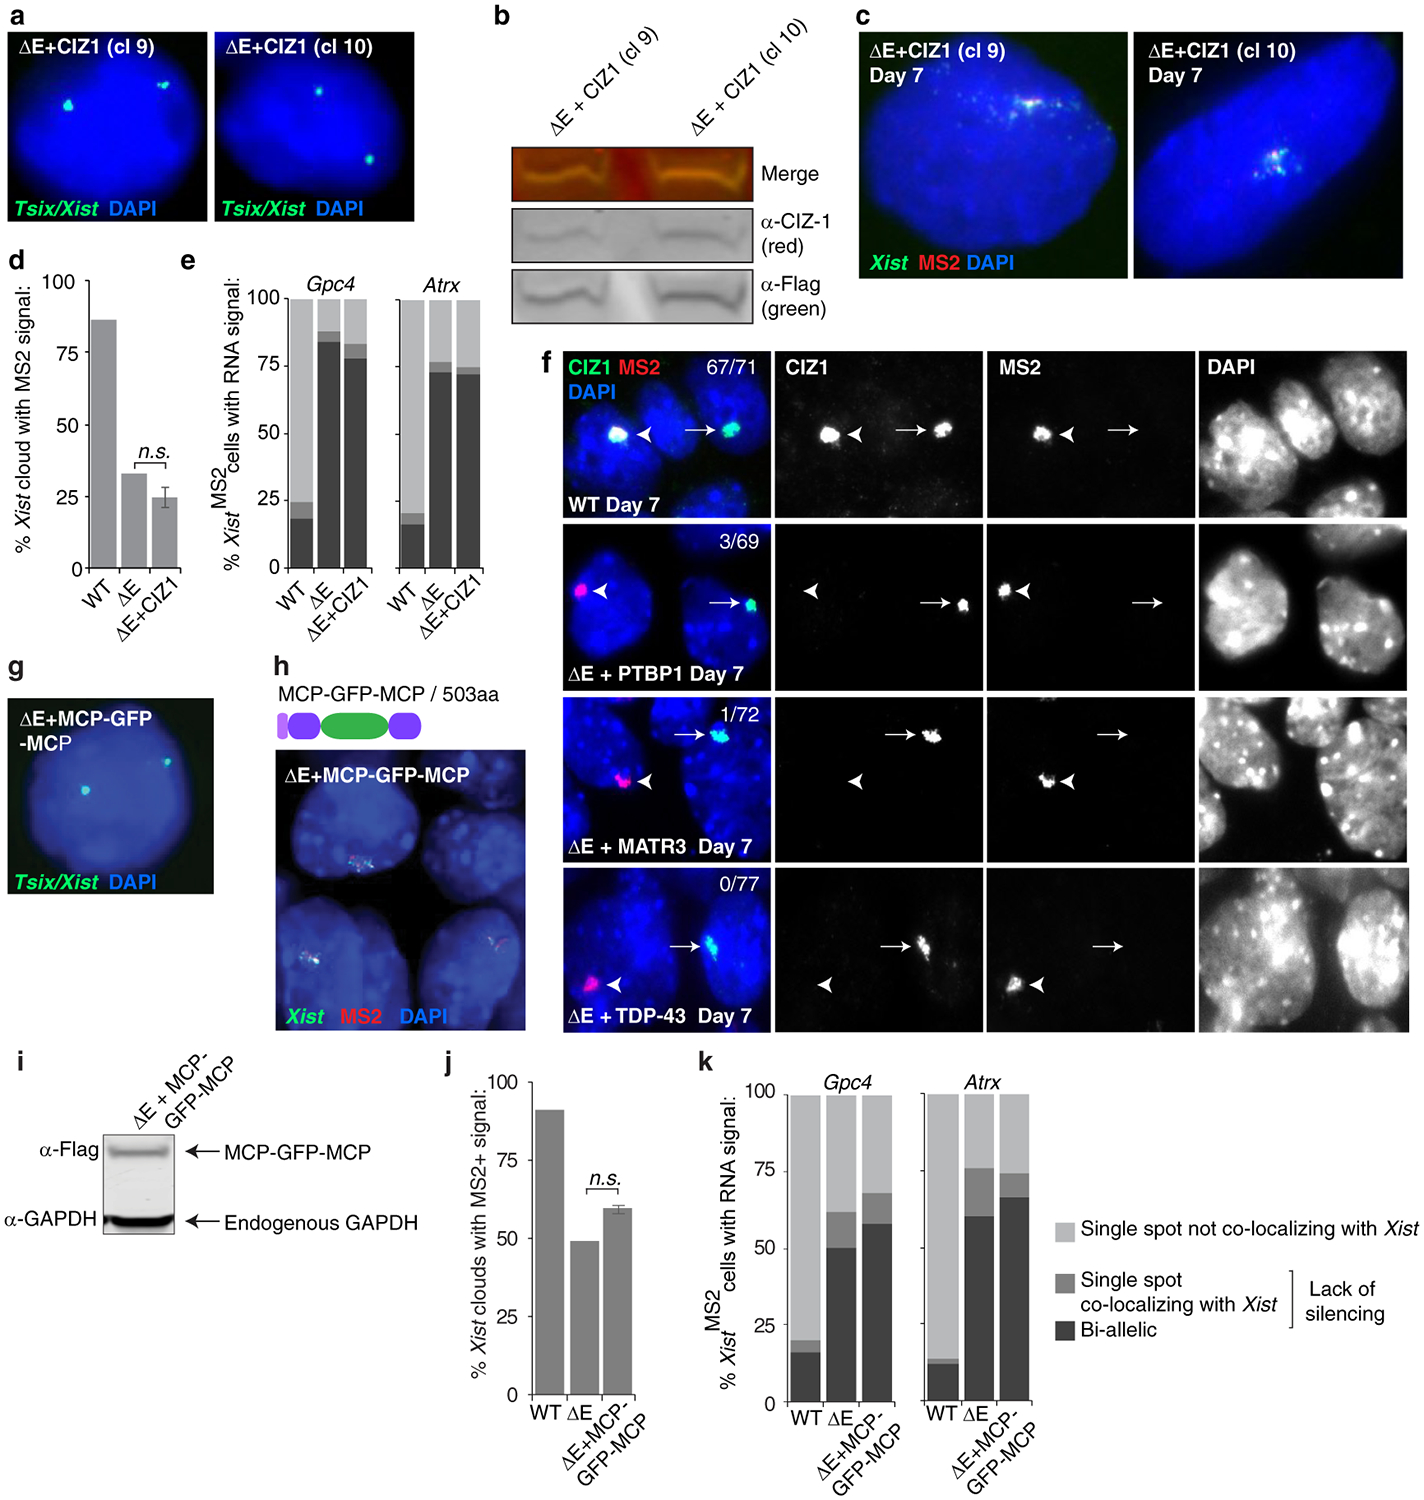
a, RNA FISH images of Tsix transcripts for detection of two X’s. Two ΔE MCP-CIZ1 ESC clones (9 and 10) are shown.
b, Immunoblot result for undifferentiated ΔE-ESC clones expressing MCP-CIZ1.
c, Representative epifluorescence images of day 7 differentiated MCP-CIZ1-expressing ΔE clones, probed for Xist and MS2.
d, Proportion of Xist clouds also displaying a co-localizing MS2 signal at differentiation day 7. The results for both CIZ1 rescue clones from one experiment were merged and the error bars represent s.e.m (n=120), P: not significant, 2-tailed students t-test.
E, Quantification of nascent Gpc4 or Atrx expression patterns in WT, ΔE, or ΔE cells expressing MCP-CIZ1 (clone 9) displaying MS2+Xist expression, at differentiation day 7 (n=50, from one experiment).
f, Representative epifluorescence images of in WT, ΔE, or indicated ΔE rescue cell lines at differentiation day 7 immunostained for CIZ1 and probed for MS2. Arrowheads indicate rescued cloud from the ΔE MS2+Xist allele. Fraction of MS2+Xist clouds showing CIZ1 enrichment is given.
g, RNA FISH images of Tsix transcripts in ΔE MCP-GFP-MCP ESCs to demonstrate the presence of two X’s.
h, Representative epifluorescence images of day 7 differentiated MCP-GFP-MCP-expressing ΔE ESCs probed for Xist and MS2, and illustration of Flag-tagged MCP-GFP-MCP fusion protein (Fig. 3b for key).
i, Immunoblot against the Flag-tag and GAPDH using lysates from undifferentiated MCP-GFP-MCP ΔE-ESCs.
j, Histogram showing the proportion of nuclei with Xist FISH signal that also displayed a co-localizing MS2 signal at differentiation day 7 for indicated cell lines (n=100); P: not significant, 2-tailed students t-test, using 2 independent MCP-GFP-MCP expressing clones from one experiment.
k, Quantification of nascent Gpc4 or Atrx expression patterns in cells displaying MS2+ Xist expression at differentiation day 7 (n=50, from one experiment).
For images in b and i, see Supplementary Fig. 1 for source data.
Extended Data Fig. 11: CELF1 enhances droplet formation of PTBP1 with the E-repeat in vitro and mutations in MATR3 and TDP-43 that abrogate their self-association do not rescue ΔE phenotypes.
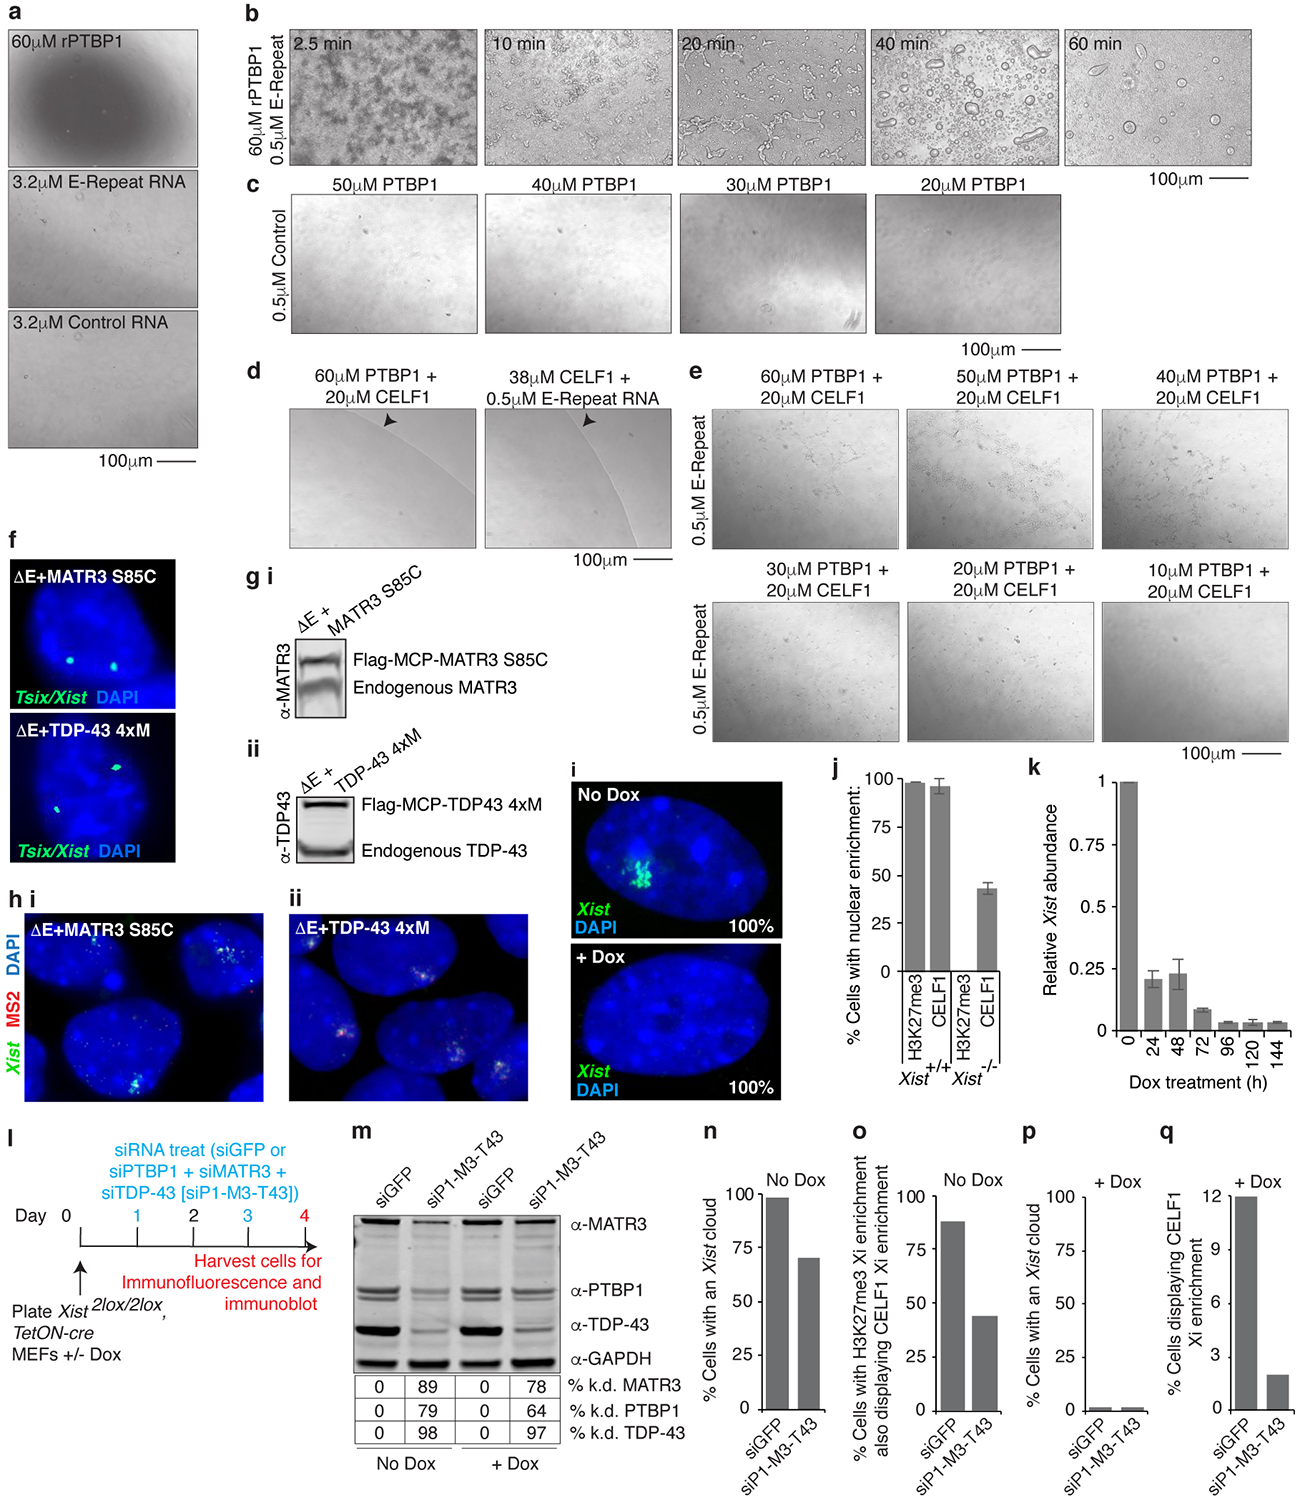
a, Images showing lack of droplets with 60μM rPTBP1, 3.2μM E-repeat or control RNA at 40min.
b, Droplets formed from 60μM rPTBP1 and 0.5μM E-repeat-RNA over time.
c, Same as (a) except with 0.5μM control-RNA and different concentrations of rPTBP1 (40min).
d, Same as (a) except with 60μM rPTBP1 and 20μM rCELF1, or 38μM rCELF1 with 0.5μM E-Repeat-RNA. Arrowheads indicate solution boundary with sample on left.
e, Brightfield images showing aggregate-like formations of 20μM rCELF1, 0.5uM E-repeat-RNA with varied concentrations of rPTBP1.
f, RNA FISH images of Tsix transcripts in indicated ESC lines to show presence of both X’s.
g i, MATR3 immunoblot on extracts from ΔE ESCs expressing MCP-MATR3-S85C. ii, TDP-43 immunoblot on ΔE ESCs expressing MCP-TDP-43–4xM.
h, Epifluorescence images of day 7 differentiated ΔE-cells expressing MCP-MATR3-S85C (i) or MCP-TDP-43–4xM (ii) probed for Xist and MS2.
i, MEFs (Xist2lox/2lox, R26M2rtTA/tetO-Cre-recombinase) probed for Xist, before or after dox treatment (96h). Percentage of cells with displayed Xist pattern is given (n=50, two biological replicates).
j, Histogram showing percentage of MEFs with H3K27me3 or CELF1 Xi-enrichment under conditions described in (i). Error bars represent s.e.m, (n=50, from two biological replicates).
k, Histogram showing relative Xist abundance over time of dox treatment for cells in (i) (see Fig. 4g.)
l, Experimental schematic for knockdown experiment in (m-q).
m, Immunoblot showing knockdown of indicated factors in the experiment described in (l).
n, Percentage of MEFs (no dox) with an Xist cloud for indicated knockdowns (n=50, from one experiment).
o, Percentage of MEFs (no dox) with an Xi-enrichment of H3K27me3 that show a co-localizing accumulation of CELF1 (n=50, from one experiment).
p, Same as (n) except with dox treatment.
q, Percentage of MEFs with CELF1 enrichment (n=50, from one experiment).
For image in g and m, see Supplementary Fig. 1 for source data.
Supplementary Material
Acknowledgments
We are grateful to members of the Plath and Black labs for helpful discussions and reading of the manuscript. A.P-J. was supported by postdoctoral fellowships from the Helen Hay Whitney Foundation and NIH (F32 GM103139); K.P. by Eli and Edythe Broad Center of Regenerative Medicine and Stem Cell Research (BSCRC) at UCLA, the David Geffen School of Medicine at UCLA, and the Jonnson Comprehensive Cancer Center at UCLA, the NIH (R01 GM115233), and a Faculty Scholar grant from the Howard Hughes Medical Institute; D.L.B by the NIH (R01 GM049662 and R01 MH109166 (to K.P and D.L.B.)); M.G. was funded by the New York Stem Cell Foundation, Searle Scholars Program and the Pew-Steward Scholars Program. M.G. is a NYSCF-Robertson Investigator. Y.M, BP and S.Z. were supported by the NIH (NICHD 5R03HD095086 to Y.M.) (R03HD088380 to B.P.) (R01NS104041 and R01MH116220 to S.Z.). Y.M. and H.L were supported by the Deutsche Forschungsgemeinschaft (SFB1064/A17 and LE721/18-1). T.C., A.C. and S.S. are supported by graduate fellowships from the Boehringer Ingelheim Foundation (to T.C.); the UCLA Whitcome Fellowship (to A.C); and the UCLA Broad Stem Cell Research Center – Rose Hills Foundation training award and the UCLA Dissertation Year Fellowship (to S.S.).
Footnotes
Authors declare no competing interests.
Data and code availability
All genomic data for Xist interactions and chromatin association have been deposited in the Gene Expression Omnibus (GEO) database under accession number GSE137305. Source Data for Fig. 3 and Extended Data Figs.1, 3, 5, and 9–11 are provided with this paper as supplementary tables or source data files. Reagents are available upon request.
References
- 1.Strom AR & Brangwynne CP The liquid nucleome - phase transitions in the nucleus at a glance. J. Cell Sci 132, (2019). [DOI] [PMC free article] [PubMed] [Google Scholar]
- 2.Engreitz JM et al. The Xist lncRNA exploits three-dimensional genome architecture to spread across the X chromosome. Science 341, 1237973 (2013). [DOI] [PMC free article] [PubMed] [Google Scholar]
- 3.McHugh CA et al. The Xist lncRNA interacts directly with SHARP to silence transcription through HDAC3. Nature 521, 232–236 (2015). [DOI] [PMC free article] [PubMed] [Google Scholar]
- 4.Minajigi A et al. Chromosomes. A comprehensive Xist interactome reveals cohesin repulsion and an RNA-directed chromosome conformation. Science 349, (2015). [DOI] [PMC free article] [PubMed] [Google Scholar]
- 5.Chu C et al. Systematic discovery of Xist RNA binding proteins. Cell 161, 404–416 (2015). [DOI] [PMC free article] [PubMed] [Google Scholar]
- 6.Galupa R & Heard E X-Chromosome Inactivation: A Crossroads Between Chromosome Architecture and Gene Regulation. Annu. Rev. Genet 52, 535–566 (2018). [DOI] [PubMed] [Google Scholar]
- 7.Brockdorff N Local Tandem Repeat Expansion in Xist RNA as a Model for the Functionalisation of ncRNA. Non-Coding RNA 4, (2018). [DOI] [PMC free article] [PubMed] [Google Scholar]
- 8.Wutz A & Jaenisch R A shift from reversible to irreversible X inactivation is triggered during ES cell differentiation. Mol. Cell 5, 695–705 (2000). [DOI] [PubMed] [Google Scholar]
- 9.Keppetipola N, Sharma S, Li Q & Black DL Neuronal regulation of pre-mRNA splicing by polypyrimidine tract binding proteins, PTBP1 and PTBP2. Crit. Rev. Biochem. Mol. Biol 47, 360–378 (2012). [DOI] [PMC free article] [PubMed] [Google Scholar]
- 10.Coelho MB, Attig J, Ule J & Smith CWJ Matrin3: connecting gene expression with the nuclear matrix. Wiley Interdiscip. Rev. RNA 7, 303–315 (2016). [DOI] [PubMed] [Google Scholar]
- 11.Prasad A, Bharathi V, Sivalingam V, Girdhar A & Patel BK Molecular Mechanisms of TDP-43 Misfolding and Pathology in Amyotrophic Lateral Sclerosis. Front. Mol. Neurosci 12, (2019). [DOI] [PMC free article] [PubMed] [Google Scholar]
- 12.Beisang D, R. P & Vlasova-St. Louis IA CELF1, a Multifunctional Regulator of Posttranscriptional Networks in Binding Protein (ed. Abdelmohsen K) (InTech, 2012). doi: 10.5772/48780. [DOI] [Google Scholar]
- 13.Pintacuda G et al. hnRNPK Recruits PCGF3/5-PRC1 to the Xist RNA B-Repeat to Establish Polycomb-Mediated Chromosomal Silencing. Mol. Cell 68, 955–969.e10 (2017). [DOI] [PMC free article] [PubMed] [Google Scholar]
- 14.Moindrot B et al. A Pooled shRNA Screen Identifies Rbm15, Spen, and Wtap as Factors Required for Xist RNA-Mediated Silencing. Cell Rep. 12, 562–572 (2015). [DOI] [PMC free article] [PubMed] [Google Scholar]
- 15.Li P et al. Phase transitions in the assembly of multivalent signalling proteins. Nature 483, 336–340 (2012). [DOI] [PMC free article] [PubMed] [Google Scholar]
- 16.Banani SF, Lee HO, Hyman AA & Rosen MK Biomolecular condensates: organizers of cellular biochemistry. Nat. Rev. Mol. Cell Biol 18, 285–298 (2017). [DOI] [PMC free article] [PubMed] [Google Scholar]
- 17.Gallego-Iradi MC et al. N-terminal sequences in matrin 3 mediate phase separation into droplet-like structures that recruit TDP43 variants lacking RNA binding elements. Lab. Invest 99, 1030–1040 (2019). [DOI] [PMC free article] [PubMed] [Google Scholar]
- 18.Plath K Role of Histone H3 Lysine 27 Methylation in X Inactivation. Science 300, 131–135 (2003). [DOI] [PubMed] [Google Scholar]
- 19.Silva J et al. Establishment of histone h3 methylation on the inactive X chromosome requires transient recruitment of Eed-Enx1 polycomb group complexes. Dev. Cell 4, 481–495 (2003). [DOI] [PubMed] [Google Scholar]
- 20.Coelho MB et al. Nuclear matrix protein Matrin3 regulates alternative splicing and forms overlapping regulatory networks with PTB. EMBO J. 34, 653–668 (2015). [DOI] [PMC free article] [PubMed] [Google Scholar]
- 21.Han A et al. De novo prediction of PTBP1 binding and splicing targets reveals unexpected features of its RNA recognition and function. PLoS Comput. Biol 10, e1003442 (2014). [DOI] [PMC free article] [PubMed] [Google Scholar]
- 22.Marquis J et al. CUG-BP1/CELF1 requires UGU-rich sequences for high-affinity binding. Biochem. J 400, 291–301 (2006). [DOI] [PMC free article] [PubMed] [Google Scholar]
- 23.Yamada N et al. Xist Exon 7 Contributes to the Stable Localization of Xist RNA on the Inactive X-Chromosome. PLoS Genet. 11, e1005430 (2015). [DOI] [PMC free article] [PubMed] [Google Scholar]
- 24.Ridings-Figueroa R et al. The nuclear matrix protein CIZ1 facilitates localization of Xist RNA to the inactive X-chromosome territory. Genes Dev. 31, 876–888 (2017). [DOI] [PMC free article] [PubMed] [Google Scholar]
- 25.Sunwoo H, Colognori D, Froberg JE, Jeon Y & Lee JT Repeat E anchors Xist RNA to the inactive X chromosomal compartment through CDKN1A-interacting protein (CIZ1). Proc. Natl. Acad. Sci. U. S. A 114, 10654–10659 (2017). [DOI] [PMC free article] [PubMed] [Google Scholar]
- 26.Kunath T et al. FGF stimulation of the Erk1/2 signalling cascade triggers transition of pluripotent embryonic stem cells from self-renewal to lineage commitment. Development 134, 2895–2902 (2007). [DOI] [PubMed] [Google Scholar]
- 27.Jonkers I et al. Xist RNA is confined to the nuclear territory of the silenced X chromosome throughout the cell cycle. Mol. Cell. Biol 28, 5583–5594 (2008). [DOI] [PMC free article] [PubMed] [Google Scholar]
- 28.Pasque V et al. X chromosome reactivation dynamics reveal stages of reprogramming to pluripotency. Cell 159, 1681–1697 (2014). [DOI] [PMC free article] [PubMed] [Google Scholar]
- 29.Rohland N & Reich D Cost-effective, high-throughput DNA sequencing libraries for multiplexed target capture. Genome Res. 22, 939–946 (2012). [DOI] [PMC free article] [PubMed] [Google Scholar]
- 30.Cremer M et al. Multicolor 3D Fluorescence In Situ Hybridization for Imaging Interphase Chromosomes in The Nucleus (ed. Hancock R) vol. 463 205–239 (Humana Press, 2012). [DOI] [PubMed] [Google Scholar]
- 31.Henegariu O, Bray-Ward P & Ward DC Custom fluorescent-nucleotide synthesis as an alternative method for nucleic acid labeling. Nat. Biotechnol 18, 345–348 (2000). [DOI] [PubMed] [Google Scholar]
- 32.Markaki Y, Smeets D, Cremer M & Schermelleh L Fluorescence in situ hybridization applications for super-resolution 3D structured illumination microscopy. Methods Mol. Biol. Clifton NJ 950, 43–64 (2013). [DOI] [PubMed] [Google Scholar]
- 33.Kraus F et al. Quantitative 3D structured illumination microscopy of nuclear structures. Nat. Protoc 12, 1011–1028 (2017). [DOI] [PubMed] [Google Scholar]
- 34.Beard C, Hochedlinger K, Plath K, Wutz A & Jaenisch R Efficient method to generate single-copy transgenic mice by site-specific integration in embryonic stem cells. Genes. N. Y. N 2000 44, 23–28 (2006). [DOI] [PubMed] [Google Scholar]
- 35.Sado T, Wang Z, Sasaki H & Li E Regulation of imprinted X-chromosome inactivation in mice by Tsix. Dev. Camb. Engl 128, 1275–1286 (2001). [DOI] [PubMed] [Google Scholar]
- 36.Pandya-Jones A & Black DL Co-transcriptional splicing of constitutive and alternative exons. RNA N. Y. N 15, 1896–1908 (2009). [DOI] [PMC free article] [PubMed] [Google Scholar]
- 37.Lin Y, Protter DSW, Rosen MK & Parker R Formation and Maturation of Phase-Separated Liquid Droplets by RNA-Binding Proteins. Mol. Cell 60, 208–219 (2015). [DOI] [PMC free article] [PubMed] [Google Scholar]
- 38.Davidovich C, Zheng L, Goodrich KJ & Cech TR Promiscuous RNA binding by Polycomb repressive complex 2. Nat. Struct. Mol. Biol 20, 1250–1257 (2013). [DOI] [PMC free article] [PubMed] [Google Scholar]
- 39.Vuong JK et al. PTBP1 and PTBP2 Serve Both Specific and Redundant Functions in Neuronal Pre-mRNA Splicing. Cell Rep. 17, 2766–2775 (2016). [DOI] [PMC free article] [PubMed] [Google Scholar]
- 40.Rogelj B et al. Widespread binding of FUS along nascent RNA regulates alternative splicing in the brain. Sci. Rep 2, 603 (2012). [DOI] [PMC free article] [PubMed] [Google Scholar]
- 41.Damianov A et al. Rbfox Proteins Regulate Splicing as Part of a Large Multiprotein Complex LASR. Cell 165, 606–619 (2016). [DOI] [PMC free article] [PubMed] [Google Scholar]
- 42.Van Nostrand EL et al. Robust transcriptome-wide discovery of RNA-binding protein binding sites with enhanced CLIP (eCLIP). Nat. Methods 13, 508–514 (2016). [DOI] [PMC free article] [PubMed] [Google Scholar]
- 43.Langmead B, Trapnell C, Pop M & Salzberg SL Ultrafast and memory-efficient alignment of short DNA sequences to the human genome. Genome Biol. 10, R25 (2009). [DOI] [PMC free article] [PubMed] [Google Scholar]
- 44.Trapnell C, Pachter L & Salzberg SL TopHat: discovering splice junctions with RNA-Seq. Bioinforma. Oxf. Engl 25, 1105–1111 (2009). [DOI] [PMC free article] [PubMed] [Google Scholar]
- 45.Yeo G. CLIPper. A tool to define peaks in your CLIP-seq dataset.
- 46.Chronis C et al. Cooperative Binding of Transcription Factors Orchestrates Reprogramming. Cell 168, 442–459.e20 (2017). [DOI] [PMC free article] [PubMed] [Google Scholar]
- 47.Wutz A, Rasmussen TP & Jaenisch R Chromosomal silencing and localization are mediated by different domains of Xist RNA. Nat. Genet 30, 167–174 (2002). [DOI] [PubMed] [Google Scholar]
- 48.Demmerle J et al. Strategic and practical guidelines for successful structured illumination microscopy. Nat. Protoc 12, 988–1010 (2017). [DOI] [PubMed] [Google Scholar]
- 49.Schindelin J et al. Fiji: an open-source platform for biological-image analysis. Nat. Methods 9, 676–682 (2012). [DOI] [PMC free article] [PubMed] [Google Scholar]
- 50.Schneider CA, Rasband WS & Eliceiri KW NIH Image to ImageJ: 25 years of image analysis. Nat. Methods 9, 671–675 (2012). [DOI] [PMC free article] [PubMed] [Google Scholar]
- 51.Karperian AA, FracLac for ImageJ. (1999).
- 52.Ollion J, Cochennec J, Loll F, Escudé C & Boudier T TANGO: a generic tool for high-throughput 3D image analysis for studying nuclear organization. Bioinformatics 29, 1840–1841 (2013). [DOI] [PMC free article] [PubMed] [Google Scholar]
Associated Data
This section collects any data citations, data availability statements, or supplementary materials included in this article.