Abstract
Despite its size and rigidity, the nucleus is moved or reorganized by cytoskeletal filaments under various conditions1–11. Moreover, while chromatin organize into non-random domains12, extensive heterogeneity at the single-cell level13 means that precisely how and why nuclei reorganize remains an area of intense investigation. Here, we developed convolutional neural network (CNN)-based automated cell classification and analysis pipelines which revealed the extent to which human cytomegalovirus (HCMV) generates nuclear polarity through a virus-assembled microtubule-organizing center (MTOC). Tubulin acetylation enables microtubules emanating from this MTOC to rotate the nucleus via cytoplasmically exposed dynein-binding domains in the outer nuclear membrane protein, Nesprin-2G, which polarizes the inner nuclear membrane protein, SUN1. This in turn creates intranuclear polarity in Emerin to control nuclear actin filaments that spatially segregate viral DNA from inactive histones and host DNA, maximizing virus replication. Our findings uncover the extent to which viruses can control the nucleus from the cytoplasm.
Keywords: nuclear rotation, polarization, microtubules, nuclear actin, LINC complex, cytomegalovirus, convolutional neural networks
Main
Early in HCMV’s protracted replication cycle the Golgi is remodeled into a virion maturation site called the Assembly Compartment (AC), which also serves as an MTOC that generates acetylated microtubules by co-opting the host protein, EB311. HCMV also induces nuclear rotation, which ceases prior to the appearance of mature virions in the cytosol11 (Fig. 1a and Extended Data Fig. 1a-b). Tubulin acetylation imparts mechanical strength to microtubules14, but whether it is required for nuclear rotation and why rotation occurs during infection remains unknown.
Fig. 1: Tubulin acetylation facilitates nuclear rotation and SUN1 polarization.
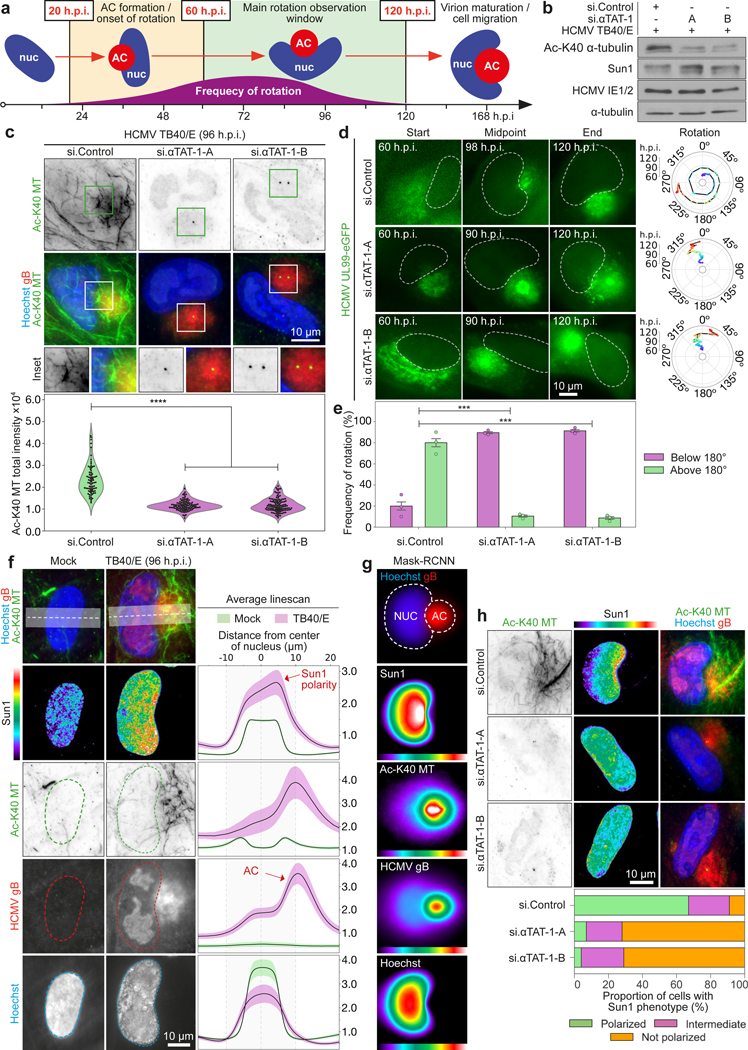
a, illustration of the HCMV AC (red) and nuclear (blue) rotation phase, highlighting primary imaging windows. b-c, Western blot and immunofluorescence showing αTAT1 depletion suppresses microtubule acetylation. Fluorescence intensity of acetylated microtubules was quantified; n = 303 cells total, ****p≤0.0001, two-tailed student’s t-test. All data points are shown within violin plots. Similar results yielded from 3 independent experiments. d-e, αTAT1 depletion suppresses nuclear rotation. Representative stills from Video 1 and rotational analyses are shown. Rotation frequency above or below 180° is shown in e; bars represent mean ± SEM; n = 309 cells total,***p≤0.001, two-tailed student’s t-test. f-g, Spatial distribution and intensity of DNA (hoescht), AC marker (gB), acetylated microtubules (Ac-K40-MT) and SUN1 using CNN (g) or DNA, gB and SUN1 using MASK-RCNN (h) analyses. Lines represent mean ± SEM; n = 34,712 cells total in dataset from 3 independent biological replicates for f; n = 2,214 cells total for g. h, αTAT1 depletion suppresses SUN1 polarization. For quantification, SUN1 was classed as polarized (green), intermediate (pink) or non-polarized (orange). n = 583 cells total. Similar results yielded from 3 independent experiments.
RNAi-mediated depletion of the α-tubulin acetyltransferase, αTAT115 blocked acetylated microtubule formation (Fig. 1b-c) and nuclear rotation (Fig. 1d-e and Supplementary Video 1) in primary normal human dermal fibroblasts (NHDFs) infected with clinical HCMV strain, TB40/E. Expression of wildtype or non-acetylatable K40R mutant forms of tubulin15 confirmed the need for tubulin acetylation to rotate nuclei and excluded other, as-yet unknown αTAT1 substrates (Extended Data Fig. 1c-f and Supplementary Video 2). Acetylation is the only detectable microtubule modification in HCMV-infected NHDFs11, supporting its specific importance for nuclear rotation.
Microtubules and actin filaments move nuclei through interactions with linker of nucleoskeleton and cytoskeleton (LINC) complexes1,16. LINC complexes consist of outer-nuclear membrane Nesprin proteins coupled to inner-membrane SUN trimers. When associated with microtubule motors, Nesprin-2G binds SUN1 trimers and moves nuclei forward16. When associated with actin motors, Nesprin-2G binds SUN2 trimers and moves nuclei backward16. LINC activities enable nuclear positioning, distinct from rotation, in various contexts1. Beyond reported changes in SUN protein abundance17, whether LINC complexes function during HCMV infection remains unknown. We developed a CNN-based automated cell classification and analysis pipeline and measured the abundance and spatial organization of SUN proteins across thousands of individual cells (Extended Data Fig. 1g). While SUN2 decreased in intensity in infected cells, SUN1 moderately increased in abundance and robustly polarized towards the nuclear region adjacent to the AC (Fig. 1f-g, Extended Data Figs. 1h-i and 2, and Supplementary Video 3). αTAT1 depletion did not affect SUN1 abundance but suppressed its polarization by HCMV (Fig. 1b, 1h). This suggests that nuclear rotation is symptomatic of forces exerted by acetylated microtubules pulling on LINC complexes.
SUN1 depletion or expression of a SUN1 mutant that does not engage Nesprin-2G demonstrated that LINC complexes were required for HCMV-induced nuclear rotation (Fig. 2a-c, Extended Data Fig. 3a-b and Supplementary Video 4). When the adaptive domain (AD) of Nesprin-2G interacts with microtubule motors it engages SUN1, while SUN2 interactions occur when the Nesprin-2G calponin homology (CH) domain engages transmembrane actin-associated nuclear (TAN) lines1,5,16 (Extended Data Fig. 3c). To test these cytoskeletal connections we infected NHDFs expressing GFP-tagged synthetic Nesprin-2G isoforms16 (Extended Data Fig. 3d). Nesprin-2G isoforms harboring an actin-binding CH domain resulted in a dominant-negative block to nuclear rotation (Fig. 2d-e and Supplementary Video 5). Adding the AD restored some degree of rotation, while removal of the CH domain leaving only the AD further increased rotation frequency. This suggests that LINC interactions with actin impair nuclear rotation and may explain SUN2 downregulation during HCMV infection. Mutating the kinesin-binding LEWD motif in the AD restored rotation frequencies to normal levels (Fig. 2d-e and Supplementary Video 5) suggesting that dynein mediates nuclear rotation. We tested this by targeting the dynein adaptor, BICD2, which functions in nuclear positioning1,18. BICD2 depletion or expression of a BICD2 dominant negative blocked nuclear rotation and SUN1 polarization (Extended Data Fig. 3e-k and Supplementary Video 6).
Fig. 2: SUN1:Nesprin-2G complexes control nuclear rotation through dynein interactions.
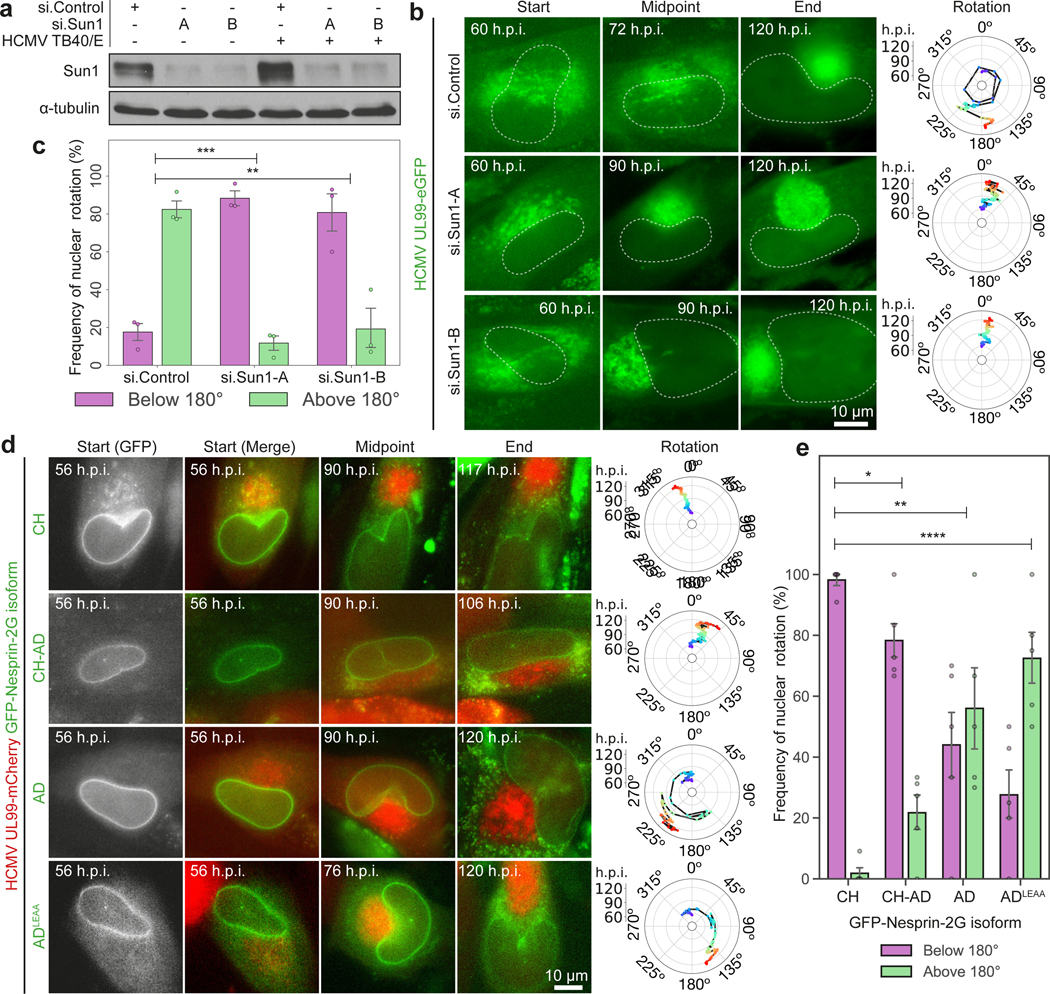
a-c, SUN1 depletion suppresses nuclear rotation. Representative stills from Video 3 and rotational analyses are shown. Western blot is representative of 3 independent experiments. Rotation frequency above or below 180° is shown in c; n = 162 cells total from 3 independent biological replicates, ***p≤0.001. d-e, Effects of Nesprin-2G constructs on nuclear rotation. Representative stills and rotation analyses from Video 4 are in f. Frequency of rotations above or below 180° are in g; bars represent mean ± SEM, n = 127 cells total from 5 independent biological replicates, **p≤0.01, ***p≤0.001, ****p≤0.0001, two-tailed student’s t-test.
To test effects on intranuclear architecture we examined SUN1-associated inner nuclear-membrane proteins, Lamin A/C or Emerin. CNN-based imaging analyses revealed that while Lamin A/C levels declined and lacked polarity, Emerin polarized toward the nuclear region enriched in SUN1 (Fig. 3a and Extended Data Fig. 4a). Although Emerin facilitates HCMV egress19 it polarized much earlier in infection, over the nuclear rotation timeframe (Fig. 3b). Emerin binds histone modifiers but also stabilizes actin filaments in vitro20,21. However, the importance of filamentous (F)-actin in the nucleus has only recently become recognized. Transient nuclear F-actin forms during serum stimulation22, T-cell activation10, cell spreading23, mitosis2 and DNA damage responses6, yet persistent F-actin inhibits RNA polymerase II24. Nuclear F-actin also forms in herpesvirus-infected cells but its regulation and function(s) remain poorly understood25–29. Expressing a nuclear actin chromobody2,22, thick actin filaments became detectable ∼15–20 hours post-infection (h.p.i.) and subsequently organized into extensive networks (Fig. 3b-c and Supplementary Video 7-8). F-actin disappeared at later timepoints, suggesting that it might function predominantly during the nuclear rotation phase of infection to establish polarity. Depleting αTAT1, BICD2, SUN1 or Emerin, or expression of actin-binding mutants of Emerin resulted in reduced levels and disorganization of nuclear F-actin (Fig. 3d and Extended Data Fig. 4b-e). Nuclear rotation was not affected by Emerin mutants (Extended Data Fig. 4f), demonstrating that F-actin does not cause nuclear rotation but instead, F-actin is organized by microtubule-derived forces that polarize LINC complexes.
Fig. 3: Emerin polarization and regulation of nuclear F-actin.
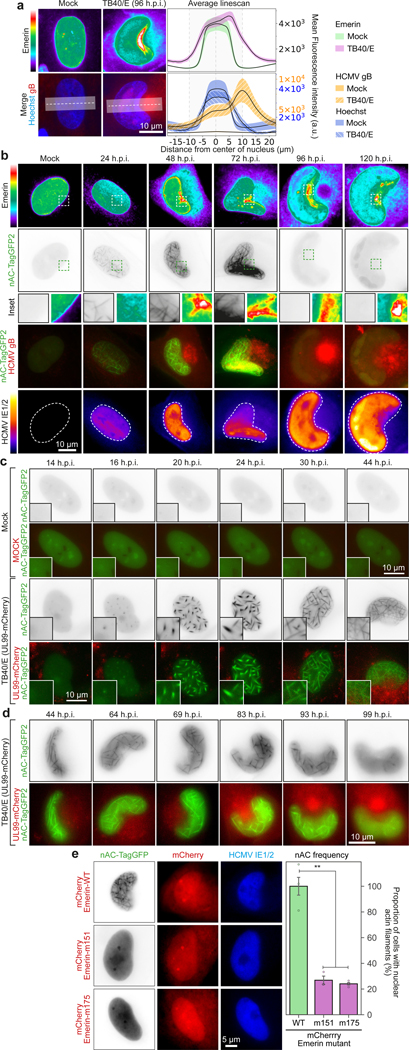
a, Emerin is polarized in HCMV-infected cells. Lines represent mean ± SEM; n= 19,428 cells total from 3 independent biological replicates. b, Onset of Emerin polarization and formation of nuclear F-actin is detectable by 24h, as nuclear rotation begins. Emerin polarity is established over the nuclear rotation period and is sustained, while F-actin dissipates after the rotation phase. c-d, Stills from Videos 7-8 showing nuclear F-actin formation during mock or HCMV (TB40/E-UL99-mCherry) infection of NHDFs expressing nuclear actin chromobody (nAC-TagGFP). Early and late stages of infection are shown in c and d, respectively. e, Expression of actin-binding mutants (m151, m175) of Emerin impairs nuclear F-actin formation. Representative images and quantification of nuclear F-actin (nAC) frequency are shown for each condition; bars represent mean ± SEM, n = 1,230 cells total, **p≤0.01, two-tailed student’s t-test. All data shown is representative of 3 independent biological replicates.
F-actin moves DNA break-repair sites to the nuclear periphery6,7. HCMV prevents the localization of break-repair factors to viral replication compartments30, but the mechanism remains unknown. Imaging showed that γH2AX foci formed early in infection and localized near F-actin, but subsequently polarized toward the AC (Extended Data Fig. 5a). The DNA damaging agent, etoposide induced similarly thick nuclear F-actin in uninfected cells but these networks did not remodel and nuclei did not rotate (Extended Data Fig. 5b-c and Video 9), suggesting that beyond inducing DNA damage responses HCMV might exploit nuclear F-actin to more broadly remodel the nucleus. In line with this, histone H3K9me3 staining also increased early in infection (Extended Data Fig. 5d). CNN-based analysis of histone H3 modifications revealed that at later stages of rotation a gradient of inactive, but not total or active forms of histone H3 was established, with the most inactive trimethylated H3K9me3 polarizing most robustly toward the AC (Fig. 4a, Extended Data Fig. 5e and Supplementary Video 10). Histone H3K9me3 foci localized to F-actin and inhibition of the actin nucleator, Arp2/36,7 blocked H3K9me3 polarization (Extended Data Fig. 5f).
Fig. 4: Microtubules and F-actin regulate intranuclear polarization by HCMV.
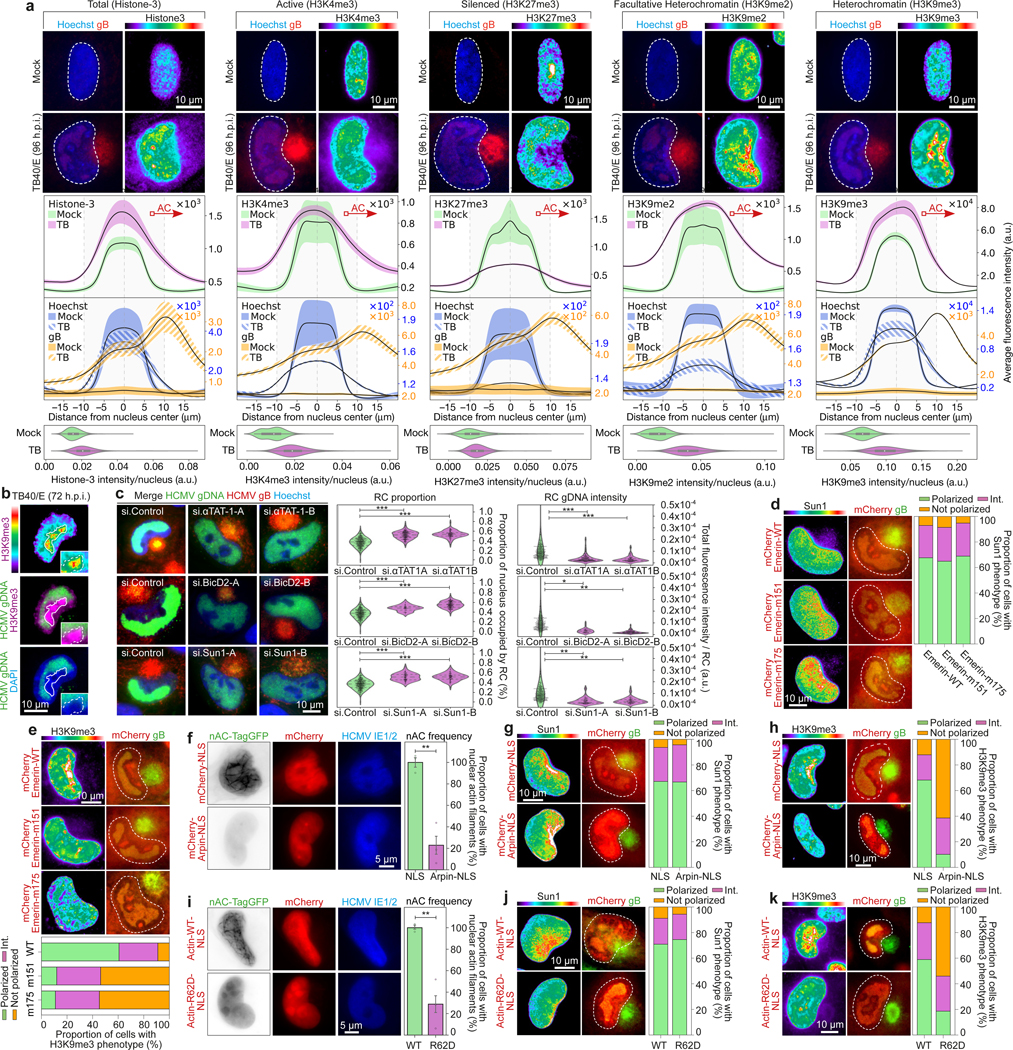
a, Distribution of histone H3 forms in HCMV-infected cells. Lines represent mean ± SEM; Total H3 (n = 13,774 cells total), H3K4me3 (n = 31,886 cells total), H3K27me3 (n = 30,874 cells total), H3K9me2 (n = 34,342 cells total), H3K9me3 (n = 13,790 cells total). Violin plots represent median (white point), interquartile range (IQR, box), and maximum/minimum values 1.5 x IQR outside the IQR (whiskers). b, Representative image of viral genomic DNA (gDNA) and H3K9me3 foci. White line delineates the peak of H3K9me3 foci in overlay images. c, Depletion of αTAT1, BICD2 or SUN1 reduces the polarity and abundance of viral gDNA. Fluorescence as a function of nuclear area was used to measure the extent of gDNA polarity, and mean fluorescence intensity was used to measure gDNA levels; All data points are shown within violin plots, n = 840 cells total, *p≤0.05, **p≤0.01, ***p≤0.001, two-tailed student’s t-test. d-e, Actin-binding mutants of Emerin inhibit H3K9me3 polarization without affecting SUN1 polarization. d, Representative images are shown. e, Quantification of H3K9me3 (n = 220 cells total) and SUN1 (n = 300 cells total) polarity, categorized as polarized, intermediate (int.) or not polarized. f, Nuclear-localized Arpin inhibits nuclear F-actin formation (bars represent mean ± SEM, n = 1,237 cells total from 3 independent biological replicates; **p≤0.01, two-tailed student’s t-test). g-h, Nuclear-localized Arpin inhibits H3K9me3 (n = 368 cells total) but not SUN1 (n = 236 cells total) polarization. i, Expression of nuclear-localized polymerization-deficient actin inhibits nuclear F-actin formation (bars represent mean ± SEM, n = 1,157 cells total from 3 independent biological replicates; **p≤0.01, two-tailed student’s t-test). j-k, Nuclear-localized polymerization-deficient actin inhibits H3K9me3 (n = 234 cells total) but not SUN1 (n = 185 cells total) polarization. All data representative of 3 independent biological replicates.
We next examined the spatial organization of viral DNA relative to histone H3K9me3 foci using DNA-immunoFluorescence In-Situ Hybridization (DNA-immunoFISH). While H3K9me3 heterochromatin polarized toward the AC, viral DNA positioned on the opposing side of the nucleus (Fig. 4b and Extended Data Fig. 6a-b). Direct stochastic optical reconstruction microscopy (d-STORM) imaging of Edu-labeled samples further revealed that unlike viral DNA, host DNA concentrated toward the AC (Extended Data Fig. 7). These findings revealed that HCMV caused extensive structural and genetic polarization within the nucleus.
Testing the underlying mechanistic connections between these events, depletion of αTAT1, BICD2 or SUN1 reduced the polarization and abundance of viral DNA (Fig. 4c), and reduced H3K9me3 polarization (Extended Data Fig. 8a). H3K9me3 polarization was also suppressed by expression of BICD2 or SUN1 dominant-negatives (Extended Data Fig. 8b). Emerin depletion or Emerin mutants defective in actin binding also impaired H3K9me3 polarization, without affecting SUN1 relocalization (Fig. 4d-e and Extended Data Fig. 8c). Similar effects were observed in cells expressing nuclear-localized Arpin, a dominant-negative of Arp2/3, or nuclear-localized polymerization-defective actin (Fig. 4f-k). This established that while nuclear F-actin does not influence nuclear rotation, its regulation by Emerin controls intranuclear polarization. Finally, targeting components of this pathway did not impair viral gene expression but resulted in reduced segregation of viral DNA, reduced viral DNA accumulation, and reduced virus replication (Fig. 4c and Extended Data Fig. 9).
Given that viruses prevent chromatinization of their DNA to replicate, we propose a model whereby HCMV exploits acetylated microtubules to polarize nuclear membrane proteins, thereby drawing inactive histones and associated host DNA toward the AC, segregating them from viral DNA to create an optimal environment for virus replication (Extended Data Figure 10). Beyond infection, these findings uncover roles for acetylated microtubules, LINC complexes and Emerin in regulating nuclear F-actin and creating intranuclear polarity.
Methods
Cell culture, viruses and generation of stable cell lines.
All cells used in this study were cultured in Dulbecco’s Modified Eagle’s Medium (DMEM; Fisher Scientific) supplemented 2 mM L-glutamine, penicillin/streptomycin and 5% Fetal Bovine Serum (FBS) and incubated at 37°C and 5% CO2. Single donor primary normal human dermal fibroblasts (NHDFs) were isolated from human male neonatal foreskin (Lonza: CC-2509). NHDFs are characterized and certified free of mycoplasma and microbial pathogens by the supplier. RetroPack™ PT67 packaging cells were obtained from Clontech (631510). HEK293T cells used to generate lentiviral vectors were obtained from Ian Mohr, NYU School of Medicine. All cells used in this study were certified free of mycoplasma by staining with Hoescht.
HCMV strain TB40/E, and TB40/E UL99-eGFP were grown on NHDFs and titrated as described previously11. HCMV TB40/E expressing UL99-mCherry was generated using BAC recombineering as described for UL99-eGFP11, except using the mCherry open reading frame as template for PCR. For imaging and western blotting approaches, cells were infected at a multiplicity of infection (MOI) 1, unless indicated otherwise, for the duration indicated in the figure legends. Details of infections and image analysis for low MOI spreading assays are provided below.
Retroviral constructs encoding synthetic GFP-Nesprin-2G isoforms were obtained from Greg Gundersen (Columbia University), and were described previously16. To generate retrovirus transduction vectors, Nesprin-2G plasmids were transfected into RetroPack™ PT67 packaging cells using Lipofectamine 3000 (L3000008, ThermoFisher Scientific) following the manufacturers protocols. Four hours after transfection cultures were washed in phosphate buffered saline (PBS) and incubated in fresh growth medium. Medium was replaced again after 24 h. Viral supernatants were collected at 48 h and 72 h post-transfection and filtered through 0.45μm filters. To generate pools of NHDFs stably expressing GFP-Nesprin-2G constructs, sub-confluent NHDFs were transduced with viral vectors in the presence of polybrene (Santa Cruz: 134220), washed with PBS four hours after transduction and then cultured in normal growth medium. 24 h later, cultures were selected with puromycin to generate stable pools.
The viral vector encoding a nuclear actin chromobody (actin targeting nanobody tagged with TagGFP2 and a nuclear localization signal; Chromotek: acg-n) was generated by cloning the chromobody sequence into the pWPXL lentiviral vector (Addgene: #12257) using nAC-for (5’-CGCACCGGTGGATCCGCCACCATGGCTCAGGTGCAGCTGGTGG-3’) and nAC-rev (5’-CCGGAATTCACTAGTTTATTACACCTTCCGCTTTTTCTT-3’) primers to generate pWPXL-TagGFP2-nAC, as previously described2. Similarly, the viral vector encoding a histone chromobody (Histone H2A-H2B heterodimer targeting nanobody tagged with eGFP; Chromotek: tcg) was generated by cloning the chromobody sequence into pWPXL using the following primers:
Histone-Chromobody-for (5’-TATCCTCGAGTACGCGTGCCACCATGGCCCAGGTGCAGCTG-3’)
Histone-Chromobody-rev (5’- TTTCCCGGGAATTCTTATTACTTGTACAGCTCGTCCATGCC--3’).
To generate TagGFP2-tagged dominant negative Sun1 and BicD2 constructs (and relevant controls), a pWPXL-TagGFP2-LINK-MCS vector was first generated by cloning TagGFP2 (using pWPXL-TagGFP2-nAC as template) into pWPXL using the following primers:
TagGFP2-LINK-MCS-for (5’-CCTCGAGGGATCCGCCACCATGAGCGGGGGCGAGGAGCTGTTCGCC-3’), TagGFP2-LINK-MCS-rev (5’-TTTCCCGGGAATTCGAACTCGCCAGAACCAGCAGCGGAGCCAGCGGACCCCCTGTACAGCTCGTCCATGCCGTGGG-3’).
This construct was used as a TagGFP2 (only) control vector as TagGFP2 was cloned in-frame with a TGATAA (2xSTOP) sequence immediately downstream of the insertion site in pWPXL. Then, using SUN1-Isoform-9 (pEGFP-SUN1_916 plasmid; Addgene: #125850) as template, the Sun1-FL and Sun1-ΔLU was cloned into pWPXL-TagGFP2-LINK-MCS using the following primers:
SUN1-FL-for (5’-TATTTCGAATTCGATTTTTCTCGGCTTCACATG-3’)
SUN1-FL-rev (5’-TTTCATATGACTAGTTTATTACTTGACAGGTTCGCCATGAAC-3’) SUN1-ΔLU-rev (5’-TTTCATATGACTAGTTTATTAGACCGAAGCTGACGGCCCGGC-3’)
The truncation made is analogous to the previously described mutant31.
Next, using human BICD2 (p7053 pHAGE-P-CMVt-N-HA-GAW-BICD2 plasmid, Addgene: #100143) as template, BicD2-NT was cloned into pWPXL-TagGFP2-LINK-MCS using the following primers:
BICD2-for (5’-TATTTCGAATTCTCGGCGCCGTCGGAGGAGGAGG-3’)
BICD2-NT-rev (5’-TTTCATATGACTAGTTTATTAGAAGGAGTCATTGATGCTCATGTAG-3’).
To generate mCherry-tagged dominant negative constructs (and relevant controls), a pWPXL-mCherry-LINK-MCS vector was generated by cloning the mCherry sequence (from the pmCherry-C1 actin-3XNLS P2A mCherry plasmid described below) into pWPXL using the following primers:
mCherry-LINK-MCS-for (5’-TATCCTCGAGGGATCCGCCACCATGGTGAGCAAGGGCGAGGAG-3’) and mCherry-LINK-MCS-rev (5’-TTTCCCGGGAATTCGAACTCGCCAGAACCAGCAGCGGAGCCAGCGGACCCCTTGTACAGCTCGTCCATGCC-3’).
Additionally, a mCherry-NLS (only) control was generated using the following primer: mCherry-NLS-STOP-rev (5’-TTTCCCGGGAATTCTTATTACACCTTCCGCTTTTTCTTAGGCGGCCCCTTGTACAGCTCGTCCATGCC-3’).
eGFP-arpin was obtained from the laboratory of Robert Grosse32 and used as a template to clone arpin-NLS into pWPXL-mCherry-LINK-MCS using arpin-NLS-for (5’-TATTTCGAATTCAGCCGCATCTACCACGACGGC-3’) and arpin-NLS-rev (5’-TTTCATATGACTAGTTTATTACACCTTCCGCTTTTTCTTAGGCGGCCCGTCATCCCACTCCTCGTCCTC-3’) primers.
Template sequences for Emerin-WT, Emerin-m151 and Emerin-m175, were obtained from the laboratory of James Holaska21 and cloned into pWPXL-mCherry-LINK-MCS using Emerin-for (5’-TATTTCGAATTCCCGGGGACAACTACGCAGATCTTTCG-3’) and Emerin-rev:
(5’-TTTCATATGACTAGTTTATTAGAAGGGGTTGCCTTCTTCAGC-3’) primers. Nucleus-targeted actin-WT and R62D dominant negative viral vector constructs were generated by cloning previously described constructs (pmCherry-C1 actin-3XNLS P2A mCherry plasmid, Addgene: #58475 and pmCherry-C1 R62D actin-3XNLS P2A mCherry plasmid, Addgene: #58477) 33 into pWPXL using actin-NLS-P2A-mCherry-for (5’-TATGCTCGAGCACGCGTGCCACCATGGATGATGATATCGCCGCG-3’) and actin-NLS-P2A-mCherry-NLS-rev (5’-TTTCATATGACTAGTTTATTACACCTTCCGCTTTTTCTTAGGCGGCCCCTTGTACAGCTCGTCCATGCC-3’) primers.
Retroviral vectors were generated by triple transfecting HEK293T cells with pWPXL-nuclear actin chromobody, psPAX2 (Addgene: #12260) and pVSV-G (Addgene: #8454) as described above. Transgene expression was readily detectable after 24 h and maintained as a pool of stably expressing cells for at most 5 passages.
RNA interference and inhibitor treatments.
The siRNAs used in this study were obtained from ThermoFisher Scientific; control non-targeting (si.CTRL; Cat#: AM4635), si.αTAT1-B (Cat#: AM16708A, ID: 130789), si.αTAT1-E (Cat#: 4392420, ID: s36739), si.SUN1-A (Cat#: AM16708A, ID: 222696), si.SUN1-B (Cat#: AM16708A, ID: 241855), si.BICD2-A (Cat#: AM16708, ID: 136849), si.BICD2-B (Cat#: AM16708, ID: 22845), si.Emerin-A (Cat#: AM4392420, ID: s4645), si.Emerin-B (Cat#: AM4392420, ID: s225840). Confluent NHDFs were transfected with 150 pmol/ml siRNAs using Lipofectamine siRNA max (Invitrogen), following the manufacturers protocols and scaled appropriately for the surface area of the dish used. For experiments involving infections, NHDFs were infected for 12 h to establish infection prior to siRNA treatment, as described previously11. For experiments involving the Arp2/3 inhibitor CK-666 (100 μM; Sigma Aldrich: SML0006) or the inactive control CK-689 (100 μM; Sigma Aldrich: 182517), mock- or HCMV TB40/E-infected cells were treated with inhibitors or an equivalent volume of DMSO solvent control from 4 h.p.i. Inhibitors were replenished in fresh culture media every 48 h for imaging, or at 6 days post infection for HCMV plaque spreading assays.
Immunoblotting.
To prepare whole cell lysates, cultures were lysed in laemmli buffer (62.5 mM Tris-HCl pH 6.8, 10% (v/v) glycerol, 2% (w/v) SDS, 0.7 M β-mercaptoethanol) and boiled for 3 min. Samples were then resolved via Tris-glycine SDS-PAGE (10% polyacrylamide), transferred to a nitrocellulose membrane (GE Healthcare Life Sciences), washed three times using tris-buffered saline (TBS) with 0.1% (v/v) Tween 20 (TBS-T) and blocked in TBS-T containing 5% (w/v) non-fat milk. Membranes were then rinsed and incubated overnight with primary antibodies diluted in TBS-T containing 3% (w/v) bovine serum albumin (BSA) at 4°C. Membranes were rinsed and then washed three times in TBS-T for 5 min, followed by incubation with the appropriate horseradish peroxidase (HRP) conjugated secondary antibody (GE Healthcare Life Sciences) diluted in TBS-T with 5% (w/v) non-fat milk for 1 h at room temperature. Membranes were then rinsed and washed three times in TBS-T for 5 min, then visualized using ECL detection substrate and x-ray film (Thermo Fisher Scientific). Primary antibodies used for immunoblotting were: Ac-K40 tubulin (Sigma-Aldrich: T6793); α-tubulin (Sigma-Aldrich: T6199); HCMV IE1/2 (Abcam: ab53495); SUN1 (Novus Biologicals: NBP1–87396); BICD2 (Thermo Fisher Scientific : MA5–23522); Emerin (Proteintech: 10351–1-AP); HSP90 (Cell signalling: 4877s); pp28 (Laboratory of Thomas Shenk, Princeton) pp65 (Laboratory of Thomas Shenk, Princeton); UL44(Virusys: CA006).
Immunofluorescence microscopy.
NHDFs grown on #1.5 glass coverslips were treated as described and fixed in ice cold methanol on ice for 7 min. For experiments using nuclear actin chromobody expressing cells, a 20 min fixation using 4% (w/v) paraformaldehyde in PBS (Affymetrix) followed by permeabilization in 0.1% Triton-X 100 in PBS for 15 min was used in place of methanol fixation. Cells were blocked using PBS with 10% (v/v) human serum (Sigma Aldrich: P2918) and 0.25% (w/v) saponin for 1 h at 37°C, then incubated with the indicated primary antibodies overnight at 4°C. The next day, samples were washed three times in PBS with 0.025% (w/v) saponin for 5 min, followed by incubation with the appropriate Alexa Fluor-conjugated secondary antibodies (Thermo Fisher Scientific) in the dark at room temperature for 1 h. All antibodies were diluted using 0.025 % (w/v) saponin in PBS 10% (v/v) human serum. Where shown, samples were then stained with 0.001% (v/v) hoechst 33342 (Thermo Fisher Scientific: 62249) diluted in wash buffer. Before mounting, coverslips were washed three times in wash buffer, fully immersed in deionized water and mounted using FluroSave reagent (Calbiochem: 345789). Unless indicated otherwise, all fixed and live-cell microscopy was performed using a Leica DMI6000B-AFC wide-field epi-fluorescence microscope using a 100x (1.44NA) oil immersion objective, Orca-Flash-4.0 CMOS camera (Hamamatsu), X-Cite XLED1 illumination and Metamorph control software (Molecular Devices). To determined 3D distribution of SUN1, 0.2 μm z-slices were acquired through the entire volume of infected NHDFs using a Leica DMI 6000B motorized spinning-disc confocal microscope, with Yokogawa CSU-X1 A1 confocal head and MetaMorph control software. Deconvolution was performed on these z-stacks using the nearest neighbors deconvolution package of MetaMorph and default settings for each fluorophore. All image data in this study was acquired using Metamorph, then compiled and analyzed using the Fiji distribution of ImageJ (1.52e, http://fiji.sc). Images within the same dataset were always processed equivalently, unless where indicated to provide clarity of interpretation.
Primary antibodies used for immunofluorescence were: HCMV glycoprotein B (gB; USBiological: C9100–21N); SUN1 (Novus Biologicals: NBP1–87396); SUN2 (Thermo Fisher Scientific: PA5–51539); HCMV IE1/2 (Abcam: ab53495); Emerin (Proteintech: 10351–1-AP); Lamin A/C (Santacruz: sc-7292); γH2AX (phospho S139; Abcam: ab11174); H3K9me3 (Abcam: ab8898); Histone 3 (Abcam: ab195277); Ac-K40 tubulin (Sigma: T6793); mCherry/RFP[5F8] (Chromotek: 60706002AB); H3K9me2 (Cell Signalling: 4658); H3K27me3 (Cell Signalling: 9733); H3K4me3 (Cell Signalling: 9751)
Quantification of Ac-K40 MTs was performed using ImageJ to extract >100 regions of interest (ROIs; 500×500 pixels) surrounding HCMV ACs stained with gB. These ROI images were then analyzed using a CellProfiler pipeline (code available on GitHub through links provided below) to quantify the total amount of Ac-K40 MT staining intensity, plotted using the seaborn and matplotlib python packages (code available on GitHub through links provided below). The effect of RNAi treatment or dominant-negative expression on SUN1/H3K9me3 polarization was determined by manually categorizing the degree of SUN1 polarization as either polarized, indeterminate, or not polarized. Quantification of nuclear actin filaments was performed by manually categorizing nAC expressing cells with positive HCMV IE1/2 staining as either containing nuclear actin filaments or not, then normalizing to the frequency determined for the positive control in each experiment.
Chromatin super-resolution microscopy.
The Alexa-647 Click-iT™ Plus EdU Cell Proliferation Kit (Thermo Fisher Scientific: C10640) was used to image host chromatin structure. Briefly, NHDFs were cultured in cell culture media containing 10 μM EdU for 24 h; the time at which labelling was performed is indicated in the relevant figure legends. Click-iT reactions to detect Alexa-647-labeled DNA were performed following manufacturers protocols. Then, direct stochastic optical reconstruction microscopy (dSTORM) was used to collect super-resolution images of chromatin structure, as previously described34. Super-resolution microscopy was performed using a Leica DMi8 S module Infinity TIRF microscope with Leica DFC9000 sCMOS camera using a 100x oil immersion objective, and LAS X control software (Leica Microsystems, Leica Application Suite X version 3.4.2.18368). Imaging was performed in OxEA buffer (12% Sodium DL-lactate solution (Sigma-Aldrich: L1375) with 50 mM cysteamine (Millipore-Sigma: 30070) and 1:100 dilution of OxyFluor (Sigma-Aldrich: SAE0059)) and data was processed using the Thunderstorm (1.3–2014-11–08) plugin for Image-J35.
HCMV spreading assay and titering.
To determine the effects of RNAi or Arp2/3 inhibition treatments on HCMV spread through cell monolayers, confluent NHDFs were infected with HCMV TB40/E at MOI 0.001, treated as described and imaged for GFP-positive virus plaques at 12 days post infection using a 10x dry objective and the Leica DMI600B microscope described above. The area occupied by individual plaques was determined using a CellProfiler pipeline and plotted using the matplotlib python package (code available on GitHub through links provided below). Where plaques were very small, CellProfiler detection parameters were modified for accurate detection (code available on GitHub through links provided below). For single-cycle infection assays, titers were determined by serial dilution of supernatants collected at 144 h.p.i. from siRNA-treated cells and viral plaques were enumerated (total number of viral plaques per well of a 12-well tissue culture dish, averaged over four wells). For inhibitors treatments, NHDFs were infected and then treated with DMEM containing inhibitors at 4 h.p.i., which was replaced every 48 h until 120 h.p.i, and DMEM without inhibitors was replaced prior to supernatant collection at 144h.p.i. for titering.
Combined immunofluorescence fluorescent in situ hybridization (Immuno-FISH).
To detect HCMV genomic DNA, a FISH probe was prepared using a nick translation kit (Roche), Digoxigenin-11-dUTP (Roche), and a HCMV TB40/E BAC as template11, following the manufacturer’s protocol. The probe was then column purified using ProbeQuant G-50 mini-columns (Sigma: GE-28–9034-08) and repetitive elements were blocked by including 0.1 μg/μl (w/v) human Cot1 DNA (Invitrogen) and 0.5 μg/μl (w/v) salmon sperm DNA (Invitrogen). Before being applied to samples, the FISH probe mix was ethanol precipitated, resuspended in hybridization buffer (50:50 solution of 100% formamide: 4x SSC (diluted from 20x SSC; Sigma-Aldrich: S6639) with 10% (w/v) dextran sulfate), rotated for 1 h at room temperature, denatured at 75°C for 5 min and pre-annealed for 20 min at 37°C. To prepare samples for immuno-FISH36, cultures were fixed using 4% (w/v) paraformaldehyde in PBS for 10 min. Cells were first permeabilized in 0.5% Triton-X-100 in PBS for 15 min, blocked for 1 h at 37°C using 0.1 % (w/v) saponin in PBS with 10% human serum (v/v) and then incubated with the indicated primary antibodies for 1 h at 37°C. Samples were then washed three times in PBS with 0.1% (v/v) Tween 20 (PBST) for 5 min, incubated with a biotinylated secondary antibody (1:250 dilution; Immunoreagents) for 1 h at 37°C and washed three times in PBST. Samples were then post-fixed using 1% (w/v) paraformaldehyde in PBS for 10 min, acid treated with 0.1N HCl for 8 min and then permeabilized with 0.5% Triton-X-100 (v/v) in PBS for 5 min before being incubated in 20% glycerol (v/v) in PBS for at least 45 mins. Coverslips were then freeze-thawed four times by immersion in liquid nitrogen for three seconds before being returned to the 20% glycerol solution until thawed. Coverslips were then washed in 2x SCC buffer for 5 min and stored for at least 24 h in a freshly prepared 50:50 solution of 100% formamide: 4x SSC (pH adjusted to 7). All antibodies were diluted using 0.01 % saponin (w/v) in PBS with 10% human serum (v/v) and all incubations were performed in the dark at room temperature unless indicated otherwise. Following storage in the formamide solution, the pre-prepared FISH probe was pipetted as droplets onto a glass microscope slide (typically 5 μl per 10 mm coverslip), coverslips were placed cell side down into the FISH probe droplets, sealed to the slide using rubber cement (Elmer’s) and allowed to dry. Slides were then heated to 75°C for 2 min and incubated overnight at 37°C in a sealed, humidified chamber. The next day, rubber cement was removed from the slides and coverslips were washed three times in 2x SSC for 5 min (shaking at 37°C). Coverslips were then washed three times in 0.1x SSC for 5 min (shaking at 60°C), washed in 4x SSC with 0.2% Tween 20 (v/v) (4x SSC-T) and re-blocked in 4x SSC-T with 4% (w/v) BSA for 1 h at 37°C. The digoxigenin-labelled FISH probe and biotin-labelled secondary antibody were then detected using secondary antibodies (Thermo Fischer Scientific) diluted in 4x SSC-T with 1% (w/v) BSA for 1 h at 37°C. Coverslips were washed three times in 4x SSC-T at room temperature, fully immersed in deionized water and mounted using Prolong Diamond mounting reagent with DAPI (Invitrogen). HCMV replication compartment area and genomic DNA labelling intensity was quantified using a CellProfiler pipeline and plotted using matplotlib and seaborn python packages (code available on GitHub through links provided below).
Live cell fluorescent microscopy and nuclear rotation measurements.
NHDFs or NHDFs expressing GFP-Nesprin-2G isoform were seeded into 4-chamber glass-bottom live-cell microscopy dishes (Greiner Bio-One: 627870). For experiments using only a single condition cells were seeded on 35 mm glass-bottom dishes (MatTek: P35G-1.5–14-C). For experiments comparing multiple conditions, cells were seeded on 4-compartment glass-bottom dishes (Greiner bio-one: 627870) to allow analyses of each condition side-by-side. To monitor rotation, cells were infected with either TB40E-UL99-eGFP or TB40E-UL99-mCherry as indicated. Prior to imaging, culture media was changed to Lebovitz L-15 carbon dioxide-independent media without phenol red (Thermo Fisher Scientific: 21083027), supplemented with 2 mM L-glutamine and 5% (v/v) FBS, allowed to equilibrate for at least 30 min and then imaged at 1 h intervals across the indicated timepoints using a Leica DMI6000B-AFC wide-field epi-fluorescent microscope with a multi-position stage (Marzhauser) and environmental chamber (InVivo) at 37°C. Experiments were performed for at least three independent biological replicates and nuclear rotations were quantified manually by classing rotations as either above or below 180°. Only infected cells with a clearly formed AC, that remained in focus within the field-of-view for the entire observation window, did not lyse at any point, and did not display directed cell motility were included in this analysis. Where required, nuclear rotations were traced by manually tracking a point on the nucleus proximal to the AC and the corresponding point on the opposite side of the nucleus using the Manual Tracking plugin for ImageJ. Polar coordinate line graphs describing the dynamics and degree of nuclear rotations, labeled as Rotational Analysis in figure legends, were produced using the matplotlib and ffmpeg python packages (code available on GitHub through links provided below). Etoposide (Fisher, Cat:ICN19391825) treatments were performed at a final concentration of 50 μM in DMEM for fixed cell imaging or Lebovitz L-15 medium for live-cell microscopy experiments, without penicillin/streptomycin, using a 50 mM stock resuspended in DMSO.
Convolutional neural network (CNN) analysis pipeline for HCMV infected cell classification.
Data for CNN cell classification was acquired via whole-coverslip scanning microscopy using the slide-scan application of MetaMorph (typically collecting 2,500 fields of view, covering 50×50 with 10% overlap and imaging >10,000 cells) and the wide-filed epi-fluorescent Leica DMi8 microscope described above. Unless indicated, data from three independent biological replicates was analyzed using CellProfiler (3.1.5) to reduce the size of images (by a factor of 8 to increase the speed of image processing), identify and segment single nuclei and export data containing the location and orientation of each nucleus and the staining intensity within and around each nucleus. Exported data was used to create unique identifiers and to determine the coordinates of a 600×600 pixel ROI surrounding each nucleus using the pandas and numpy python packages. All single nuclei ROIs were exported as jpeg compressed RGB images to generate a dataset compatible with CNN classification. Of note, only two channels—the Hoechst stained nucleus and the HCMV gB stained AC—were used for CNN classification so as not to bias our final quantification. A training dataset was generated by manually sorting images of single nuclei into folders labelled as either HCMV infected, MOCK infected or inappropriate for analysis (blurry, overlapping, delayed or failed); then a non-overlapping validation dataset was extruded at random from the training dataset (typically 30%). The open-source Fastai library (version 0.7) was used to train a ResNet32-based CNN (with ImageNet pretrained weights) using pytorch (1.3.1). An iterative approach was used to train the CNN, adjusting the training hyperparameters and content of the training dataset until high classification accuracy (>99%) was achieved. Training datasets can also be generated automatically using previously trained HCMV CNN classification models but should be manually checked for classification accuracy. CNN prediction scores were then generated and used to sort the entire dataset into folders for each class, separated by classification confidence to streamline manual review. Once reviewed, unique identifiers of images determined appropriate for further analysis (typically >1000) were extracted, matched to the uncompressed image dataset, and used to calculate the coordinates of a 2,000 pixel line across the minor axis of nuclei in mock infected cells or passing through the AC and nuclear center of HCMV infected cells. Line-scans averaged across a 150 pixel width were then collected between these coordinates for both HCMV and mock infected nuclei. Data was then compiled, checked and plotted using the pandas and matplotlib python packages. For kinetic analysis of SUN1 polarization during HCMV infection, the above pipeline was adapted to use SUN1, TGN46 and IE1/2 staining to identify multiple stages of HCMV infection.
All python code and a Docker-file for running this CNN are available through links provided below. Further, trained weights for a generalizable HCMV CNN classification model have been made freely available through links below. All CNN training and classification was performed using a RTX2070 graphics card (Nvidia), CUDA 10 and CuDNN 7 on a PC running Windows 10 Education (1803). Note: it may be possible to use this model to perform classification without a graphics card but processing time will be significantly increased.
Mask-RCNN HCMV analysis pipeline.
The Matterport implementation of Mask-RCNN37 updated to Tensorflow 2.0 (Github: https://github.com/matterport/Mask_RCNN) was adapted into a pipeline for the classification of HCMV infected cells and segmentation of the nucleus and AC. Training was performed iteratively from MS-COCO weights using manually segmented masks (nucleus and AC, plus a combined mask for HCMV classification) on the same hardware as described for CNN training. Once trained, classification was performed across whole coverslip scanning datasets and infected cells with a high classification score were sent for further linescan analysis (as performed in the CNN pipeline, but instead using the center coordinates of the nucleus and AC segmented with high accuracy by Mask-RCNN). Images were then rotated on this linescan axis and aligned (at the intersection of the linescan with the AC-facing edge of the segmented AC) so that images could be exported and average projection images and growing average projection movies could be generated using ImageJ. All python code and a Docker-file for running Mask-RCNN are available through links provided below.
Quantification and statistical analysis.
Data exploration, transformation, visualization and analysis was performed using open source Jupyter Lab notebooks (0.35.4; https://jupyter.org/) running Python 3.7.3 (via Anaconda Distribution 4.6.14; https://www.anaconda.com) with matplotlib (3.0.3), numpy (1.16.3), pandas (0.24.2), scipy (1.2.1) and seaborn (0.9.0) packages. Statistical parameters are reported in the figures and legends. Two-tailed, unpaired student’s t-tests were used to compare means from normally distributed data. Statistical analysis was performed using Graphpad Prism 7.0 and Scipy (1.2.1). CNNs were used to identify mock or infected cell classes from entire coverslip datasets and automatically perform quantitative analysis on the entire population of cells successfully identified as within each class, independent of the investigator.
Research animals.
No animals were used for the research conducted in this study.
Data and Code Sources:
Github:
HCMVcc-CNN: https://github.com/djproc/HCMVcc_MaskRCNN
HCMVcc-Mask-RCNN: https://github.com/djproc/HCMVcc_MaskRCNN
Pipelines and quantification: https://github.com/djproc/HCMVcc_pipelines_quant
Docker-Hub:
HCMVcc-CNN: https://hub.docker.com/r/djproc/hcmvcc_cnn
HCMVcc-Mask-RCNN: https://hub.docker.com/r/djproc/hcmvcc_maskrcnn
CNN weights available at:
https://northwestern.box.com/s/g52gt0tqlpgv50hhj3×0dg3t4ljd4he8
Extended Data
Extended Data Fig. 1: Tubulin acetylation regulates nuclear rotation and SUN1 polarization during HCMV infection.
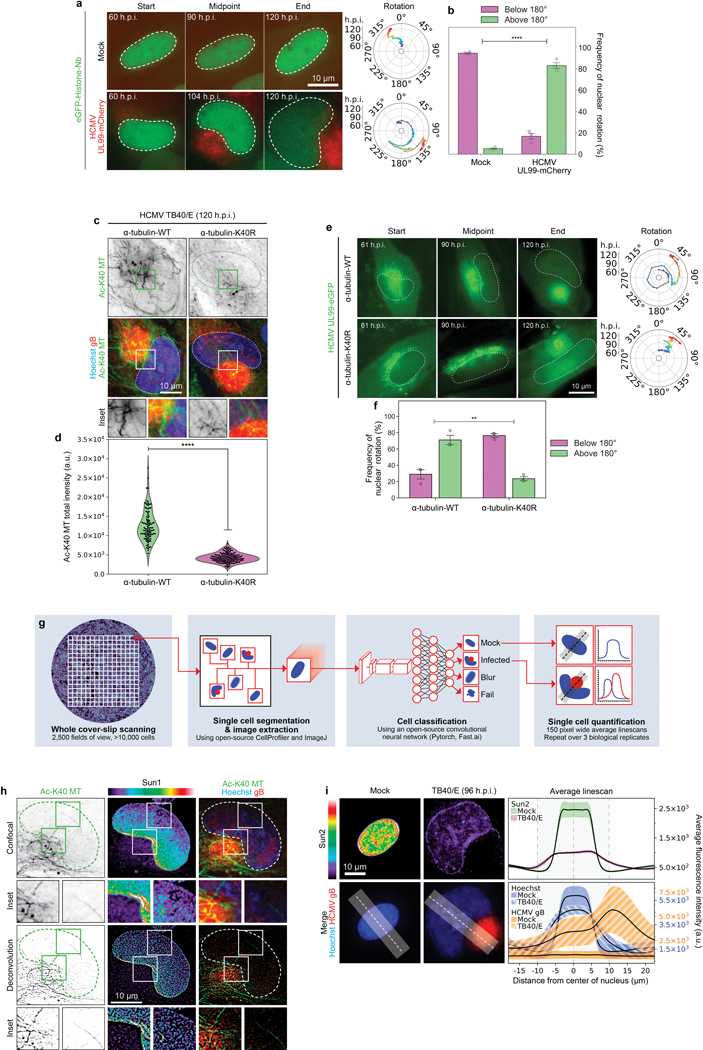
a-b, Representative stills from time lapse imaging and measurements of rotation frequency above or below 180° in uninfected or infected NHDFs expressing GFP-Histone nanobody. Bars represent mean ± SEM, statistics use two-tailed student’s t-test, n = 281 cells total from 3 independent biological replicates; ****p≤0.0001. Note that nuclear rotation above 180° occurs in approximately 80% of infected cells imaged, while lower levels of rotation occur in the remaining population. Such extensive rotation is extremely rare in uninfected cells. c-d, Expression of a K40R mutant form of tubulin suppresses the formation of acetylated microtubule filaments. Fluorescence intensity of acetylated tubulin is shown in b; All data points are shown within violin plots, statistics use two-tailed student’s t-test, n = 250 cells total, ****p ≤ 0.0001. Data shown is representative of 3 independent biological replicates. e-f, Expression of a K40R mutant form of tubulin suppresses nuclear rotation. Representative stills from Video 2 are shown in e and rotational analyses are shown in f. Rotation frequency above or below 180° is shown in d; bars represent mean ± SEM, statistics use two-tailed student’s t-test, n = 157 cells total, **p ≤ 0.01 g, schematic of CNN-based classification and analysis pipeline measuring fluorescence intensities across individual cells in different channels. Output for the AC (red) next to the nucleus (blue) is illustrated. h, Representative confocal z-section and deconvolved z-section image of SUN1 polarization in HCMV-infected cell. Acetylated microtubules and the AC (stained with the viral protein gB) are also shown. Data shown is representative of 3 independent biological replicates. i, Spatial distribution and intensity of DNA, gB and SUN2 using CNN. Lines represent mean ± SEM; n ≥ 17,484 cells total from 3 independent biological replicates.
Extended Data Fig. 2: Effects of HCMV infection on SUN1.
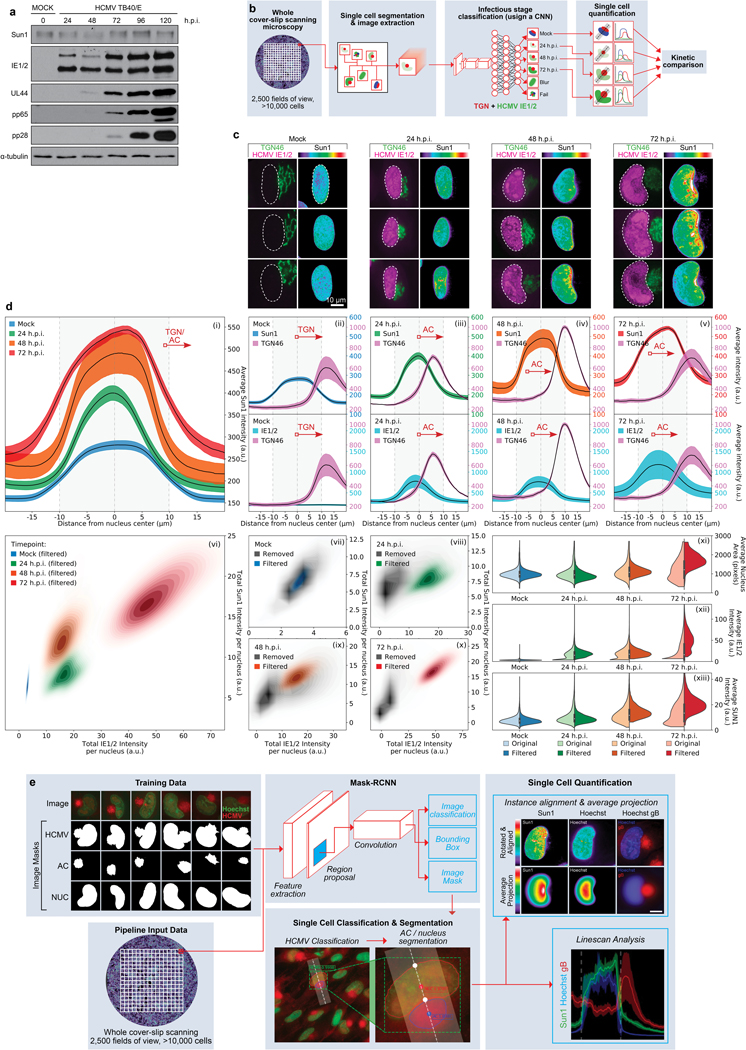
a, WB analysis of SUN1 levels over the course of infection with HCMV at MOI 1. Early (IE1/2), intermediate (UL44) and late (pp65, pp28) proteins demonstrate stages of infection at each timepoint, representative of 3 independent biological replicates. b-d, Neural network-based single cell analysis of SUN1 expression during HCMV infection. b, Illustration of CNN analysis pipeline that classifies cells by the predominant infectious cycle stage identified at each timepoint. c, Representative examples of uninfected NHDFs or NHDFs at various stages of infection, stained for SUN1, IE1/2 and TGN46. Expression of IE1/2 and gradual remodeling of the Golgi network serve as markers of infection stage. Polarization of SUN1 is seen between 24–72 h.p.i. d, CNN-based classification of cells based on IE1/2 expression levels, filtering out uninfected cells, reveals a gradual expansion of the nucleus and Golgi, characteristic of HCMV infection, occurs concomitantly with a gradual increase in expression and polarization of SUN1 toward the AC (i-v). Discrete populations of cells are filtered for inclusion in each timepoint (vii), with cells from other kinetic classes removed from analysis marked in grey (viii-x).Comparing unfiltered (lighter colored violin plots, left segment) versus filtered (dark colored violin plots, right segment) cell populations reveals the power of trained networks to more precisely analyze only infected cells within the population, more clearly revealing the increase in nuclear volume and SUN1 abundance, which peaks at approximately 2-fold (xi-xiii). Lines represent mean ± SEM; n = 37,800 cells total from 3 independent biological replicates. Violins as in Fig. 4a. e, Mask-RCNN analysis pipeline uses manually annotated masks of the AC, nucleus and combined (HCMV) to train a Mask-RCNN architecture to classify and segment microscopy images of HCMV infection. Once trained, whole cover-slip scanning datasets can be run through the model to perform instantaneous single cell quantification on high-confidence infected cells. This quantification has high spatial awareness and can be used to perform linescans between two specific subcellular compartments (e.g. the AC and nucleus) or to rotate and align nuclei to perform average projections (as in Fig. 1g).
Extended Data Fig. 3: SUN1:Nesprin-2G and the dynein adaptor BICD2 mediate nuclear rotation during HCMV infection.
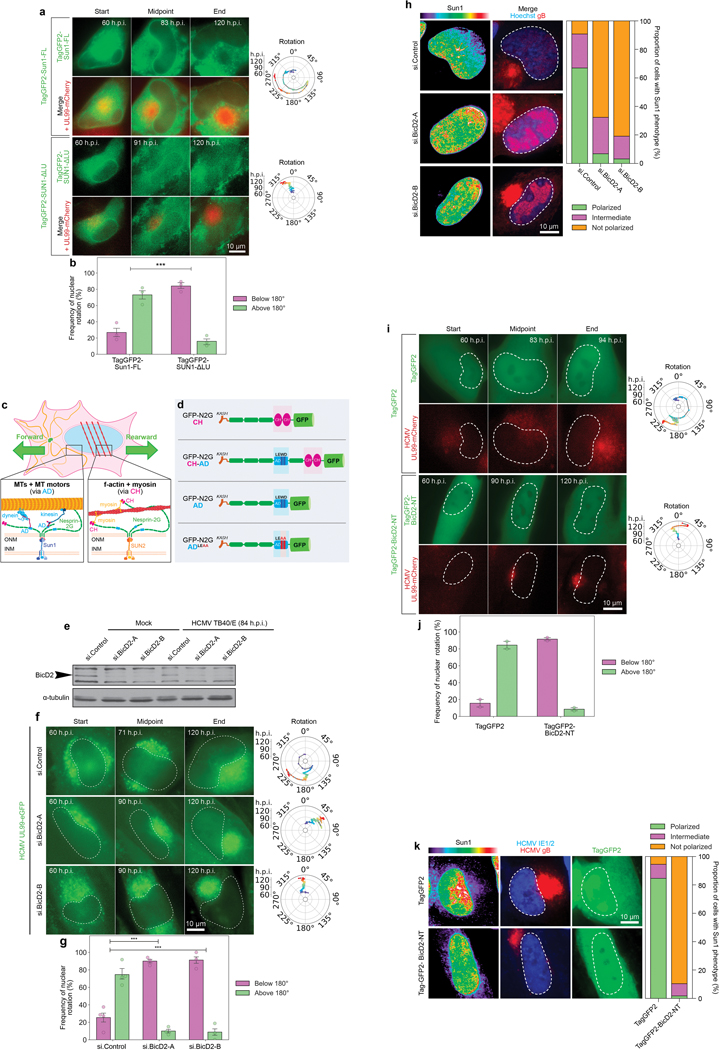
a-b, Expression of a SUN1 mutant that does not engage Nesprin-2G impairs nuclear rotation in HCMV-infected cells. a, Representative stills from time lapse recordings of NHDFs expressing Tag-GFP2 forms of SUN1 Full Length (FL) or SUN1 lacking the lumenal domain (SUN1ΔLu) that mediates interactions with Nesprin-2G, infected with HCMV-UL99mCherry. Rotation traces from this imaging are shown to the right. Analyses focused on cells expressing intermediate levels of SUN1-GFP constructs as high levels of expression can result in retention of Nesprin-2G in the endoplasmic reticulum (ER). b, Quantification of rotation frequencies above or below 180°; bars represent mean ± SEM, statistics use two-tailed student’s t-test, n = 138 cells total from 3 independent biological replicates, ***p≤0.001. This data further confirms that interactions with Nesprin-2G are necessary for nuclear rotation to occur. c-f, RNAi-mediated depletion of BICD2 using either of two independent siRNAs suppresses nuclear rotation and SUN1 polarization. c, Illustration of SUN1:Nesprin-2G interactions with microtubule motors through AD regions, or SUN2:Nesprin-2G interactions with myosin through CH domains to control nuclear movement. d, Illustration of GFP-Nesprin-2G constructs with CH and/or AD domains, along with the LEWD>LEAA kinesin-binding mutant. e, Western blot analysis of BICD2 expression representative of 3 independent replicates. Arrow points to BICD2, specifically depleted by two independent siRNAs. f, Representative stills and rotational analyses from Video 6 showing effects of BICD2 depletion on nuclear rotation. g, Rotation frequency above or below 180° in control or BICD2 depleted cells, bars represent mean ± SEM, statistics use two-tailed student’s t-test, n = 144 cells total cells from n = 3–4 independent biological replicates, ***p ≤ 0.001. h, Depletion of BICD2 impairs SUN1 polarization. Spatial distribution and intensity of DNA (hoescht), AC marker (gB), and SUN1 are shown for control and BICD2 depleted cells and are representative of 3 independent biological replicates. For quantification, SUN1 was classed as polarized (green), intermediate (pink) or non-polarized (orange). n = 235 cells total. i-k, Expression of a dominant-negative fragment of BICD2 reduces nuclear rotation and SUN1 polarization. NHDFs expressing TagGFP2 control or TagGFP2-BICD2 N-terminus (NT) were infected with HCMV UL99-mCherry. i, Representative still images from time lapse recordings and rotation traces are shown. j, Quantification of rotation frequencies above or below 180°; bars represent mean ± SEM, n = 91 cells total from 2 independent biological replicates. k, Representative images of SUN1 localization in NHDFs expressing TagGFP2 control or TagGFP2-BICD2-NT NHDFs are shown, consistent with 3 independent biological replicates. Quantification of SUN1 polarity categorized as fully polarized, intermediate polarity or not polarized is shown; n = 149 cells total.
Extended Data Fig. 4: Microtubules and SUN1 regulate Emerin polarity and nuclear F-actin.
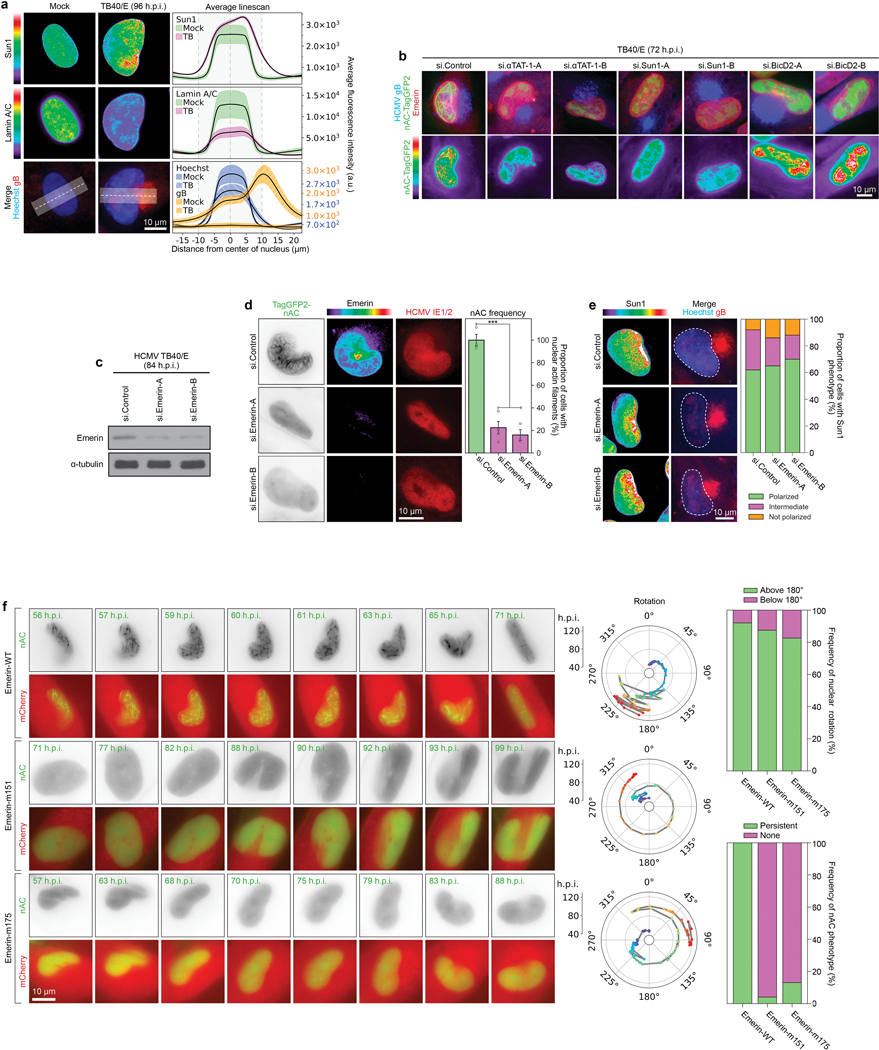
a, Lamin A/C is downregulated and lacks polarity in HCMV-infected cells. Lines represent mean ± SEM; n = 10,934 cells total from 3 independent biological replicates. b, Depletion of αTAT1, SUN1 or BICD2 inhibits Emerin polarization and causes aberrant F-actin networks. Representative images are shown for each condition, similar to data from 3 independent replicates. c-d, Emerin depletion blocks nuclear F-actin formation. c, WB analysis demonstrating the efficacy of Emerin siRNAs. d, Representative images and quantification of nuclear F-actin (nAC) frequency are shown for each condition, bars represent mean ± SEM, statistics use two-tailed student’s t-test, n = 401 cells total from 3 independent biological replicates, ***p≤0.001. Fluorescence intensity shows Emerin depletion in cells. e, Emerin depletion does not affect SUN1 polarization. Representative images and quantification of SUN1 polarization is shown for each condition; n = 321 cells. SUN1 was characterized as polarized, intermediate polarity or not polarized. f, Expression of actin-binding mutants of Emerin blocks nuclear F-actin formation but not nuclear rotation. NHDFs expressing nAC-TagGFP and mCherry-Emerin wildtype or actin-binding mutants (m151, m175) were infected with HCMV UL99-mCherry. Representative still images and rotation traces from time lapse imaging are shown. Quantification of nuclear rotation frequencies above or below 180° are shown for each condition; the presence of nuclear F-actin was also quantified in the same time lapse images, n = 72 cells total (upper) and n = 79 cells total (lower). Note that in order to image nAC-TagGFP cells were infected with HCMV UL99-mCherry. As such, mCherry signal in these images originates from both mCherry-Emerin and the viral UL99-mCherry, showing the cytoplasmic AC and nuclear rotation in infected cells under all conditions. Data shown is representative of 3 independent replicates.
Extended Data Fig. 5: Nuclear F-actin formation and histone modifications during HCMV infection.
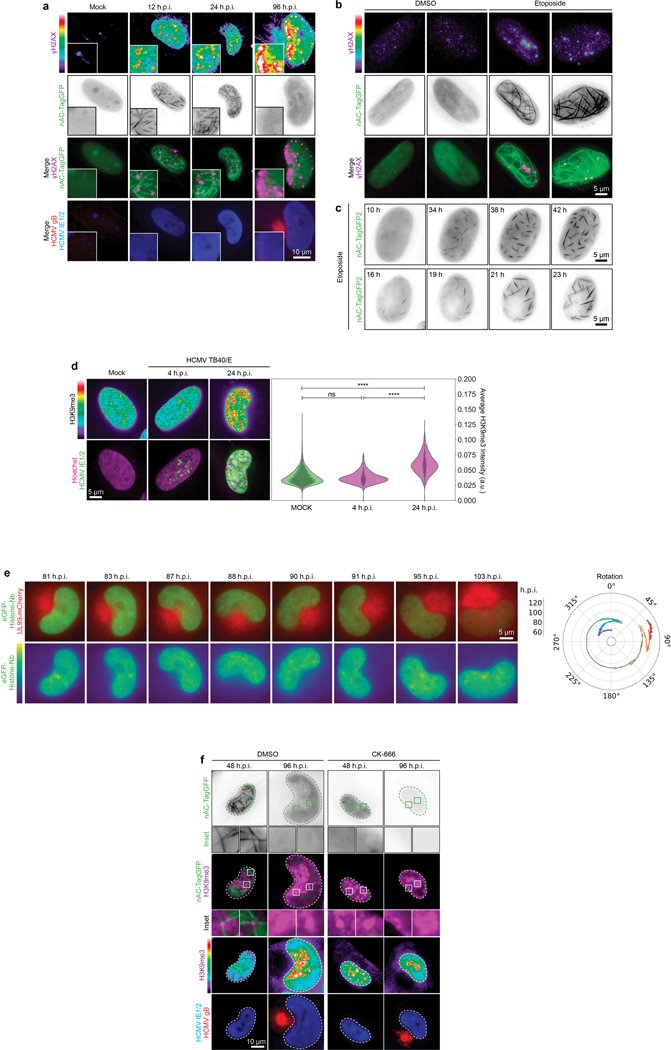
a, γH2AX localizes to nuclear F-actin and polarizes during HCMV infection. Representative images of HCMV-infected cells expressing nAC-TagGFP to detect nuclear actin filaments, fixed at the indicated times post-infection and stained for histone γH2AX. Intensity heat maps are shown at the top, illustrating the appearance and gradual polarization of γH2AX foci. In merges, γH2AX foci (purple staining) are observed adjacent to nuclear actin filaments (green) during the rotation phase, and are highly polarized by the time nuclear rotation ceases and actin filaments disassemble. b, Fixed images showing γH2AX and nuclear F-actin induction in nAC-TagGFP-expressing NHDFs treated with the DNA damage agent, etoposide. c, Still images from Supplementary Video 9 showing the formation of thick nuclear F-actin in response to etoposide. d, Representative examples of the spatial distribution of H3K9me3 foci at early time-points in HCMV infection. Infected cells were identified by staining for IE1/2. Average H3K9me3 fluorescence intensity per cell is shown in violin plots with all data points shown, statistics use two-tailed student’s t-test n = 8,177 cells total; ****p≤0.0001, ns= not significant. Note that H3K9 methylation increases by 24h.p.i. but is not polarized before the nuclear rotation phase of infection. e, Representative still images from Supplementary Video 10 showing the localization of histones visualized in NHDFs expressing eGFP-Histone nanobody and infected with HCMV UL99-mCherry. Rotation trace is shown to the right. Note that histones are dynamic but are next extensively polarized, in line with fixed images in Figure 4a. f, Arp1/2 inhibitor, CK-666 blocks nuclear actin filament formation and polarization of histone H3K9me3. Representative images are shown at 48 and 96 h.p.i., the peak and end-point of nuclear rotation and establishment of polarity, respectively. Insets show the localization of H3K9me3 foci near nuclear F-actin at the early stages of rotation when polarity is being established. For all experiments, data shown is representative of 3 independent biological replicates.
Extended Data Fig. 6: Localization of viral genomic DNA and histones in HCMV-infected cells.
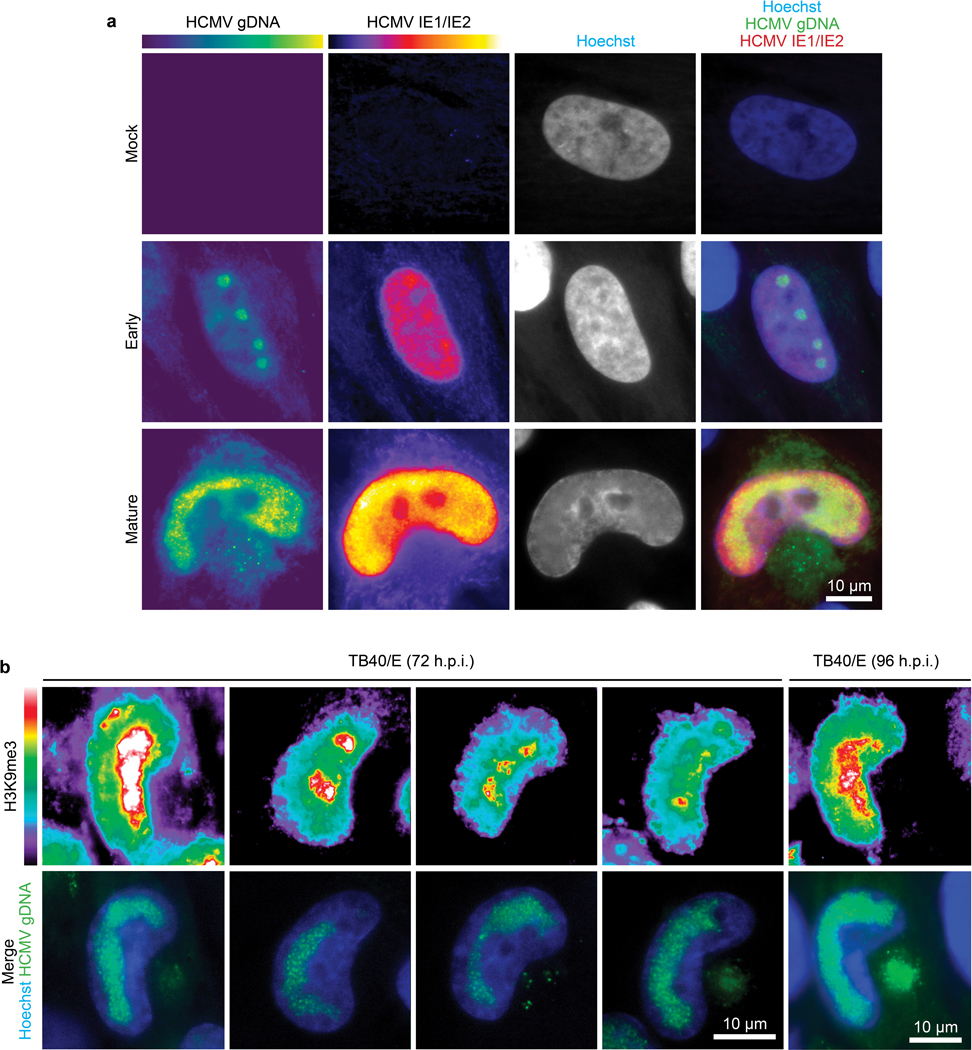
a, Representative images of early and mature replication compartments containing viral DNA in HCMV-infected cells, versus uninfected (mock) cells, detected using FISH. DNA-immunoFISH was used to detect the viral immediate early transcription factor, IE1/2 in conjunction with viral DNA. IE1/2 is present in cells containing early, individual replication compartments. As infection progresses, IE1/2 abundance increases and DNA-containing replication compartments amplify and coalesce. b, Representative examples of the relative spatial distribution and fluorescence intensity of histone H3K9me3 foci and viral genomic DNA (gDNA) in HCMV-infected cells at 72 and 96 h.p.i. Note that the bulk of histone H3K9me3 foci are spatially polarized toward the AC and segregated away from viral gDNA. For all experiments, data shown is representative of 3 independent biological replicates.
Extended Data Fig. 7: d-STORM imaging reveals the segregation of host and viral DNA during HCMV infection.
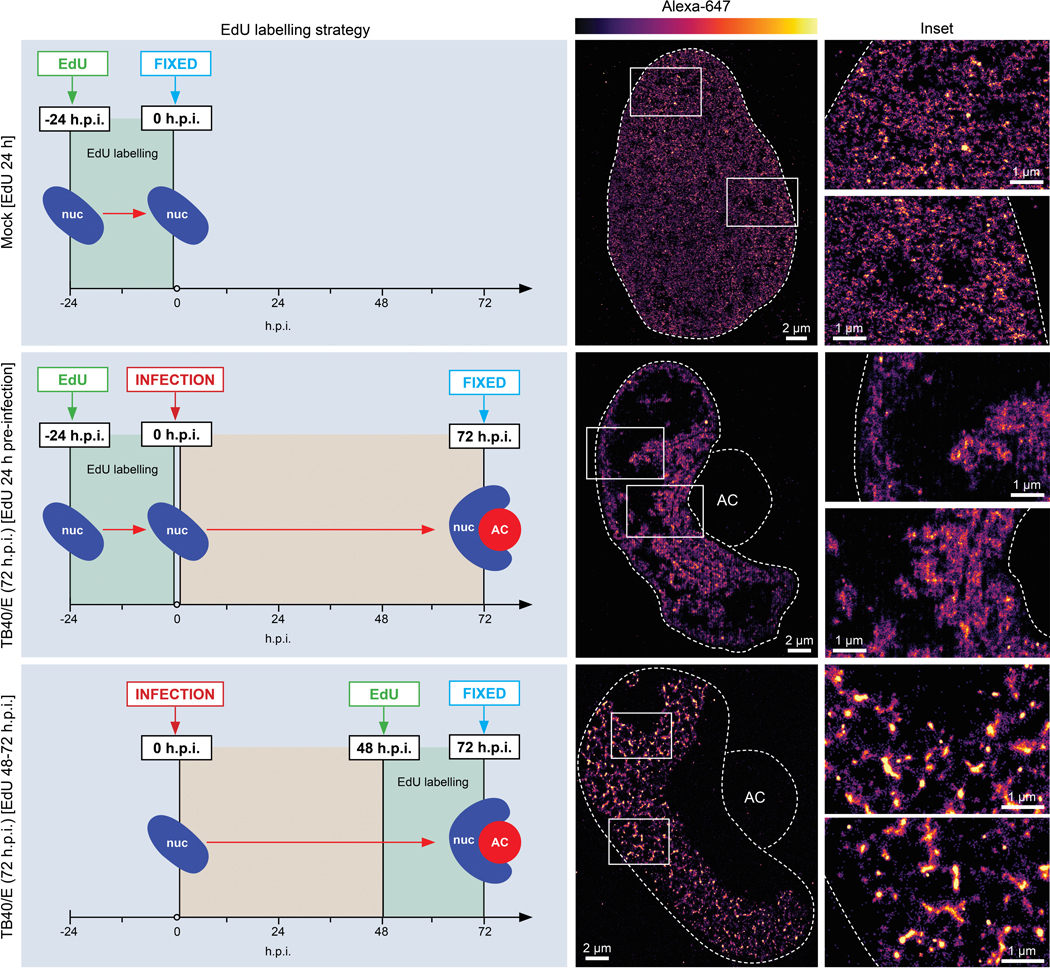
Differential EdU-labeling strategies enable super-resolution imaging of host and viral chromatin structures and localization. Cartoons to the left illustrate each labeling strategy. Top, Localization of host DNA in uninfected cells was visualized by pulsing with EdU followed by d-STORM imaging. Images representative of 3 independent biological replicates are shown, illustrating how labeled DNA is distributed throughout the nucleus. Middle, Localizaton of host DNA in HCMV-infected cells. To selectively label host DNA during infection, cells were pulsed with EdU which was then removed prior to infection to prevent incorporation into viral DNA. Representative d-STORM images are shown of labeled host DNA at 72 h.p.i., illustrating its accumulation near the viral AC. Lower, Localizaton of viral DNA in HCMV-infected cells. To selectively label viral DNA but not host DNA, cells were pulsed with EdU at 72h.p.i. As infection blocks host DNA synthesis, EdU is only incorporated into viral DNA at this time. Representative d-STORM images are shown of viral DNA at 72 h.p.i., illustrating its accumulation on the opposing side of the nucleus, away from the viral AC and regions containing host DNA or heterochromatin. This pattern of viral DNA labeling is validated by DNA Immuno-FISH imaging of viral DNA in Extended Data Fig. 6.
Extended Data Fig. 8: BICD2, SUN1 and Emerin are required for the polarization of heterochromatin by HCMV.
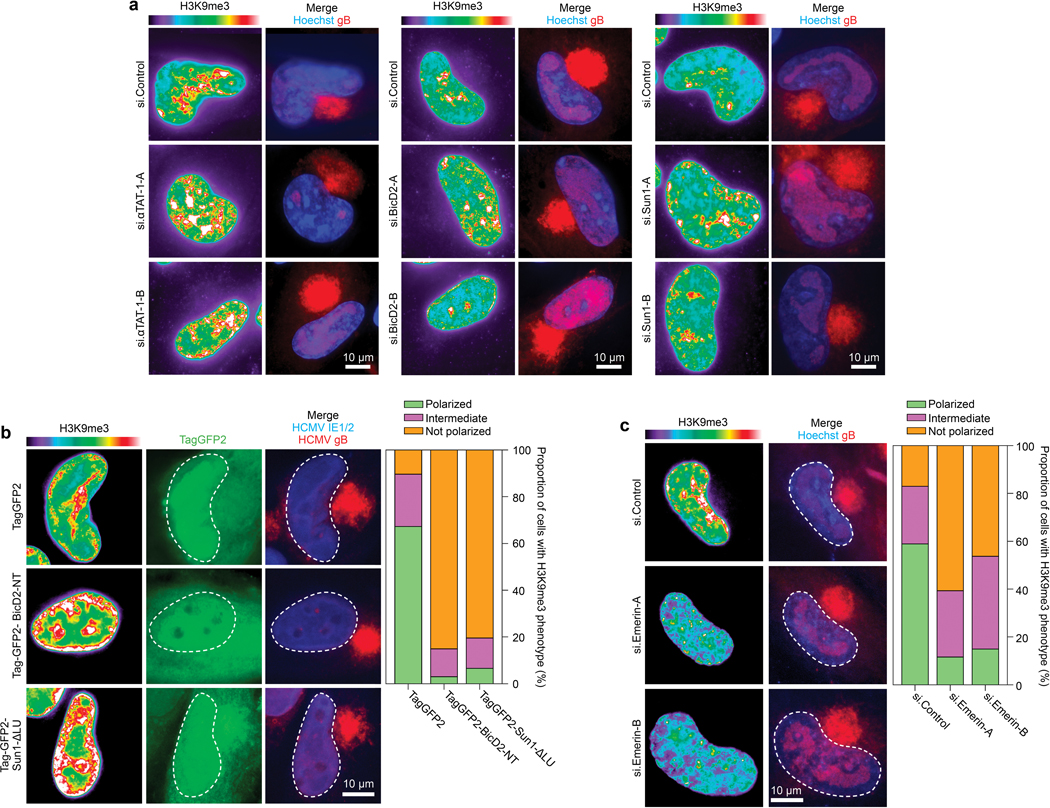
a, Depletion of αTAT1, BICD2 or SUN1 reduces H3K9me3 polarization. Representative images are shown. b, Expression of BICD2 dominant-negative (BICD2-NT) or SUN1 lacking its lumenal domain (SUN-ΔLu) that mediates interactions with Nesprin-2G inhibits the polarization of H3K9me3 in HCMV-infected cells. Representative images and quantification of H3K9me3 polarization are shown; n = 171 cells total. c, Depletion of Emerin impairs the polarization of H3K9me3 in HCMV-infected cells. Representative images and quantification of H3K9me3 polarization are shown; n = 490 cells total. For all experiments, data shown is representative of 3 independent biological replicates.
Extended Data Fig. 9: Host factors that control nuclear polarization are required for efficient HCMV replication.
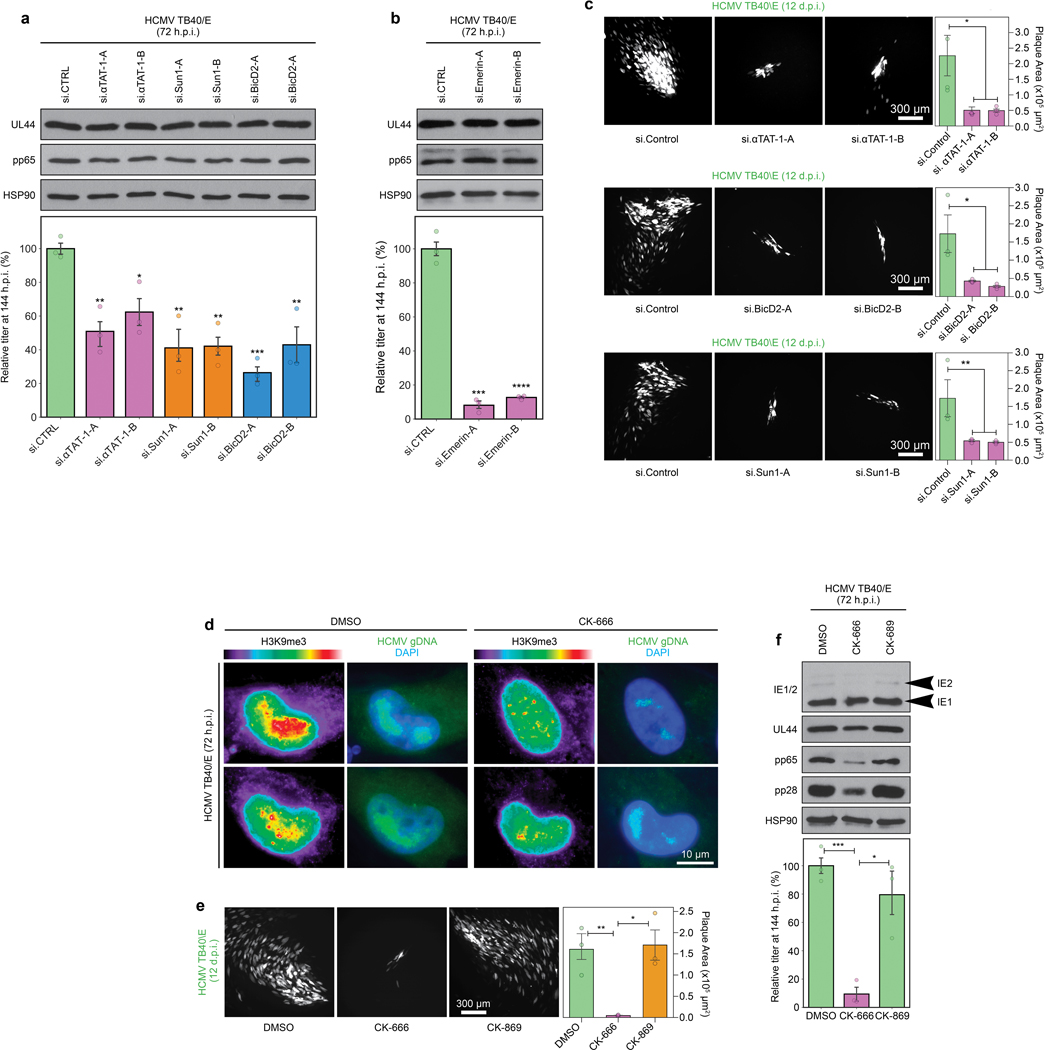
a-b, siRNAs targeting ATAT1, BICD2, SUN1 or Emerin do not affect the accumulation of viral proteins from different kinetic classes, but reduce the production of infectious virus in cells infected at MOI 1. Reductions in viral yields are similar to reductions in DNA fluorescence intensities detected in Fig. 4c. This suggests that nuclear polarization does not regulate viral gene expression, but maximizes viral DNA replication and production of infectious virus. Bars represent mean ± SEM from 3 independent biological replicates, statistics use two-tailed student’s t-test, *p≤0.05, **p≤0.01, ***p≤0.001, ****p≤0.0001. c, Depletion of ATAT1, BICD2 or SUN1 potently suppresses HCMV spread. Quantification of plaque areas is shown to the right in e; Bars represent mean ± SEM, statistics use two-tailed student’s t-test, n=31–81 plaques total from 3 independent biological replicates, *p≤0.05, **p≤0.01. This data suggests that while viral DNA replication and virus yields are reduced by 50% in a single round of infection, this has cumulative effects on the ability of HCMV to spread to other cells. d-f, General inhibition of Arp2/3 activity has broader effects on HCMV infection. d, The Arp2/3 inhibitor CK-666 suppresses viral gDNA polarization and accumulation. Representative images are shown of viral gene expression. gDNA and its localization relative to H3K9me3 foci. e, HCMV spread is suppressed in CK-666-treated, but not inactive control CK-689-treated cells. Plaque areas are shown, bars represent mean ± SEM, statistics use two-tailed student’s t-test, n=416 plaques total from 3 independent biological replicates, *p≤0.05, **p≤0.01. f, Arp2/3 inhibition suppresses viral protein accumulation and virus yields in single cycle infections. These data show that inhibition of actin polymerization using Arp2/3 inhibitors not only blocks nuclear polarization but has additional effects on viral gene expression, including modest effects on IE2 expression and more noticeable effects on intermediate and late proteins. This suggests roles for both nuclear and cytoplasmic actin when using broad-spectrum inhibitors over more targeted approaches against nuclear actin alone. Bars represent mean ± SEM from 3 independent biological replicates, statistics use two-tailed student’s t-test, *p≤0.05, ***p≤0.001. For all experiments, data shown is representative of 3 independent biological replicates.
Extended Data Fig. 10: A model for HCMV-induced nuclear polarization.
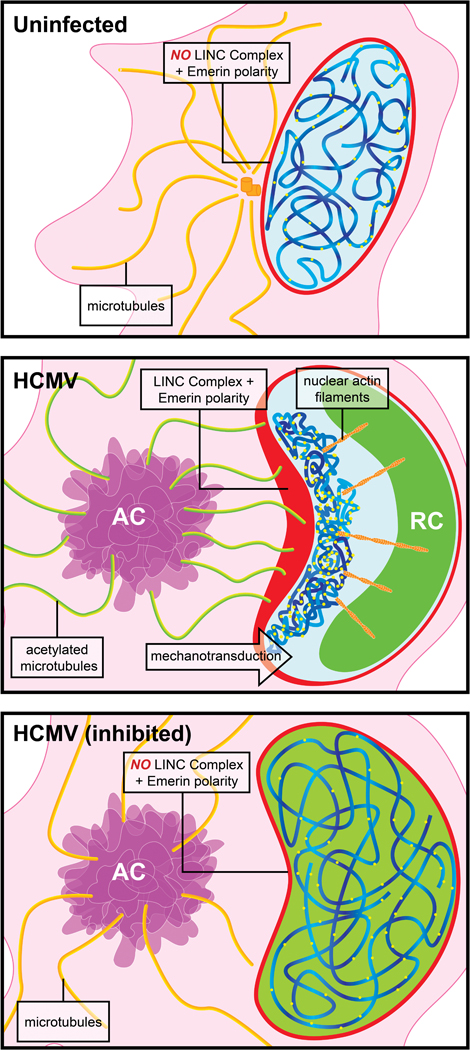
Top, In uninfected cells chromatin and silenced domains are heterogeneously distributed throughout the nucleus, as discussed in the main text. Middle, Upon HCMV infection, nuclear F-actin is induced and reorganized through the action of acetylated microtubules that exert mechanotransductive pulling forces on Nesprin-2G:SUN1-containing LINC complexes, polarizing them towards the AC. In doing so, this creates extreme polarity in inner-nuclear Emerin, directing nuclear F-actin organization; enriched red regions represent polarized LINC-Emerin complexes in the nuclear membrane. This extreme polarity draws silenced (H3K9me3) histones and associated host DNA towards this region of the nucleus, through the action of nuclear F-actin networks. As viruses employ a wide range of strategies to prevent chromatinization and silencing of their own DNA, viral gDNA is not drawn to the AC-proximal sites of H3K9me3 polarization. The polarization of inactive histones and host DNA likely pushes viral DNA to the opposing side of the nucleus, through space-filling. This segregation of viral and host DNA creates an optimal environment for viral DNA replication and production of infectious virus particles. Lower, Polarization of the nucleus fails to occur if key components driving the process are inhibited; if microtubules are not mechanically strengthened through acetylation, if connections between microtubules and nuclear membrane complexes are lost, or if nuclear F-actin is not organized by Emerin. Notably, nuclear F-actin and Emerin do not control nuclear rotation, but cytoplasmic microtubule-derived forces that cause nuclear rotation control Emerin localization, F-actin formation and intranuclear polarity. As such, cytoplasmic forces on the nuclear surface organize nuclear factors to control genetic polarity. Failure to create this polarity results in a suboptimal environment for viral DNA replication.
Supplementary Material
Acknowledgements
We thank Eain Murphy, Christine O’Connor, Gregg Gundersen, Thomas Shenk, James Holaska, Robert Grosse and Ann Carpenter for providing reagents and advice. This work was supported by a grant from the National Institutes of Health (NIH) R01AI141470 and P01GM105536 to D.W.
Footnotes
Competing Interest Statement
The authors declare no conflicts of interest associated with this work.
Data Availability Statement
All data generated during this study are included in this published article (and its supplementary information files and GitHub links provided in the Methods section) or is available upon reasonable request from the corresponding author.
Code Availability Statement
All code generated during this study are included in this published article (and its supplementary information files and GitHub links provided in the Methods section).
References
- 1.Gundersen GG & Worman HJ Nuclear positioning. Cell 152, 1376–1389, doi: 10.1016/j.cell.2013.02.031 (2013). [DOI] [PMC free article] [PubMed] [Google Scholar]
- 2.Baarlink C et al. A transient pool of nuclear F-actin at mitotic exit controls chromatin organization. Nat Cell Biol 19, 1389–1399, doi: 10.1038/ncb3641 (2017). [DOI] [PubMed] [Google Scholar]
- 3.Christophorou N et al. Microtubule-driven nuclear rotations promote meiotic chromosome dynamics. Nat Cell Biol 17, 1388–1400, doi: 10.1038/ncb3249 (2015). [DOI] [PubMed] [Google Scholar]
- 4.Levy JR & Holzbaur EL Dynein drives nuclear rotation during forward progression of motile fibroblasts. J Cell Sci 121, 3187–3195, doi: 10.1242/jcs.033878 (2008). [DOI] [PMC free article] [PubMed] [Google Scholar]
- 5.Luxton GW, Gomes ER, Folker ES, Vintinner E & Gundersen GG Linear arrays of nuclear envelope proteins harness retrograde actin flow for nuclear movement. Science 329, 956–959, doi: 10.1126/science.1189072 (2010). [DOI] [PMC free article] [PubMed] [Google Scholar]
- 6.Caridi CP et al. Nuclear F-actin and myosins drive relocalization of heterochromatic breaks. Nature 559, 54–60, doi: 10.1038/s41586-018-0242-8 (2018). [DOI] [PMC free article] [PubMed] [Google Scholar]
- 7.Schrank BR et al. Nuclear ARP2/3 drives DNA break clustering for homology-directed repair. Nature 559, 61–66, doi: 10.1038/s41586-018-0237-5 (2018). [DOI] [PMC free article] [PubMed] [Google Scholar]
- 8.Wilson MH & Holzbaur EL Opposing microtubule motors drive robust nuclear dynamics in developing muscle cells. J Cell Sci 125, 4158–4169, doi: 10.1242/jcs.108688 (2012). [DOI] [PMC free article] [PubMed] [Google Scholar]
- 9.Neems DS, Garza-Gongora AG, Smith ED & Kosak ST Topologically associated domains enriched for lineage-specific genes reveal expression-dependent nuclear topologies during myogenesis. Proc Natl Acad Sci U S A 113, E1691–1700, doi: 10.1073/pnas.1521826113 (2016). [DOI] [PMC free article] [PubMed] [Google Scholar]
- 10.Tsopoulidis N et al. T cell receptor-triggered nuclear actin network formation drives CD4(+) T cell effector functions. Sci Immunol 4, doi: 10.1126/sciimmunol.aav1987 (2019). [DOI] [PubMed] [Google Scholar]
- 11.Procter DJ et al. The HCMV Assembly Compartment Is a Dynamic Golgi-Derived MTOC that Controls Nuclear Rotation and Virus Spread. Dev Cell 45, 83–100 e107, doi: 10.1016/j.devcel.2018.03.010 (2018). [DOI] [PMC free article] [PubMed] [Google Scholar]
- 12.Shachar S & Misteli T Causes and consequences of nuclear gene positioning. J Cell Sci 130, 1501–1508, doi: 10.1242/jcs.199786 (2017). [DOI] [PMC free article] [PubMed] [Google Scholar]
- 13.Finn EH et al. Extensive Heterogeneity and Intrinsic Variation in Spatial Genome Organization. Cell 176, 1502–1515 e1510, doi: 10.1016/j.cell.2019.01.020 (2019). [DOI] [PMC free article] [PubMed] [Google Scholar]
- 14.Xu Z et al. Microtubules acquire resistance from mechanical breakage through intralumenal acetylation. Science 356, 328–332, doi: 10.1126/science.aai8764 (2017). [DOI] [PMC free article] [PubMed] [Google Scholar]
- 15.Akella JS et al. MEC-17 is an alpha-tubulin acetyltransferase. Nature 467, 218–222, doi: 10.1038/nature09324 (2010). [DOI] [PMC free article] [PubMed] [Google Scholar]
- 16.Zhu R, Antoku S & Gundersen GG Centrifugal Displacement of Nuclei Reveals Multiple LINC Complex Mechanisms for Homeostatic Nuclear Positioning. Curr Biol 27, 3097–3110 e3095, doi: 10.1016/j.cub.2017.08.073 (2017). [DOI] [PMC free article] [PubMed] [Google Scholar]
- 17.Buchkovich NJ, Maguire TG & Alwine JC Role of the endoplasmic reticulum chaperone BiP, SUN domain proteins, and dynein in altering nuclear morphology during human cytomegalovirus infection. J Virol 84, 7005–7017, doi: 10.1128/JVI.00719-10 (2010). [DOI] [PMC free article] [PubMed] [Google Scholar]
- 18.Swan A, Nguyen T & Suter B Drosophila Lissencephaly-1 functions with Bic-D and dynein in oocyte determination and nuclear positioning. Nat Cell Biol 1, 444–449, doi: 10.1038/15680 (1999). [DOI] [PubMed] [Google Scholar]
- 19.Milbradt J et al. Proteomic analysis of the multimeric nuclear egress complex of human cytomegalovirus. Mol Cell Proteomics 13, 2132–2146, doi: 10.1074/mcp.M113.035782 (2014). [DOI] [PMC free article] [PubMed] [Google Scholar]
- 20.Berk JM, Tifft KE & Wilson KL The nuclear envelope LEM-domain protein emerin. Nucleus 4, 298–314, doi: 10.4161/nucl.25751 (2013). [DOI] [PMC free article] [PubMed] [Google Scholar]
- 21.Holaska JM, Kowalski AK & Wilson KL Emerin caps the pointed end of actin filaments: evidence for an actin cortical network at the nuclear inner membrane. PLoS Biol 2, E231, doi: 10.1371/journal.pbio.0020231 (2004). [DOI] [PMC free article] [PubMed] [Google Scholar]
- 22.Baarlink C, Wang H & Grosse R Nuclear actin network assembly by formins regulates the SRF coactivator MAL. Science 340, 864–867, doi: 10.1126/science.1235038 (2013). [DOI] [PubMed] [Google Scholar]
- 23.Plessner M, Melak M, Chinchilla P, Baarlink C & Grosse R Nuclear F-actin formation and reorganization upon cell spreading. J Biol Chem 290, 11209–11216, doi: 10.1074/jbc.M114.627166 (2015). [DOI] [PMC free article] [PubMed] [Google Scholar]
- 24.Serebryannyy LA et al. Persistent nuclear actin filaments inhibit transcription by RNA polymerase II. J Cell Sci 129, 3412–3425, doi: 10.1242/jcs.195867 (2016). [DOI] [PMC free article] [PubMed] [Google Scholar]
- 25.Forest T, Barnard S & Baines JD Active intranuclear movement of herpesvirus capsids. Nat Cell Biol 7, 429–431, doi: 10.1038/ncb1243 (2005). [DOI] [PubMed] [Google Scholar]
- 26.Wilkie AR, Lawler JL & Coen DM A Role for Nuclear F-Actin Induction in Human Cytomegalovirus Nuclear Egress. MBio 7, doi: 10.1128/mBio.01254-16 (2016). [DOI] [PMC free article] [PubMed] [Google Scholar]
- 27.Bosse JB & Enquist LW The diffusive way out: Herpesviruses remodel the host nucleus, enabling capsids to access the inner nuclear membrane. Nucleus 7, 13–19, doi: 10.1080/19491034.2016.1149665 (2016). [DOI] [PMC free article] [PubMed] [Google Scholar]
- 28.Feierbach B, Piccinotti S, Bisher M, Denk W & Enquist LW Alpha-herpesvirus infection induces the formation of nuclear actin filaments. PLoS Pathog 2, e85, doi: 10.1371/journal.ppat.0020085 (2006). [DOI] [PMC free article] [PubMed] [Google Scholar]
- 29.Chang L et al. Herpesviral replication compartments move and coalesce at nuclear speckles to enhance export of viral late mRNA. Proc Natl Acad Sci U S A 108, E136–144, doi: 10.1073/pnas.1103411108 (2011). [DOI] [PMC free article] [PubMed] [Google Scholar]
- 30.Luo MH, Rosenke K, Czornak K & Fortunato EA Human cytomegalovirus disrupts both ataxia telangiectasia mutated protein (ATM)-and ATM-Rad3-related kinase-mediated DNA damage responses during lytic infection. J Virol 81, 1934–1950, doi: 10.1128/JVI.01670-06 (2007). [DOI] [PMC free article] [PubMed] [Google Scholar]
Methods References
- 31.Crisp M et al. Coupling of the nucleus and cytoplasm: role of the LINC complex. J Cell Biol 172, 41–53, doi: 10.1083/jcb.200509124 (2006). [DOI] [PMC free article] [PubMed] [Google Scholar]
- 32.Plessner M, Knerr J & Grosse R Centrosomal Actin Assembly Is Required for Proper Mitotic Spindle Formation and Chromosome Congression. iScience 15, 274–281, doi: 10.1016/j.isci.2019.04.022 (2019). [DOI] [PMC free article] [PubMed] [Google Scholar]
- 33.Belin BJ, Lee T & Mullins RD DNA damage induces nuclear actin filament assembly by Formin −2 and Spire-(1/2) that promotes efficient DNA repair. [corrected]. Elife 4, e07735, doi: 10.7554/eLife.07735 (2015). [DOI] [PMC free article] [PubMed] [Google Scholar]
- 34.Xu J et al. Super-Resolution Imaging of Higher-Order Chromatin Structures at Different Epigenomic States in Single Mammalian Cells. Cell Rep 24, 873–882, doi: 10.1016/j.celrep.2018.06.085 (2018). [DOI] [PMC free article] [PubMed] [Google Scholar]
- 35.Ovesny M, Krizek P, Borkovec J, Svindrych Z & Hagen GM ThunderSTORM: a comprehensive ImageJ plug-in for PALM and STORM data analysis and super-resolution imaging. Bioinformatics 30, 2389–2390, doi: 10.1093/bioinformatics/btu202 (2014). [DOI] [PMC free article] [PubMed] [Google Scholar]
- 36.Chaumeil J, Micsinai M & Skok JA Combined immunofluorescence and DNA FISH on 3D-preserved interphase nuclei to study changes in 3D nuclear organization. J Vis Exp, e50087, doi: 10.3791/50087 (2013). [DOI] [PMC free article] [PubMed] [Google Scholar]
- 37.He K, Gkioxari G, Dollár P & Girshick R Mask R-CNN. arXiv arXiv:1703.06870 (2018). [DOI] [PubMed] [Google Scholar]
Associated Data
This section collects any data citations, data availability statements, or supplementary materials included in this article.


