

Abstract
DUOX1, a NADPH oxidase family member, catalyzes the production of hydrogen peroxide. DUOX1 is expressed in various tissues, including thyroid and respiratory tract, and plays a crucial role in processes such as thyroid hormone biosynthesis and innate host defense. DUOX1 co-assembles with its maturation factor DUOXA1 to form an active enzyme complex. However, the molecular mechanisms for activation and regulation of DUOX1 remain mostly unclear. Here I present cryo-EM structures of the mammalian DUOX1–DUOXA1 complex, in the absence and presence of substrate NADPH, as well as DUOX1–DUOXA1 in an unexpected dimer-of-dimer configuration. These structures reveal atomic details of the DUOX1–DUOXA1 interaction, a lipid-mediated NADPH-binding pocket and the electron transfer path. Furthermore, biochemical and structural analyses indicate that the dimer-of-dimer configuration represents an inactive state of DUOX1–DUOXA1, suggesting an oligomerization-dependent regulatory mechanism. Together, my work provides structural bases for DUOX1–DUOXA1 activation and regulation.
Maintenance of reactive oxygen species (ROS) homeostasis is essential to preserve cell integrity and thus vital for the survival and growth of almost all life1. ROS generation by NADPH oxidases (NOXs) is an essential aspect of ROS regulation. Enhanced NOX activity could cause oxidative stress and thus result in cell or tissue damage and, in some cases, even organ failure in mammals2. For example, during viral infection, it is proposed that long-time viral stimulation is prone to eliciting intensive immunological reactions, which includes increased production of ROS through NOXs in macrophages and neutrophils. The excessive ROS will not only clear viruses but also damage healthy cells in the lung and even heart, leading to organ failure1,3–5.
As a member of the NADPH oxidase family, DUOX1 catalyzes the production of hydrogen peroxide (H2O2) and plays a crucial role in innate host defense and thyroid hormone biosynthesis6. Mammals encode seven NADPH oxidases: NOX1–5 and DUOX1–2. All NOX members share conserved structural features, including an NADPH-binding domain (NBD), a FAD-binding domain (FBD) and a 6-TM ferric oxidoreductase domain (FRD) and catalyze cross-membrane electron transfer from NADPH to oxygen2. Among the seven NOX proteins, DUOX1–2 and NOX4 generate hydrogen peroxide, while the rest produce superoxide7. DUOX1, as well as DUOX2, was first identified thyroid NADPH oxidases that are important for the thyroid hormone production8–11. DUOX1 and DUOX2 share ~85% sequence homology and both contain additional N-terminal peroxidase homology domain (PHD) and cytosolic EF-hands. In addition to thyroid glands, DUOX1 is also found in airway epithelial cells and contributes to the innate host defense12,13.
Maturation and activation of DUOX1 require DUOX activator 1 (DUOXA1)14. DUOXA1 is a transmembrane glycoprotein, expression of which rescues the catalytic function of DUOX1 in reconstituted systems. DUOXA1 regulates DUOX1 by promoting its ER-to-Golgi transition, maturation, translocation to the plasma membrane and protein stability15,16. Yet how DUOXA1 associates with DUOX1 and regulates its function remains largely unclear.
The catalytic activity of DUOX1–DUOXA1 complexes is tightly regulated. DUOX1–DUOXA1 mediated H2O2 production is Ca2+-dependent. DUOX1 contains cytoplasmic EF-hand motifs, and mutations of calcium-binding residues abolish enzymatic activities of DUOX1–DUOXA1 complexes17–19. The function of DUOX1–DUOXA1 complexes is also modulated through post-translational modifications. For example, N-glycosylation of DUOX1 and DUOXA1 is essential for protein maturation, and phosphorylation of DUOX1 could boost H2O2 production18. Furthermore, the dimerization of DUOX1 PHD domains has been reported20, yet it is not clear whether full-length DUOX1–DUOXA1 complexes could also adopt a dimer-of-dimer configuration, and if so, what the physiological significance of such arrangement is.
Here I report cryo-EM structures of mouse DUOX1–DUOXA1 complexes in NADPH-free, NADPH-bound and dimer-of-dimer states, providing structural mechanisms underlying DUOX1–DUOXA1 activation and regulation and molecular insights into ROS production.
Results
Structure of the mouse DUOX1–DUOXA1 complex
I first carried out structural studies of the mouse DUOX1–DUOXA1 complex in the absence of NADPH using single-particle cryo-EM analysis (Extended Data Fig. 1a,b). Mouse DUOX1 shares a ~91% sequence identity with its human ortholog. Purified mouse full-length DUOX1–DUOXA1 complexes migrate as two overlapping peaks on size exclusion chromatography, indicating the presence of DUOX1–DUOXA1 complexes with different stoichiometries (Extended Data Fig. 1a). Peak position analyses based on estimated molecular weight suggested that the two peaks likely correspond to heterodimer and dimer-of-dimer fractions of DUOX1–DUOXA1 complexes. Though the protein sample of the second peak was subjected for cryo-EM analysis, it still yielded two structures of DUOX1–DUOXA1 in both heterodimeric and dimer-of-dimer states due to peak overlapping (Extended Data Fig.1a,b and Table 1).
TABLE 1:
Cryo-EM data collection, refinement and validation statistics
| DUOX1–DUOXA1 (apo) (EMDB-21962, PDB 6WXR) | DUOX1–DUOXA1 (dimer of dimers) (EMDB-21963, PDB 6WXU) | DUOX1–DUOXA1 (with NADPH) (EMDB-21964, PDB 6WXV) | |
|---|---|---|---|
| Data collection and processing | |||
| Magnification | 81,000 | 81,000 | |
| Voltage (kV) | 300 | 300 | |
| Electron exposure (e–/Å2) | 65.4 | 80.5 | |
| Defocus range (μm) | 1.1–2.0 | 1.1–2.0 | |
| Pixel size (Å) | 1.08 | 1.08 | |
| Symmetry imposed | C1 | C2 | C1 |
| Initial particle images (no.) | ~2,200,000 | 1,486,046 | |
| Final particle images (no.) | 534,337 | 302,097 | 667,038 |
| Map resolution (Å) | 3.2 | 2.7 | 3.3 |
| FSC threshold | 0.143 | 0.143 | 0.143 |
| Map resolution range (Å) | 3.2–200 | 2.7–200 | 3.3–200 |
| Refinement | |||
| Initial model used (PDB code) | de novo | de novo | de novo |
| Model resolution (Å) | 3.2 | 2.7 | 3.3 |
| FSC threshold | 0.143 | 0.143 | 0.143 |
| Model resolution range (Å) | 3.2–200 | 2.7–200 | 3.3–200 |
| Map sharpening B factor (Å2) | −135 | −105 | −125 |
| Model composition | |||
| Non-hydrogen atoms | 10,410 | 18,419 | 10,610 |
| Protein residues | 1,303 | 2,212 | 1,319 |
| Ligands | 4 | 8 | 5 |
| B factors (Å2) | |||
| Protein | 36.06 | 67.61 | 41.73 |
| Ligand | - | - | 30.07 |
| R.m.s. deviations | |||
| Bond lengths (Å) | 0.003 | 0.006 | 0.004 |
| Bond angles (°) | 0.716 | 0.694 | 0.702 |
| Validation | |||
| MolProbity score | 1.90 | 1.71 | 1.82 |
| Clashscore | 8.68 | 3.62 | 8.23 |
| Poor rotamers (%) | 0.19 | 1.95 | 0 |
| Ramachandran plot | |||
| Favored (%) | 93.31 | 95.18 | 94.46 |
| Allowed (%) | 6.69 | 4.82 | 5.54 |
| Disallowed (%) | 0 | 0 | 0 |
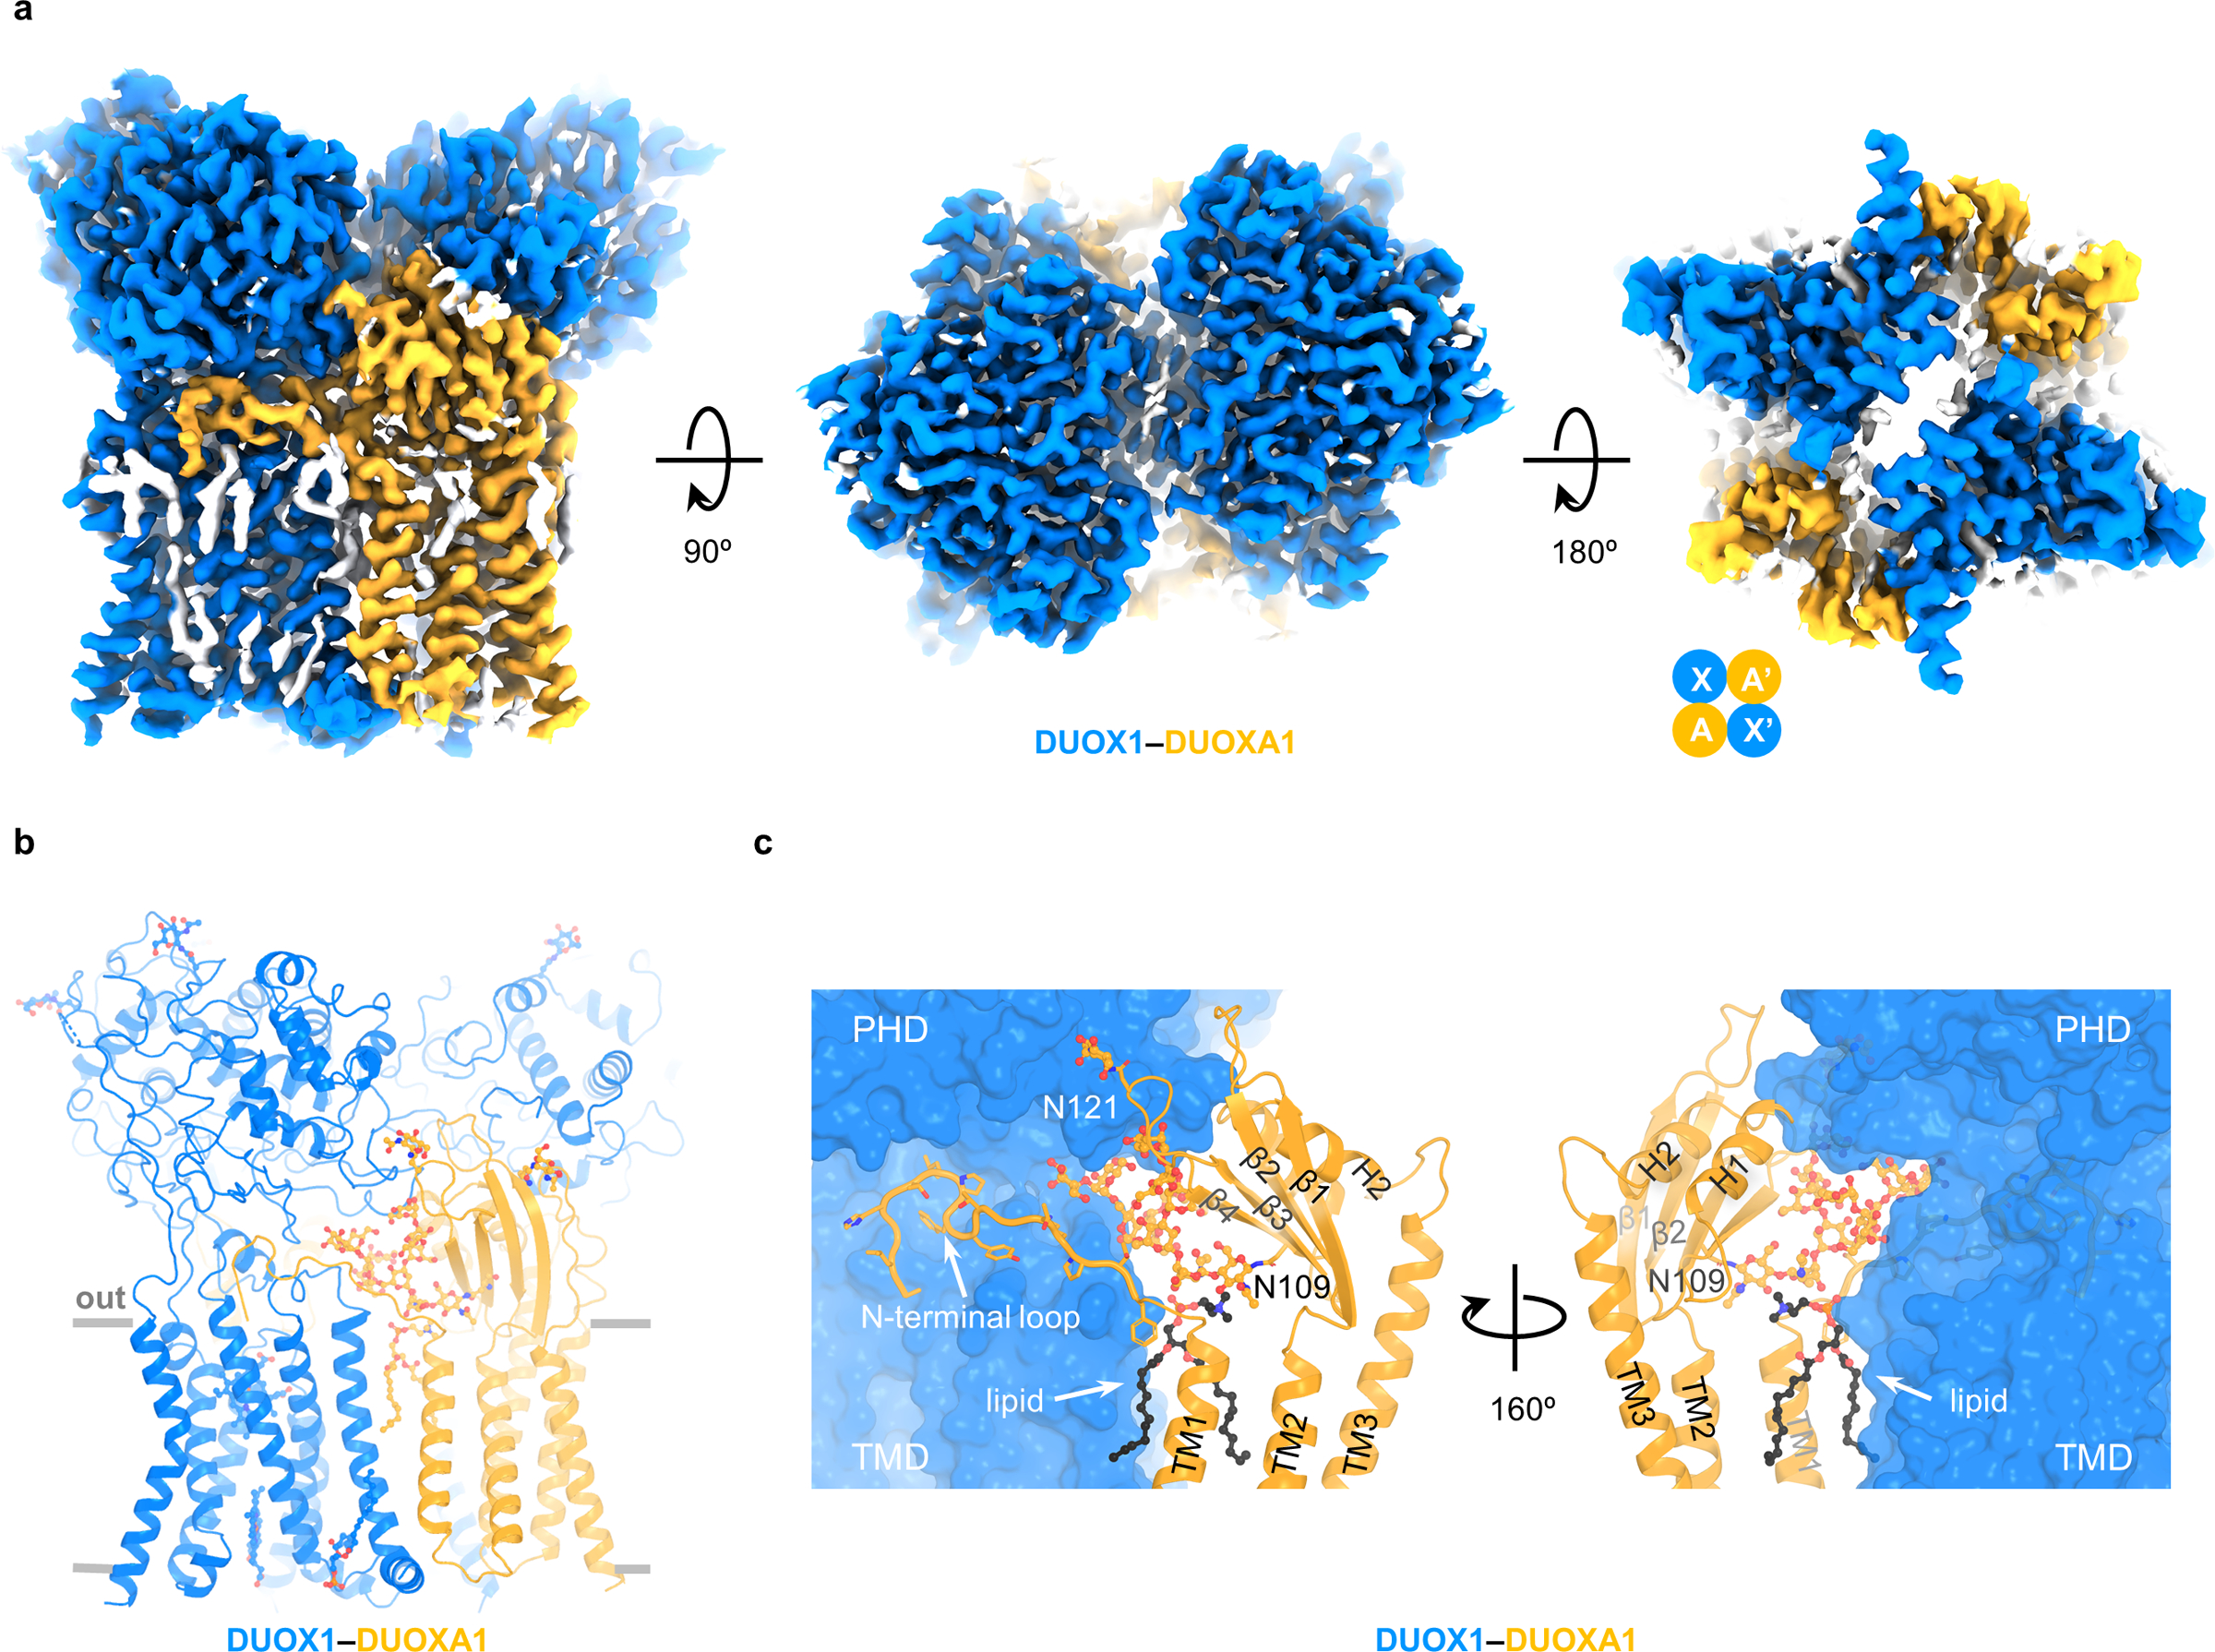
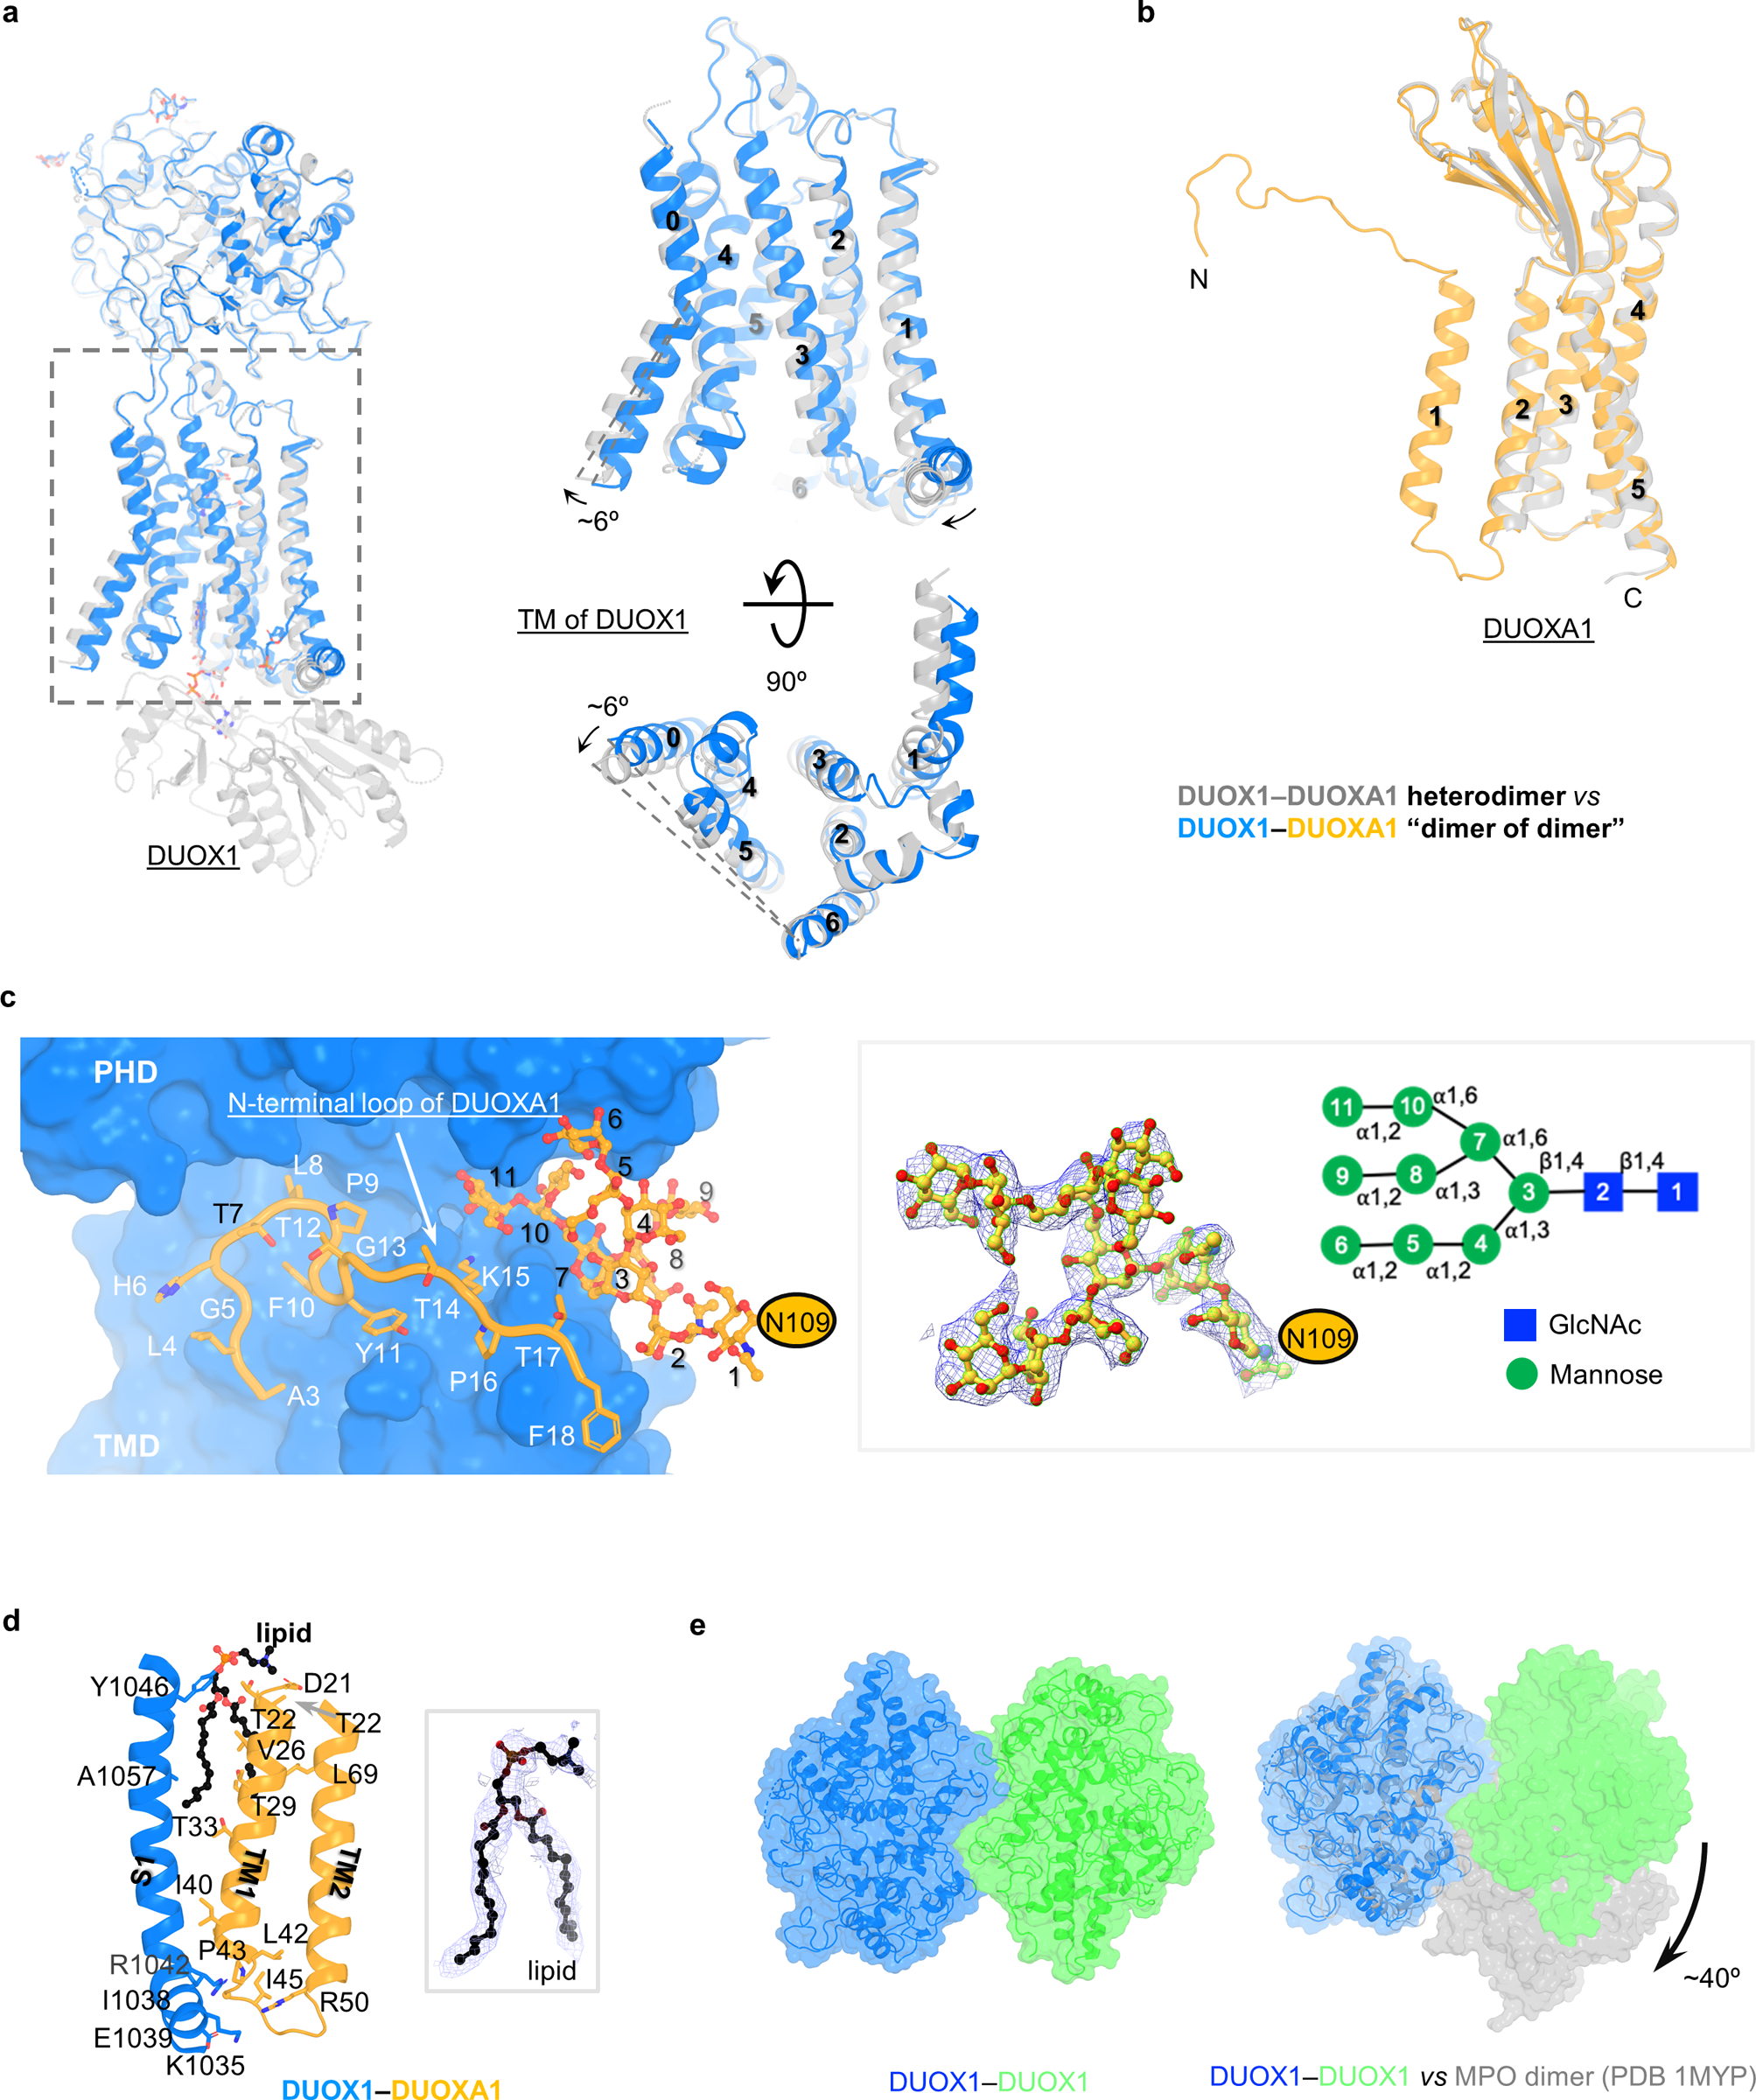
Here I will first discuss the structure of DUOX1–DUOXA1 heterodimer, which was resolved at an overall resolution of 3.2 Å. The final map allowed de novo model building of both DUOX1 and DUOXA1 (Fig. 1b). There are also sugar densities for several glycosylation sites in DUOXA1 (Asn84 and Asn109) and DUOX1 (N94, N324 and N534) (Extended Data Fig. 1d). The resulting complex structure has a dimension of ~145 Å × 80 Å × 50 Å (Fig. 1a and Extended Data Fig. 1b).
Fig. 1:
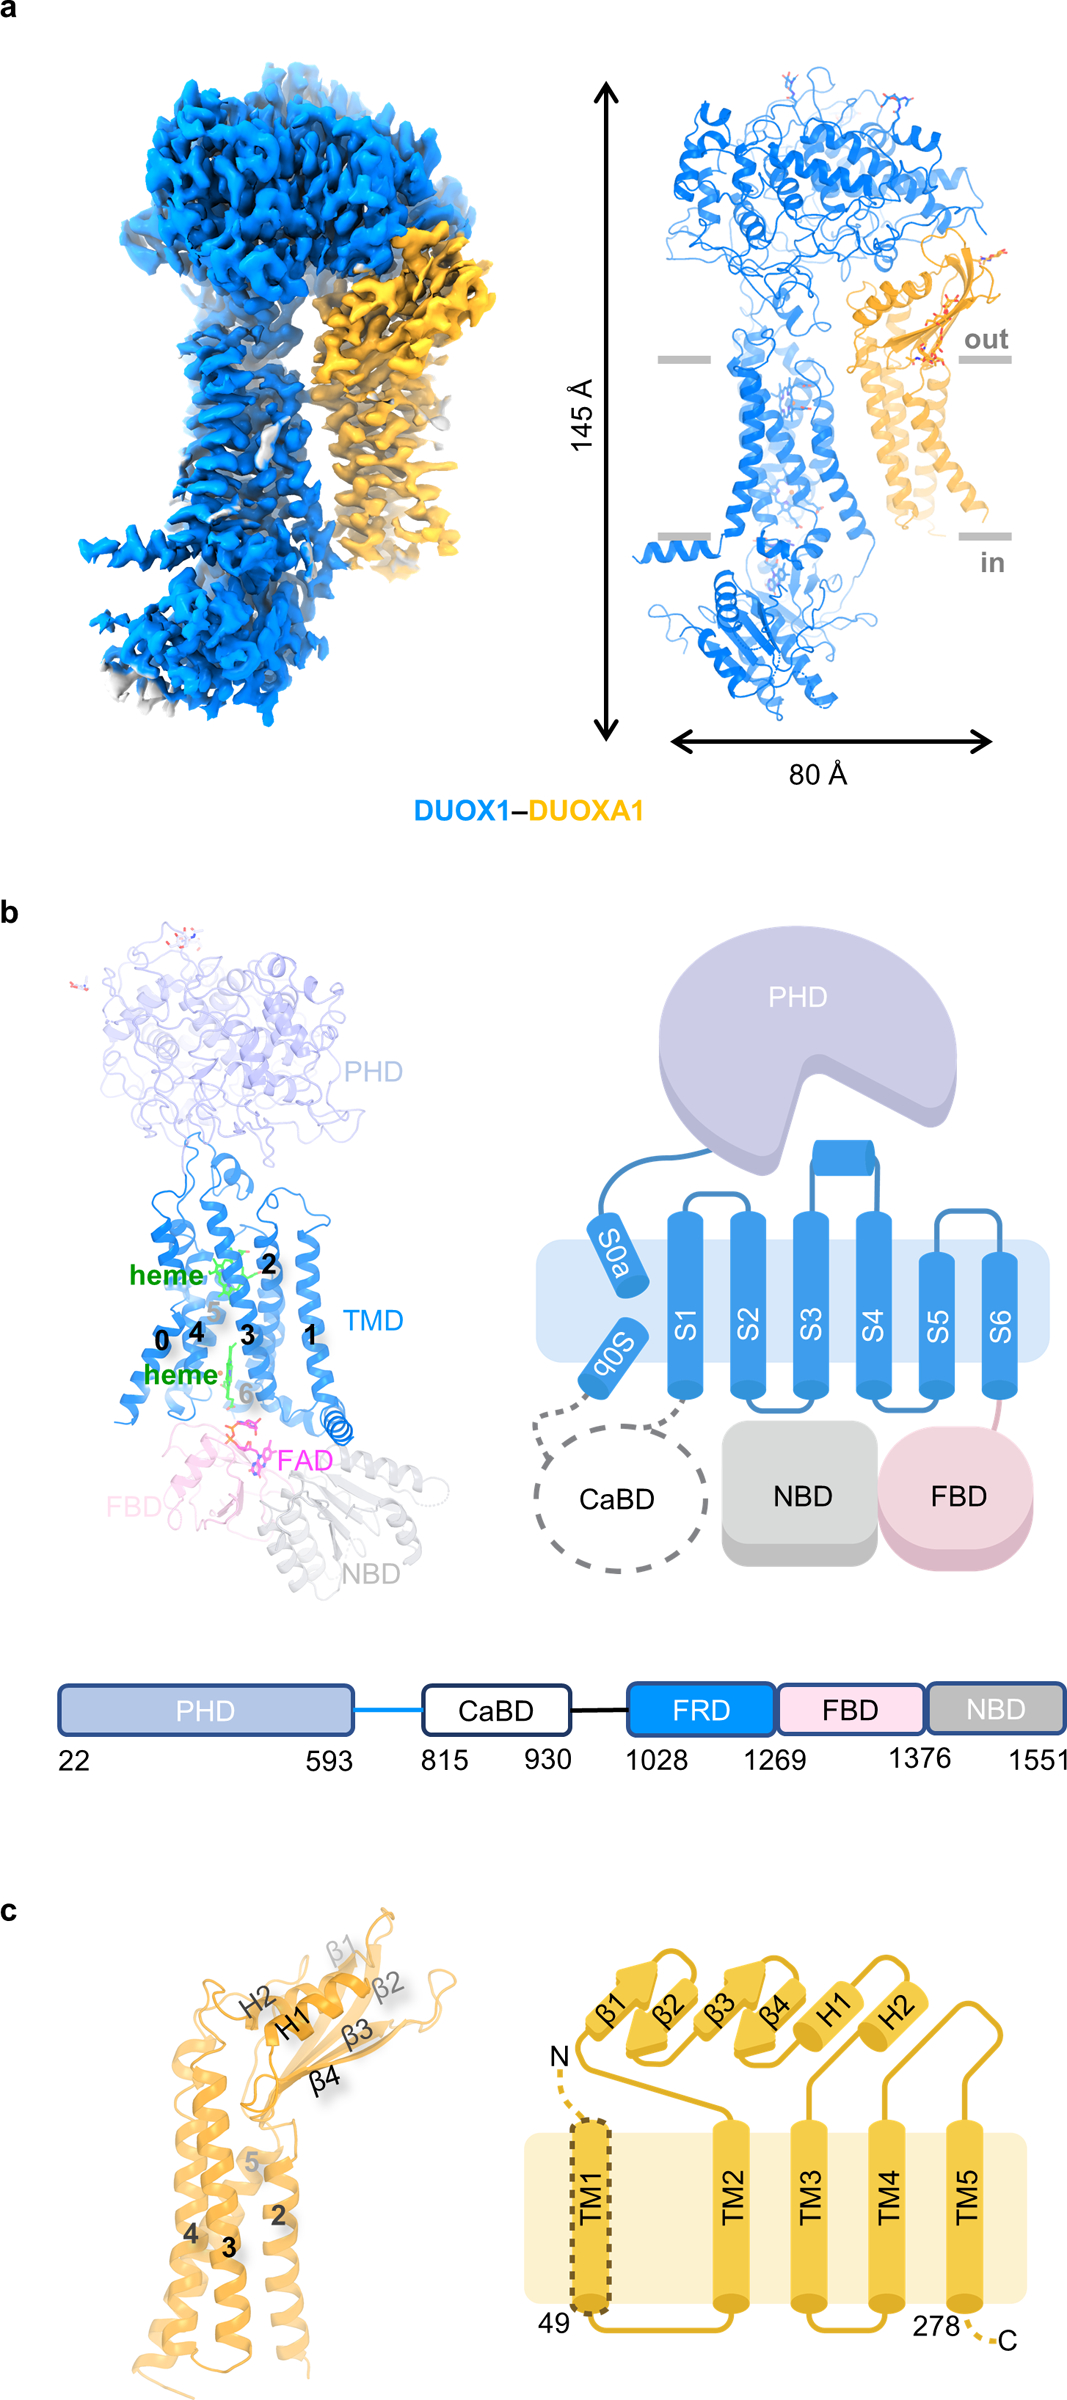
Structure of DUOX1–DUOXA1 in the absence of NADPH. a, Cryo-EM map and structural model of the DUOX1–DUOXA1 complex. DUOX1 and DUOXA1 are colored in blue and orange, respectively (the same color code will be used unless otherwise noted). The membrane boundary is indicated using grey lines. b, Top: structure and cartoon model of DUOX1. The PHD, TMD, FBD and NBD of DUOX1 are colored in light blue, blue, pink and grey, respectively. The CaBD is indicated by a dashed cycle. FAD and hemes are shown as sticks and colored in magenta and green, respectively. Bottom: the scheme of DUOX1 with domain boundaries shown. FRD stands for and ferric oxidoreductase domain (S1–S6 of DUOX1). c, Structure of DUOXA1. The secondary structures between TM2 and TM3 are labeled with β1–4 and H1–2.
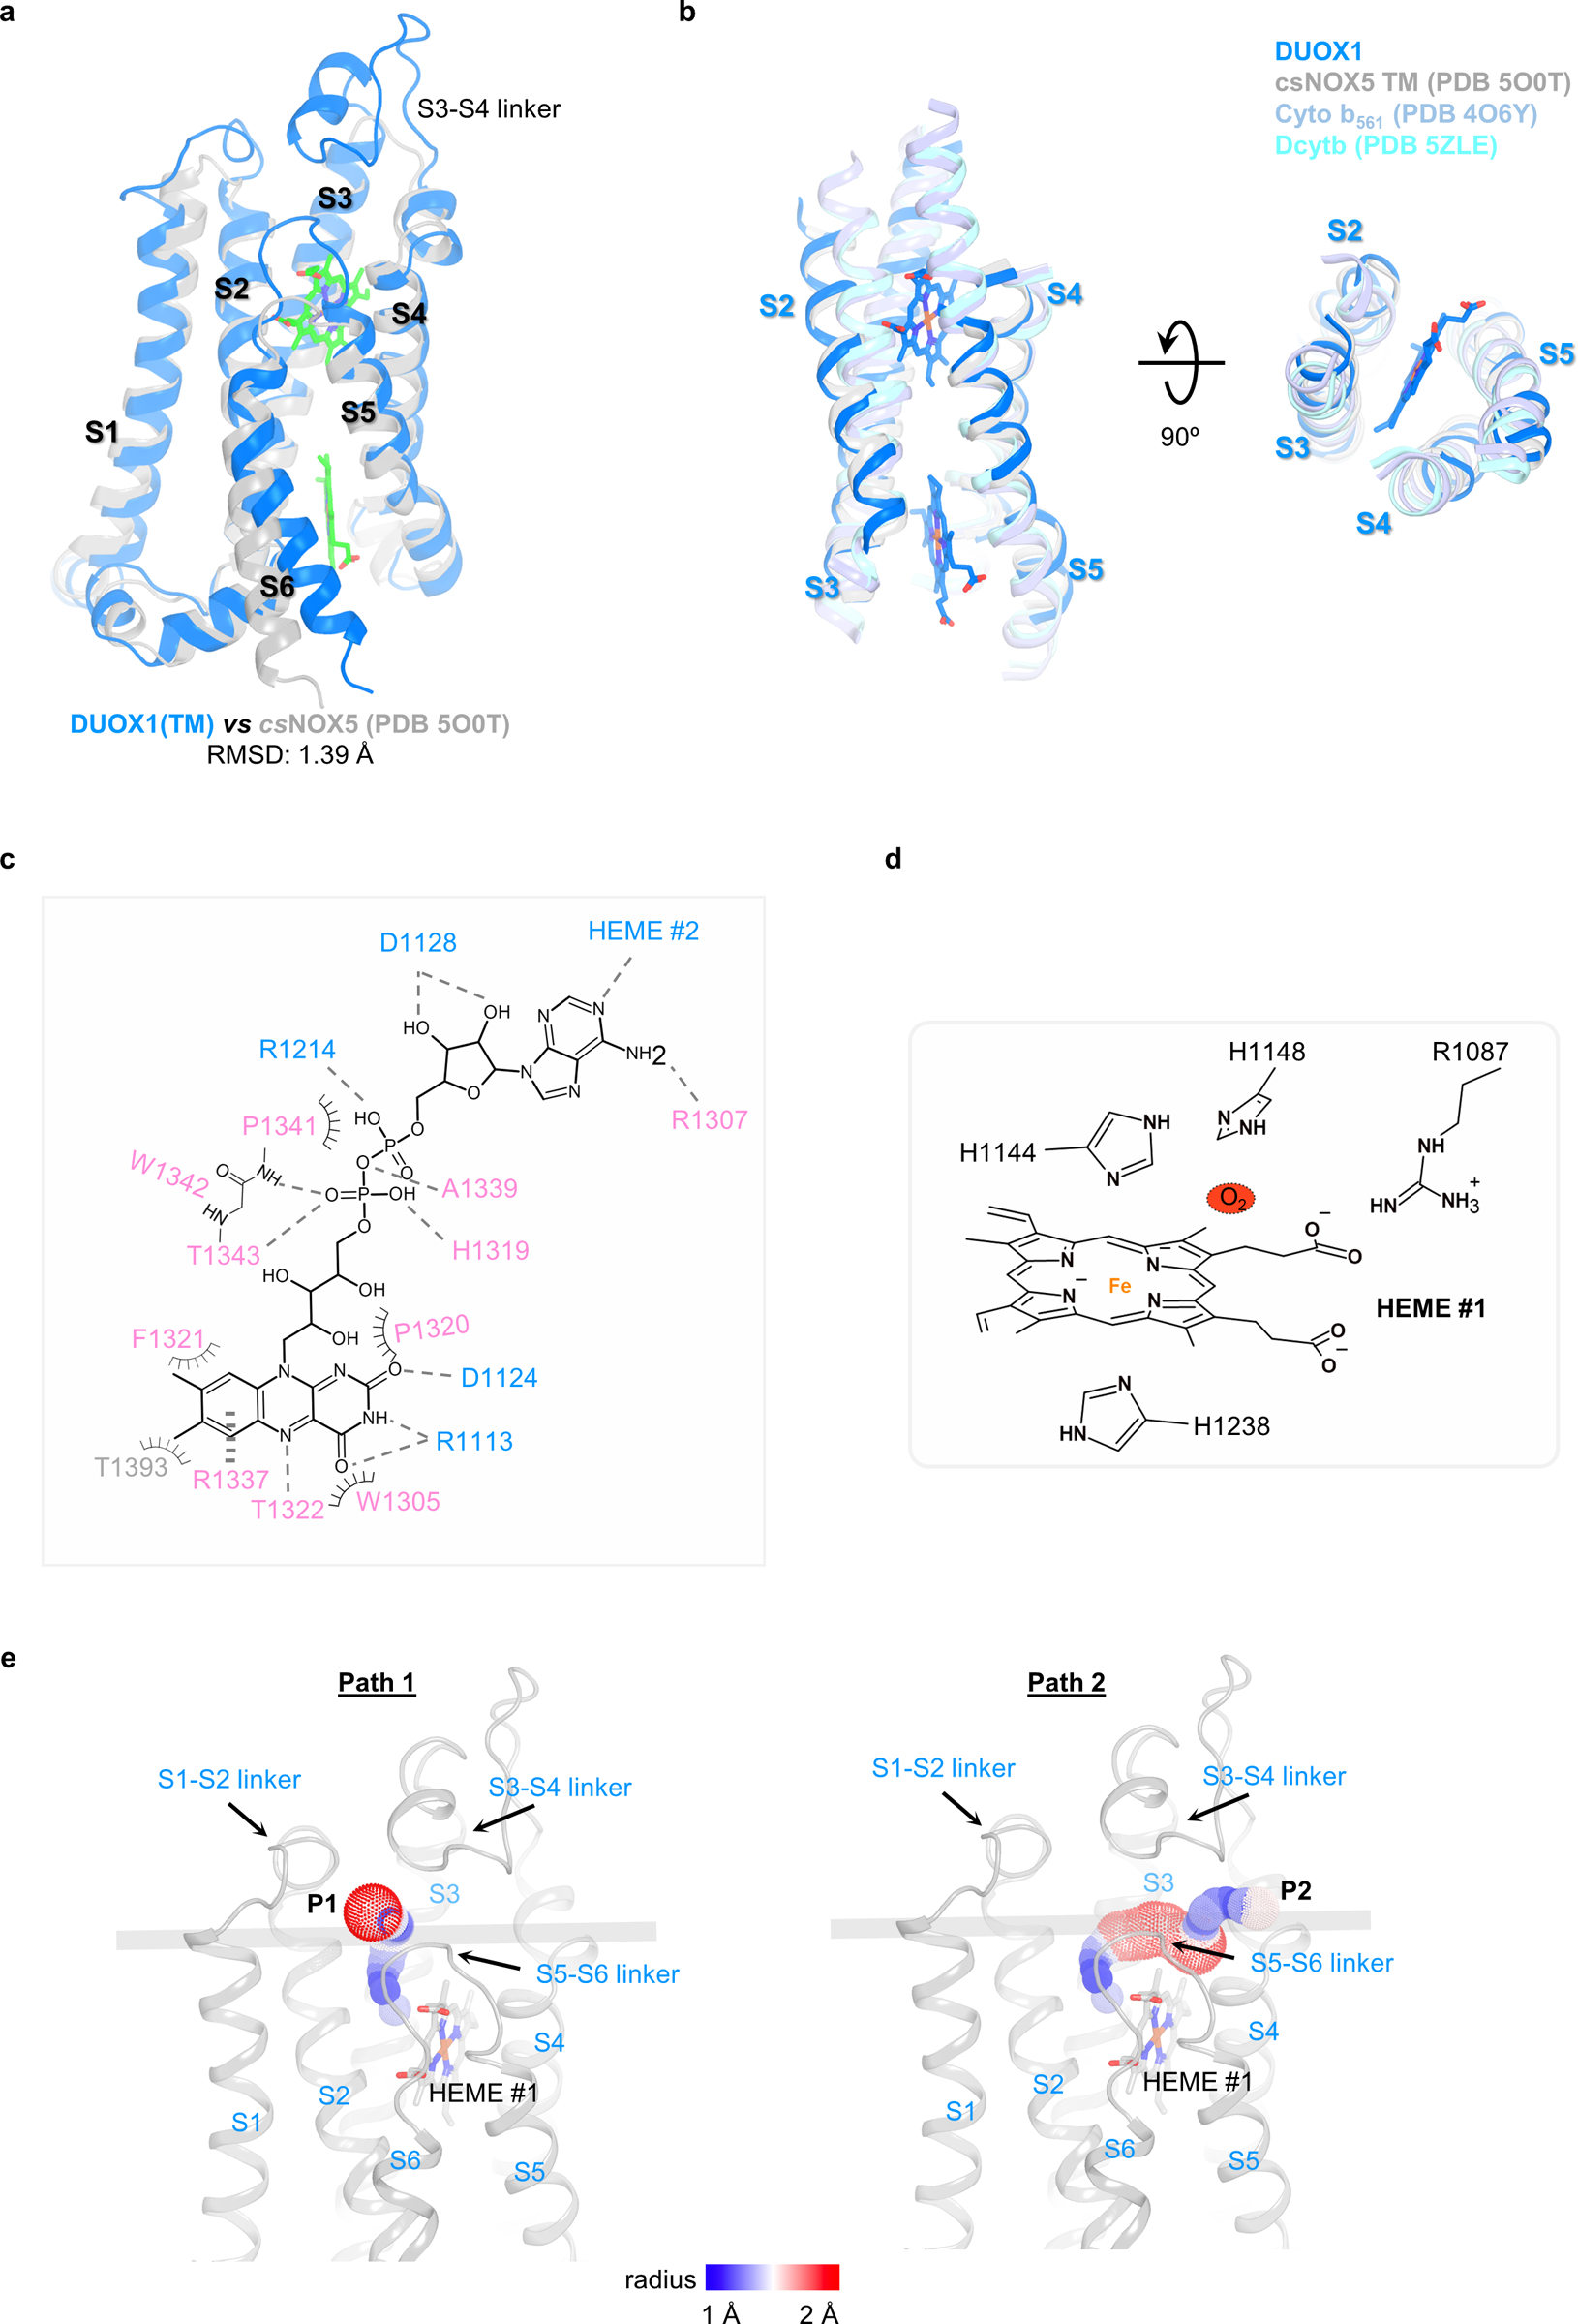
The structure of DUOX1 encompasses an extracellular peroxidase homology domain (PHD), a transmembrane domain (TMD) and the cytosolic part containing a Ca2+-binding domain (CaBD), a FAD-binding domain (FBD) and an NADPH-binding domain (NBD) (Fig. 1b). The key question regarding the PHD of DUOX1 is whether this domain has intrinsic peroxidase activity. Though the PHD of DUOX1 has an overall architecture of peroxidase with an RMSD of 1.3 Å when superimposed with the bovine lactoperoxidase (LPO, PDB 5B72) (Extended Data Fig. 2a)21, the facts that no heme density is observed in the cryo-EM map and histidines needed for heme coordination are missing in the putative binding pocket strongly suggest that the PHD domain of DUOX1 lacks heme-dependent peroxidase activity. This is consistent with previous biochemical analyses22 (Extended Data Fig. 2b). The structure also revealed two putative cation binding sites in the PHD of DUOX1. One likely accommodates a calcium ion, since it is located in the same position where the calcium-binding site of LPO is (Extended Data Fig. 2c)21. The other cation binding site is surrounded by the carboxyl group of Asp397, the hydroxyl group of Thr332 and main-chain carbonyl groups of Thr332, Arg395 and Val399 (Extended Data Fig. 2d). The TMD of DUOX1 contains seven transmembrane segments (S0–S6): S0 has a kink in the middle, and S1–S6 form a ferric oxidoreductase domain (Fig. 1b and Extended Data Fig. 3a). When superimposed with its bacteria homolog, Cylindrospermum stagnale NOX5 (csNOX5), whose ferric oxidoreductase domain structure has been determined using X-ray crystallography (PDB 5O0T)23, the TMD of DUOX1 has longer extracellular S3–S4 and S5–S6 linkers (Extended Data Fig. 3a). The S3–S4 linker contains a loop-helix-loop structure that inserts into a membrane-facing pocket of the PHD. The interaction is further stabilized by a disulfide bond between Cys118 of the PHD and Cys1165 of the S3–S4 linker (Extended Data Fig. 1c). The CaBD was flexible, and the cryo-EM density was too weak for model building. The FBD and NBD of DUOX1 will be discussed later.
The cryo-EM map enables the structural building of DUOXA1 that includes most of its extracellular domain and four of the five transmembrane helices (TM1–5) (Fig. 1c). In the extracellular domain, two short helices are held in a palm-like structure formed by four β strands and one loop. The N-terminal extracellular loop, TM1 and C-terminal loop of DUOXA1 are not “visible” in the current structure.
DUOX1 and DUOXA1 interact via three interfaces (Fig. 2). Interface #1, involving PHD of DUOX1 and the extracellular domain of DUOXA1, buries a surface area of ~987 Å2. Interface #1 involves Gln30 in DUOX1 (Fig. 2), whose mutation in the corresponding position (Gln36) of DUOX2, could lead to congenital hypothyroidism24. It is conceivable that mutation of Gln36 could disrupt the interaction between DUOX2 and DUOXA2. Interface #2 mainly involves the S5–S6 linker of DUOX1 and TM3 of DUOXA1, with contribution from four other residues: Gly1169 and Val1190 of DUOX1 and Leu134 and Asn171 of DUOXA1 (Fig. 2). In interface #3, S6 of DUOX1 interacts with TM3 and TM4 of DUOXA1 mainly through hydrophobic interactions (Fig. 2).
Fig. 2:
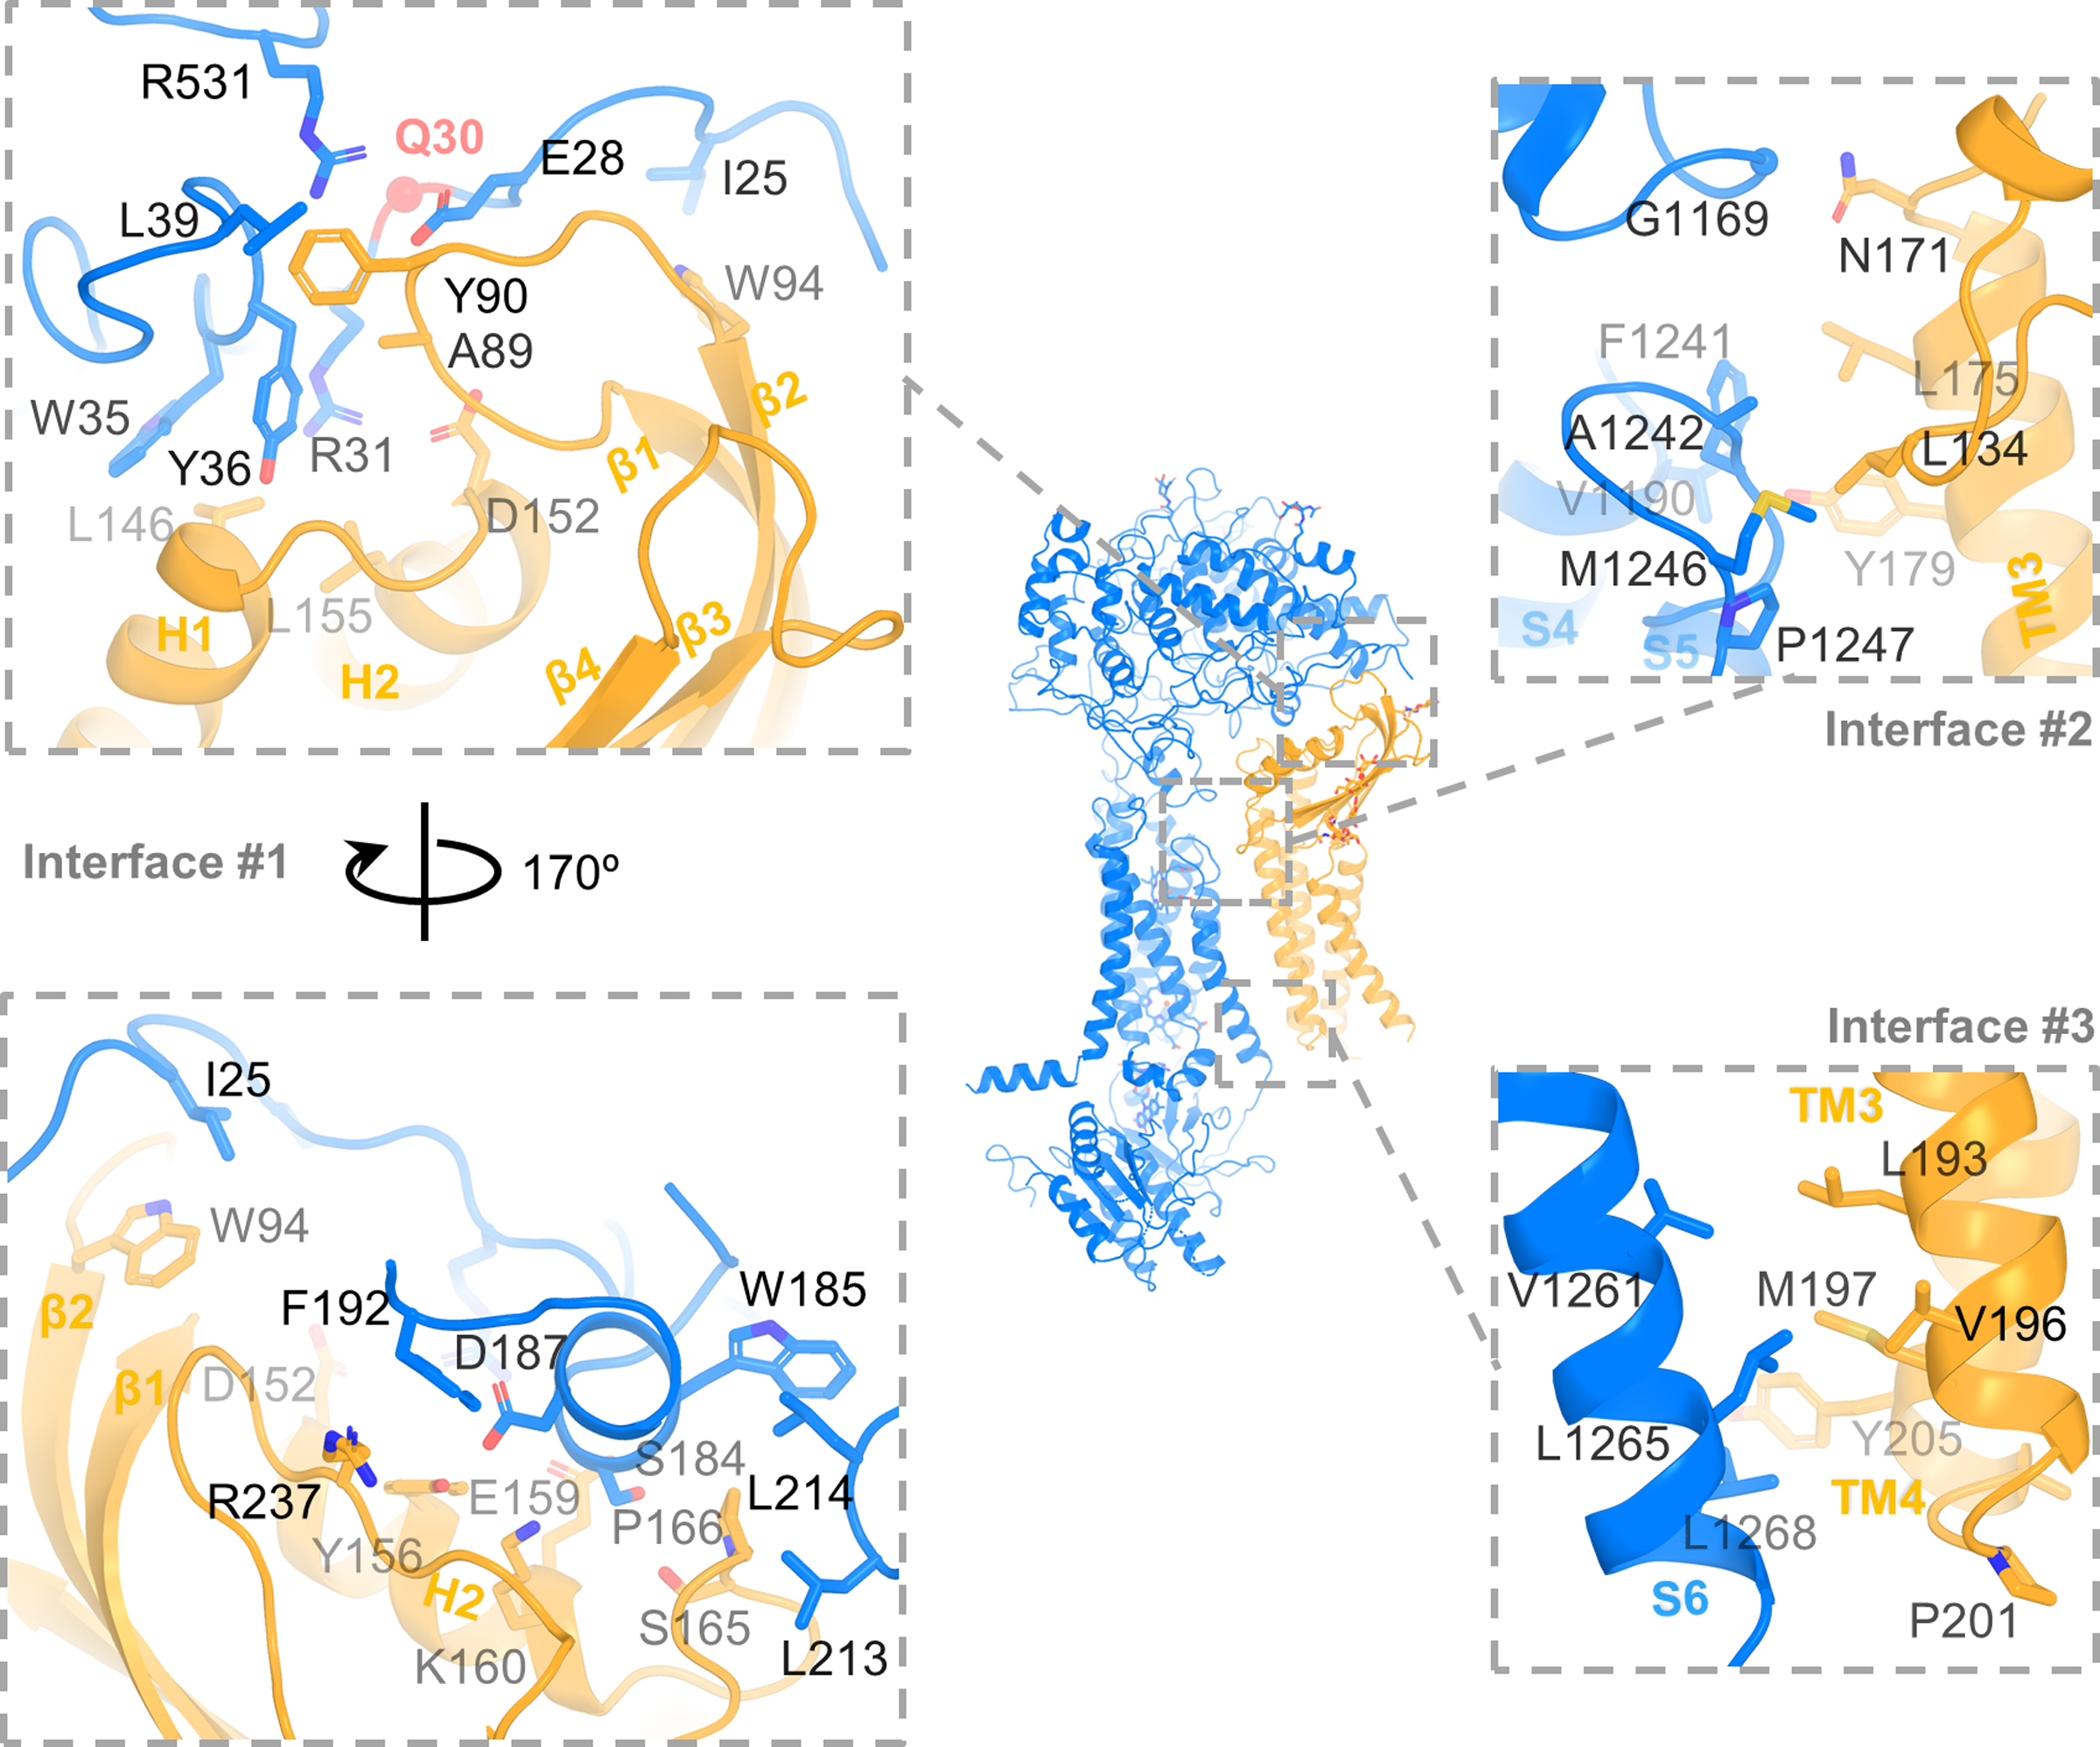
Interaction between DUOX1 and DUOXA1. Three major interfaces between DUOX1 and DUOXA1 are zoomed in and shown in dashed boxes. Left, Interface #1 between extracellular domains with two 170° rotational views. Q30 is shown as a red sphere. Top right: interface #2 at the extracellular side of the cell membrane. Bottom right: interface #3 at the cytosolic side of the cell membrane.
I observe four intramolecular disulfide bonds: Cys118-Cys1165, Cys345-Cys565, Cys364-Cys579 of DUOX1 and Cys167-Cys234 of DUOXA1 (Extended Data Fig. 1d). The Cys118-Cys1165 pair has been reported, but previously proposed intermolecular disulfide bridges, including the one involving Cys579 of DUOX1 that would substantially affect the trafficking and H2O2-generating activity of DUOX1–DUOXA1 complexes, were not observed in the current structure20,25. Instead, Cys579 is spatially distant from the DUOXA1 subunit and forms an intramolecular disulfide bond with Cys364. It remains puzzling why mutation of Cys579 but not Cys364 has a significant functional consequence26.
HEME- and FAD-binding sites
The structure of the DUOX1–DUOXA1 complex revealed all the vital small molecules (two hemes and one FAD) involved in electron transfer except NADPH. Two heme groups were observed in the TMD of DUOX1 (Fig. 3a). They are positioned almost orthogonally to the lipid bilayer and sandwiched within four continuous transmembrane helices S2–S5. A similar binding mode was also seen in different ferric oxidoreductases (Extended Data Fig. 3b)23,27,28. The heme group on the extracellular side (HEME #1) is coordinated between His1144 of S3 and His1238 of S5, whereas the other one on the cytoplasmic side (HEME #2) is sandwiched between His1130 of S3 and His1225 of S5 (Fig. 3b). His1225 is part of a 310 helix within S5, which is likely a conserved feature and has also been observed in the csNOX5 structure23. The metal-to-metal distance of the two hemes is ~20.6 Å, and the shortest interatomic distance is ~8.9 Å (Fig. 3b).
Fig. 3:
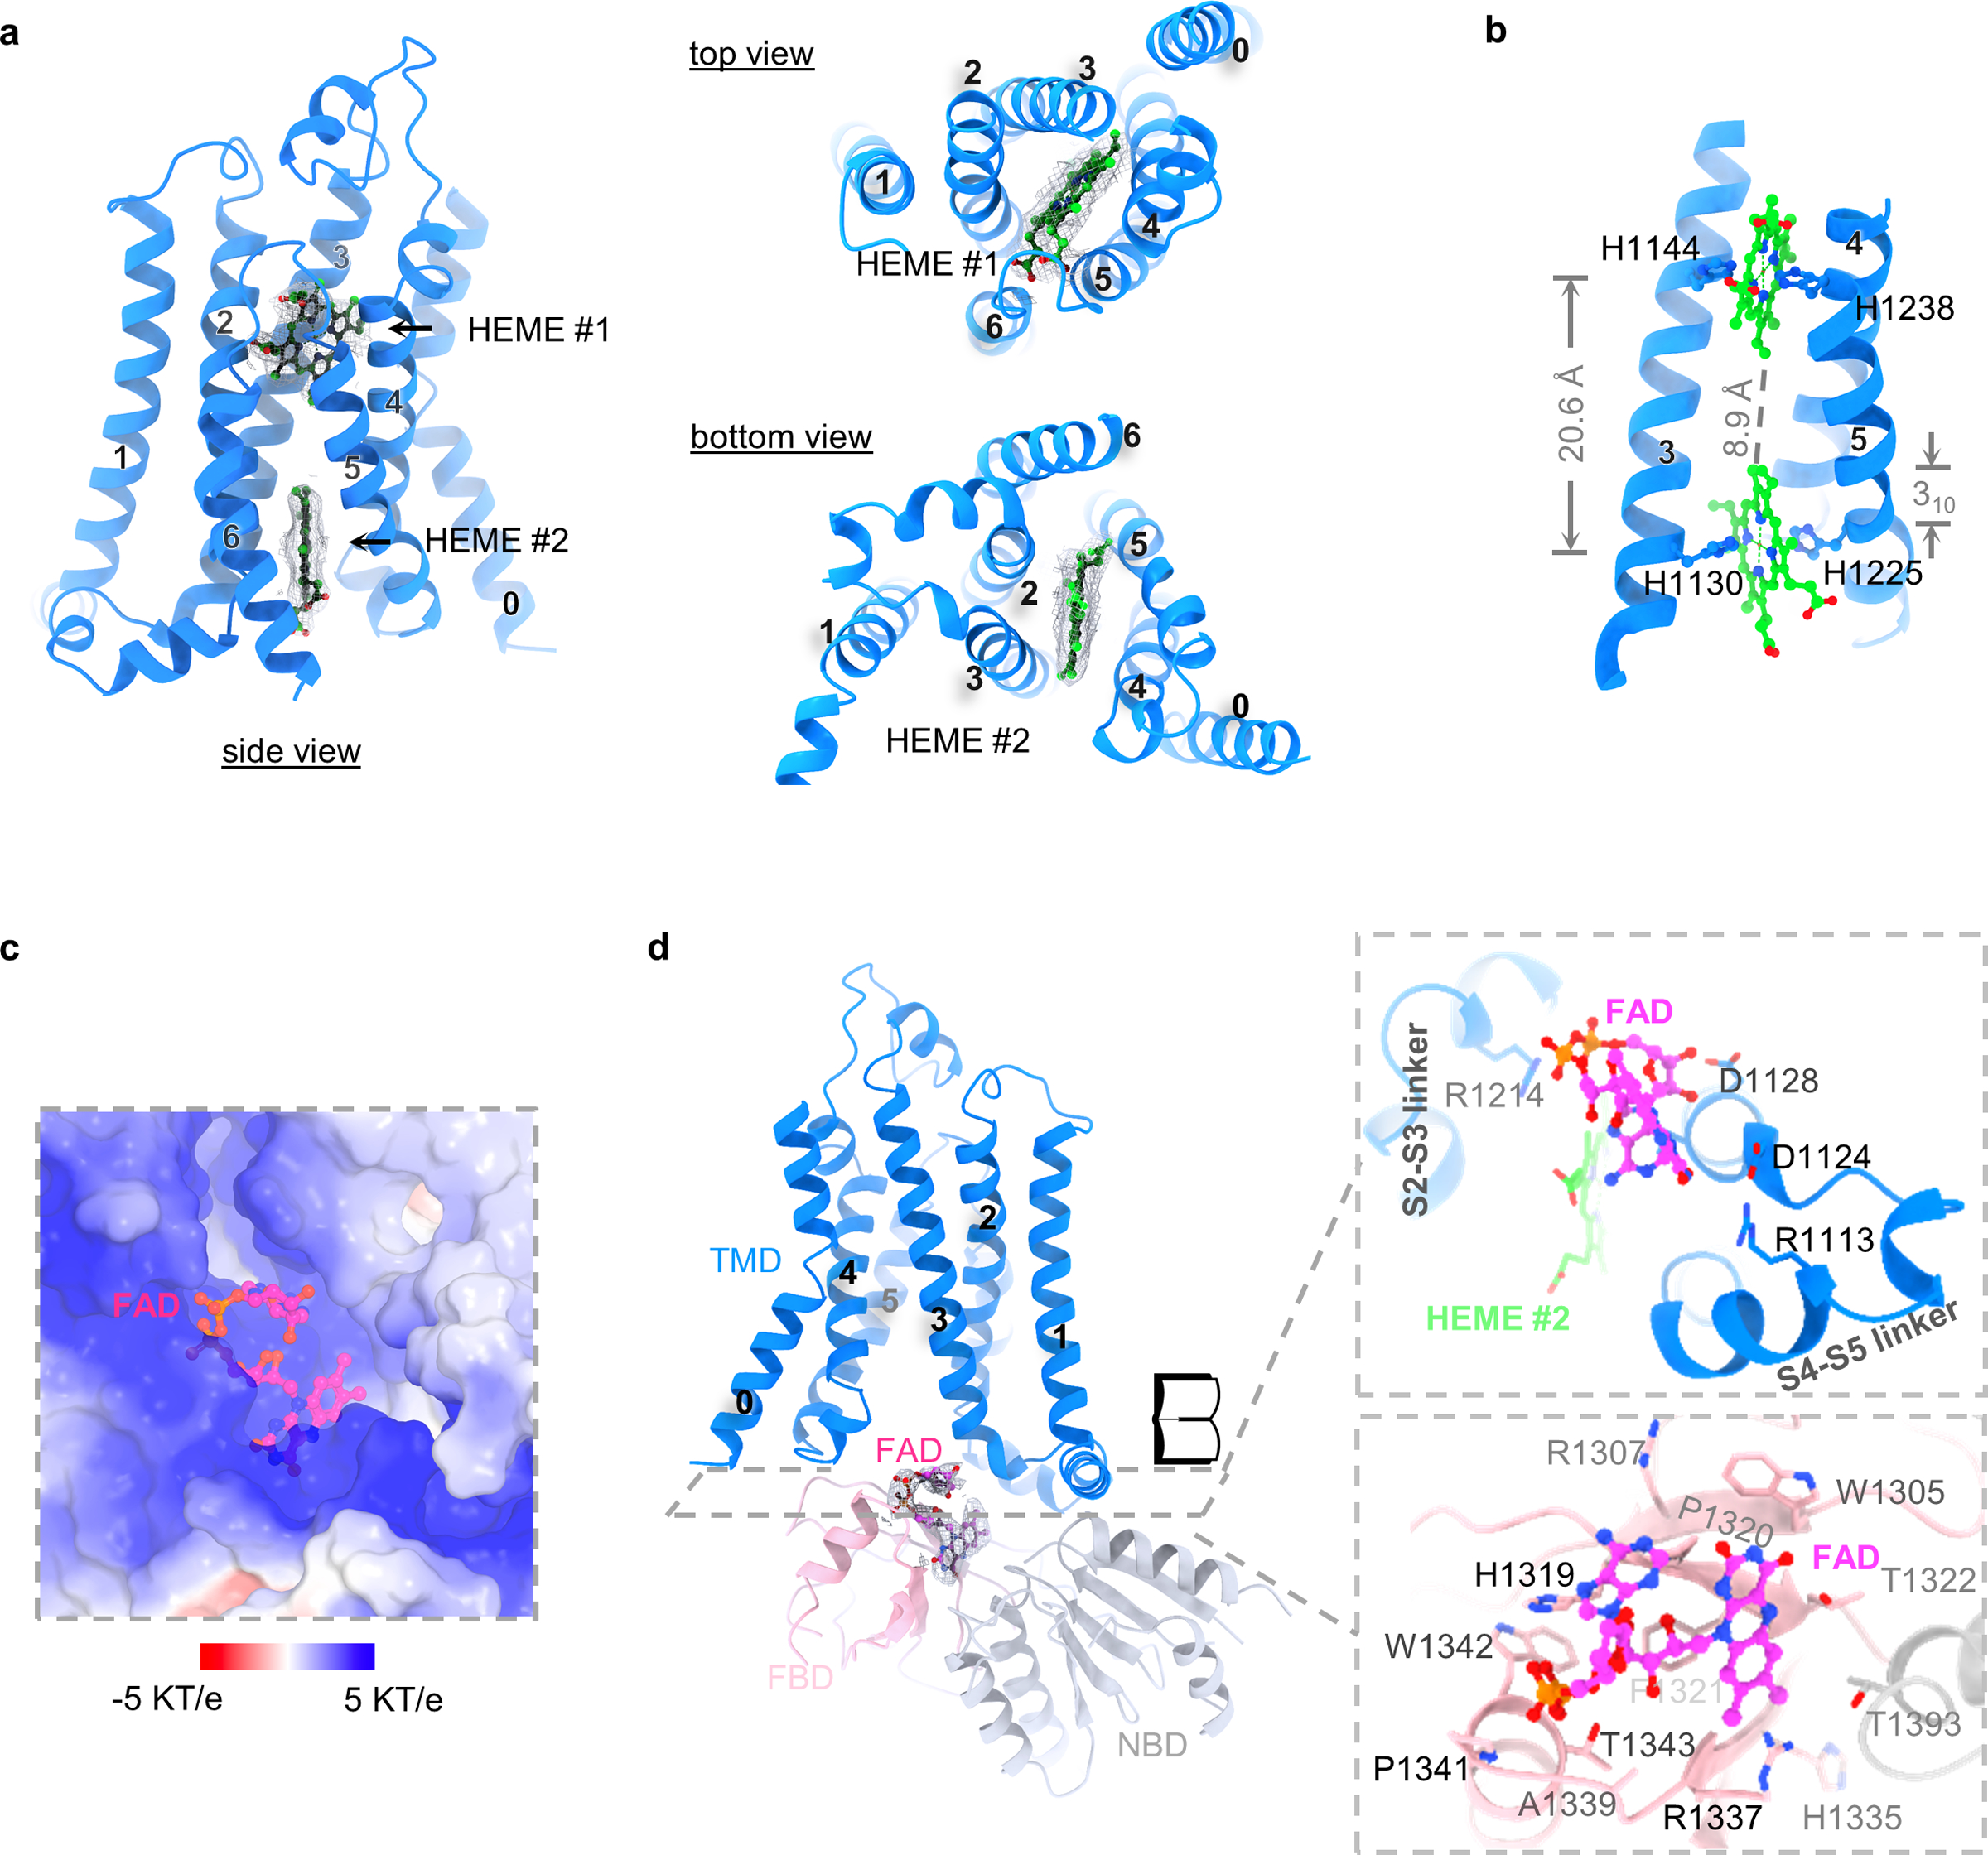
Heme- and FAD-binding sites. a, Densities of two heme groups from three different views. Heme groups are colored in green, densities in grey. b, Coordination of heme groups. Sidechains of histidines that are involved in ion coordination are shown. The distance between Fe ions as well as the 310 helix is indicated. c, The positively charged FAD-binding pocket. FAD is colored in magenta. The surface potential (-5 KT/e to 5 KT/e) is calculated using APBS plugin in PyMOL35. d, FAD-binding site. The density of FAD is shown and colored in grey. The open book view of the FAD-binding pocket is shown. TMD, FBD and NBD are colored in blue, light pink and grey, respectively.
Cryo-EM density consistent with a FAD molecule was identified in a positively charged pocket at the interface between transmembrane and cytoplasmic domains (Fig. 3c,d and Extended Data Fig. 3c). On the cytoplasmic side, the FAD-binding site is mainly formed by residues from the FBD (Fig. 3d). On the TMD side, FAD resides in a pocket composed by the S2–S3 linker, the S4–S5 linker and HEME #2 (Fig. 3d).
NADPH-binding site and the electron transfer pathway
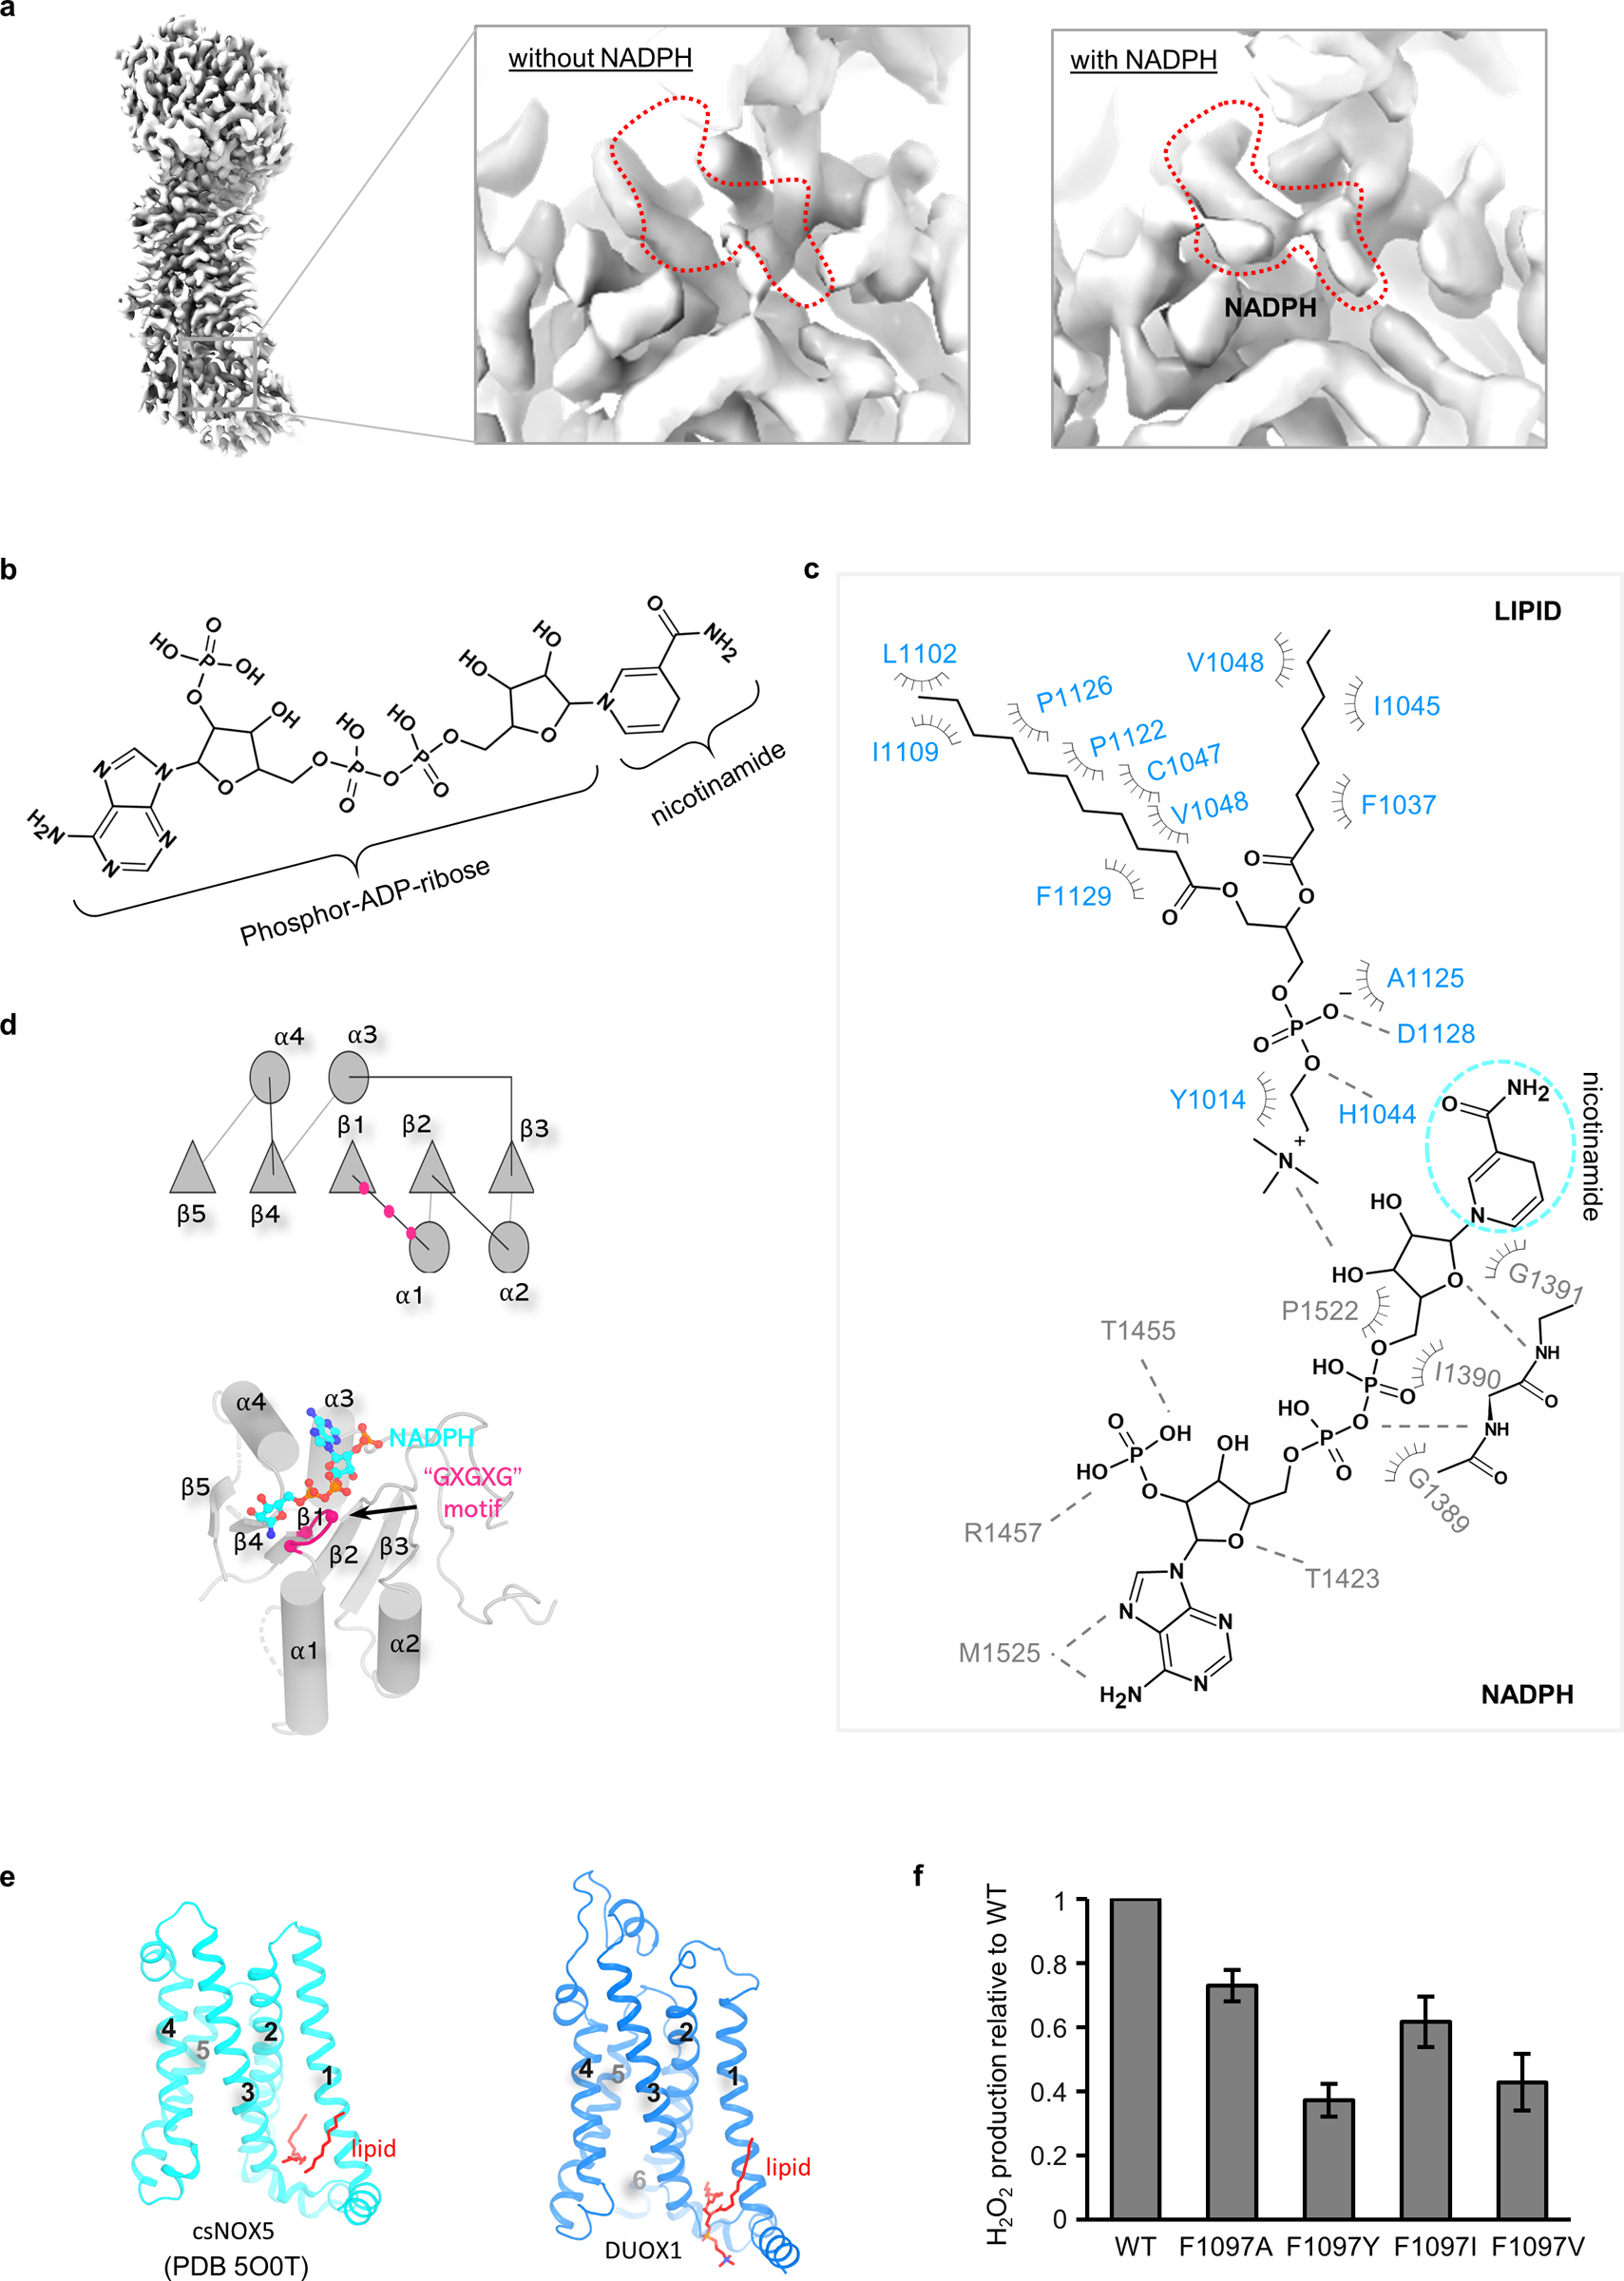
In order to map the complete electron transfer pathway, I then determined the cryo-EM structure of mouse DUOX1–DUOXA1 complex in the presence of NADPH at an overall resolution of 3.3 Å (Table 1). The map shows a potential density corresponding to an NADPH molecule in the NBD (Fig. 4a and Extended Data Fig. 4a). This extra density permits modeling of the “phosphor-ADP-ribose” part of NADPH, while there is little density for the nicotinamide group (Fig. 4a and Extended Data Fig. 4b,c).
Fig. 4:
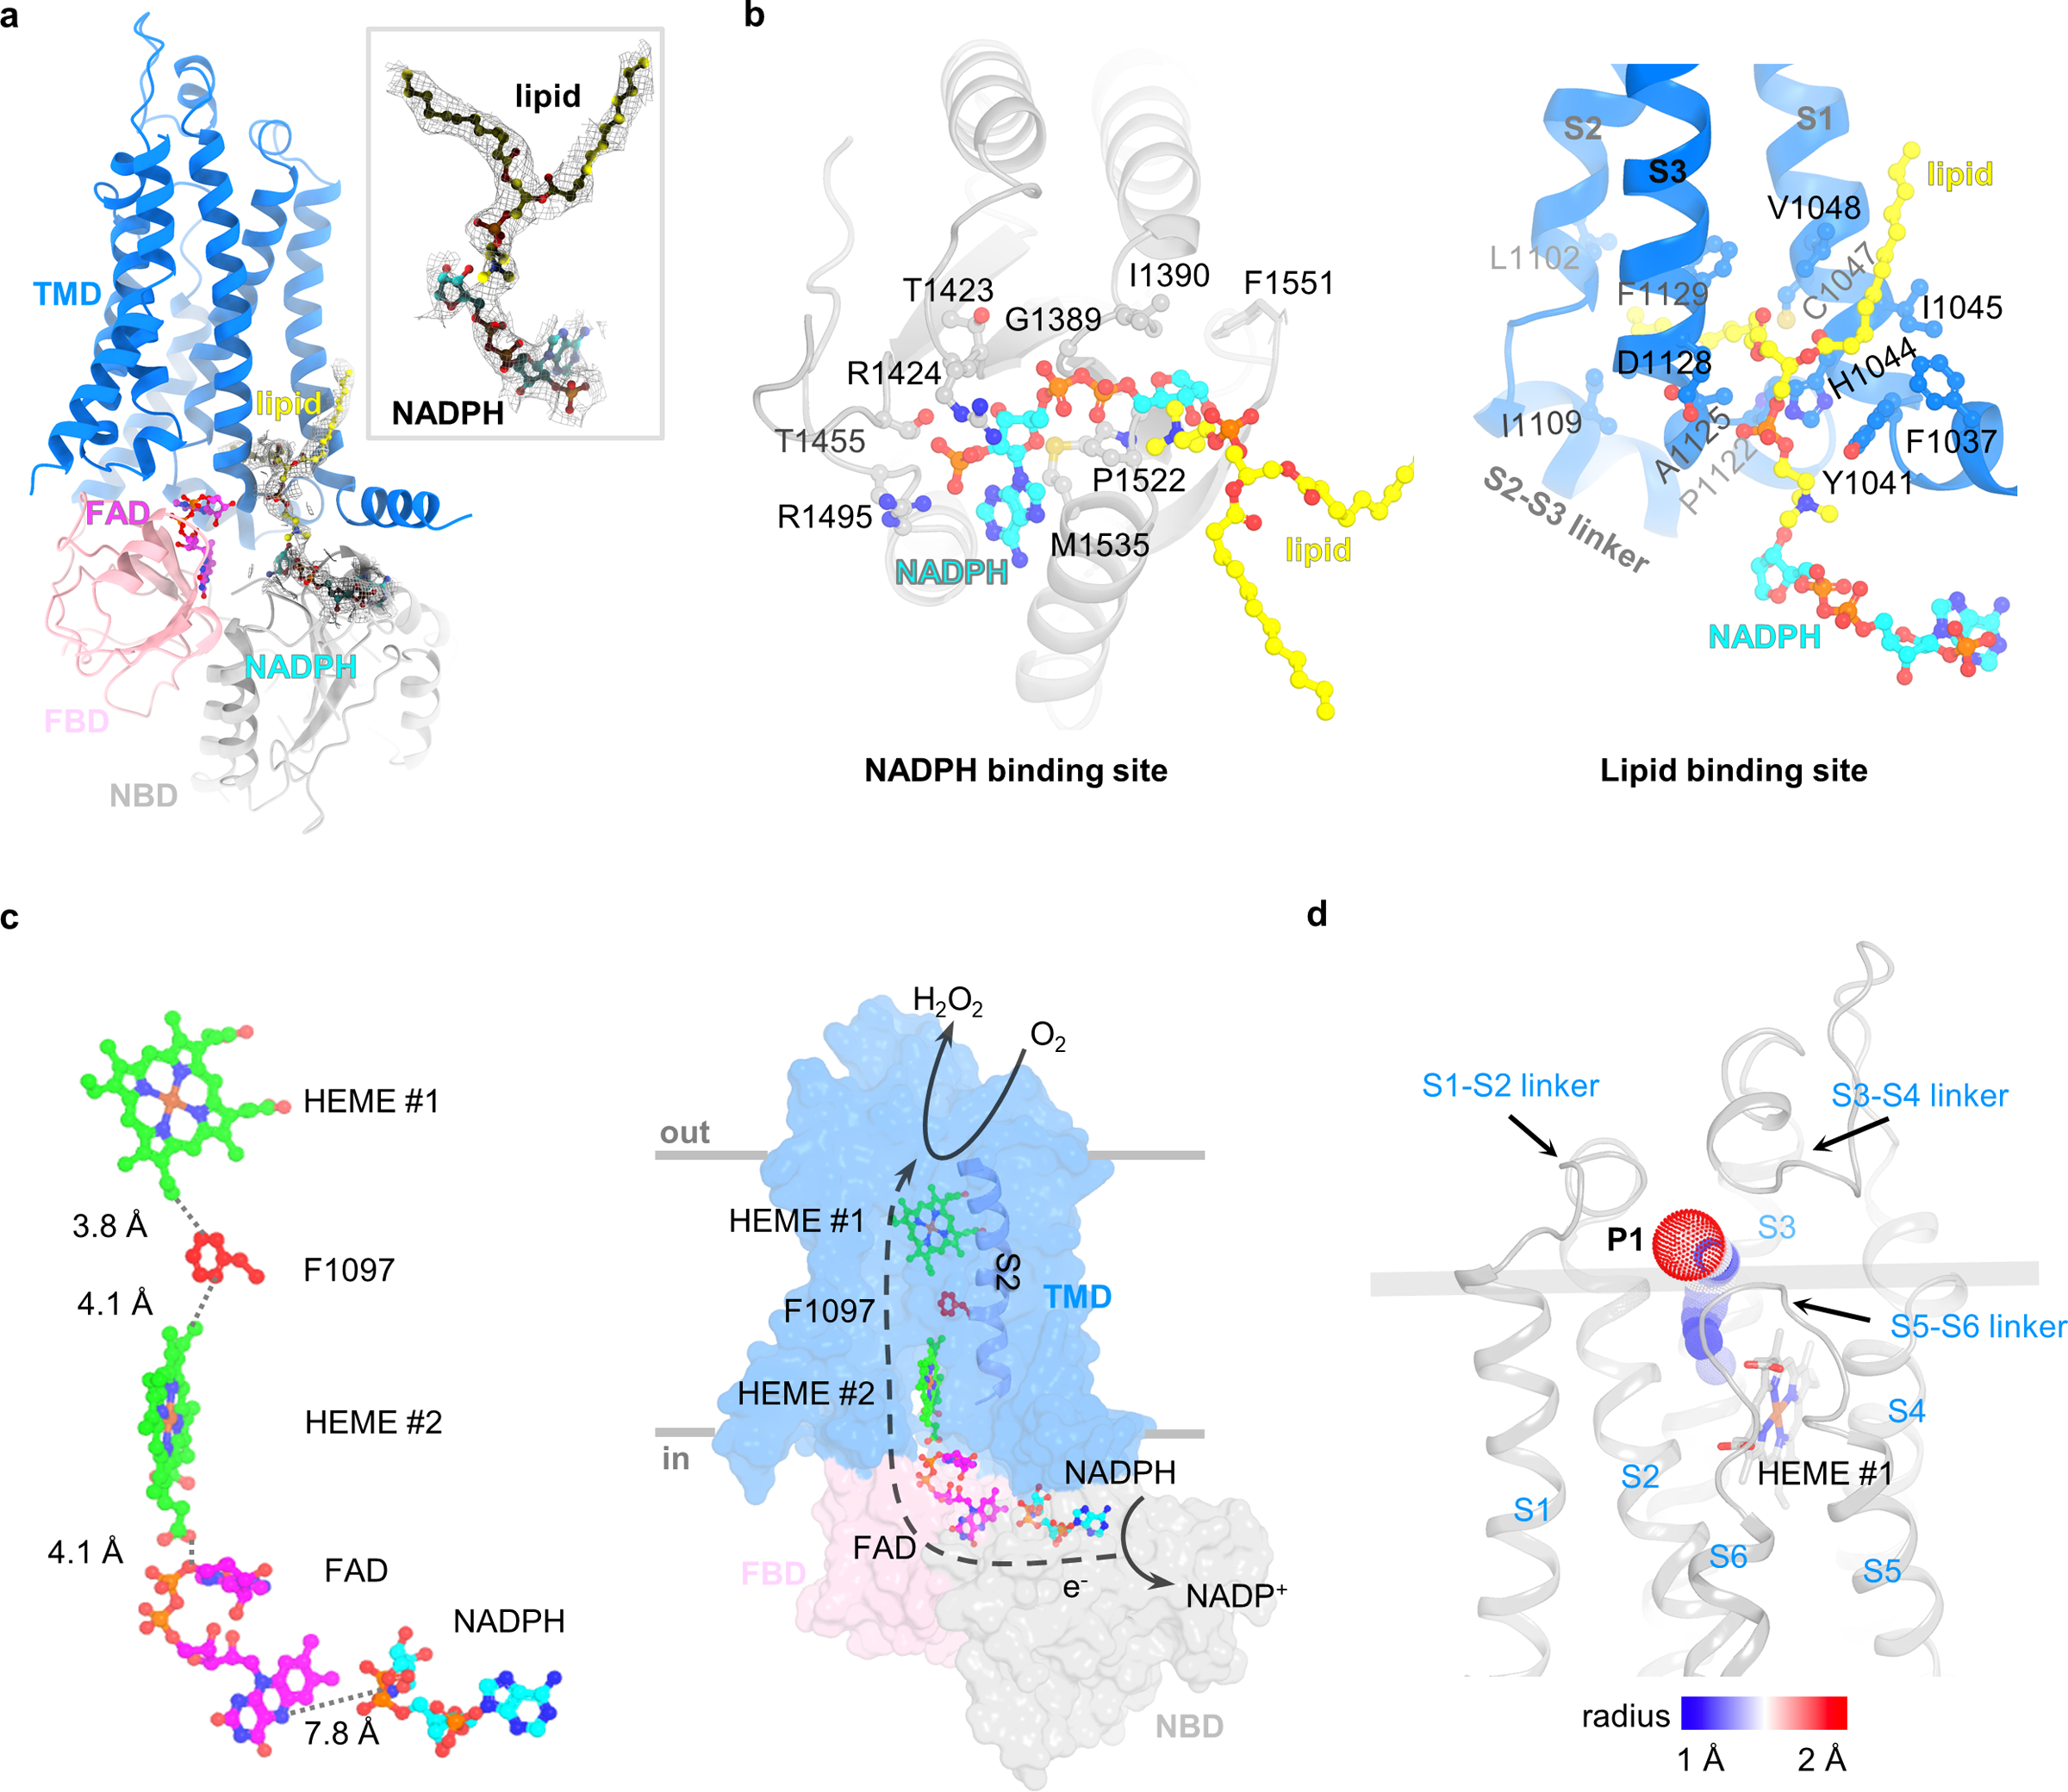
The NADPH-binding site and electron transfer path. a, The density of the NADPH. Densities of the NADPH and a nearby lipid molecule are shown. The FAD, NADPH and lipid molecules are shown as sticks and balls and colored in magenta, cyan and yellow, respectively. b, A lipid-mediated NADPH-binding site. Left: the NADPH-binding site. Right: the lipid-binding site. The NADPH and the lipid are colored in cyan and yellow, respectively. The side chains of residues surrounding NADPH and lipid molecules within 4 Å and last residue of DUOX1 (F1551) are shown as sticks and balls. c, The electron transfer path. Left: distances between players in the electron transfer path are calculated and shown. Right: a model of electron transfer and H2O2-production reaction. d, The potential oxygen entering and hydrogen peroxide exiting pathway (P1). Paths are calculated using Caver 3.0.3 plugin in PyMOL.
Binding of NADPH involves both the TMD and cytoplasmic NBD of DUOX1 (Fig. 4a,b). The NBD adopts a “Rossmann fold” characterized by an alternating motif of β-α-β secondary structures (Extended Data Fig. 4d)29. A conserved “GXGXG” motif is located in the tight loop connecting the first β-strand and α-helix, lying underneath the diphosphate group of NADPH (Extended Data Fig. 4d). On the membrane side, a lipid molecule with well-resolved density mediates the interaction between TMD and phospho-ADP-ribose part of NADPH (Fig. 4a,b and Extended Data Fig. 4c). Without knowing the lipid identity, a phosphatidylcholine (PC) molecule, the most abundant lipid in cell membranes, was modeled into the cryo-EM density (Fig. 4a,b). One alkyl chain of the lipid runs along with the S1 of DUOX1 and the other inserts into the gap between S1 and S3, lying on the top of the S2–S3 linker (Extended Data Fig. 4e). Intriguingly, two alkyl chains have also been observed in the csNOX5 structure in similar locations, suggesting an evolutionary conserved lipid-binding pocket (Extended Data Fig. 4e)23. The choline group of the lipid molecule points towards NADPH and directly interacts with its ribose group (Fig. 4b and Extended Data Fig. 4c).
I then explored the electron transfer path from the cytoplasmic NADPH to HEME #1 using the Pathways plugin in VMD30,31. One possible electron transfer pathway was identified as follows: NADPH → FAD → HEME #2 → Phe1097 → HEME #1. Accordingly, mutations of Phe1097 reduced H2O2 production (Extended Data Fig. 4f). A similar path was proposed in the csNOX5 study23 based on a structural model that was generated using two separately solved crystal structures of transmembrane (PDB 5O0T) and cytoplasmic (PDB 5O0X) domains of csNOX5. Therefore, a quantitative analysis of the complete electron transfer path was not possible. Here, by presenting the full-length structure of DUOX1, the position of structural elements, as well as the distances between them in the electron transfer path are mapped in atomic detail (Fig. 4c). As such, a complete picture depicting cross-membrane electron transfer from cytosolic NADPH to a specific oxygen-binding cavity was presented at the molecular level (Fig. 4c). Of note, the distance between NADPH and FAD (~7.8 Å) was measured in the absence of the nicotinamide group of NADPH. I believe this distance would be much shorter and in the range of electron transfer if a complete NADPH is present.
Oxygen-reacting center and potential O2 entering/H2O2 exiting paths were then analyzed. Similar to csNOX523, I was able to map a potential oxygen-binding pocket lined by His1144, His1148, Arg1087 and propionate group of HEME #1 (Extended Data Fig. 3d). In DUOX1, the presence of the long S3–S4 linker largely restricted the O2 entry or H2O2 exit. Using the oxygen-binding cavity as a starting point, I explored the possible O2 entering/H2O2 exiting paths using a probe radius of 1 Å and revealed two possible routes32 (Fig. 4d and Extended Data Fig. 3e). One path (P1) is surrounded by the S1–S2 linker, S2, the S3–S4 linker and the S5–S6 linker, while the other path (P2) goes through the tunnel shaped by the S3–S4 linker, S4 and the S5–S6 linker. Closer examination of both paths suggests that P1 is more likely to be physiologically relevant for the following reasons: first, the exit of P1, not P2 passes through the S1–S2 linker—a structural motif important for substrate release—mutations in which have been shown to affect the release of ROS by altering product specificity33 (Fig. 4d); second, the exit of P2 is partially blocked by the membrane bilayer (Extended Data Fig. 3e); lastly, the tunnel lengths from the proposed oxygen binding site to extracellular solvent are calculated to be 13.4 Å and 22.0 Å for P1 and P2, respectively, suggesting that P1 is a shorter path for substrate entry and product release with lower energy cost32.
Structure of DUOX1–DUOXA1 in a “dimer-of-dimer” configuration
A structure of DUOX1–DUOXA1 in a dimer-of-dimer configuration was determined at an overall resolution of 2.7 Å (Extended Data Fig. 1b and Table 1). The cryo-EM map permits modeling of extracellular domains and TMDs, while cytoplasmic domains were too flexible to be resolved (Fig. 5a and Supplementary Video 1). Structurally, DUOX1 in the dimer-of-dimer state shows two major differences: first, the cytoplasmic domain is flexible; second, the TMD displaces about 6° (Extended Data Fig. 5a), a movement that could potentially disrupt the interface between the transmembrane and cytoplasmic domains of DUOX1. The DUOXA1 subunit shows one major conformational change—the disordered N-terminal loop and TM1 become structurally ordered and contribute to the formation of DUOX1–DUOXA1 dimer of dimers (Extended Data Fig. 5b).
Fig. 5:
Structure of DUOX1–DUOXA1 in dimer-of-dimer configuration. a, Cryo-EM density map of DUOX1–DUOXA1 in the dimer-of-dimer configuration in three different views. Unexplained or lipid densities are colored in white. The arrangement of the dimer of dimer is depicted using cartoon cycles. b, The structural model of DUOX1–DUOXA1 in the dimer-of-dimer configuration. Sugars, lipids and hemes are shown as sticks and balls. c, Interaction between DUOX1 and DUOXA1. The lipid molecule between DUOX1 and DUOXA1 is colored in black. DUOX1 is presented as surface. TM4 and TM5 of DUOXA1 are not shown for clarity. The N-terminal loop of DUOXA1 is shown as cartoon with side chains.
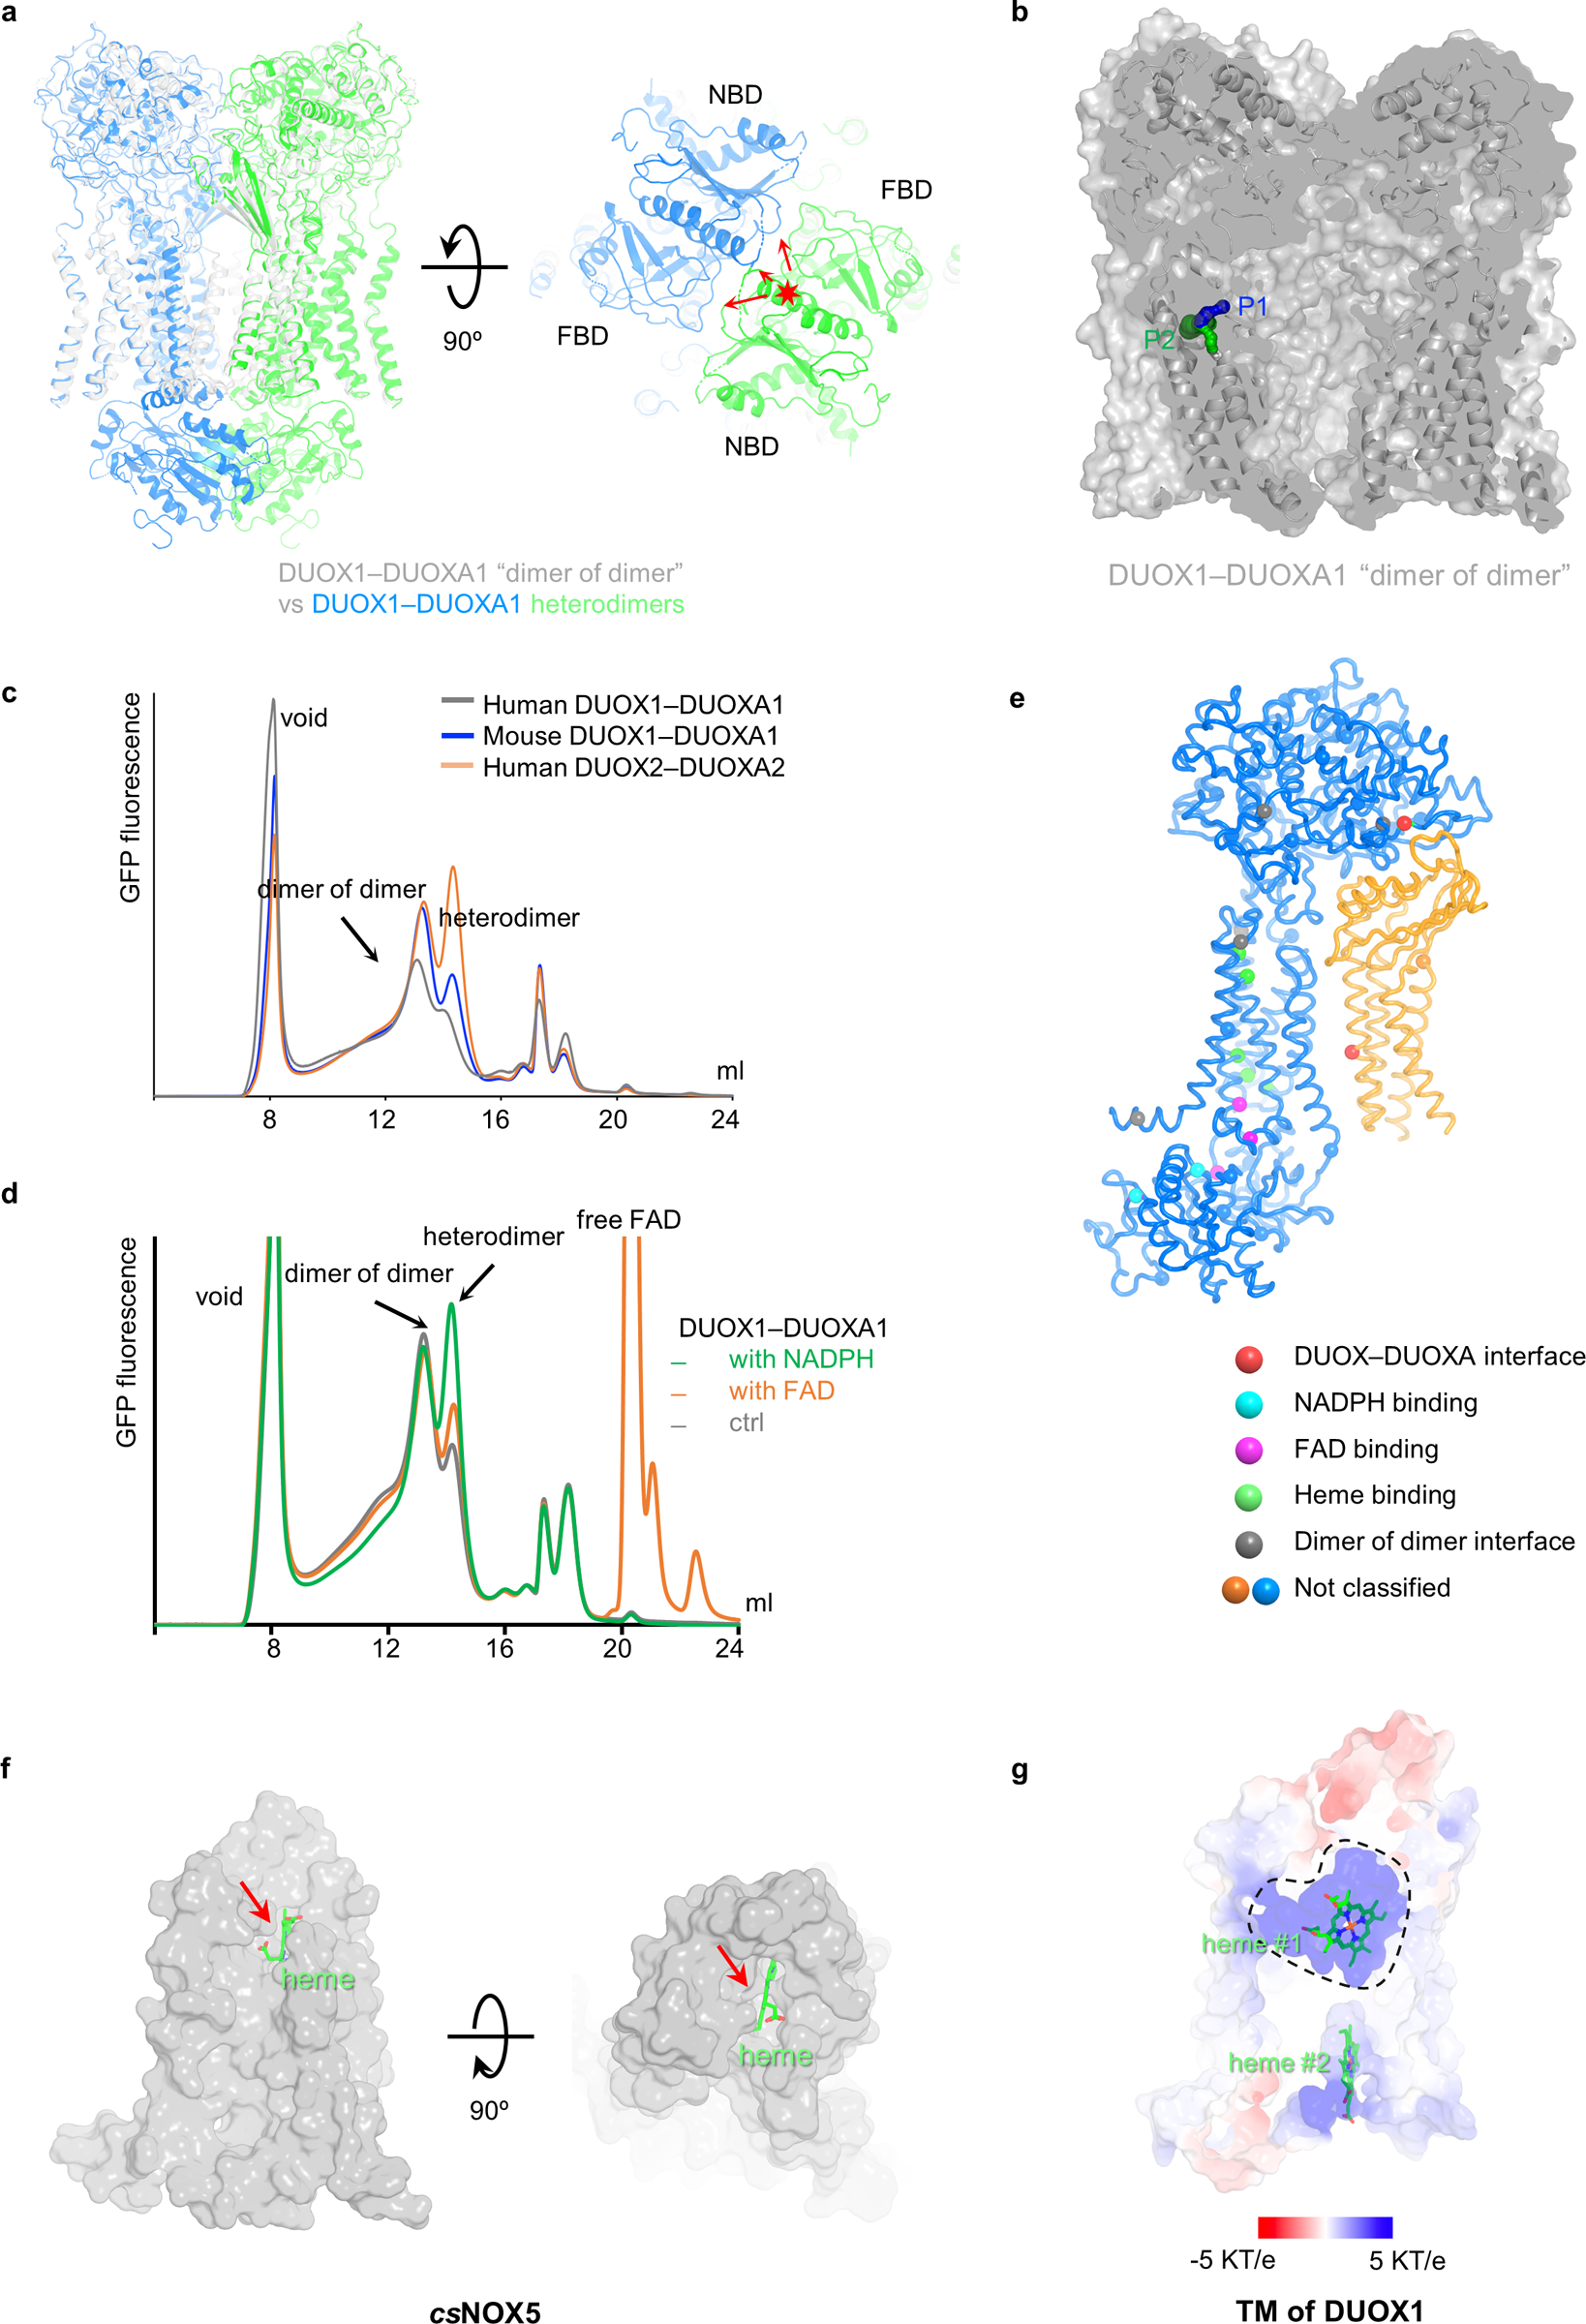
The dimer-of-dimer state adopts an X–A–X’–A’ arrangement with a two-fold symmetry axis running perpendicular to the cell membrane (Fig. 5a). Here, X–A or X’–A’ stands for one DUOX1–DUOXA1 heterodimer. A new interface between DUOX1 and DUOXA1 subunits is formed by multiple structural motifs involving protein, lipid and glycans. First, the N-terminal extracellular loop of DUOXA1, which was disordered in DUOX1–DUOXA1 heterodimer, wraps around the “neck” of DUOX1 (the region between PHD and TMD) (Fig. 5b,c and Extended Data Fig. 5c). Second, there are two interfaces in the transmembrane region: one between TM1-TM2 linker of DUOXA1 and the amphipathic helix priming S1 of DUOX1 and the other between TM1 of DUOXA1 and S1 of DUOX1 mediated by a lipid molecule (Extended Data Fig. 5d). Again, a PC molecule was modeled here in the cryo-EM map without knowing the lipid identity. Thirdly, linkers connecting β1-β2, β3-β4 and H1–H2 of DUOXA1 are touching the PHD of DUOX1 (Fig. 5c). The N-acetylgalactosamine modification on Asn121 of β3-β4 linker is also located on the interface (Fig. 5c). Lastly, the glycan chain linked to Asn109 of DUOXA1, which displays a high-mannose linkage with 11 sugar moieties, inserts into the neck region of DUOX1 (Fig. 5c and Extended Data Fig. 5c). Furthermore, this long glycan chain is localized in a position where it bridges together the N-terminal loop, the lipid molecule and β3-β4 linker of DUOXA1, all of which are structural motifs that contribute to DUOX1–DUOXA1 (X-A’ or X’-A) interaction (Fig. 5c). In addition to the interface between DUOX1 and DUOXA1, there are direct interactions between PHDs of DUOX1 (Extended Data Fig. 5e). PHDs of DUOX1 form a homodimer resembling the dimeric myeloperoxidase (MPO, PDB 1MYP) with an inter-subunit rotation of ~40° (Extended Data Fig. 5e)34.
A closer examination of the dimer-of-dimer configuration of the DUOX1–DUOXA1 complex strongly indicates that this conformation represents an inactive state of the enzyme complex. This hypothesis is supported by the following observations. First, cytoplasmic domains are flexible and not primed for electron transfer (Fig. 5a and Supplementary Video 1). Second, the docking of two DUOX1–DUOXA1 heterodimers into the dimer-of-dimer structure will cause steric clashes between NBDs and between the NBD and FBD (Extended Data Fig. 6a). Third, the formation of the dimer-of-dimer complex creates an almost completely sealed solvent cavity, which encapsulates the potential O2 entry/H2O2 exiting path (“P1” in Fig. 4d) and could thus hinder the oxygen entry and hydrogen peroxide release (Extended Data Fig. 6b).
An activity assay was also carried out to examine the function of purified DUOX1–DUOXA1 complexes in different states. The assay monitors the fluorescence reduction coupled to NADPH oxidation and H2O2 production9,16,17. As the two states could not be cleanly separated, DUOX1–DUOXA1 complexes from three different fractions of the size exclusion chromatography were used in the assay (Fig. 6a). Each fraction is a mixture of DUOX1–DUOXA1 in both heterodimeric and dimer-of-dimer states—the earlier the elution fraction is, the higher the population of the dimer-of-dimer complexes is. Resulted data showed that protein sample from earlier fractions was less active than later fractions when the same amount of DUOX1–DUOXA1 protein was used (Fig. 6a), supporting the hypothesis that the dimer-of-dimer configuration represents an inactive state of the enzyme complex.
Fig. 6:
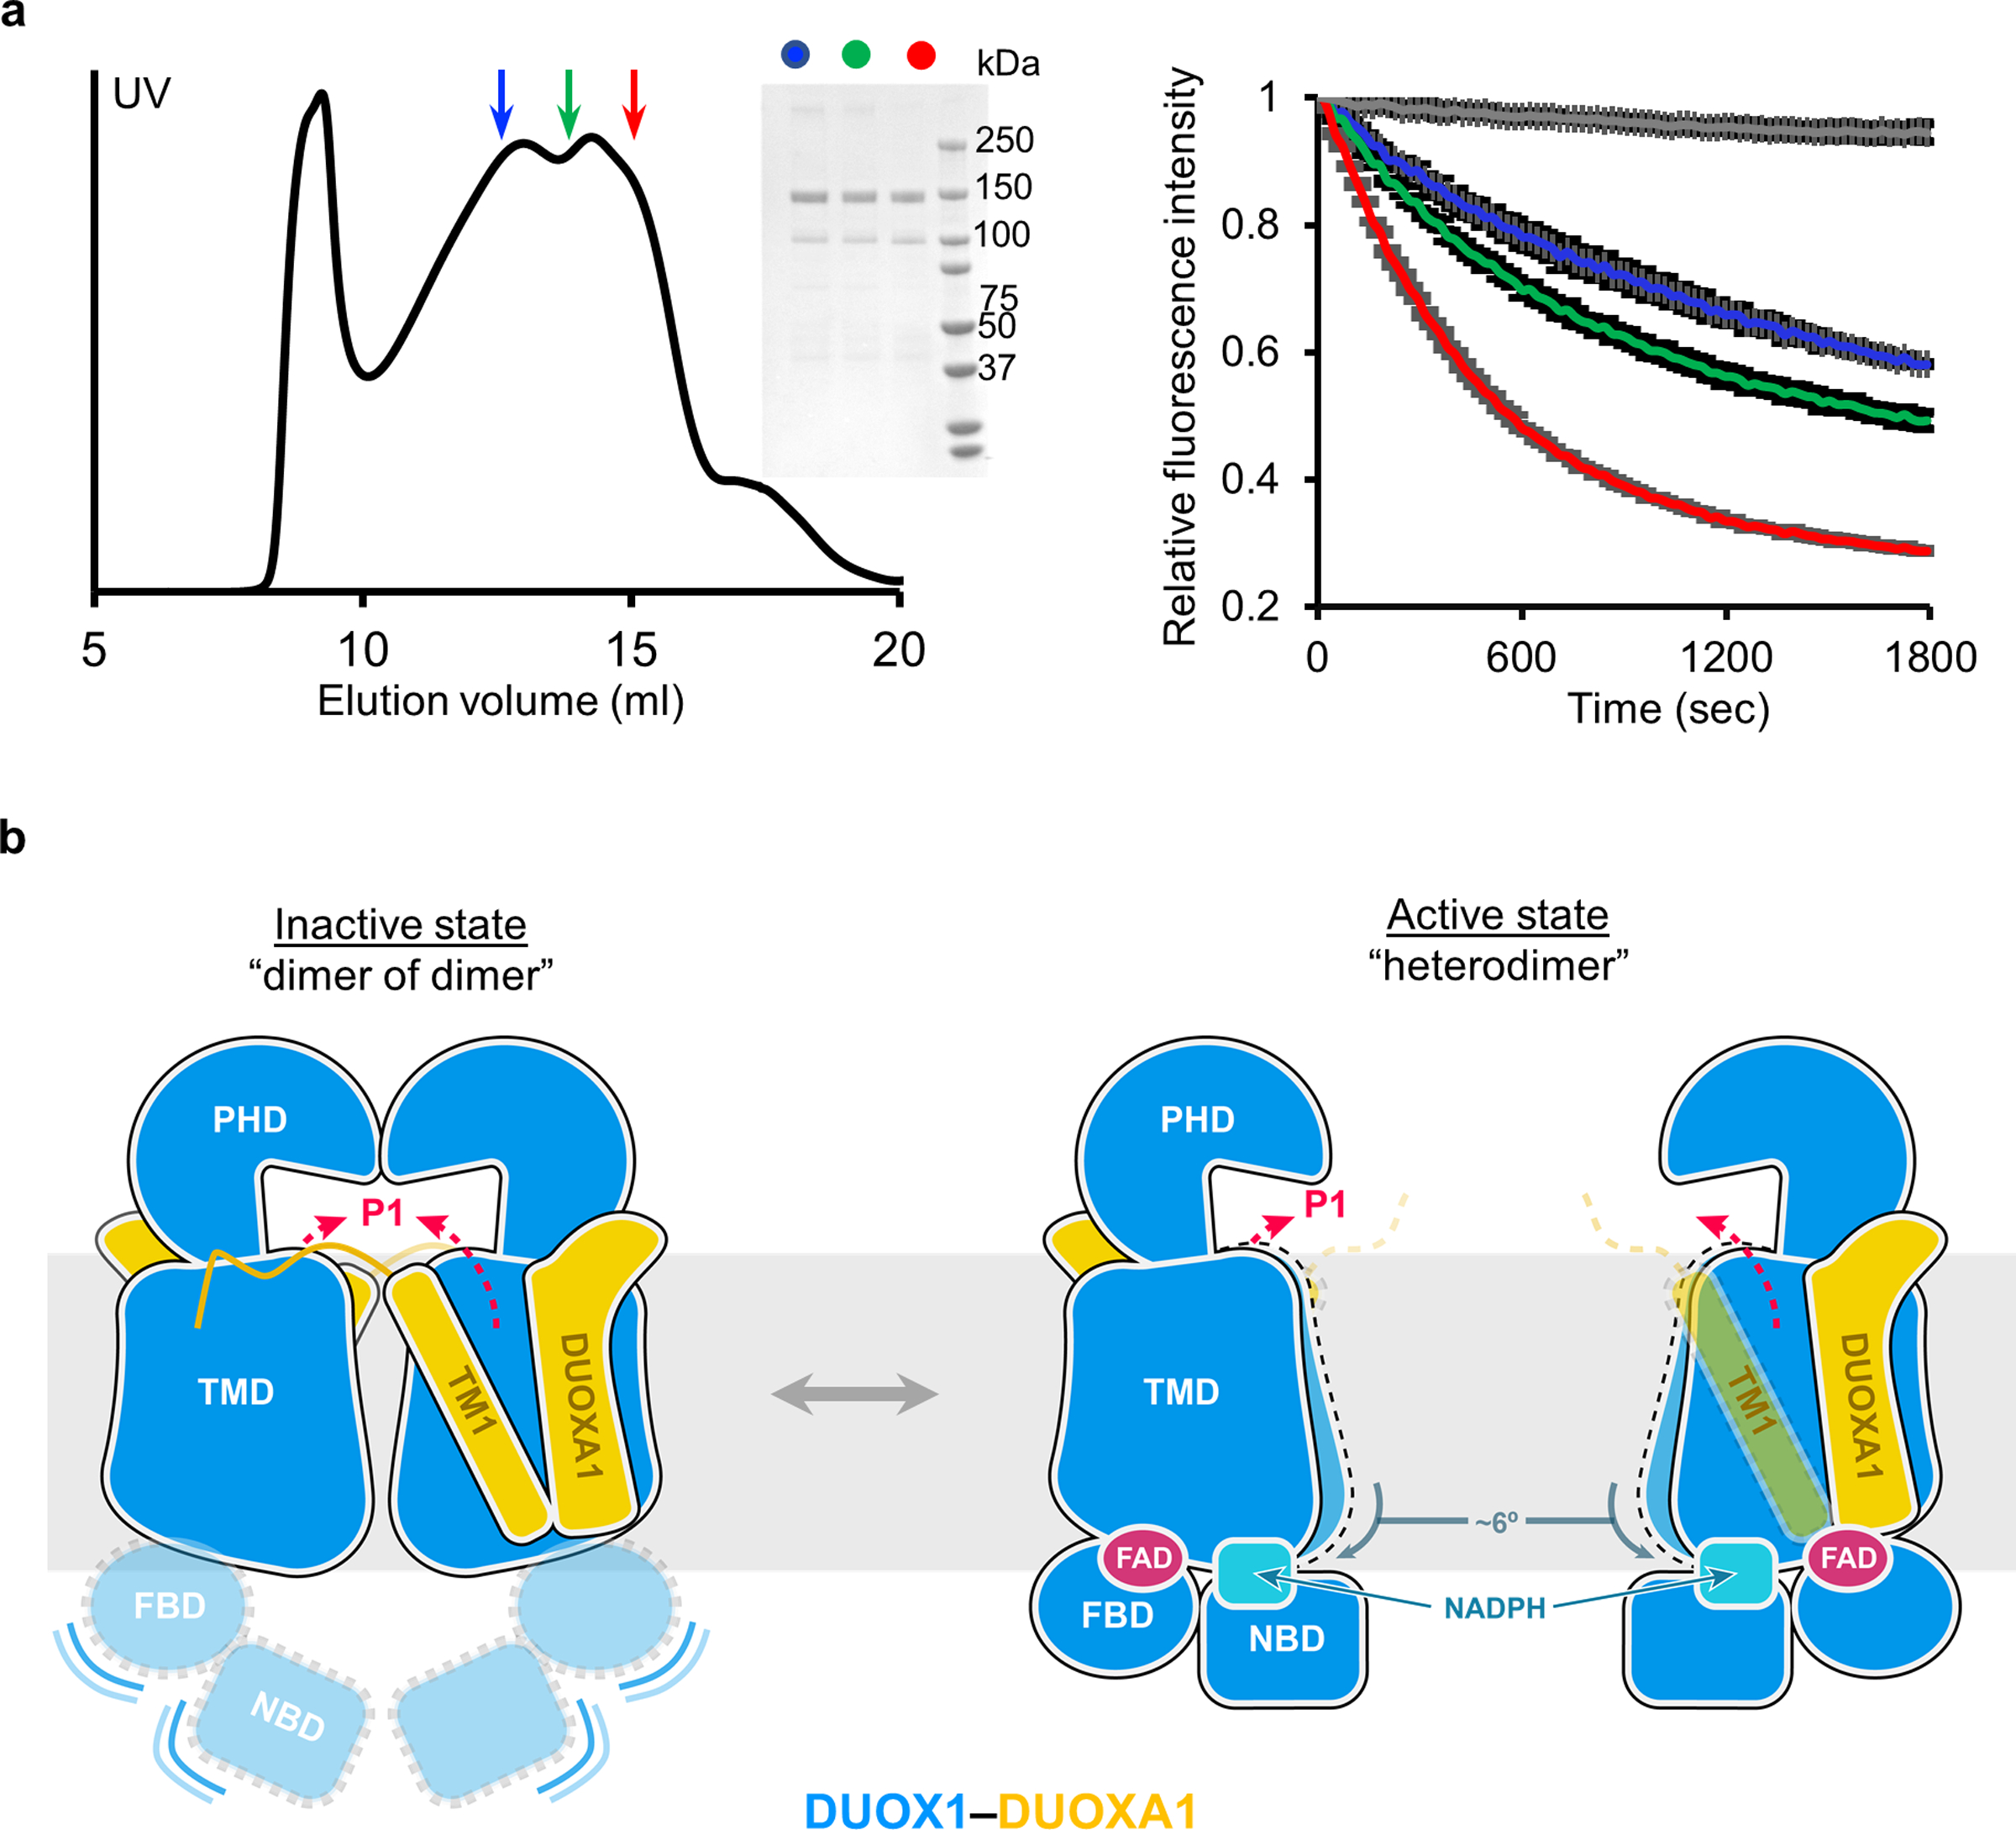
The dimer-of-dimer conformation of DUOX1–DUOXA1 represents an inactivated state. a, The activity of DUOX1–DUOXA1 from different fractions of size exclusion chromatography. Left: size exclusion chromatography of the DUOX1–DUOXA1 complex. Fractions taken for activity assay are indicated by arrows colored in blue, green and red, respectively. Middle: SDS-PAGE of the fractions taken from the left panel. Right: activity of the fractions from the left panel (same color code). The grey trace is the negative control. b, A model suggesting activation of DUOX1–DUOXA1 from dimer-of-dimer state to heterodimer state. DUOXA1 is not shown for clarity. The PHD, TMD, FBD and NBD of DUOX1 are colored in blue and shown using different shapes. DUOXA1 is colored in orange, and its N-terminal loop and TM1 are shown. Red dashed arrows indicate the oxygen entering or hydrogen peroxide exiting path (P1 in Fig. 4d).
Discussion
In this study, I determined cryo-EM structures of the DUOX1–DUOXA1 complex in both heterodimeric and dimer-of-dimer states. Structural and biochemical analyses led to the hypothesis posing an additional regulatory mechanism on the DUOX1–DUOXA1 complex through protein oligomerization: activation of DUOX1–DUOXA1 undergoes conformational changes from an inactive dimer-of-dimer state to a heterodimer active state (Fig. 6b). In the inactive dimer-of-dimer state, the cytosolic domain of DUOX1 is flexible and not primed for electron transfer. In addition, the potential O2 entering/H2O2 exiting path (P1) is embedded in a large enclosed cavity. In the active heterodimeric state, FBD and NBD of DUOX1 dock onto the TMD that rotates about six degrees away from the dimer-of-dimer interface, and the potential O2 entering/H2O2 exiting path (P1) is fully exposed to the extracellular solvent. In addition, the N-terminal loop and TM1 of DUOXA1 that play a key role in dimer-of-dimer formation become structurally less constrained. As DUOX1–DUOXA1 and DUOX2–DUOXA2 share high sequence and structural similarities, it is likely that such a regulation will also be relevant for the DUOX2-DUOXA2 complex. Indeed, an equilibrium between the DUOX2–DUOXA2 heterodimer and dimer of dimer has also been observed using fluorescence detection size exclusion chromatography (FSEC) (Extended Data Fig. 6c).
Although the question regarding what controls the transition between the DUOX1–DUOXA1 heterodimer and dimer of dimer remains to be answered, the observation that FAD and NADPH are both located at the interface between the TMD and the cytosolic domain (flexible in the dimer-of-dimer state) suggests that one or both of the two small molecules may function as “molecular glue” (Fig. 3d and Fig. 4a,c). Binding of FAD, NADPH or both could contribute to the docking of cytosolic domains onto TMDs of DUOX1 and facilitate the transition from dimer-of-dimer to heterodimeric state. Interestingly, the presence of excess NADPH largely increases the heterodimer to the dimer of dimers ratio on FSEC (Extended Data Fig. 6d), indicating that NADPH could potentially play a role in regulating equilibrium between different oligomerization states of DUOX1–DUOXA1.
DUOX1–DUOXA1 and DUOX2-DUOXA2 distinguish from the rest of NOXs (except NOX4), for DUOX-DUOXA complexes generate H2O2 instead of superoxide (O2−) at the apical surface of epithelial cells7. Compared with csNOX5, DUOX1–DUOXA1 has a similar electron transfer path, suggesting there are no significant differences during superoxide production. Therefore, it is likely that a dismutation reaction occurs in DUOX-DUOXA complexes to generate H2O2. My structural comparison revealed that heme #1 and the oxygen-reaction center of DUOX1–DUOXA1 are enclosed by the S1–S2, S3–S4 and S5–S6 linkers and thus have limited access to the extracellular space (Fig. 4d and Extended Data Fig. 3a,e). In contrast, the extracellular heme and oxygen-reaction center of csNOX5 are exposed (Extended Data Fig. 6f). Furthermore, the internal cavity formed by extracellular loops is highly positive-charged (Extended Data Fig. 6g), creating an environment that could hinder the release of O2− and facilitate dismutation reactions. The PHD could potentially contribute to the H2O2 production by stabilizing the S3–S4 linker through a disulfide bond and by maintaining the structural integrity of the internal cavity needed for the dismutation reaction. This is consistent with the previous observation that the proper modification and folding of PHD of DUOXs are important for specific production H2O217. The S1–S2 linker, a key structural determinant in the conversion of superoxide to H2O2, is located at the exit of the H2O2-exiting path (P1). It is plausible that the histidine-containing S1–S2 linker functions as a “gatekeeper” to tightly control H2O2 release, and perturbation of the S1–S2 linker leads to O2− leakage33.
In summary, I determined the cryo-EM structures of the DUOX1–DUOXA1 complex in three different states: an NADPH-free state, an NADPH-bound state and a dimer-of-dimer state. These structures uncovered the electron transfer path within an NADPH oxidase and revealed the structural mechanism underlying DUOX1–DUOXA1 regulation through protein oligomerization. Therefore, the work allows mechanistically interpretation of mutations in DUOX–DUOXA associated with diseases (Extended Data Fig. 6e) and provides a structural foundation for novel drug development strategies by manipulating the oligomerization state of the enzyme complex.
Online Methods
Cloning, expression and purification of mouse DUOX1–DUOXA1
cDNAs encoding mouse DUOX1 (Mus musculus: NP_001092767.1) and DUOXA1 (Mus musculus: NP_001292191.1) were purchased from Horizon Discovery. The N-terminal signal peptide DUOX1 (1–19) was truncated and replaced by an IL2 signal peptide linked GFP tag, and a preScission protease cleavage site was also engineered between GFP tag and DUOX136. DUOXA1 was cloned into a BacMam expression vector without any tags (Extended Data Fig.1a)37.
Recombinant baculoviruses of DUOX1 and DUOXA1 were generated separately using the Bac-to-Bac system according to the manufacturer’s instructions (Invitrogen). Then P3 virus mixture of DUOX1 and DUOXA1 (1:1) was used for transfection of HEK293S GnTI− cells for protein expression. Briefly, for 1L cultures of HEK293S GnTI− cells (~2–3×10⁶ cells/mL) in Freestyle 293 media (Gibco) supplemented with 2% FBS (Gibco), about 100 ml P3 virus mixture was used. Infected cells were incubated at 37°C overnight, and protein expression was induced by adding 10 mM sodium butyrate. Cells were cultured at 30°C for another 48–60 hrs before harvest37.
2L of cell pellet was resuspended in 50 ml lysis buffer (20 mM Tris pH8.0, 200 mM NaCl, 1 mM CaCl2, 2 μM leupeptin, 1 μM pepstatin, 100 μM PMSF and 1 μg/mL aprotinin), and then solubilized by adding 50 ml detergent mixture LMNG/CHS (8:1 mass ratio, 2% stock solubilized in 20 mM Tris pH8.0, 200 mM NaCl) to a final concentration of 1 % while stirring at 4°C for 2 hrs. Solubilized DUOX1–DUOXA1 was separated from the insoluble fraction by high-speed centrifugation (38,000g for 1 hr), and incubated with 2 ml CNBR-activated sepharose beads (GE healthcare) coupled with 2 mg high-affinity GFP nanobodies (GFP-NB)38. The GFP tag was cleaved by preScission protease overnight at 4°C, and DUOX1–DUOXA1 was further purified by size exclusion chromatography with a Superose 6, 10/300 GL column (GE Healthcare) equilibrated with 20 mM Tris pH8.0, 200 mM NaCl and 0.06% Digitonin. Fractions of the peak around 15 ml were pooled (Extended Data Fig.1A), concentrated to 10–12 mg/ml (OD280) using a 100-kDa MWCO centrifugal device (Ambion) and immediately used for cryo-EM grid preparation. 1 mM NADPH was added to the protein sample before freezing if needed.
Activity assay
The activity assay of DUOX1–DUOXA1 was carried out as previously described with some modification9,16,17. Briefly, 92 μl buffer containing 20 mM Tris pH8.0, 200 mM NaCl, 0.05% Digitonin, 0.5 mM CaCl2 was mixed 2 μl of horseradish peroxidase (HRP, stock concentration: 0.15 mg/ml), 2 μl scopoletin (stock concentration: 15 μM) and 2 μl of DUOX1–DUOXA1 protein (0.2 mg/ml) or buffer as negative control. The reaction was started by adding 2 ul NADPH (stock concentration: 5 mM). Scopoletin fluorescence decrease, which is coupled to H2O2 production, was monitor using a plate reader at excitation/emission wavelengths of 320 nm/420 nm for 30min. Cell-based activity assay was carried out as previously reported17 with some modification. Briefly, HEK293H cells, transiently transfected with wild-type or mutated DUOX1–DUOXA1 cDNA, were washed with DPBS and incubated for 1hr in 0.6 ml DPBS (with Mg2+ and Ca2+) with 0.3% glucose, 0.03 μg/ml HRP and scopoletin with or without 5 μM ionomycin. At the end of the incubation, 180 μl of the solution mixture was taken for fluorescence measurement.
FSEC analysis
For FSEC analysis, 6-well dished cultured HEK293 cells are transfected with 2 μg DNA with DUOX:DUOXA at 1:1 ratio using lipofectamine 3000. Cells were then transferred to 30°C incubator 8 hrs after transfection and incubated for another 48–72 hrs before harvested. Then DUOX1–DUOXA1 expressed cells were resuspended in 20 mM Tris pH8.0, 200 mM NaCl with protease inhibitors and solubilized for 1hr at 4°C using 1% GDN (Anatrace). NADPH or FAD was added before solubilization if needed. FSEC run was carried out using the mobile phase solution containing 20 mM Tris pH8.0, 200 mM NaCl and 0.004% LMNG/CHS (8:1 mass ratio).
Cryo-EM analysis
Cryo-EM grids were prepared with a Vitrobot Mark IV (FEI). Quantifoil R1.2/1.3 holey carbon gold grids were glow-discharged for 15s. Then 3.5 μL of 10–12 mg/ml protein sample was pipetted onto the grids, which were blotted for 3s under blot force −3 at 100% humidity and frozen in liquid nitrogen-cooled liquid ethane. The grids were loaded onto a 300 keV Titan Krios (FEI) with a K3 direct electron detector (Gatan) and an energy filter.
Images of all datasets were recorded with SerialEM39 in super-resolution mode with a super-resolution pixel size of 0.54 Å and a defocus range of −1.1 to −2.0 μm. Data without NADPH was collected with a dose rate of 1.09 e/Å2/frame, and images were recorded during a 3 s exposure with 50 ms subframes (60 total frames). The dataset with NADPH was collected with a dose rate of 1.15 e/Å2/frame, and images were recorded during a 4.9 s exposure with 70 ms subframes (70 total frames).
Super-resolution image stacks were gain-normalized40, binned by 2 with Fourier cropping, and corrected for beam-induced motion using MotionCor241. Contrast transfer function parameters were estimated from motion-corrected summed images without dose weighting using GCTF42. All subsequent processing was performed on motion-corrected summed images with dose weighting. About 5,000 particles were manually picked and processed with reference-free 2D classification in RELION to generate a template43 for auto-picking. Auto-picked particles were extracted in RELION44 and were further cleaned up by multiple rounds of 2D classification in cryoSPARC45.
For 3D reconstruction, ab initio reconstruction was carried out in cryoSPARC asking for three classes, which resulted in one DUOX1–DUOXA1 heterodimer class, one DUOX1–DUOXA1 dimer-of-dimer class and one “trash” class. Then multiple rounds of heterogenous refinement were carried out against these three classes to remove bad particles followed by CTF refinement and non-uniform refinement in cryoSPARC.
Model building and refinement
Models were built in Coot46. First, homology models of PHD and TMD of DUOX1 were generated using the I-TASSER server47,48 and docked into the cryo-EM map. From this starting point, manual rebuilding was carried out. The structural model was refined using phenix.real_space_refine49 with secondary structure restraints and Coot iteratively. Protein structure quality was monitored using the Molprobity server50. The possible oxygen entering and hydrogen peroxide exiting paths were calculated using Caver plugin in PyMOL32; the electron transfer path was predicted using Pathways plugin in VMD. Figures were prepared using PyMOL (The PyMOL Molecular Graphics System, Version 2.0 Schrödinger, LLC.) and UCSF Chimera51.
Further information on experimental design is available in the Nature Research Reporting Summary linked to this article.
Extended Data
Extended Data Fig. 1. Structure determination of the DUOX1–DUOXA1 complex.
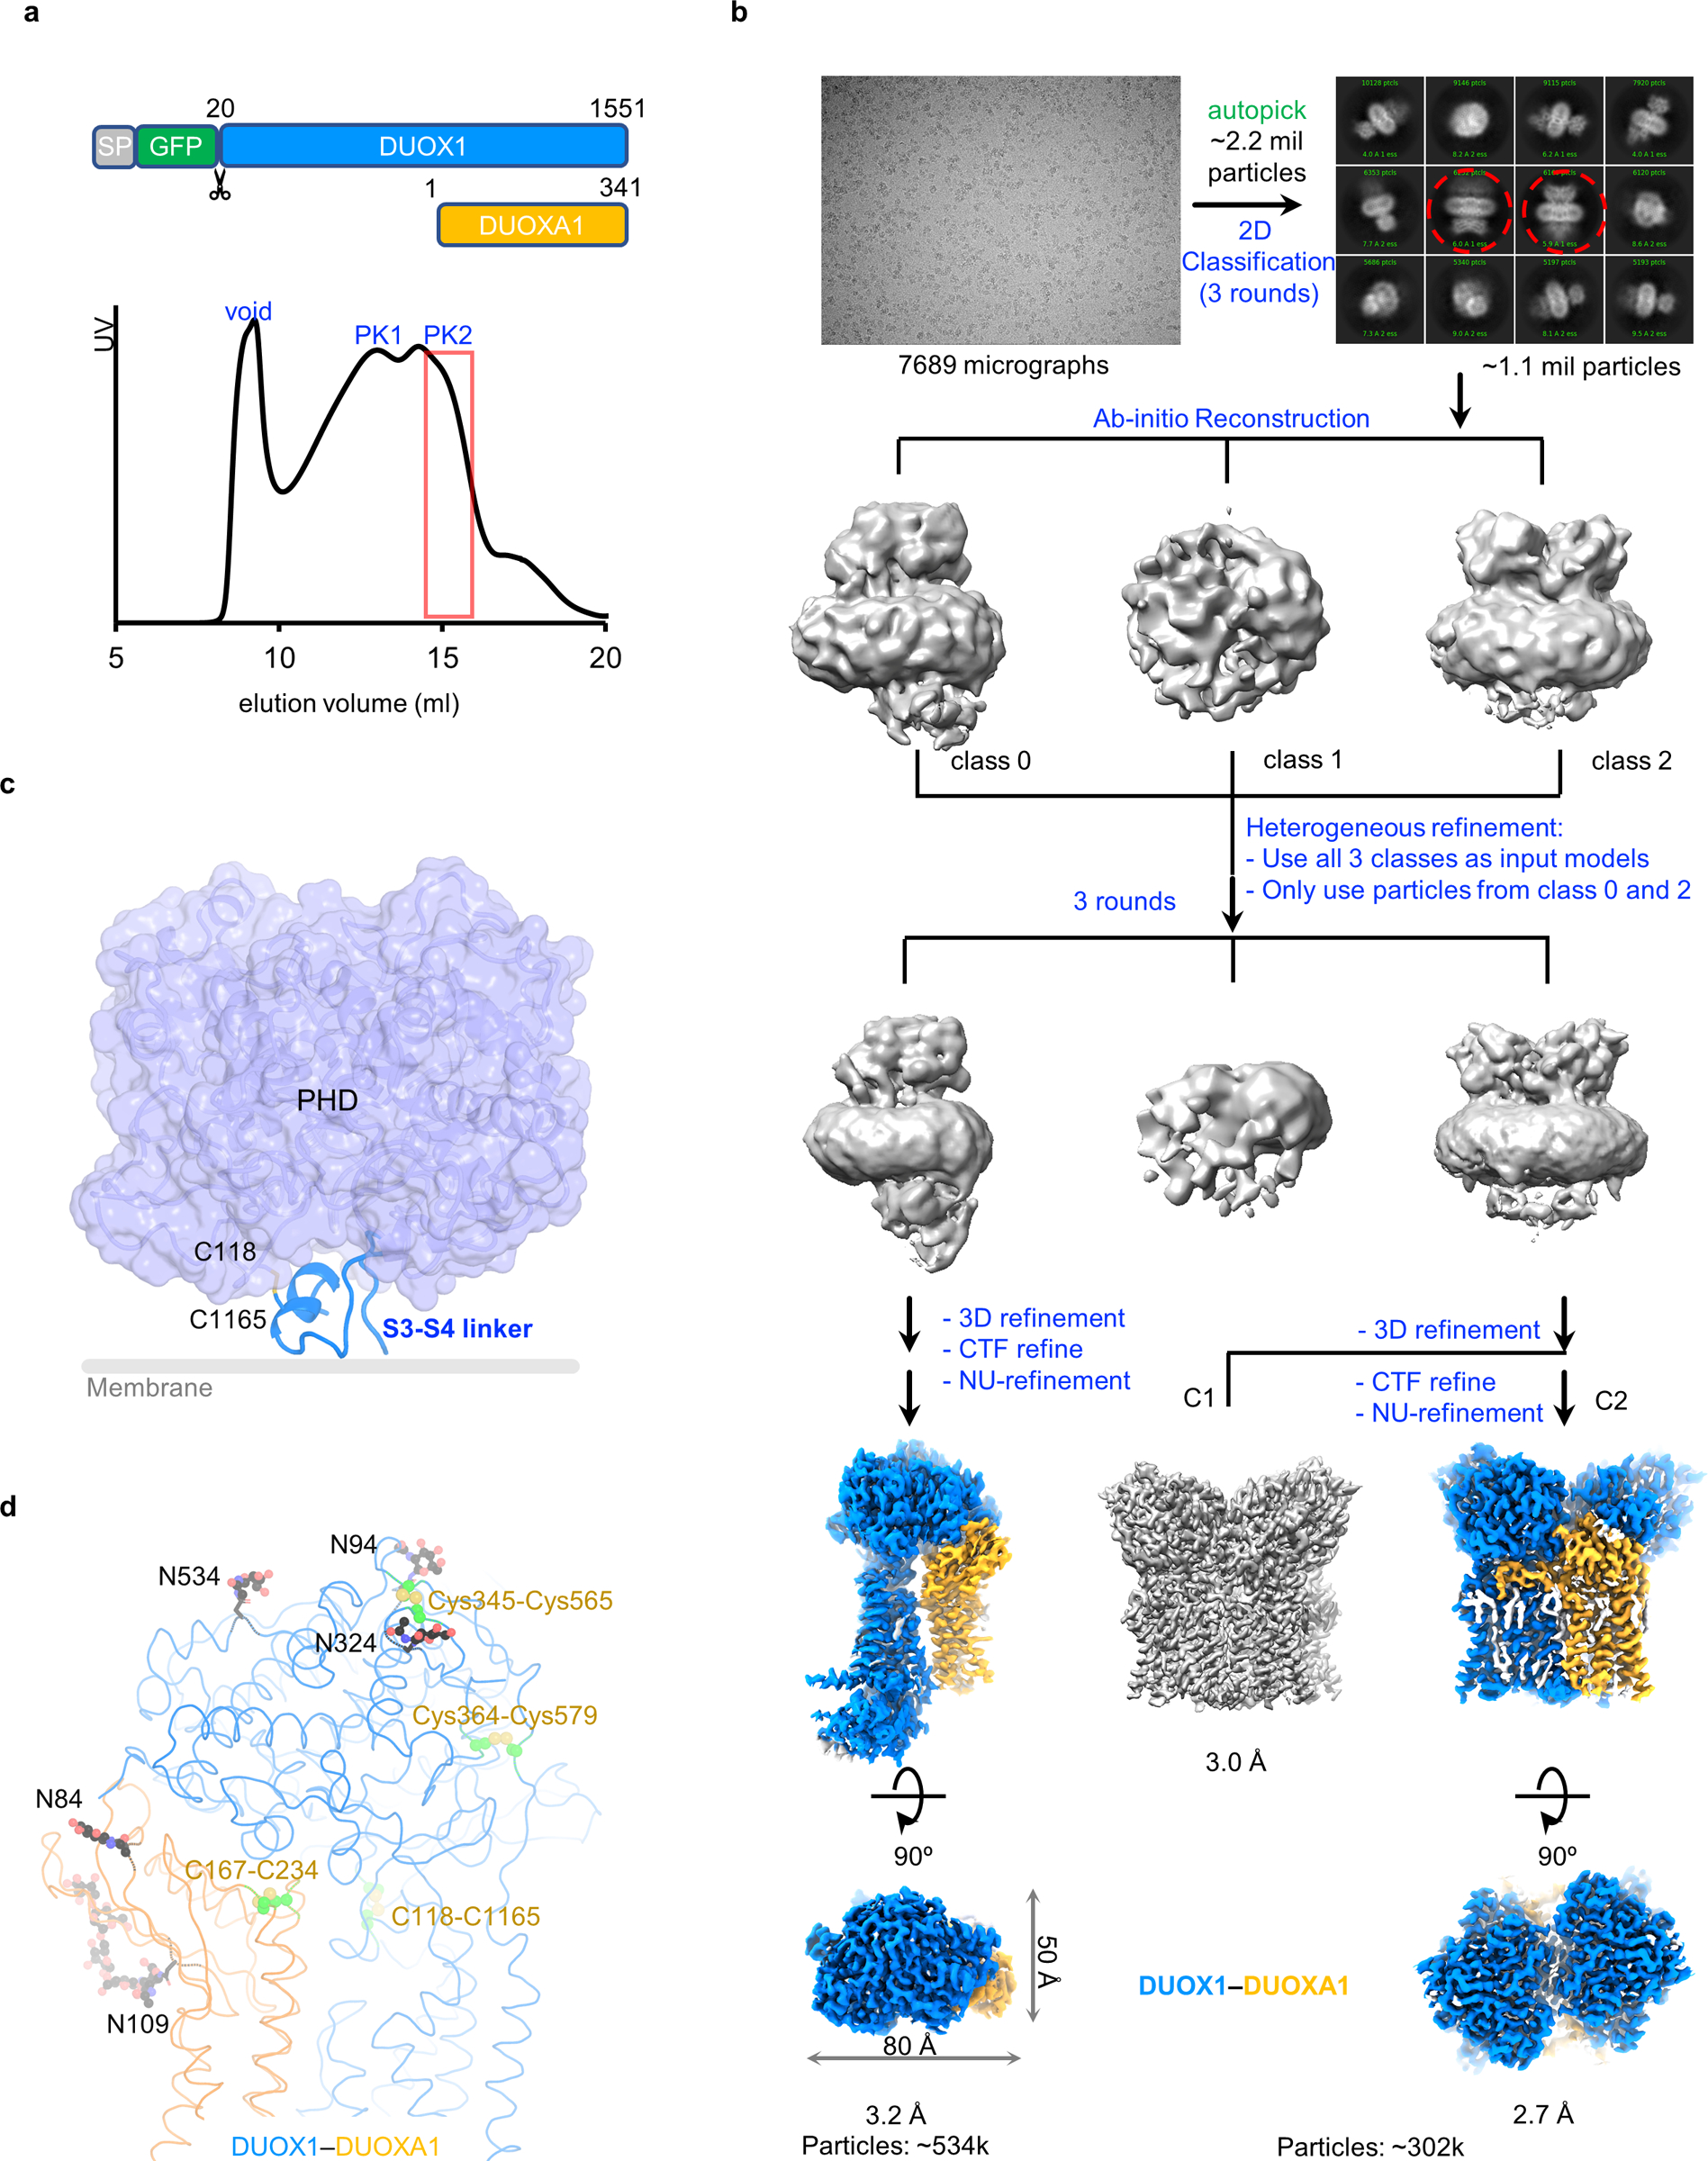
a, Construct design of DUOX1 and DUOXA1 used for structural studies and size exclusion chromatography profile of the DUOX1–DUOXA1 complex. Fractions of second peak (PK2) in the red box are concentrated and used for single-particle analysis. b, Flowchart of DUOX1–DUOXA1 structure determination. The steps in blue are carried out in cryoSPARC, ones in green in RELION. In the 2D classification, dimer-of-dimer classes are indicated by red dashed cycles. c, Interaction between the S3–S4 linker and PHD of DUOX1. The out leaflet of the membrane bilayer is indicated by a grey line. d, Disulfide bonds and glycosylation sites of the DUOX1–DUOXA1 complex. Sugars and their linked Asn side chains are shown as sticks and balls. Disulfide bonds are colored in green.
Extended Data Fig. 2. Structure of the PHD of DUOX1.
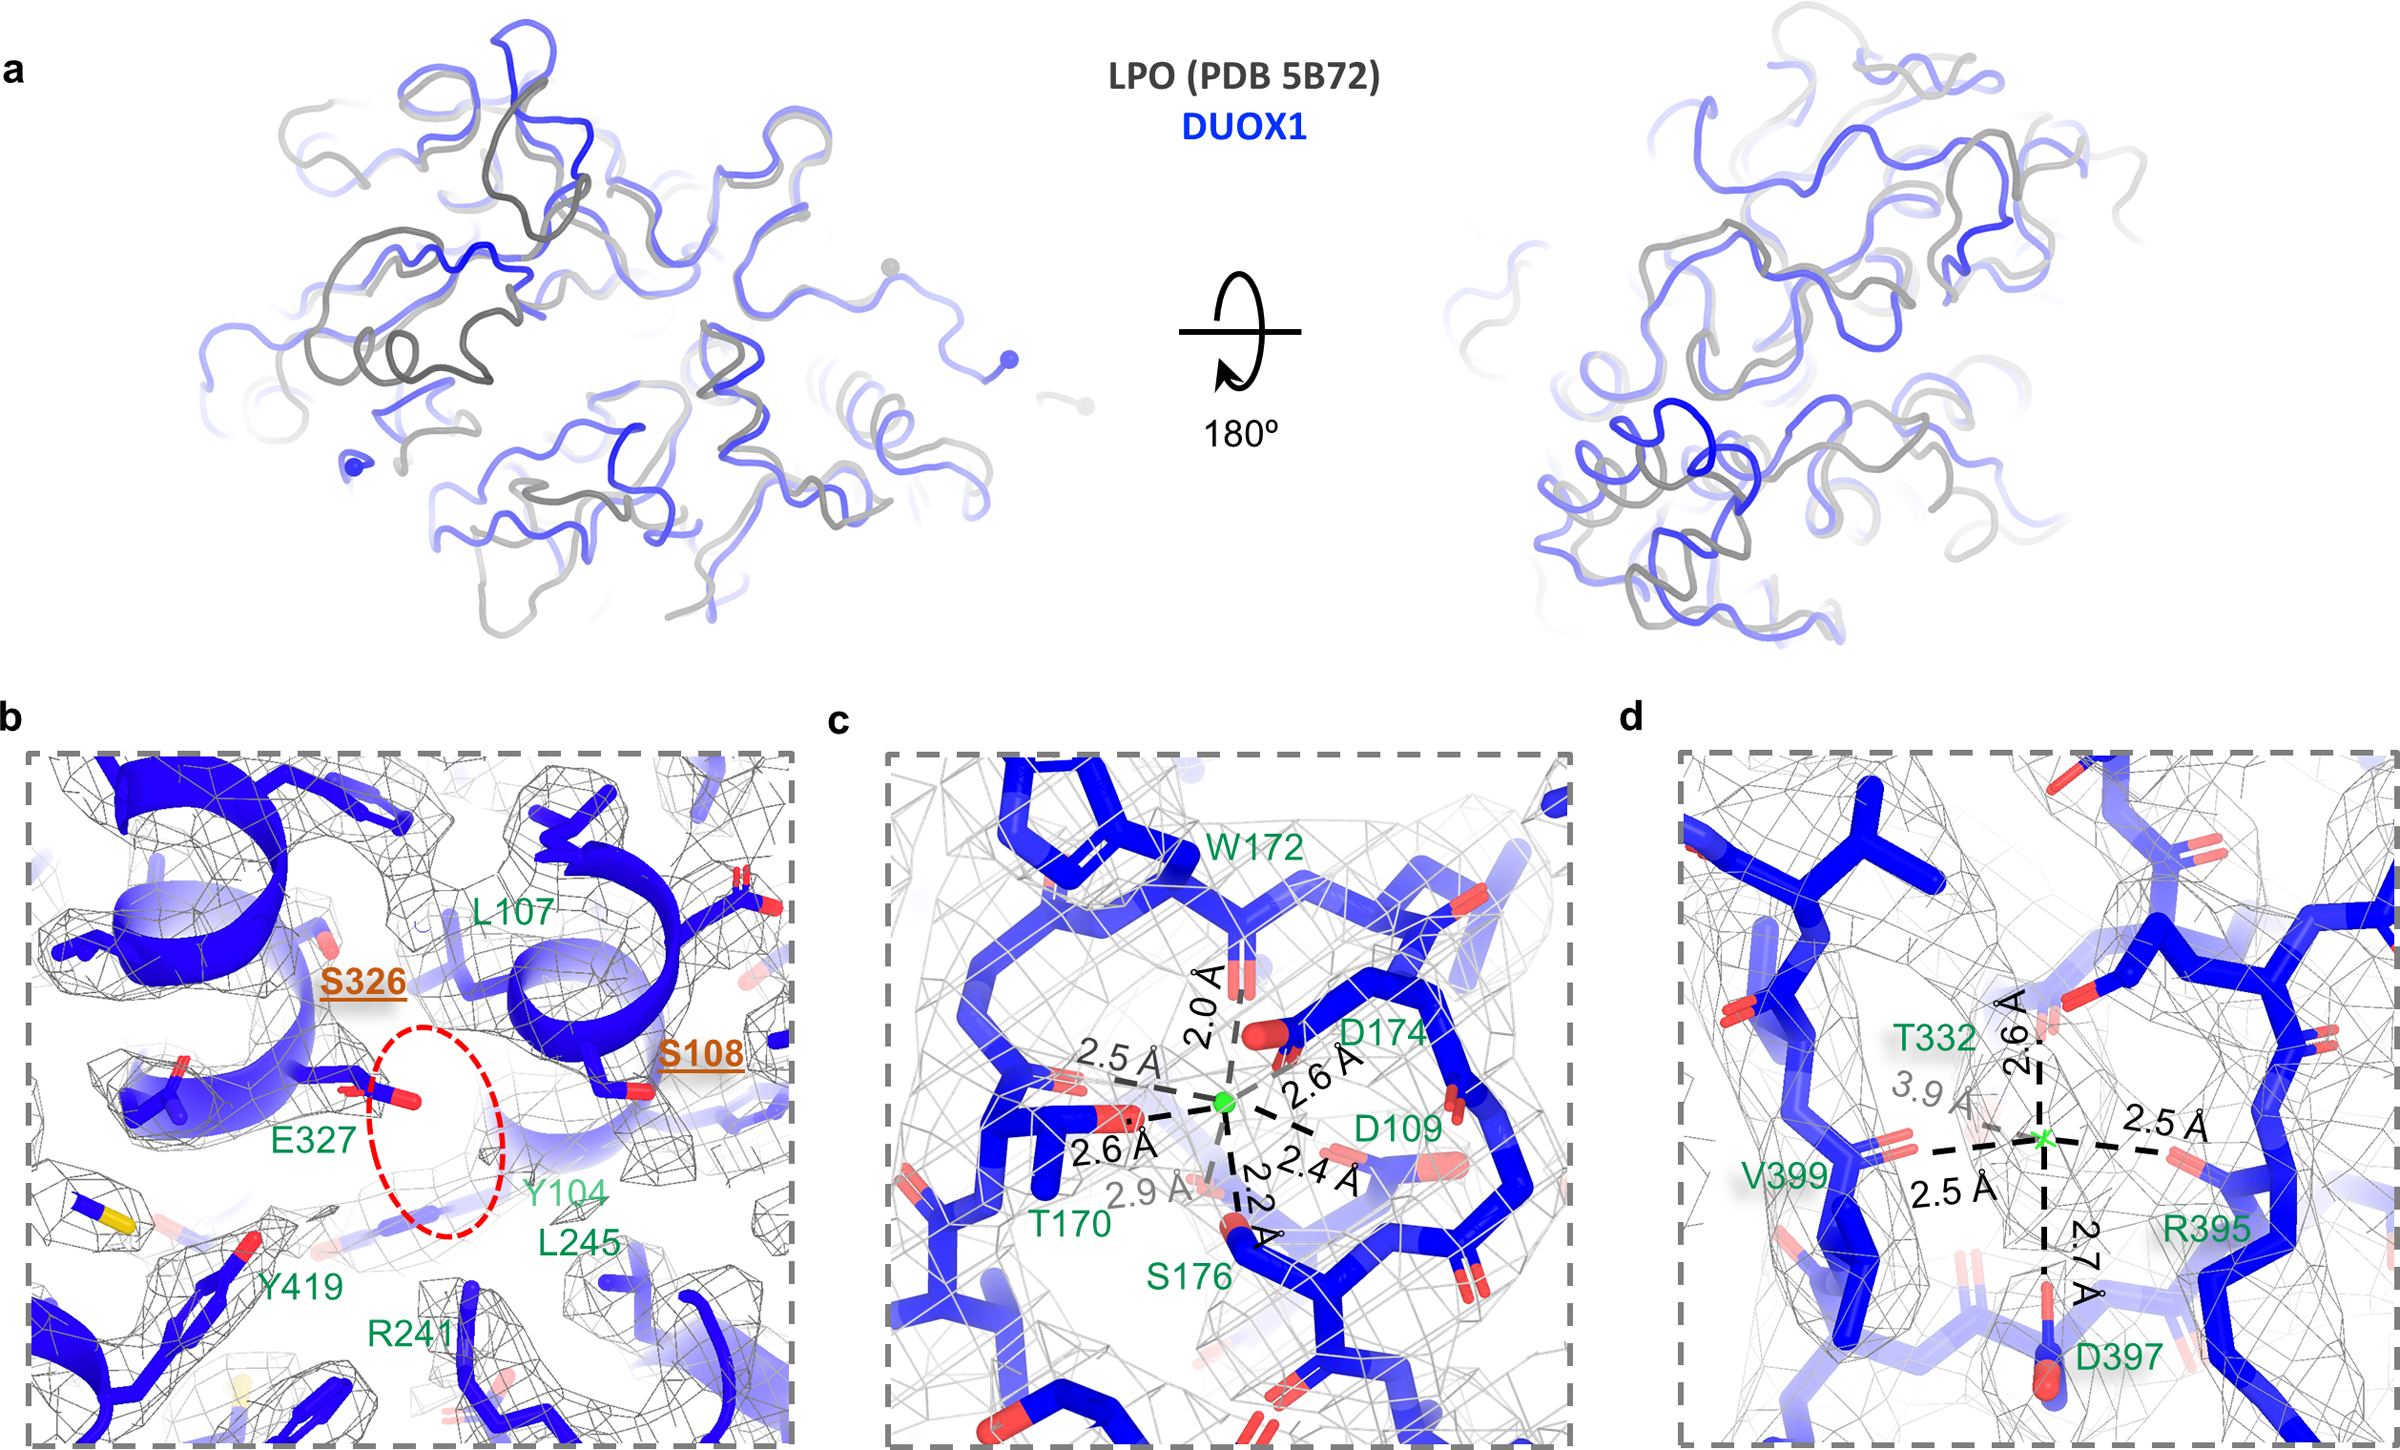
a, Superimposition between LPO and PHD of DUOX1. LPO and DUOX1 are colored in grey and blue, respectively. b, Putative heme-binding site. The possible heme-binding pocket indicated by a red oval. Positions of Ser326 and Ser108 (colored in brown) are where the heme-coordinating histidines are located. c, The putative calcium-binding site and surrounding residues. Calcium is indicated by a green sphere. d, A potential ion binding site and surrounding residues. Cryo-EM density is contoured by grey meshes.
Extended Data Fig. 3. Heme- and FAD-binding sites.
a, Structural comparison of heme-binding sites between DUOX1 (blue) and csNOX5 (grey). The transmembrane helices are labeled with S1–S6. b, Structural conservation of heme coordination in ferric oxidoreductases. DUOX1, csNOX5, Cyto b561 and Dcytb are colored in blue, grey, light blue and cyan, respectively. c, FAD-binding site in 2D representation. Hydrogen bonds, hydrophobic interactions and cation-π interactions are indicated by dashes, spokes and vertical dashes, respectively. Residues from FBD, NBD, TMD are colored in light pink, grey and blue, respectively. d, The putative oxygen-binding site. Oxygen is represented by a dashed red oval. e, The possible oxygen entering and hydrogen peroxide exiting paths.
Extended Data Fig. 4. NADPH-binding site.
a, Cryo-EM density of DUOX1–DUOXA1 with and without NADPH. The potential NADPH-binding site is indicated by red dashes. b, Structure of an NADPH molecule. c, The NADPH-binding site. Residues from TMD and NBD are colored in blue and grey, respectively. The “invisible” nicotinamide group is cycled in a cyan dashed oval. d, Cartoon and structure of the NADPH-binding site. The conserved glycines on the “GXGXG” motif are shown as magenta balls. e, The lipid-binding pocket of csNOX5 and DUOX1. Lipid or alkyl chains are colored in red. f, Functional analyses of F1097 mutations. F1097 is mutated to Tyr, Ala, Ile and Val, and the activity of the mutations are normalized to the wild-type protein (Data shown are mean and s.d. of n=4 independent experiments).
Extended Data Fig. 5. Formation of the dimer-of-dimer interface.
a–b, Structural comparison of DUOX1 and DUOXA1 in heterodimeric and dimer-of-dimer states. c, Interaction between DUOX1 and DUOXA1. Left: interactions between DUOX1 and the N-terminal loop and glycan chain linked to N109 of DUOXA1. Right: cryo-EM density and cartoon of the glycan chain on N109. d, Interactions between transmembrane domains of DUOX1 and DUOXA1 mediated by a lipid molecule. Left: interaction details. Right: density of the lipid molecule. e, PHD-PHD interactions in the dimer-of-dimer configuration. Left: interactions between PHDs of DUOX1. Right: comparison between MPO dimers and PHD dimers of DUOX1.
Extended Data Fig. 6. The interface between DUOX1–DUOXA1 heterodimers.
a, Modeling of two DUOX1–DUOXA1 dimers into the dimer-of-dimer state. Structural crashes are indicated by red arrows. b, The potential oxygen entering/hydrogen peroxide exiting paths in the DUOX1–DUOXA1 dimer of dimers. c, FSEC curves of mouse DUOX1–DUOXA1 (blue), human DUOX1–DUOXA1 (grey) and human DUOX2-DUOXA2 (orange). d, FSEC curves of mouse DUOX1–DUOXA1 (grey), mouse DUOX1–DUOXA1 with NADPH (green) and mouse DUOX1–DUOXA1 with FAD (orange). e, Modeling of DUOX2-DUOXA2 complex and mapping of the hypothyroidism disease mutations. f, Accessibility of the outer heme of csNOX5 to extracellular space. The heme molecule is colored in green, indicated by a red arrow. The csNOX5 is shown as grey surface. g, The positively charged environment surrounding the heme molecule (heme #1).
Supplementary Material
Acknowledgments
I thank members of Cryo-electron Microscopy and Tomography Center of St Jude Children’s Research Hospital for help with cryo-EM data collection, P. Hixson and R. Kalathur (Protein Technology Center) for help with mammalian cell culture, A. Myasnikov, M. Halic and C. Lee for helpful discussions, Z. Luo for help with bio-illustration and C. Kalodimos, M. Halic and M. Babu for critical reading of the manuscript. J. Sun is funded by NIH (HL143037) and American Lebanese Syrian Associated Charities (ALSAC).
Footnotes
Declaration of Interests
The author declares no conflict of interest.
Data availability.
Cryo-EM maps and atomic models for mouse DUOX1–DUOXA1 complexes have been deposited in EMDB and wwPDB with the following accession numbers: EMD-21962 and PDB 6WXR (apo state); EMD-21963 and PDB 6WXU (with NADPH); EMD-21964 and PDB 6WXV (dimer of dimers).
References
- 1.Devasagayam TP et al. Free radicals and antioxidants in human health: current status and future prospects. J Assoc Physicians India 52, 794–804 (2004). [PubMed] [Google Scholar]
- 2.Bedard K & Krause KH The NOX family of ROS-generating NADPH oxidases: physiology and pathophysiology. Physiol Rev 87, 245–313, doi: 10.1152/physrev.00044.2005 (2007). [DOI] [PubMed] [Google Scholar]
- 3.Vlahos R et al. Inhibition of Nox2 oxidase activity ameliorates influenza A virus-induced lung inflammation. PLoS Pathog 7, e1001271, doi: 10.1371/journal.ppat.1001271 (2011). [DOI] [PMC free article] [PubMed] [Google Scholar]
- 4.Khomich OA, Kochetkov SN, Bartosch B & Ivanov AV Redox Biology of Respiratory Viral Infections. Viruses 10, doi: 10.3390/v10080392 (2018). [DOI] [PMC free article] [PubMed] [Google Scholar]
- 5.Imai Y et al. Identification of oxidative stress and Toll-like receptor 4 signaling as a key pathway of acute lung injury. Cell 133, 235–249, doi: 10.1016/j.cell.2008.02.043 (2008). [DOI] [PMC free article] [PubMed] [Google Scholar]
- 6.De Deken X, Corvilain B, Dumont JE & Miot F Roles of DUOX-mediated hydrogen peroxide in metabolism, host defense, and signaling. Antioxid Redox Signal 20, 2776–2793, doi: 10.1089/ars.2013.5602 (2014). [DOI] [PubMed] [Google Scholar]
- 7.Brandes RP, Weissmann N & Schroder K Nox family NADPH oxidases: Molecular mechanisms of activation. Free Radic Biol Med 76, 208–226, doi: 10.1016/j.freeradbiomed.2014.07.046 (2014). [DOI] [PubMed] [Google Scholar]
- 8.Dupuy C et al. Purification of a novel flavoprotein involved in the thyroid NADPH oxidase. Cloning of the porcine and human cdnas. J Biol Chem 274, 37265–37269, doi: 10.1074/jbc.274.52.37265 (1999). [DOI] [PubMed] [Google Scholar]
- 9.Leseney AM et al. Biochemical characterization of a Ca2+/NAD(P)H-dependent H2O2 generator in human thyroid tissue. Biochimie 81, 373–380, doi: 10.1016/s0300-9084(99)80084-4 (1999). [DOI] [PubMed] [Google Scholar]
- 10.De Deken X et al. Cloning of two human thyroid cDNAs encoding new members of the NADPH oxidase family. J Biol Chem 275, 23227–23233, doi: 10.1074/jbc.M000916200 (2000). [DOI] [PubMed] [Google Scholar]
- 11.Ameziane-El-Hassani R, Schlumberger M & Dupuy C NADPH oxidases: new actors in thyroid cancer? Nat Rev Endocrinol 12, 485–494, doi: 10.1038/nrendo.2016.64 (2016). [DOI] [PubMed] [Google Scholar]
- 12.Boots AW et al. ATP-mediated activation of the NADPH oxidase DUOX1 mediates airway epithelial responses to bacterial stimuli. J Biol Chem 284, 17858–17867, doi: 10.1074/jbc.M809761200 (2009). [DOI] [PMC free article] [PubMed] [Google Scholar]
- 13.Koff JL, Shao MX, Ueki IF & Nadel JA Multiple TLRs activate EGFR via a signaling cascade to produce innate immune responses in airway epithelium. Am J Physiol Lung Cell Mol Physiol 294, L1068–1075, doi: 10.1152/ajplung.00025.2008 (2008). [DOI] [PubMed] [Google Scholar]
- 14.Grasberger H & Refetoff S Identification of the maturation factor for dual oxidase. Evolution of an eukaryotic operon equivalent. J Biol Chem 281, 18269–18272, doi: 10.1074/jbc.C600095200 (2006). [DOI] [PubMed] [Google Scholar]
- 15.Luxen S et al. Heterodimerization controls localization of Duox-DuoxA NADPH oxidases in airway cells. J Cell Sci 122, 1238–1247, doi: 10.1242/jcs.044123 (2009). [DOI] [PMC free article] [PubMed] [Google Scholar]
- 16.Korzeniowska A, Donko AP, Morand S & Leto TL Functional Characterization of DUOX Enzymes in Reconstituted Cell Models. Methods Mol Biol 1982, 173–190, doi: 10.1007/978-1-4939-9424-3_11 (2019). [DOI] [PubMed] [Google Scholar]
- 17.Ameziane-El-Hassani R et al. Dual oxidase-2 has an intrinsic Ca2+-dependent H2O2-generating activity. J Biol Chem 280, 30046–30054, doi: 10.1074/jbc.M500516200 (2005). [DOI] [PubMed] [Google Scholar]
- 18.Rigutto S et al. Activation of dual oxidases Duox1 and Duox2: differential regulation mediated by camp-dependent protein kinase and protein kinase C-dependent phosphorylation. J Biol Chem 284, 6725–6734, doi: 10.1074/jbc.M806893200 (2009). [DOI] [PMC free article] [PubMed] [Google Scholar]
- 19.Deme D, Virion A, Hammou NA & Pommier J NADPH-dependent generation of H2O2 in a thyroid particulate fraction requires Ca2+. FEBS Lett 186, 107–110, doi: 10.1016/0014-5793(85)81349-1 (1985). [DOI] [PubMed] [Google Scholar]
- 20.Meitzler JL, Hinde S, Banfi B, Nauseef WM & Ortiz de Montellano PR Conserved cysteine residues provide a protein-protein interaction surface in dual oxidase (DUOX) proteins. J Biol Chem 288, 7147–7157, doi: 10.1074/jbc.M112.414797 (2013). [DOI] [PMC free article] [PubMed] [Google Scholar]
- 21.Singh PK et al. Structure of bovine lactoperoxidase with a partially linked heme moiety at 1.98A resolution. Biochim Biophys Acta Proteins Proteom 1865, 329–335, doi: 10.1016/j.bbapap.2016.12.006 (2017). [DOI] [PubMed] [Google Scholar]
- 22.Meitzler JL & Ortiz de Montellano PR Caenorhabditis elegans and human dual oxidase 1 (DUOX1) “peroxidase” domains: insights into heme binding and catalytic activity. J Biol Chem 284, 18634–18643, doi: 10.1074/jbc.M109.013581 (2009). [DOI] [PMC free article] [PubMed] [Google Scholar]
- 23.Magnani F et al. Crystal structures and atomic model of NADPH oxidase. Proc Natl Acad Sci U S A 114, 6764–6769, doi: 10.1073/pnas.1702293114 (2017). [DOI] [PMC free article] [PubMed] [Google Scholar]
- 24.Varela V et al. Three mutations (p.Q36H, p.G418fsX482, and g.IVS19–2A>C) in the dual oxidase 2 gene responsible for congenital goiter and iodide organification defect. Clin Chem 52, 182–191, doi: 10.1373/clinchem.2005.058321 (2006). [DOI] [PubMed] [Google Scholar]
- 25.Carre A et al. When an Intramolecular Disulfide Bridge Governs the Interaction of DUOX2 with Its Partner DUOXA2. Antioxid Redox Signal 23, 724–733, doi: 10.1089/ars.2015.6265 (2015). [DOI] [PMC free article] [PubMed] [Google Scholar]
- 26.Louzada RA et al. Conformation of the N-Terminal Ectodomain Elicits Different Effects on DUOX Function: A Potential Impact on Congenital Hypothyroidism Caused by a H2O2 Production Defect. Thyroid 28, 1052–1062, doi: 10.1089/thy.2017.0596 (2018). [DOI] [PubMed] [Google Scholar]
- 27.Ganasen M et al. Structural basis for promotion of duodenal iron absorption by enteric ferric reductase with ascorbate. Commun Biol 1, 120, doi: 10.1038/s42003-018-0121-8 (2018). [DOI] [PMC free article] [PubMed] [Google Scholar]
- 28.Lu P et al. Structure and mechanism of a eukaryotic transmembrane ascorbate-dependent oxidoreductase. Proc Natl Acad Sci U S A 111, 1813–1818, doi: 10.1073/pnas.1323931111 (2014). [DOI] [PMC free article] [PubMed] [Google Scholar]
- 29.Hanukoglu I Proteopedia: Rossmann fold: A beta-alpha-beta fold at dinucleotide binding sites. Biochem Mol Biol Educ 43, 206–209, doi: 10.1002/bmb.20849 (2015). [DOI] [PubMed] [Google Scholar]
- 30.Balabin IA, Hu X & Beratan DN Exploring biological electron transfer pathway dynamics with the Pathways plugin for VMD. J Comput Chem 33, 906–910, doi: 10.1002/jcc.22927 (2012). [DOI] [PMC free article] [PubMed] [Google Scholar]
- 31.Beratan DN, Betts JN & Onuchic JN Protein electron transfer rates set by the bridging secondary and tertiary structure. Science 252, 1285–1288, doi: 10.1126/science.1656523 (1991). [DOI] [PubMed] [Google Scholar]
- 32.Chovancova E et al. CAVER 3.0: a tool for the analysis of transport pathways in dynamic protein structures. PLoS Comput Biol 8, e1002708, doi: 10.1371/journal.pcbi.1002708 (2012). [DOI] [PMC free article] [PubMed] [Google Scholar]
- 33.Ueyama T et al. The extracellular A-loop of dual oxidases affects the specificity of reactive oxygen species release. J Biol Chem 290, 6495–6506, doi: 10.1074/jbc.M114.592717 (2015). [DOI] [PMC free article] [PubMed] [Google Scholar]
- 34.Zeng J & Fenna RE X-ray crystal structure of canine myeloperoxidase at 3 A resolution. J Mol Biol 226, 185–207, doi: 10.1016/0022-2836(92)90133-5 (1992). [DOI] [PubMed] [Google Scholar]
- 35.Jurrus E et al. Improvements to the APBS biomolecular solvation software suite. Protein Sci 27, 112–128, doi: 10.1002/pro.3280 (2018). [DOI] [PMC free article] [PubMed] [Google Scholar]
- 36.Sun J & MacKinnon R Structural Basis of Human KCNQ1 Modulation and Gating. Cell 180, 340–347 e349, doi: 10.1016/j.cell.2019.12.003 (2020). [DOI] [PMC free article] [PubMed] [Google Scholar]
- 37.Goehring A et al. Screening and large-scale expression of membrane proteins in mammalian cells for structural studies. Nat Protoc 9, 2574–2585, doi: 10.1038/nprot.2014.173 (2014). [DOI] [PMC free article] [PubMed] [Google Scholar]
- 38.Kirchhofer A et al. Modulation of protein properties in living cells using nanobodies. Nat Struct Mol Biol 17, 133–138, doi: 10.1038/nsmb.1727 (2010). [DOI] [PubMed] [Google Scholar]
- 39.Mastronarde DN Automated electron microscope tomography using robust prediction of specimen movements. J Struct Biol 152, 36–51, doi: 10.1016/j.jsb.2005.07.007 (2005). [DOI] [PubMed] [Google Scholar]
- 40.Tang G et al. EMAN2: an extensible image processing suite for electron microscopy. J Struct Biol 157, 38–46, doi: 10.1016/j.jsb.2006.05.009 (2007). [DOI] [PubMed] [Google Scholar]
- 41.Zheng SQ et al. MotionCor2: anisotropic correction of beam-induced motion for improved cryo-electron microscopy. Nat Methods 14, 331–332, doi: 10.1038/nmeth.4193 (2017). [DOI] [PMC free article] [PubMed] [Google Scholar]
- 42.Zhang K Gctf: Real-time CTF determination and correction. J Struct Biol 193, 1–12, doi: 10.1016/j.jsb.2015.11.003 (2016). [DOI] [PMC free article] [PubMed] [Google Scholar]
- 43.Zivanov J et al. New tools for automated high-resolution cryo-EM structure determination in RELION-3. Elife 7, doi: 10.7554/eLife.42166 (2018). [DOI] [PMC free article] [PubMed] [Google Scholar]
- 44.Scheres SH RELION: implementation of a Bayesian approach to cryo-EM structure determination. J Struct Biol 180, 519–530, doi: 10.1016/j.jsb.2012.09.006 (2012). [DOI] [PMC free article] [PubMed] [Google Scholar]
- 45.Punjani A, Rubinstein JL, Fleet DJ & Brubaker MA cryoSPARC: algorithms for rapid unsupervised cryo-EM structure determination. Nat Methods 14, 290–296, doi: 10.1038/nmeth.4169 (2017). [DOI] [PubMed] [Google Scholar]
- 46.Emsley P, Lohkamp B, Scott WG & Cowtan K Features and development of Coot. Acta Crystallogr D Biol Crystallogr 66, 486–501, doi: 10.1107/S0907444910007493 (2010). [DOI] [PMC free article] [PubMed] [Google Scholar]
- 47.Yang J et al. The I-TASSER Suite: protein structure and function prediction. Nat Methods 12, 7–8, doi: 10.1038/nmeth.3213 (2015). [DOI] [PMC free article] [PubMed] [Google Scholar]
- 48.Yang J & Zhang Y I-TASSER server: new development for protein structure and function predictions. Nucleic Acids Res 43, W174–181, doi: 10.1093/nar/gkv342 (2015). [DOI] [PMC free article] [PubMed] [Google Scholar]
- 49.Afonine PV, Grosse-Kunstleve RW, Adams PD & Urzhumtsev A Bulk-solvent and overall scaling revisited: faster calculations, improved results. Acta Crystallogr D Biol Crystallogr 69, 625–634, doi: 10.1107/S0907444913000462 (2013). [DOI] [PMC free article] [PubMed] [Google Scholar]
- 50.Chen VB et al. MolProbity: all-atom structure validation for macromolecular crystallography. Acta Crystallogr D Biol Crystallogr 66, 12–21, doi: 10.1107/S0907444909042073 (2010). [DOI] [PMC free article] [PubMed] [Google Scholar]
- 51.Pettersen EF et al. UCSF Chimera--a visualization system for exploratory research and analysis. J Comput Chem 25, 1605–1612, doi: 10.1002/jcc.20084 (2004). [DOI] [PubMed] [Google Scholar]
Associated Data
This section collects any data citations, data availability statements, or supplementary materials included in this article.